50 Shades of Pay - Creative Circle Mediasnpa.static2.adqic.com/static/JimMoroney.pdf · 50 Shades...
52
50 Shades of Pay The case for revenue diversification beyond digital advertising and digital subscriptions
-
Upload
truongthuy -
Category
Documents
-
view
215 -
download
2
Transcript of 50 Shades of Pay - Creative Circle Mediasnpa.static2.adqic.com/static/JimMoroney.pdf · 50 Shades...
50 Shades of Pay
The case for revenue diversification beyond digital
advertising and digital subscriptions
2
The Problem
3

“Fully two-thirds of the print advertising at the
nation’s newspapers has dried up
4
since hitting a
record high of $47.4 billion in 2005.” Alan D. Mutter
Reflections of a Newsroom

5
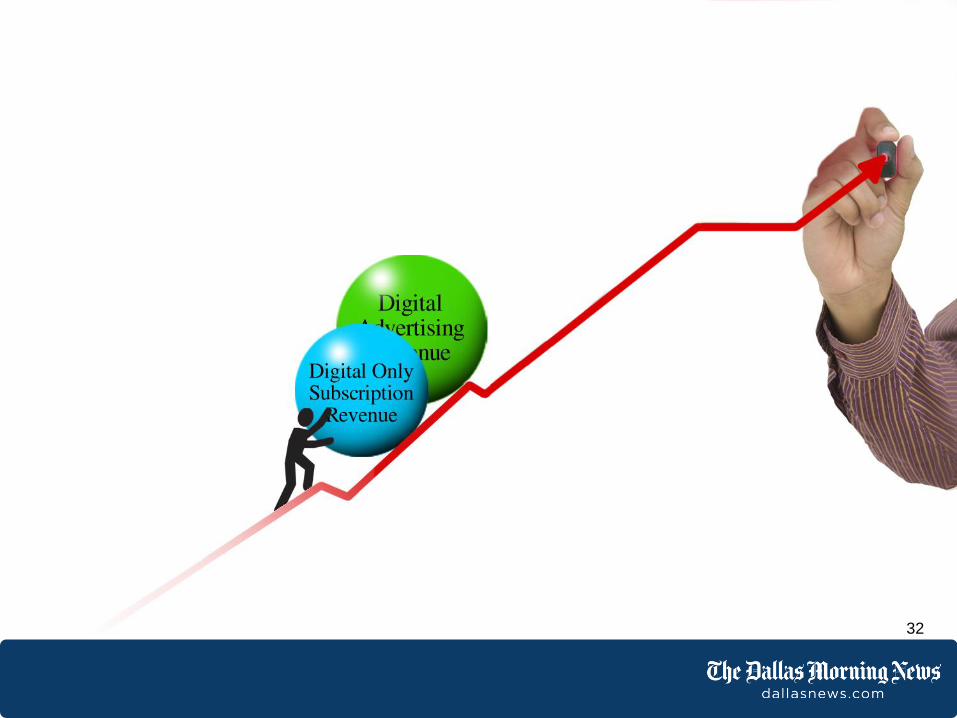
Digital Advertising
+Digital-Only
Subscriptions
Not enough!

The solution to the
U.S. newspaper
industry business
model problem
is easy:
Restart sustainable
year-over-year
revenue growth.2007 2008 2009 2010 2011 2012 2013 2014 2015 2016 2017 2018 2019$
Re
ve
nu
e
6

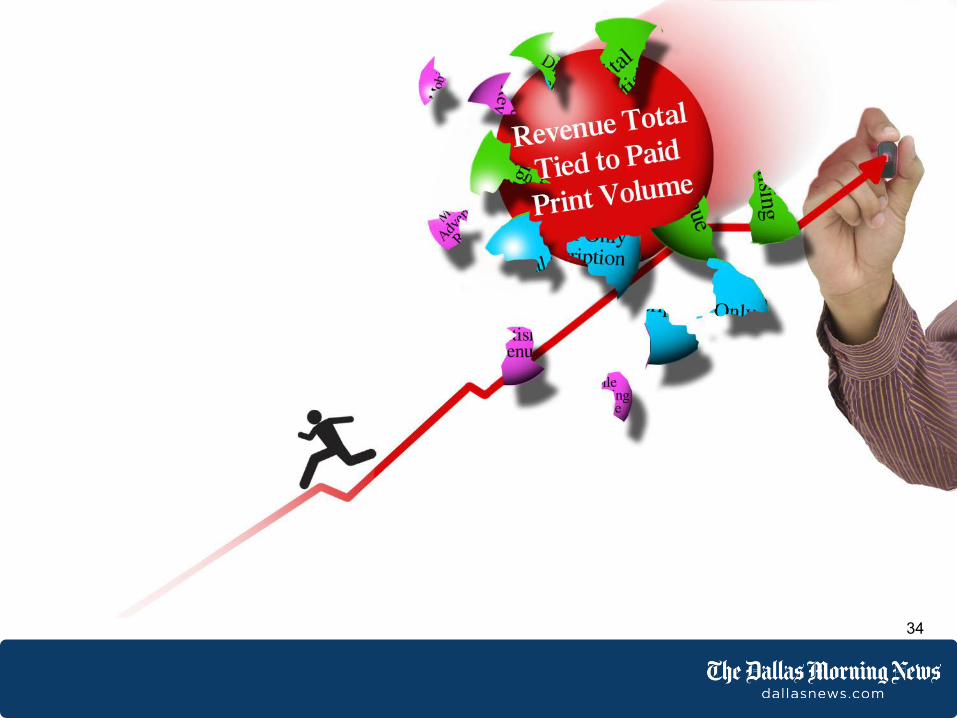
HOW to restart
sustainable
revenue growth
is the industry
conundrum.
2007 2008 2009 2010 2011 2012 2013 2014 2015 2016 2017 2018 2019$
Re
ve
nu
e ?
7

This much we know:
You cannot cut your
way to sustainable
profitability.
8

What not to do…
9
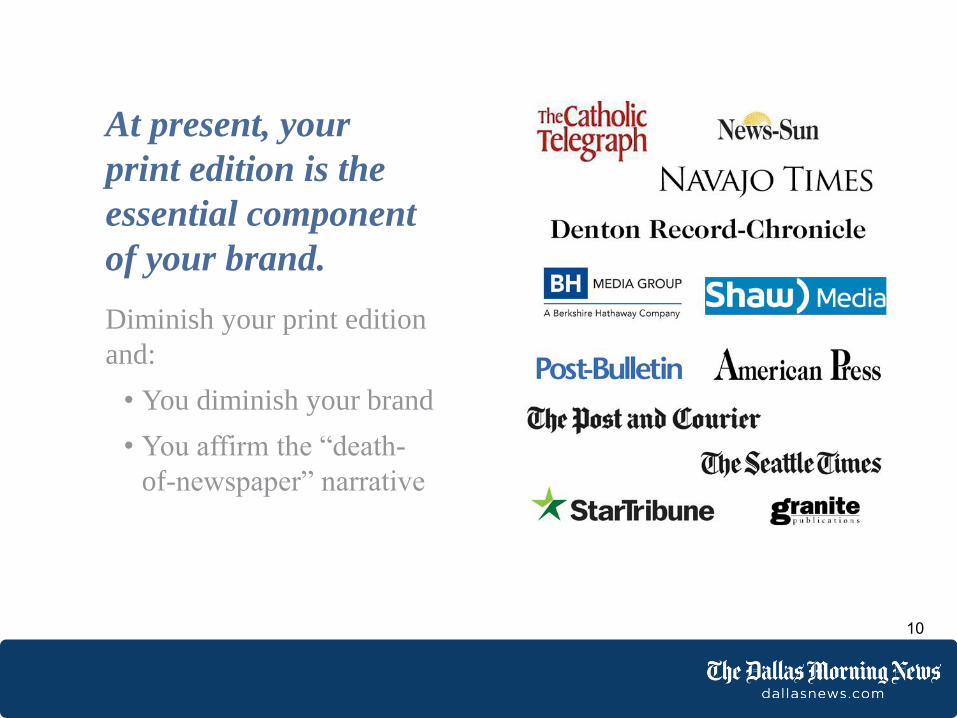
At present, your
print edition is the
essential component
of your brand.
Diminish your print edition
and:
• You diminish your brand
• You affirm the “death-
of-newspaper” narrative
10

Ask your CFO:
“Where is the value of my
brand calculated on that
spreadsheet?”
11

“We do not believe that success will
come from cutting either the news
content or frequency of publication.”
Warren Buffett
12

The Research
13

112 newspapers
responded to
the survey.
14
4%
8%
14%
15%
59%
200,000+
100-200,000
50-100,000
20-50,000
Less than 20,000
0% 10% 20% 30% 40% 50% 60% 70%
What is your circulation?

15
6%
23%
29%
42%
UP
-20%+
-11-20%
-0-10%
0% 10% 20% 30% 40% 50%
Paid print
circulation
is in
decline.
What is the percentage change in
your paid print circulation from 2008-2014?
94%

16
7%
9%
6%
19%
31%
30%
40-49%
50-59%
60-69%
70-79%
80-89%
90-100%
0% 5% 10% 15% 20% 25% 30% 35%
Paid print
circulation
still drives
advertising
revenue.
What percent of your advertising revenue
is related to paid print circulation?
80%
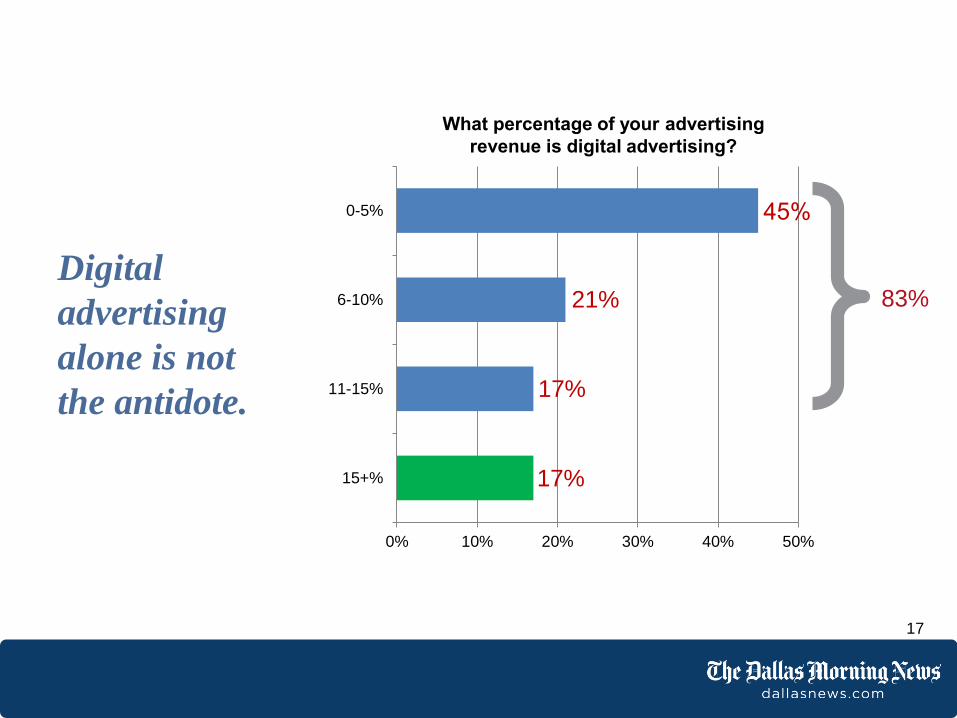
17%
17%
21%
45%
15+%
11-15%
6-10%
0-5%
0% 10% 20% 30% 40% 50%
Digital
advertising
alone is not
the antidote.
17
What percentage of your advertising
revenue is digital advertising?
83%
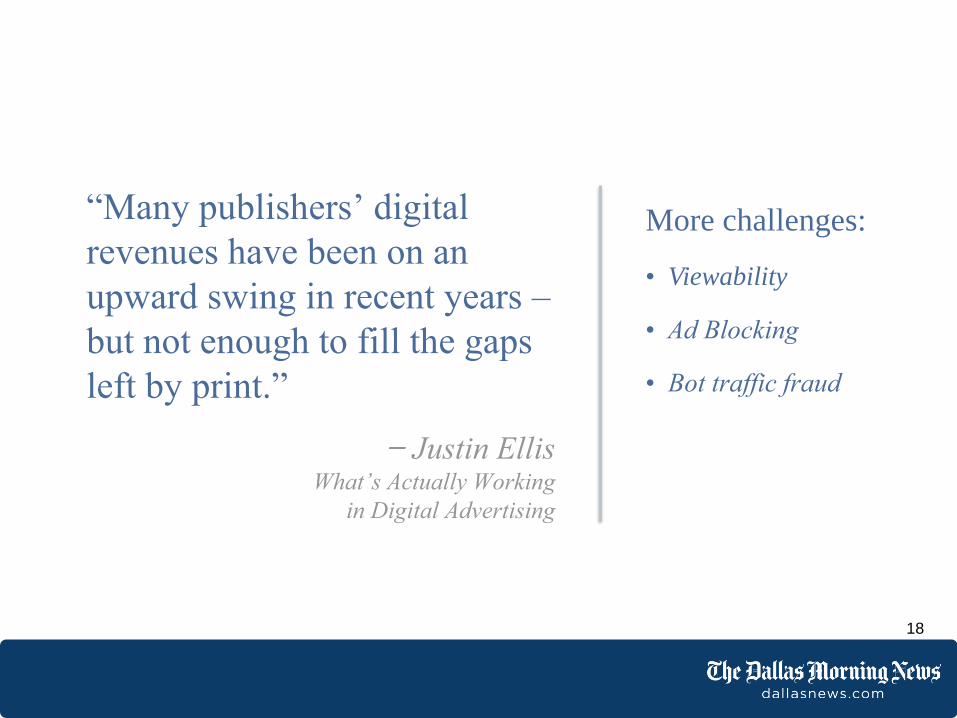
“Many publishers’ digital
revenues have been on an
upward swing in recent years –
but not enough to fill the gaps
left by print.”
Justin EllisWhat’s Actually Working
in Digital Advertising
18
More challenges:
• Viewability
• Ad Blocking
• Bot traffic fraud

$3M in digital advertising = 15%: +10% growth per year
$20M in print advertising = 85%: -5.0% decline per year
19
The “big number – small number” problem:
-$1.0M-$1.95M
-$2.86M
-$3.71M
-$4.53M
-$5.3M
$0.3M $0.63M $0.99M
$1.39M $1.83M
$2.3M
-$6
-$5
-$4
-$3
-$2
-$1
$0
$1
$2
$3
2015 2016 2017 2018 2019 2020
Mil
lio
ns
By 2020, total
print ad
revenue will
have declined
by $5.3M,
while total
digital ad
revenue will
have increased
by $2.3M.

20
$23M
$20M
Total Revenue
2015
2020

21
10 years later!
Annual Digital ad revenue growth exceeds
annual print ad revenue decline …
Your total ad revenue (digital growth - print decline)
will be 20% lower.

Print/Digital @85%/15%
Digital Ad Revenue CAGRP
rin
t A
d R
even
ue
CA
GR
Print/Digital @85%/15%
Digital Ad Revenue CAGR
5% 10% 15% 20%
Pri
nt
Ad
Rev
enu
e C
AG
R
-5%
-6%
-7%
-8%
-9%
-10%
-11%
-12%
-13%
-14%
-15%
Print/Digital @85%/15%
Digital Ad Revenue CAGR
5% 10% 15% 20%
Pri
nt
Ad
Rev
enu
e C
AG
R
-5% Year 18
-6%
-7%
-8%
-9%
-10%
-11%
-12%
-13%
-14%
-15%
Print/Digital @85%/15%
Digital Ad Revenue CAGR
5% 10% 15% 20%
Pri
nt
Ad
Rev
enu
e C
AG
R
-5% Year 18 Year 8
-6%
-7%
-8%
-9%
-10%
-11%
-12%
-13%
-14%
-15%
Print/Digital @85%/15%
Digital Ad Revenue CAGR
5% 10% 15% 20%
Pri
nt
Ad
Rev
enu
e C
AG
R
-5% Year 18 Year 12 Year 10 Year 8
-6% Year 16 Year 12 Year 9 Year 8
-7% Year 15 Year 11 Year 9 Year 7
-8% Year 14 Year 10 Year 8 Year 7
-9% Year 13 Year 10 Year 8 Year 7
-10% Year 12 Year 9 Year 8 Year 7
-11% Year 11 Year 9 Year 7 Year 6
-12% Year 10 Year 8 Year 7 Year 6
-13% Year 10 Year 8 Year 7 Year 6
-14% Year 9 Year 8 Year 6 Year 6
-15% Year 9 Year 7 Year 6 Year 6
22
Digital Growth/Print DeclineBreak-Even Analysis

23
Digital Growth/Print DeclineBreak-Even Analysis
Print/Digital @90%/10%
Digital Ad Revenue CAGR
5% 10% 15% 20%
Pri
nt
Ad
Rev
enu
e C
AG
R
-5% Year 22 Year 15 Year 12 Year 10
-6% Year 20 Year 14 Year 11 Year 8
-7% Year 19 Year 14 Year 11 Year 8
-8% Year 17 Year 13 Year 10 Year 8
-9% Year 16 Year 12 Year 10 Year 8
-10% Year 15 Year 11 Year 9 Year 8
-11% Year 14 Year 11 Year 9 Year 8
-12% Year 12 Year 10 Year 9 Year 8
-13% Year 12 Year 10 Year 8 Year 7
-14% Year 12 Year 9 Year 8 Year 7
-15% Year 11 Year 9 Year 8 Year 7
24
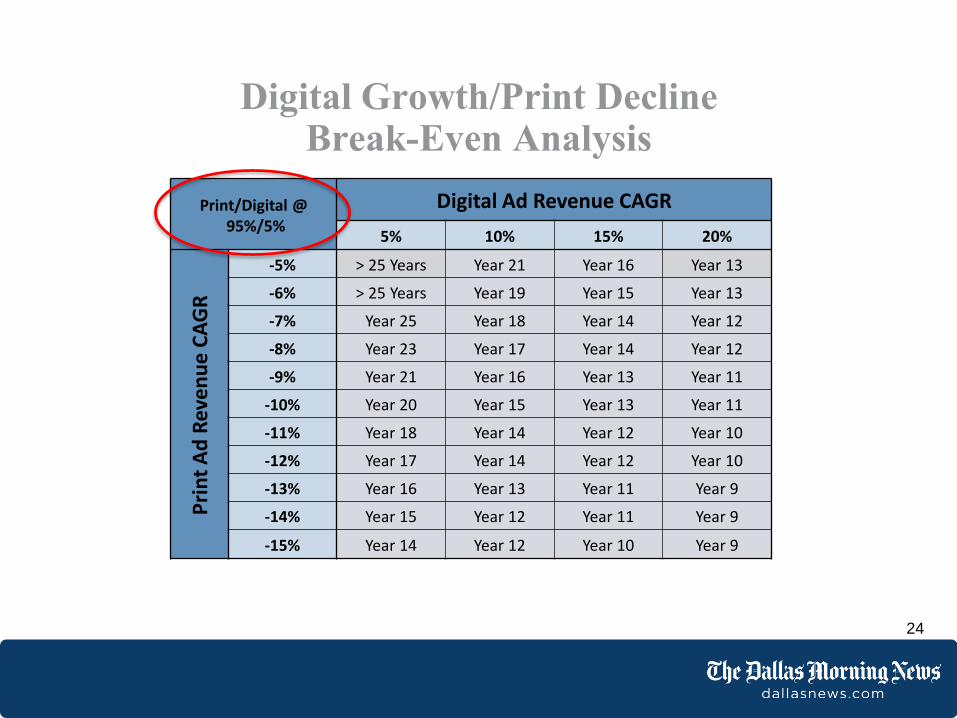
Digital Growth/Print DeclineBreak-Even Analysis
Print/Digital @95%/5%
Digital Ad Revenue CAGR
5% 10% 15% 20%
Pri
nt
Ad
Rev
enu
e C
AG
R
-5% > 25 Years Year 21 Year 16 Year 13
-6% > 25 Years Year 19 Year 15 Year 13
-7% Year 25 Year 18 Year 14 Year 12
-8% Year 23 Year 17 Year 14 Year 12
-9% Year 21 Year 16 Year 13 Year 11
-10% Year 20 Year 15 Year 13 Year 11
-11% Year 18 Year 14 Year 12 Year 10
-12% Year 17 Year 14 Year 12 Year 10
-13% Year 16 Year 13 Year 11 Year 9
-14% Year 15 Year 12 Year 11 Year 9
-15% Year 14 Year 12 Year 10 Year 9

19%
43%
20%
2%
16%
0%
1-5%
6-10%
11-15%
15+%
0% 10% 20% 30% 40% 50%
25
Digital-only
subscriptions
do not appear
to be a
sufficient
answer either.
84%
What is the number of your digital-only subscribers
as a percentage of paid print subscriber base?

Let’s use The Dallas
Morning News to do the
math on digital-only
subscriptions:
• 200,000 paid print subscribers
• Charge $9.99/month to 15%
of print base
• 30,000 digital-only subscribers
$9.99/month
12 months
= $3.6 million/year
• That’s 4.5% of The Dallas
Morning News’ annual print
circulation revenues.
26

Mobile audiences
are growing like
wildfire.
That’s going to
be the answer.
27

Paid CPM
Paid CPM
vs. Pr Yr
Qtr
$2.61 35%
$3.05 6%
$3.80 9%
$2.84 8%
$3.01 4%
$3.21 5%
$3.67 35%
28
The good news:
Look at these
growth
percentages!
The bad news:
Look at these
CPMs!!
Ad
Revenue
vs. Pr Yr
Qtr
Ad Imp
vs. Pr
Yr Qtr
Sell
Through
Q2 2014 168% 20% 83%
Q3 2014 56% 37% 78%
Q4 2014 42% 31% 73%
Q1 2015 45% 40% 73%
Q2 2015 45% 53% 73%
Q3 2015 44% 48% 72%
Q4 2015 59% 18% 70%
Mobile Phone Display Advertising

Digital ad impressions served per month: • 100,000,000
Sell thru: • 100%
CPM: $• 3
Annual Revenue: • $3.6 million
29
Mobile Reality Check

“We’re living in a world of infinite inventory.
In that world, prices always trend toward
zero, and that is our challenge.”
Tony HaileFounder/CEO, Chartbeat
30

31
32

33
34

Goal:Attain consistent year-over-year growth in total revenue
by 2017
Strategy:Accomplish this goal in two ways:
Through a dedicated sustaining innovation process • (build)
Through a dedicated business development process • (buy)
35
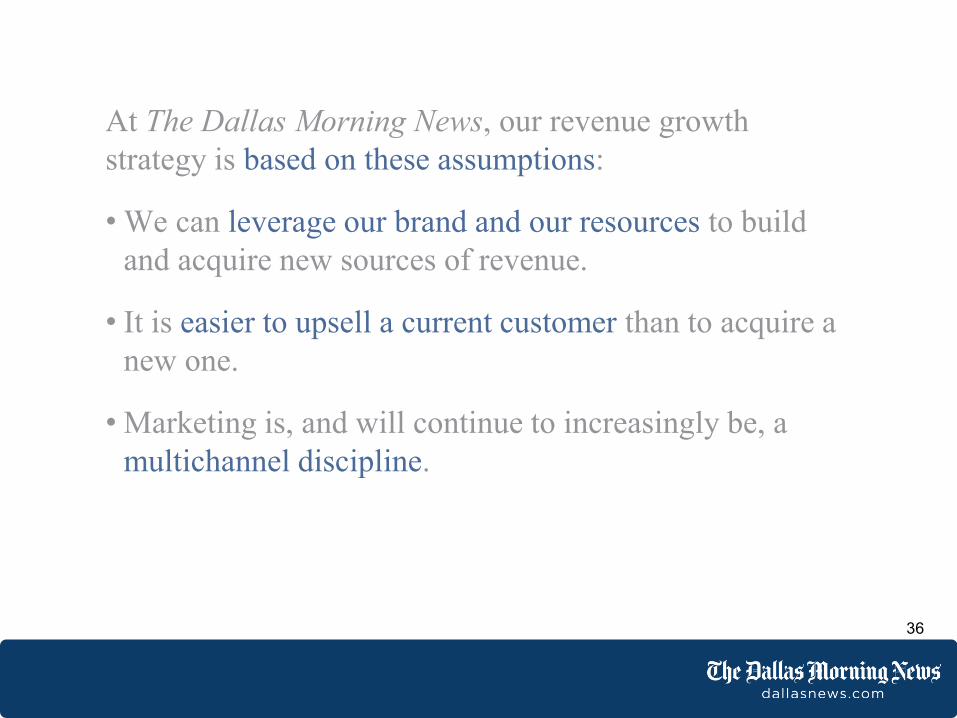
At The Dallas Morning News, our revenue growth
strategy is based on these assumptions:
We can • leverage our brand and our resources to build
and acquire new sources of revenue.
It is • easier to upsell a current customer than to acquire a
new one.
Marketing is, and will continue to increasingly be, a •
multichannel discipline.
36

Step One:
Establish a process for “sustaining innovation.”
This is different from “disruptive innovation.”
“Sustaining innovation” is the practice of
improving or extending current products
or launching new products you build yourself for
the purpose of creating incremental revenues.
37

Sustaining Innovation
38
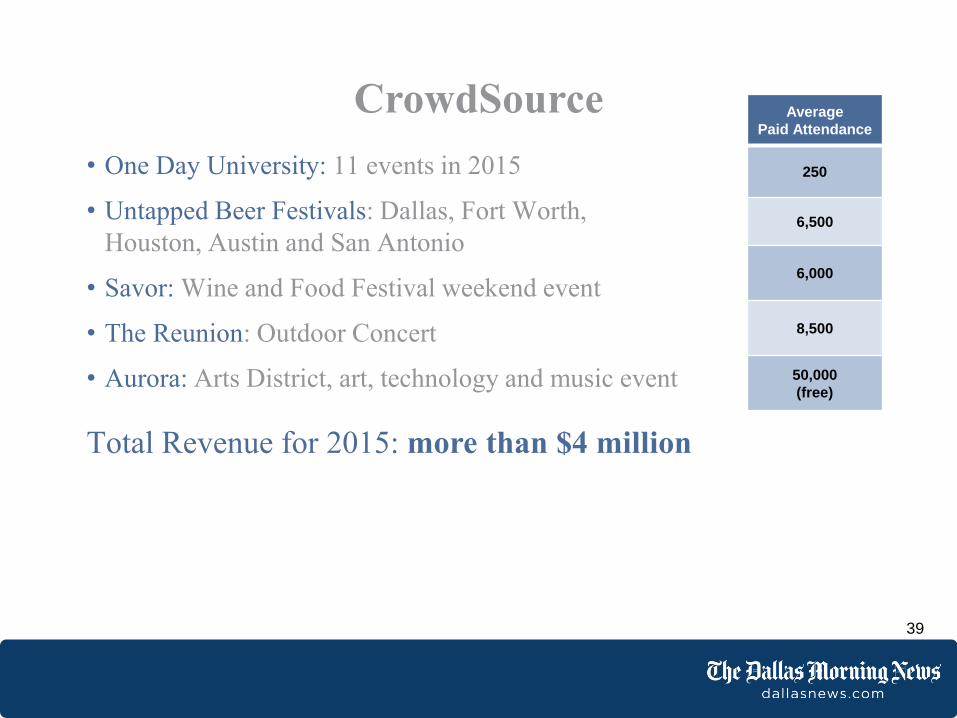
One Day University: • 11 events in 2015
Untapped Beer Festivals• : Dallas, Fort Worth,
Houston, Austin and San Antonio
Savor: • Wine and Food Festival weekend event
The Reunion• : Outdoor Concert
Aurora: • Arts District, art, technology and music event
39
CrowdSource
Total Revenue for 2015: more than $4 million
Average
Paid Attendance
250
6,500
6,000
8,500
Average
Paid Attendance
250
Average
Paid Attendance
250
6,500
Average
Paid Attendance
250
6,500
6,000
Average
Paid Attendance
250
6,500
6,000
8,500
50,000
(free)

• Content Marketing Agency
• 30% owned by Slingshot, a full-service agency
• Started in September, 2012 and first profitable month was
December, 2013
• 37 active accounts
• 15 were TDMN clients first
Total Revenue for 2015: $5.0 million
40
Speakeasy

Step Two:
Establish a permanently staffed and funded
business development unit to make acquisitions
of additional channels of marketing.
It is not certain that you can outrun the pace of
revenue decline related to paid print volumes by
only implementing a sustaining innovation strategy.
41

Business Development
42

Acquire businesses that give you more ways to market to 1.
consumers.
Select businesses for which you can leverage your brand and your 2.
resources to provide a competitive advantage in your market:
Your larger sales force, your larger base of customers, your
marketing muscle, etc.
Select successful businesses which have owners who:3.
Want to continue to run the business for at least three years•
Retain at least a • 20% ownership stake
Will agree to a three• -year non-compete when departing
Learn the business from them.
43
Essential Components of Acquisitions:
Improve the trajectory of the acquired company’s
It’s a multichannel marketing world.
revenue growth.

4. Organize, hire and train a sales force that can efficiently sell cross-
channel marketing campaigns.
5. Sell audiences – not products.
6. Demonstrate ROI: Provide targeting, measurement and attribution.
You will only be as successful as
your sales force is successful.
Change the conversation from one about expense to one about
investment.
Audiences are the common
denominator that bind together cross-channel marketing
campaigns.
44
Essential Components of Acquisitions:
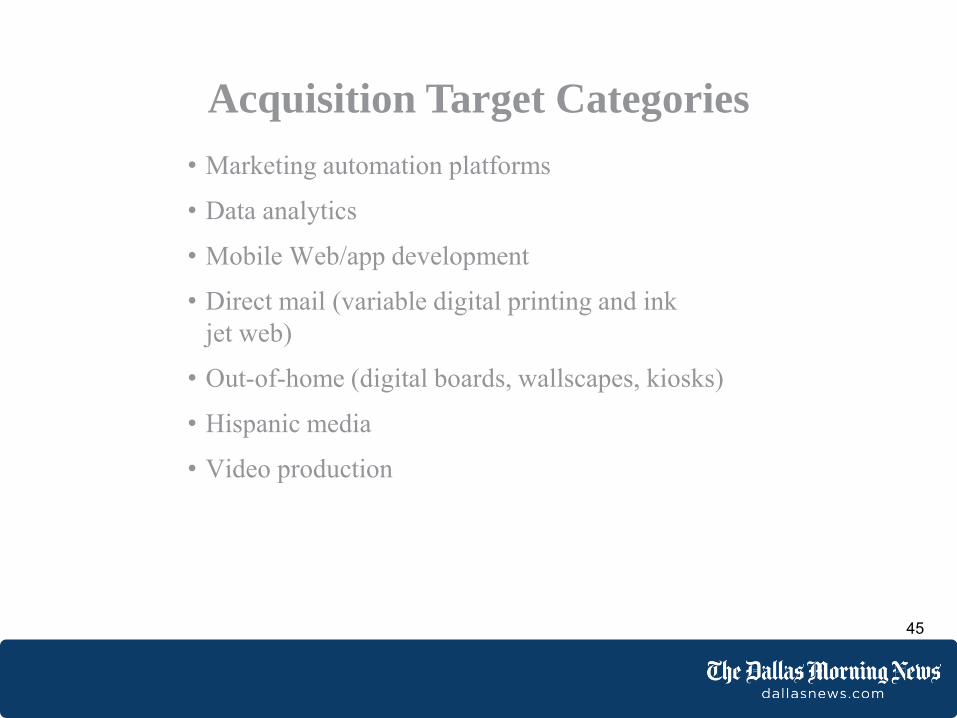
Marketing automation platforms•
Data analytics•
Mobile • Web/app development
Direct mail (variable digital printing and ink •
jet web)
Out• -of-home (digital boards, wallscapes, kiosks)
Hispanic media•
Video production•
45
Acquisition Target Categories

46
DMV in 2015
2015
Accounts sold by TDMN into DMV 187
Revenue from Accounts $1.3 million
TDMN AEs selling into TDMN 61%

47
Diversification of Revenue Sources2010 to 2015
46%
11%
29%
5%7%
2%
Distribution of Revenue 2010
Core Print Advertising
Niche Advertising
Circulation
Commercial Printing & Dstr
Digital Adv & Mktg Svcs
Other
32%
10%31%
9%
16%
2%
Distribution of Revenue 2015
Core Print Advertising
Niche Advertising
Circulation
Commercial Printing & Dstr
Digital Advtg & Mktg Svcs
Other
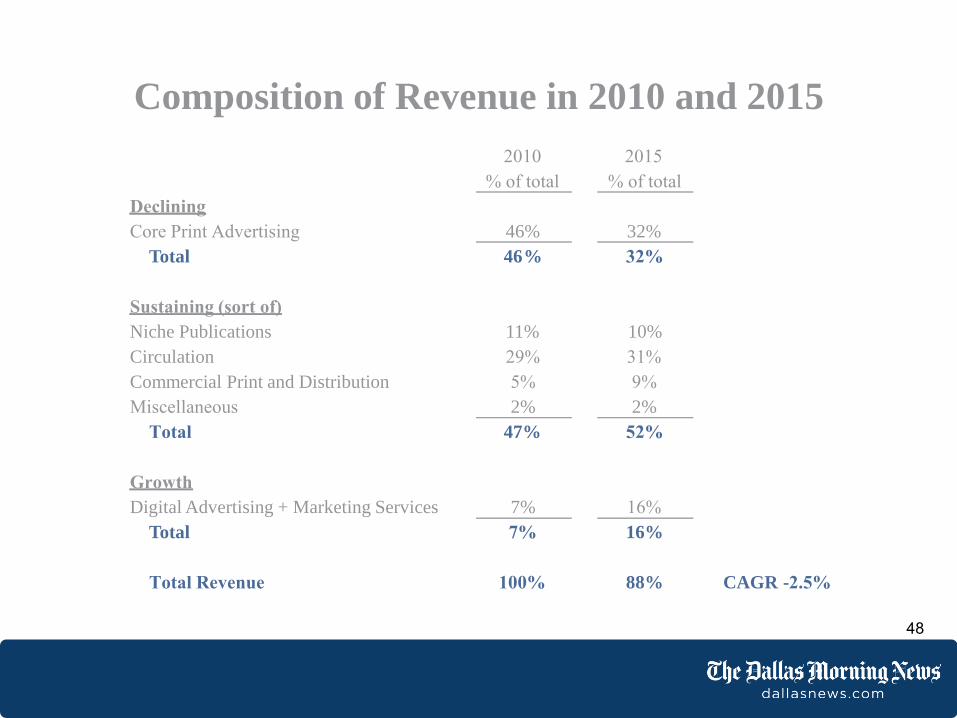
Composition of Revenue in 2010 and 2015
Declining
Core Print Advertising
Total
2010
% of total
46%
46%
2015
% of total
32%
32%
Sustaining (sort of)
Niche Publications
Circulation
Commercial Print and Distribution
Miscellaneous
Total
11%
29%
5%
2%
47%
10%
31%
9%
2%
52%
Growth
Digital Advertising + Marketing Services
Total
7%
7%
16%
16%
Total Revenue 100% 88% CAGR -2.5%
48
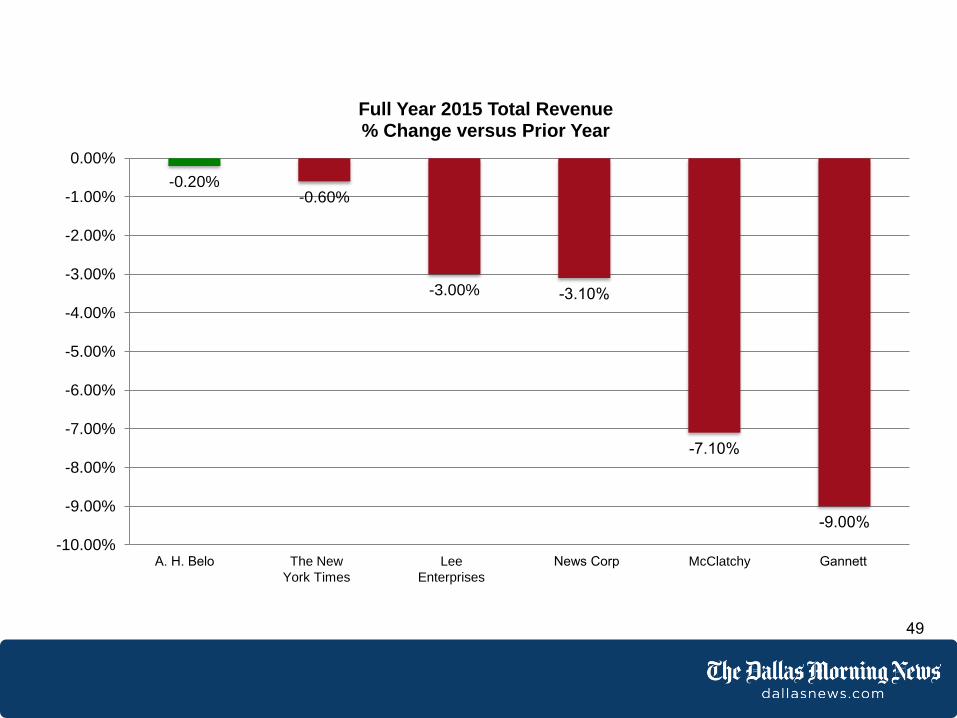
49
-0.20%-0.60%
-3.00% -3.10%
-7.10%
-9.00%
-10.00%
-9.00%
-8.00%
-7.00%
-6.00%
-5.00%
-4.00%
-3.00%
-2.00%
-1.00%
0.00%
Full Year 2015 Total Revenue% Change versus Prior Year
A. H. Belo The New
York Times
Lee
Enterprises
McClatchy GannettNews Corp

50
in order to profitably sell more of their
goods and services.
Become the company in your market that
businesses go to first to invest their marketing
dollars
supported by
targeting, measurement and attribution.
Do this by becoming the undisputed leader in
your market in providing the most owned
cross-channel marketing capabilities

Pinky:
“Gee Brain.
What are we going
to do tonight?”
Brain:
“The same thing
we do every night,
Pinky, try to take
over the world.”
51

“Gee Jim.
What are
we going
to do
today?” “The same
thing we do
every day,
Mike. Save
Democracy.
”
52