5 BIOPHYSICAL RECEIVING ENVIRONMENT CLIMATE … · 5 BIOPHYSICAL RECEIVING ENVIRONMENT 5.1 C ......
46
ENVIRONMENTAL RESOURCES MANAGEMENT GAMSBERG ESIA REPORT 5-1 5 BIOPHYSICAL RECEIVING ENVIRONMENT 5.1 CLIMATE CONDITIONS 5.1.1 Precipitations The proposed Project area is located in the Northern Cape Province of South Africa, a characteristically dry region (refer to Figure 5.1 below), comprising a portion of the Kalahari Desert. The greater study region falls within both the Bushmansland and Namaqualand areas, which experience summer and winter rainfall respectively. As a result, the proposed Project area experiences both summer and winter rainfall. Figure 5.1 Average Annual Rainfall over South Africa (1) Rainfall patterns for the nearby towns of Aggeneys and Pella (the closest towns to the proposed Project area) are similar, with Springbok (and to a lesser extent Pofadder) receiving relatively higher volumes of monthly average rainfall. Aggeneys receives an average of 98 mm of rainfall per annum (2) , while Pella and Pofadder receive an average of 77 and 117 mm of rainfall per annum (3) , respectively. (1) South African Risk and Vulnerability Atlas. Department of Science and Technology (based on data from 1961 -1990). (2) Based on data from data from 2000 – 2011. (3) Based on data from 1878 – 1980. Approximate position of the Gamsberg zinc mine
Transcript of 5 BIOPHYSICAL RECEIVING ENVIRONMENT CLIMATE … · 5 BIOPHYSICAL RECEIVING ENVIRONMENT 5.1 C ......

ENVIRONMENTAL RESOURCES MANAGEMENT GAMSBERG ESIA REPORT
5-1
5 BIOPHYSICAL RECEIVING ENVIRONMENT
5.1 CLIMATE CONDITIONS
5.1.1 Precipitations
The proposed Project area is located in the Northern Cape Province of South Africa, a characteristically dry region (refer to Figure 5.1 below), comprising a portion of the Kalahari Desert. The greater study region falls within both the Bushmansland and Namaqualand areas, which experience summer and winter rainfall respectively. As a result, the proposed Project area experiences both summer and winter rainfall.
Figure 5.1 Average Annual Rainfall over South Africa (1)
Rainfall patterns for the nearby towns of Aggeneys and Pella (the closest towns to the proposed Project area) are similar, with Springbok (and to a lesser extent Pofadder) receiving relatively higher volumes of monthly average rainfall. Aggeneys receives an average of 98 mm of rainfall per annum (2), while Pella and Pofadder receive an average of 77 and 117 mm of rainfall per annum (3), respectively.
(1) South African Risk and Vulnerability Atlas. Department of Science and Technology (based on data from 1961 -1990). (2) Based on data from data from 2000 – 2011. (3) Based on data from 1878 – 1980.
Approximate position of the Gamsberg zinc mine
ENVIRONMENTAL RESOURCES MANAGEMENT GAMSBERG ESIA REPORT
5-2
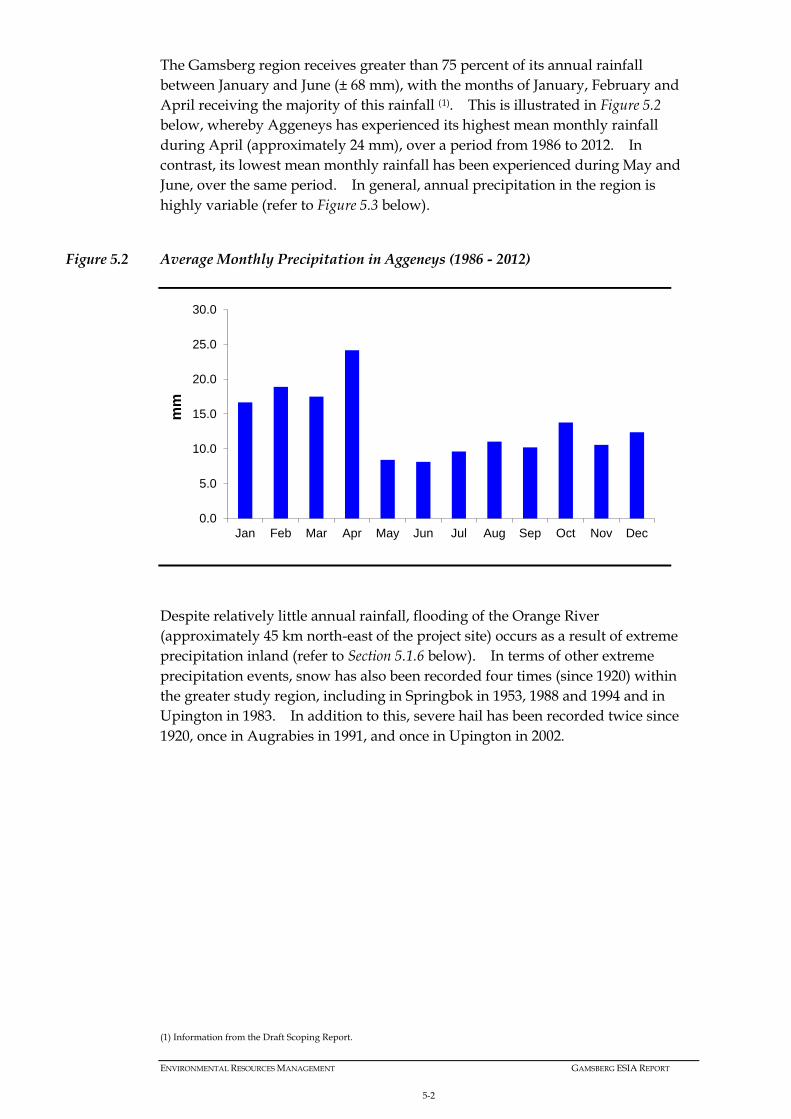
The Gamsberg region receives greater than 75 percent of its annual rainfall between January and June (± 68 mm), with the months of January, February and April receiving the majority of this rainfall (1). This is illustrated in Figure 5.2 below, whereby Aggeneys has experienced its highest mean monthly rainfall during April (approximately 24 mm), over a period from 1986 to 2012. In contrast, its lowest mean monthly rainfall has been experienced during May and June, over the same period. In general, annual precipitation in the region is highly variable (refer to Figure 5.3 below).
Figure 5.2 Average Monthly Precipitation in Aggeneys (1986 - 2012)
Despite relatively little annual rainfall, flooding of the Orange River (approximately 45 km north-east of the project site) occurs as a result of extreme precipitation inland (refer to Section 5.1.6 below). In terms of other extreme precipitation events, snow has also been recorded four times (since 1920) within the greater study region, including in Springbok in 1953, 1988 and 1994 and in Upington in 1983. In addition to this, severe hail has been recorded twice since 1920, once in Augrabies in 1991, and once in Upington in 2002.
(1) Information from the Draft Scoping Report.
0.0
5.0
10.0
15.0
20.0
25.0
30.0
Jan Feb Mar Apr May Jun Jul Aug Sep Oct Nov Dec
mm

ENVIRONMENTAL RESOURCES MANAGEMENT GAMSBERG ESIA REPORT
5-3
Figure 5.3 Total Annual Precipitation in Aggeneys (1986 - 2012)
5.1.2 Maximum and Mean Monthly Temperatures
The temperatures experienced in the Northern Cape are influenced by surrounding topographies, generally characterised with desert and semi-desert conditions. The average temperatures experienced within the broader Project area varies significantly between the summer and winter months, with the highest average temperatures being experienced during the wettest months on the year. Temperatures within the region range from an absolute minimum of -3 °C to a maximum of +40.8 °C based on historic records from 1961 - 1990 and 2000 - 2012. Correspondingly, Figure 5.4 illustrates that the proposed Mine site is located in one of the hotter regions within South Africa.
0
50
100
150
200
250
1986
1988
1990
1992
1994
1996
1998
2000
2002
2004
2006
2008
2010
2012
mm

ENVIRONMENTAL RESOURCES MANAGEMENT GAMSBERG ESIA REPORT
5-4
Figure 5.4 Average Annual Temperatures over South Africa1
Summers (November to March) are very hot with recorded mean maximum temperatures (from 1961-1990) being in the 30s (°C) (2). January is projected to be the hottest month, with mean maximum temperatures, between 2000 and 2012, ranging from 30.7 to 35.4 °C (Figure 5.5). In addition to this, results have shown a general trend of recorded January temperatures increasing by approximately 2.8°C over that period of time (Figure 5.5). During the summer months, daily maximum temperatures regularly exceed 30 °C and are greater than or equal to 35°C for approximately 11 days out of each summer month (Figure 5.6). Between 1961 and 1990, it was recorded that in January, on average, maximum daily temperatures are greater than or equal to 35 °C, on nine days out of the month (3). Between 2000 and 2012, average January daily maximum temperatures were greater than or equal to 35 °C during 12 days of the month (Figure 5.6).
1 South African Risk and Vulnerability Atlas. Department of Science and Technology (based on data from 1961 -1990). (2) Based on data for Pofadder from 1961 – 1990 (SAWS WB42). (3) Based on data for Pofadder from 1961 – 1990 (SAWS WB42).
Approximate position of the Gamsberg zinc mine

ENVIRONMENTAL RESOURCES MANAGEMENT GAMSBERG ESIA REPORT
5-5
Figure 5.5 Mean Maximum Temperature in Pofadder for January Between 2000 to 2012
During winter, mean maximum temperatures range from 17.8°C to 20°C; days are cool and nights are cold. The minimum winter temperatures experienced in Pofadder and Springbok can vary from -1°C to – 13°C, with significant temperature reductions at night time. June is accepted to be the coolest month with a mean temperature of 12.1°C and a mean maximum temperature of 17.8°C. Due to a lack of temperature data at the Gamsberg site, temperature data for the town of Pofadder, which is located 60 km east of the Gamsberg site, is used as a representative indication of temperature at Aggeneys. The region generally experiences hot and dry summers, with maximum temperatures in Pofadder ranging from 35 – 39°C during the months of November to March.
Figure 5.6 Average Number of Days Exceeding 30, 35 and 40 °C during the Summer Months (1)
(1) Pofadder, based on data from SAWS for 2000 – 2012.
28
29
30
31
32
33
34
35
36
2000 2001 2002 2003 2004 2005 2006 2007 2008 2009 2010 2011 2012
Mea
n m
axim
um te
mpe
ratu
re (°
C)
0
5
10
15
20
25
30
≥ 30 ≥ 35 ≥ 40
Num
ber o
f day
s
Average Temperature (°C)
DecJanFeb
ENVIRONMENTAL RESOURCES MANAGEMENT GAMSBERG ESIA REPORT
5-6
Ambient air temperature plays an influential role with respect to plume buoyancy. The greater the temperature gradient is between the plume and ambient air temperature, the higher the plume will rise. In addition, ambient air temperature can be used to determine the mixing depth and inversion layer heights, which influence air quality. Updated weather records will be sourced and used for pollution and dust dispersion modelling.
5.1.3 Monthly Mean Wind Direction and Speed
The prevailing winds experienced in the region are southerly and westerly. The southerly winds are experienced mainly during night times, with the westerly wind dominating the day time conditions (SRK Consulting, 2010). The average wind speeds recorded for day and night times are 3.25 m/s and 3.10 m/s respectively. Wind speeds within the region are typically low, with monthly average wind speeds ranging from 3.3 m/s to 4.3 m/s (11.9 – 15.5 km/h) at 14h00 based on information for Pofadder from between 2000 and 2012. The maximum gust speed recorded in Pofadder between 2008 and 2012 was 30.7 m/s (110.5 km/h) during February. Average gust speed during the year was 11.23 m/s (40.43 km/h). Based on the seasonal variations, summer and spring seasons experience higher average wind speeds of 3.68 m/s and 3.56 m/s respectively. The winter (2.81 m/s) and autumn (2.75 m/s) seasons are generally cooler, and thus the wind speeds are slower than that experienced in the warmer months (SRK Consulting, 2010). However, prevailing winds are generally similar, with southerly winds experienced during Summer and Spring, and westerly winds experienced during Autumn and Winter.
5.1.4 Evaporation
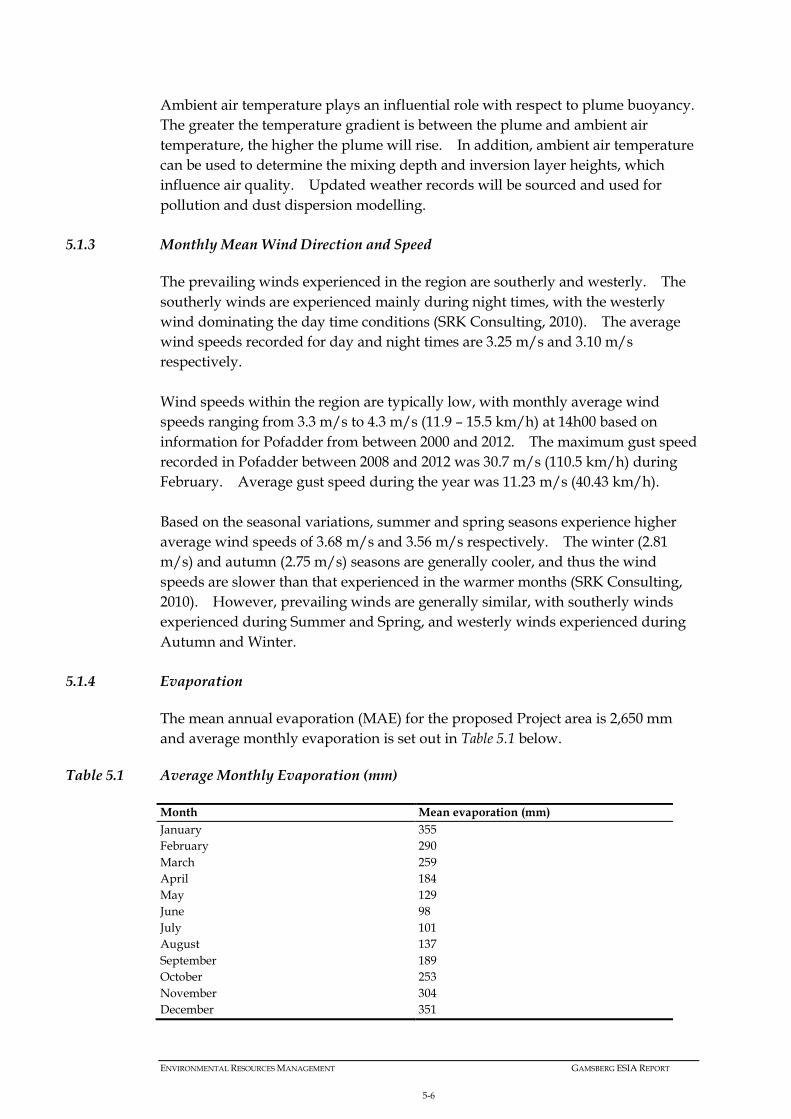
The mean annual evaporation (MAE) for the proposed Project area is 2,650 mm and average monthly evaporation is set out in Table 5.1 below.
Table 5.1 Average Monthly Evaporation (mm)
Month Mean evaporation (mm) January 355 February 290 March 259 April 184 May 129 June 98 July 101 August 137 September 189 October 253 November 304 December 351

ENVIRONMENTAL RESOURCES MANAGEMENT GAMSBERG ESIA REPORT
5-7
5.1.5 Relative Humidity
Relative humidity in the area is highest over the winter months, during which time humidity has been known to reach a maximum of 96 percent (with June being the most humid month on average) in Pofadder (SAWS, 2012). Average humidity is also greatest in the morning with average annual humidity being 59 percent at 08h00.
5.1.6 Flooding
Analysis of extreme weather events in the Northern Cape between 1920 and 2011 indicates that severe flooding has been experienced in Upington, Kakamas, Augrabies and Springbok on a fairly regular basis (approximately more than 2.6 times per decade) (1). Of the 50 flooding events that have occurred in the Northern Cape, since 1920, 40 percent of them have occurred in towns situated along the Orange River. Flooding is a rare occurrence in towns further away from the river; however one incident was recorded in Springbok in 1994. Flooding of the Orange River occurs in this area when there has been significant rainfall inland and the river struggles to contain the flow within its huge catchment (approximately 1 million km2). The most recent severe event occurred in January 2011. In this case, the river inundated the flood plain and resulted in the devastation of arable land and the evacuation of families from the Upington, Kakamas and Augrabies towns (see Figure 5.7, Figure 5.8 and Figure 5.9).
Figure 5.7 The 2011 Flooding of the Orange River Destroyed Hundreds of Hectares of Arable Land in Upington (2)
(1) SAWS CAELUM Report. (2) Source: http://www.ofm.co.za/article/73984/Pics-of-yesterdays-Upington-Floods

ENVIRONMENTAL RESOURCES MANAGEMENT GAMSBERG ESIA REPORT
5-8
Figure 5.8 The 2011 Flooding of the Orange River Caused Significant Damage to Infrastructure and Blocked Transport Routes in Upington1
Figure 5.9 The Impact of the 2011 Flooding of the Orange River on the Augrabies Falls1
1http://playak.com/index.php?option=com_community&view=photos&task=photo&albumid=1525&userid=6877&Itemid=127#photoid=8960.

ENVIRONMENTAL RESOURCES MANAGEMENT GAMSBERG ESIA REPORT
5-9
The incidences of flooding and other extreme weather events in the region are plotted in Figure 5.10, which shows recorded events in the Northern Cape between 1920 and 2011. These events are based on information contained in the South African Weather Services (SAWS) CAELUM report. The CAELUM report is a report developed by the SAWS capturing all of the extreme weather events that have been recorded and/or reported within South Africa since 1913. The report contains details of the event, including event type, location, date and any additional information available (eg deaths, rand value associated with the damage of the event, infrastructure damaged etc). It should be noted that it is possible that not all extreme weather events are captured within the SAWS CAELUM Report as it depends on a SAWS representative experiencing and reporting the event. It is, however, the best available source of data on such events from SAWS. Additionally, although an extreme event, snow for example, was recorded in one town it is likely that the event was also experienced in other, smaller towns within the region in which the proposed Project is situated, but that the event was not recorded in the other towns given their size.
Figure 5.10 Recorded Weather Events Around the Project Site (SAWS, 2011)
5.2 TOPOGRAPHY
The local topography is characterised with undulating plains, containing low growing shrubby vegetation and grasses. The surrounding plains are approximately 750 – 900 meters above mean sea level (mamsl), with the highest areas of the Gamsberg inselberg varying between 1100 – 1150 mamsl. The Gamsberg inselberg is approximately 7.2 km east – west and approximately 4.6 km north – south. Erosion along the top of the inselberg has resulted in the creation

ENVIRONMENTAL RESOURCES MANAGEMENT GAMSBERG ESIA REPORT
5-10
of a basin within the feature, which subsequently varies between 60 – 70 m below the rim of the inselberg.
5.3 GEOLOGY
5.3.1 Regional Geology
The Gamsberg zinc deposit is developed in a medium to high grade metamorphic volcano-sedimentary succession belonging to the Aggeneys Sub-Group of the Bushmanland Group. This Group is bordered to the east by the Hartbees River Thrust, to the north by the Groothoek Thrust and Wortel Belt, and it is overlain Karoo-age rocks to the south. Together these Groups occur within the Namaqualand Metamorphic Complex, which as mentioned above, consists of Precambrian metamorphic rocks and intrusives formed or metamorphosed during the Namaqua Orogeny. The Bushmanland Group is composed of basement granitic rocks (1 700 to 2 050 Ma), supra-crustal sequences of sedimentary and volcanic origin (1 200, 1 600 and 1 900 Ma) and intrusive charnokite to granitic rocks (950, 1 030 to 1 060, and 1 200 Ma).
5.3.2 Local Mine Geology
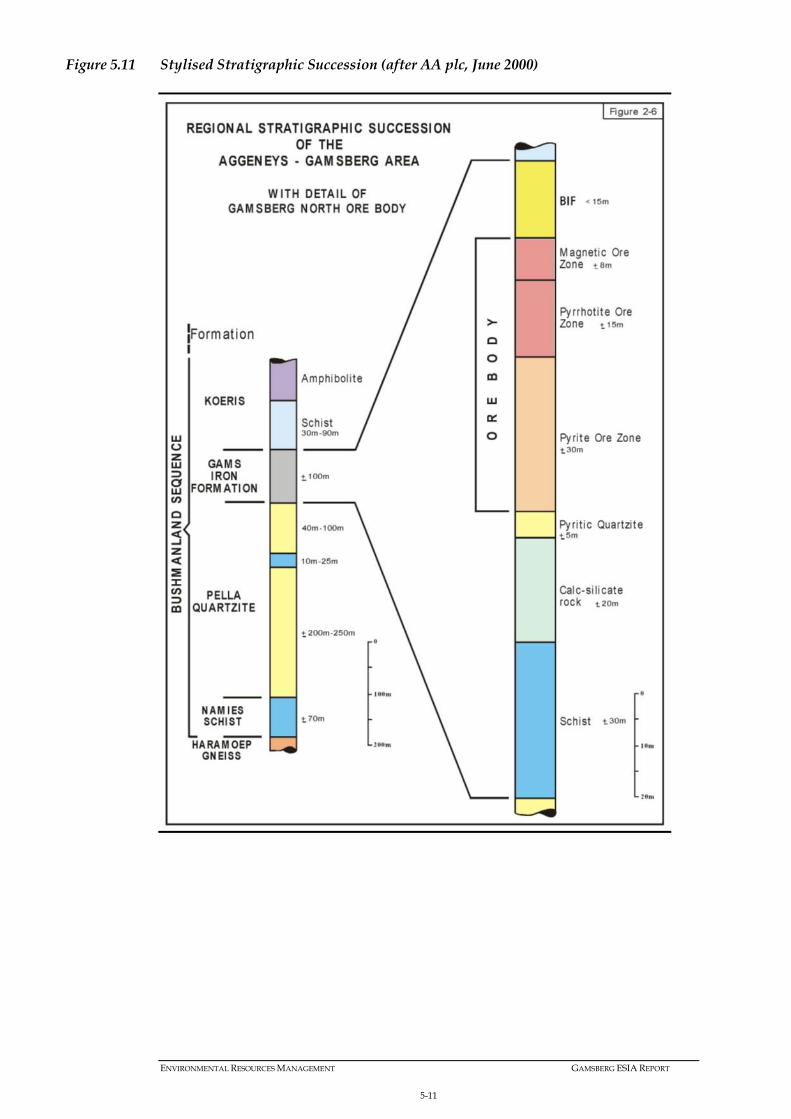
Figure 5.11presents a stylised stratigraphic succession for the proposed Project area, with specific detail of the Gamsberg North ore body that is targeted in this Project. The succession at Gamsberg comprises of basal quartzo-feldspathic gneiss overlain progressively upwards by siliminite-bearing pelitic schist and metaquartzites of up to 450 m thickness; the Gams Iron Formation (GIF) of 0 to 80 m thickness; and Koeris Formation rocks consisting of quartz-muscovite schist, lenses of conglomerate and amphibolite to a thickness of 400 to 500 m. Table 5.2 presents key characteristics of the various lithologies that would report as hanging wall, ore zone or footwall material. Note that the latest phase of structural deformation of the local basin resulted in upturning and buckling, to produce a steep-limbed anticlinal structure on the north side of the inselberg.
ENVIRONMENTAL RESOURCES MANAGEMENT GAMSBERG ESIA REPORT
5-11
Figure 5.11 Stylised Stratigraphic Succession (after AA plc, June 2000)

ENVIRONMENTAL RESOURCES MANAGEMENT GAMSBERG ESIA REPORT
5-13
Table 5.2 Key Characteristics of Gamsberg Lithologies, which would be Disturbed by Mining Activities
Formation BIF Facies Lithostratigraphy Thickness (m) Description Ore / waste
Nousees Mafic Gneiss/Koeris
-
Amphibolite
> 500
Amphibolite. Quartz veins in fractures.
Hanging wall waste
Quartz-Muscovite Schist (plus conglomerate lenses)
Quartz-muscovite schist with interbedded micaceous quartzite and conglomerate (quartzite pebbles in quartz-muscovite matrix).
Gams Iron Formation (GIF)
Oxide BIF
BIF (C Members) < 15 Similar silicate mineralogy to B Member, but magnetite and hematite present instead of sulphides. Often
absent.
Magnetite ore (B) ± 8 Oxide iron formation containing quartz, orthopyroxene, clinopyroxene, grunerite, garnet, pyroxenoid and
apatite.
Ore
Sulphide BIF
Pyrrhotite ore (B2) ± 15 Quartz, sillimanite, muscovite metapelite
Pyrite ore (B1) ± 30 Quartz, sillimanite, muscovite, graphite metapelite
Pyritic quartzite (A4) ± 5 Not economically mineralised. Upper pyritic quartzite and lower magnetite quartzite layers separated by
marble / calc-silicate.
Footwall waste -
Calc-silicate rock (A3 & A2) ± 20 Quartz, biotite, muscovite, silimanite
schist (A1)
30 - 90
Wortel/Pella Quartzite
Dark quartzite Dark coloration is due to disseminated magnetite and hematite concentrated along quartz grain
boundaries.
Schist Thin irregular marker horizon. Interbedded with dark layers of micaceous quartzite.
White quartzite > 200 Exposed as near-vertical exterior cliffs & flat tops of inselberg.

ENVIRONMENTAL RESOURCES MANAGEMENT GAMSBERG ESIA REPORT
5-15
5.3.3 Geochemical Context of the Gamsberg Deposit
The Gamsberg stratigraphic sequence is believed to have been deposited as an accumulation of fine-grained siliceous and aluminous clastic sediments within a relatively large shallow basin. The connate water in the shallow basin showed a diverse range in pH, redox state and solution chemistry, which Rozendaal (1982) linked to the vertical and horizontal distribution of oxide, sulphide, sulphate and carbonate facies within the sequence. Anaerobic conditions were associated with the formation of metal sulphides, whereas oxidising conditions resulted in the conversion of sulphide to sulphate and the formation of metal oxides such as hematite (Fe2O3) and barite (BaSO4). Opencast mining of the Gamsberg deposit would disturb rocks from the Pella Quartzite, Gams Iron and Koeris Formations. Exposure of these rocks to oxygen and water could lead to oxidation of elements that currently occur in a reduced state. The oxidation of sulphide minerals on exposure could generate metal oxides, sulphate and acidity (H+). Where base or alkali minerals are present they may neutralise this acidity. If there is sufficient net acidity to lower the pH of water in contact with the rock/mine waste material then metal leaching may occur, because metals are generally more soluble at low pH. The resultant acid rock drainage (ARD) could pose a threat to surface and groundwater resources in the area. Sulphide minerals are prevalent within rocks of the GIF, particularly within the B2 (pyrrhotite ore), B1 (pyrite ore) and A4 (pyritic quartzite) ore zones. By contrast, sulphides are generally absent from rocks of the Koeris and Pella Quartzite Formations. This suggests that weathering reactions would be predominantly kinetically driven for GIF lithologies, and equilibrium driven for Koeris and Pella Quartzite Formations. In kinetically driven systems the concentrations of chemical elements in surrounding water bodies are more dependent on the degree of contact between the mineral and the water body, and show greater variation over time, than within equilibrium driven systems.
5.4 SOIL POTENTIAL
5.4.1 Soil Forms
The Project area is characterised by an extensive peneplain. The soils present in the peneplain are predominantly shallow and stony. However, soils found within the inselberg are characterised with bouldery and stony scree slope soils (SRK Consulting, 2010). The scarps and crest of the inselberg are characterised with bare rocks, while the Gamsberg Basin itself is characterised with shallow gravelly soils. The soils present on the peneplain are generally characterised with reddish sandy topsoil that is shallow in nature. However, a 10cm thick red sandy surface layer is present along the northern section of the proposed site. The western and southern part of the proposed site is characterised with deeper red soils, varying in depth from 30 cm to 60 cm. Along the south western portion of the proposed site, deeper red soils occur.

ENVIRONMENTAL RESOURCES MANAGEMENT GAMSBERG ESIA REPORT
5-16
It should be noted that the Gamsberg inselberg has been managed as a grazing-free site. In doing, the level of land degradation is limited for this inselbergs in contrast to the surrounding farm lands, which have experienced varying degrees of degradation as a result of overgrazing. The Project area (which comprises of 4 properties) are already zoned for mining, with the exception of Gams 60, Portion 4 which is zoned for farming. However, it must be noted that Black Mountain Mining has an existing surface right to mine Gams 60, Portion 4 and therefore no grazing is currently undertaken on this property.
5.4.2 Agricultural Potential
The dry climate is unsuitable for crop production, and livestock farming is the dominant form of landuse in the region. The Project area has an existing mining right, and thus the grazing potential of the site has not been investigated. Furthermore, grazing activities have been prevented on the Gamsberg inselberg, which has indirectly contributed to the conservation of the existing biodiversity on-site.
5.5 SURFACE WATER
5.5.1 Catchment Area Characteristics
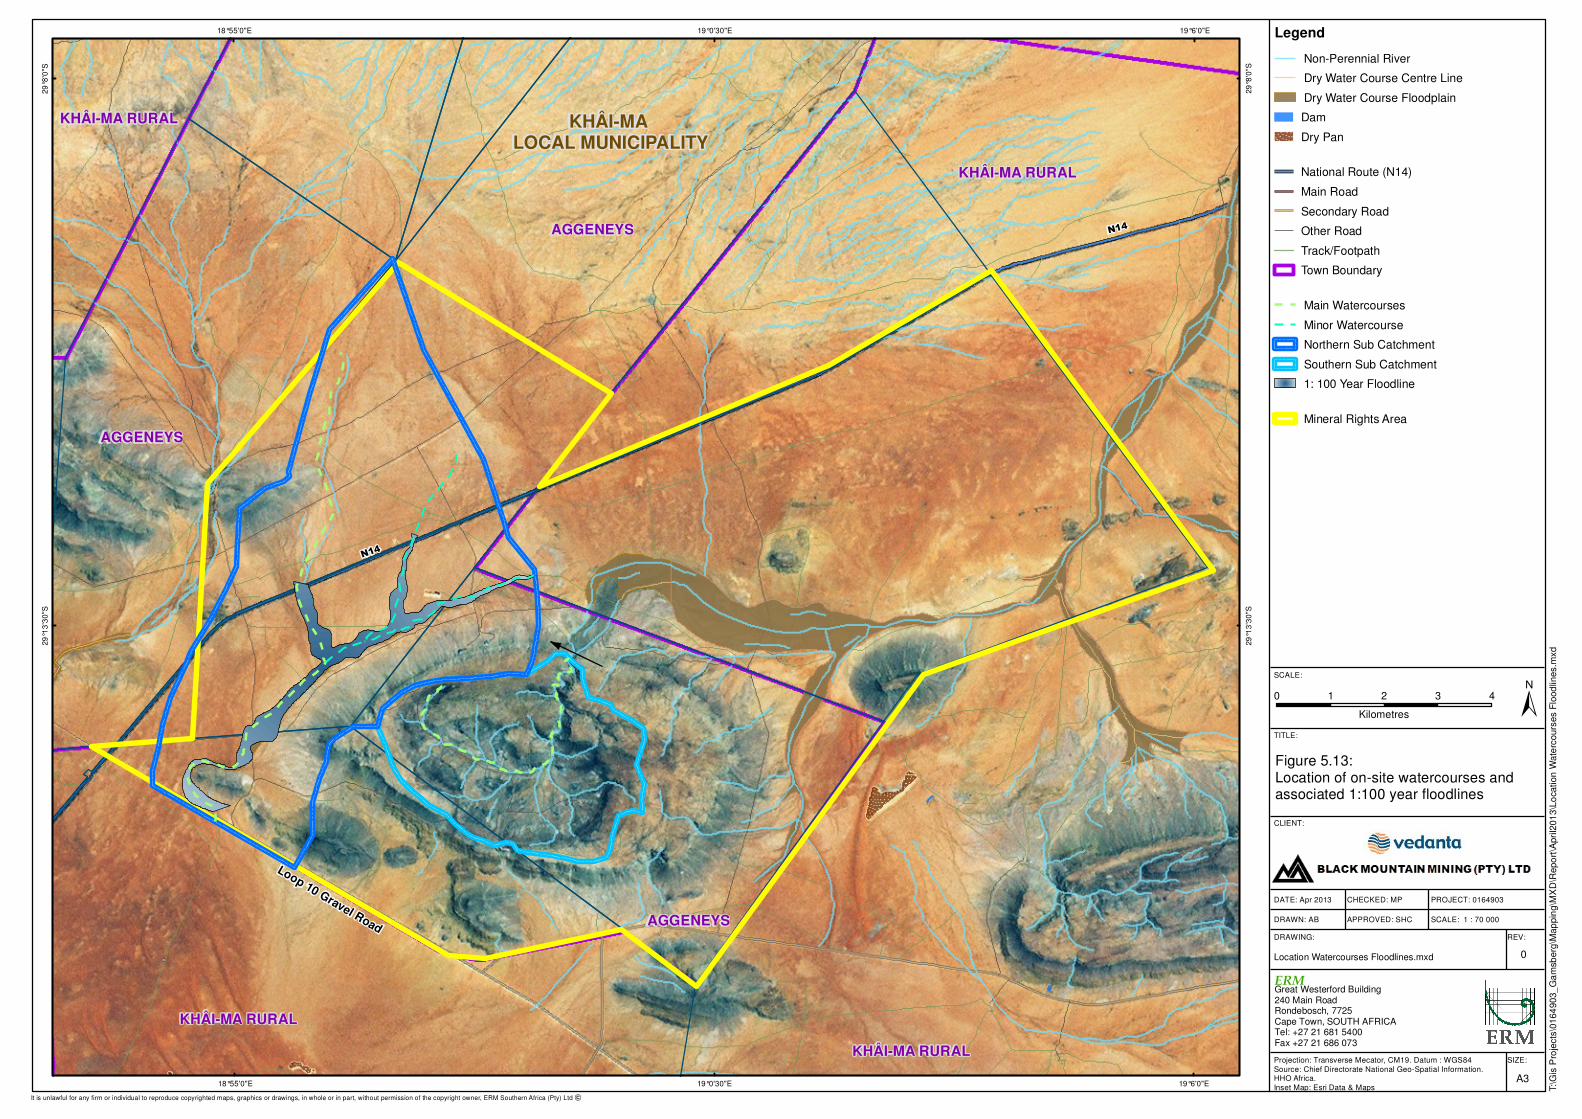
Situated in the Orange River basin, the mine is located at the watershed between two quaternary catchments, being D81G and D82C. The latter is an endoreic catchment, meaning that it is an interior drainage basin that does not drain to the sea. The Gamsberg inselberg is situated within quaternary catchment D81G, which drains in a northerly direction towards the Orange River some 35km away. A third quaternary catchment, D82A was identified in the 2010 baseline report, but being remote from any anticipated mine infrastructure, is not further considered in this report. The baseline surface water assessment identified 11 sub-catchments totalling roughly 750 km2. Of these, only two are of particular interest to this study, being affected by proposed mine infrastructure. These are sub-catchments 4 and 9a. Table 5.3 compares the baseline catchment nomenclature with that adopted for this report. Other baseline sub-catchments that are unaffected by proposed mining infrastructure are not further considered in this report. For the baseline assessment, no ineffective areas were identified. Runoff was therefore deemed to be generated by the entire sub-catchment, and calculated accordingly. The full development scenario, however, introduced ineffective areas that had a significant impact on peak flows and volumes. Figure 5.13 below illustrates the on-site watercourses, baseline sub-catchments and associated 1:100 year floodlines.

ENVIRONMENTAL RESOURCES MANAGEMENT GAMSBERG ESIA REPORT
5-17
Table 5.3 Catchment Naming Convention
Baseline Hydrology Impact Assessment
Sub-Catchment No Area (km2) Quaternary Catchment
Sub-Catchment Name
Area (km2)
1 108.2 D82C
2 65.9 D82C
3 52.8 D82C
4 31.1 D82C North 38.7
5 0.97 D81G
6 53.7 D81G
7 272.7 D81G
8 21.6 D81G
9a 13.4 D81G South 13.1
9b 1.03 D81G
10 125.7 D82A
Total 747.1
53.5
Being situated at the watershed between two quaternary catchments, surface water runoff emanating from the mine leasing area affects downstream catchments. In particular, the likely reduction in Mean Annual Runoff (MAR) is an important consideration in determining the mine’s impact on local surface water resources. The northern section of the Project area drains into the Orange River Basin, whereas the southern section drains into a catchment referred to as an endoreic area, (i.e. an interior catchment that doesn’t feed out into the ocean) (SRK Consulting, 2010). The Orange River basin is the largest river basin in South Africa with a total catchment area of approximately 1 000 000 km² (www.dwa.gov.za, 2012). Approximately 60 percent of the catchment area is located within the Republic of South Africa (refer to Figure 5.12 below) with the remainder spread across Lesotho, Botswana and Namibia. The Orange River, (called the Senqu River in Lesotho), originates high in the Lesotho Highlands, approximately 3 300 m above sea level, where the average annual rainfall exceeds 1 800 mm (www.dwa.gov.za, 2012). The river is approximately 2 300 km long (i.e. from the source in Lesotho to the estuary in Alexander Bay). According to various sources the average natural mean annual run-off (MAR) from the total basin is more than 12 000 million m³/a, however, this volume is representative of the natural MAR, and therefore excludes current development activities and storage facilities on the system (www.dwa.gov.za, 2012). The

ENVIRONMENTAL RESOURCES MANAGEMENT GAMSBERG ESIA REPORT
5-18
current MAR of the Orange River, at the proposed point of abstraction will be presented in the ESIA Report. There are three main storage reservoirs within the Orange River basin, namely Gariep Dam, Vanderkloof Dam (located within South Africa) and the recently completed Katse Dam in Lesotho on the Senqu River (www.dwa.gov.za, 2012). The Gariep Dam has a total capacity in excess of 5 000 million m3 while Vanderkloof Dam has a storage capacity of over 3 200 million m3. The storage capacity of the Katse dam is 1 950 million m3.
Figure 5.12 Orange River Catchment (Sourced from www.dwa.gov.za website, 2012)
The Project will require a total of 9,125 million m3/annum of water to fulfil the operational requirements for all Project components. The construction phase is expected to last 30 months. It is the intention of BMM to source the water requirements for the Project from the Orange River during construction and operation. Based on the water requirements for the Project, the suggested volume of water for the operational phase (i.e. 9,125 million m3/ annum) is approximately 0.083% of the natural MAR of the Orange River system.

ENVIRONMENTAL RESOURCES MANAGEMENT GAMSBERG ESIA REPORT
5-19
Due to its length, the Orange River is divided into the upper and lower Orange water management areas. The proposed site falls within the lower Orange Water Management Area, which is further divided into 4 sub-areas. The length of river extending from Pella to Alexandra Bay is part of the fourth sub-area (DWA, 2009). However, there are a number of users identified from downstream of the Pella abstraction point. Approximately 166 km downstream of Pella, the Orange River crosses the Vioolsdrift Weir, where water is pumped to the town of Springbok. Slightly downstream of the Vioolsdrift Weir is a small farming town of Vioolsdrift located along the southern side of the Orange River. Downstream of the town of Vioolsdrift, the Orange River enters the Richtersveld area, which is comprised of many local Nama communities. Due to the migration patterns of the Nama communities, approximately 160 000 hectares of the Richtersveld has been declared a UNESCO World Heritage Site (DWA, 2009). Approximately 145 km downstream of Vioolsdrift, the Fish River (a major tributary) links into the Orange River. Approximately 150km downstream of the Fish River confluence, the Orange River feeds into the Atlantic Ocean, at Alexandra Bay.
5.5.2 Site Specific Water Resources
The Project area falls within three quaternary catchment areas, namely, D82C, D82A and D81G. During the hydrology and surface water analysis undertaken by SRK Consulting (2010), the Project area and associated infrastructure is expected to impact on 10 local water catchment areas in the three quaternary catchments. Based on the previous investigations, the area for each catchment ranges from 0.97 km² to 272 km². The MAR for each of these catchments were based on area weighting WR2005 data (SRK Consulting, 2010). The area weighted MAR for each of these catchment areas varied from 300 m3 to 84 000 m3. However, due to the limited rainfall experienced in the region, most of the water courses identified are ephemeral in nature. Notwithstanding, the small catchment area identified on top of the inselberg does contain a spring, and therefore can experience seasonal to perennial flows. A map reflecting the main watercourses within the mining license, together with associated 1:100 year floodlines are is presented below:
0 1 2 3 4
Kilometres
N14
KHÂI-MA RURAL
AGGENEYS
AGGENEYS
N14
AGGENEYS
KHÂI-MA RURAL
KHÂI-MA RURAL
KHÂI-MA RURAL
Loop 10 Gravel Road
Pella
KHÂI-MA LOCAL MUNICIPALITY
19°6'0"E
19°6'0"E
19°0'30"E
19°0'30"E
18°55'0"E
18°55'0"E
29
°8'0
"S
29
°8'0
"S
29
°13
'30
"S
29
°13
'30
"S
SIZE:
TITLE:
DATE: Apr 2013
DRAWN: AB
CHECKED: MP
APPROVED: SHC
PROJECT: 0164903
DRAWING: REV:
A3
Figure 5.13: Location of on-site watercourses and associated 1:100 year floodlines
Location Watercourses Floodlines.mxd 0
CLIENT:
±SCALE:
T:\G
is P
roje
cts
\0164
903_
Ga
msb
erg
\Map
pin
g\M
XD
\Repo
rt\A
pri
l201
3\L
ocation W
ate
rcours
es F
lood
lines.m
xd
Projection: Transverse Mecator, CM19. Datum : WGS84
Source: Chief Directorate National Geo-Spatial Information. HHO Africa.
Inset Map: Esri Data & Maps
SCALE: 1 : 70 000
It is unlawful for any firm or individual to reproduce copyrighted maps, graphics or drawings, in whole or in part, without permission of the copyright owner, ERM Southern Africa (Pty) Ltd �
Legend
Non-Perennial River
Dry Water Course Centre Line
Dry Water Course Floodplain
Dam
Dry Pan
National Route (N14)
Main Road
Secondary Road
Other Road
Track/Footpath
Town Boundary
Main Watercourses
Minor Watercourse
Northern Sub Catchment
Southern Sub Catchment
1: 100 Year Floodline
Mineral Rights Area
Great Westerford Building240 Main RoadRondebosch, 7725Cape Town, SOUTH AFRICATel: +27 21 681 5400Fax +27 21 686 073
ERM

ENVIRONMENTAL RESOURCES MANAGEMENT GAMSBERG ESIA REPORT
5-21
5.5.3 Water Quality Management and Sources of Contamination
During the hydrological baseline investigations undertaken by SRK Consulting in 2010, water monitoring stations were set up to determine flow volumes as well as obtain water quality data. However, due to the lack of rainfall during the monitoring period from May – August 2009, data was only collected from three of the ten monitoring stations (in and around the inselberg). Thus the information contained is a reflection of the dry season data for water quality. The results from the water quality monitoring were compared to the South African National Standards for drinking water (SANS 241 of 2006). This initial analysis confirmed that water from the springs on the Gamsberg inselberg is suitable for domestic use and livestock watering (SRK Consulting, 2010). The concentration levels of Barium found in the water did comply with SANS 241 over the monitoring period. However Barium concentrations did exceed the World Health Organisations standard for drinking water. It must be noted that the nitrate concentrations recorded during the months of July and August were approximately 10 times higher than those during May and June. Although the nitrate levels remain within SANS 241 standards for drinking water, the nitrate concentrations are likely to be linked to fertilizers, sanitation problems and livestock.
5.6 GROUNDWATER
5.6.1 Description of Hydrogeology
As part of the baseline study, a hydro-census analysis was undertaken by SRK Consulting in 2010 of the Gamsberg region to obtain information related to groundwater. Approximately 41 water sources (including boreholes, wells and springs) were identified, however, only 27 of those were operational with the required equipment. The baseline study confirmed that no regional aquifers have developed in the Namaqualand Metamorphic Complex. Furthermore, due to thinly developed soils, primary weathered zone aquifers are infrequent and localised. Groundwater is mainly found within secondary fractured-rock aquifers and tends to be found along fractures within hydraulically isolated rocks of low permeability, which are commonly found in the surrounding areas. According to the baseline report, the transmissivity of the fractured aquifers is considered to be low (SRK Consulting, 2010). The geology in the Gamsberg area is mainly comprised of dense metamorphic rocks which are characterised with low permeability, and as such, the movement of groundwater in the area is largely influenced by secondary structural features. Features such as shears, thrust faults and fractures will impact on the movement of groundwater. Interconnected features would facilitate a greater movement of groundwater across the region, while unconnected features will limit groundwater flows to the individual faults or fractures. The structural features identified are

ENVIRONMENTAL RESOURCES MANAGEMENT GAMSBERG ESIA REPORT
5-22
largely oriented in a north to northwest direction of the proposed Gamsberg site, with a few features present to the east to west and southeast directions.
5.6.2 Current Groundwater Use
Groundwater resources in the Namakwa District are more abundant than surface water features. Groundwater serves as a key water source, especially for livestock farmers in the Project area. Based on estimated projections, a total of ~75 000 m3/a of groundwater is abstracted, primarily for livestock watering and domestic use. This was calculated based on the hydro-census analysis undertaken in 2010 by SRK Consulting for the various boreholes, wells and springs. The boreholes present in the region are expected to yield between 0.1 and 0.5 ℓ/s, which are likely to experience seasonal variations based on rainfall patterns. A breakdown of current groundwater abstraction in the surrounding region is presented below.
Table 5.4 Summary of Groundwater Abstraction in the Area (SRK Consulting, 2010)
Groundwater Use Abstraction (m3/a) No. of water sources Domestic 2 700 2 Domestic/Livestock 28 129 6 Drilling Water 19 450 2 Livestock 15 500 13 Monitoring 9461 4 Unused 0 14 Total 75 240 41
5.6.3 Groundwater Quality
Groundwater sampling and analysis was undertaken in 2010 by SRK Consulting. The Electrical Conductivity (EC) and pH levels were measures at locations within and around the Gamsberg inselberg. The EC levels in the water sampled in the Gamsberg inselberg appears to be lower than those sampled from sites adjacent to and surrounding the inselberg. This implies that the Gamsberg inselberg has a higher recharge rate. The pH values of the water sampled varied between 6.15 and 8.45, with a mean of 7.45. Fluoride concentrations in groundwater samples ranged between 0.2 and 4.2 mg/ℓ, with a mean value of 2.07 mg/ℓ. Majority of the samples tested exceeded the Class two water quality parameters, and is thus considered not suitable for drinking purposes in terms of SANS 241 of 2006. The elevated Fluoride concentrations were limited to samples taken from sources surrounding the Gamsberg inselberg, and could potentially be attributed to evaporation rates, mineralogy of the rock or holding time of groundwater. Nitrate concentrations found in the groundwater varied from below 0.3 mg/ℓ (below detection limit) to 43 mg/ℓ (sample found at a dug up well) (SRK
ENVIRONMENTAL RESOURCES MANAGEMENT GAMSBERG ESIA REPORT
5-23
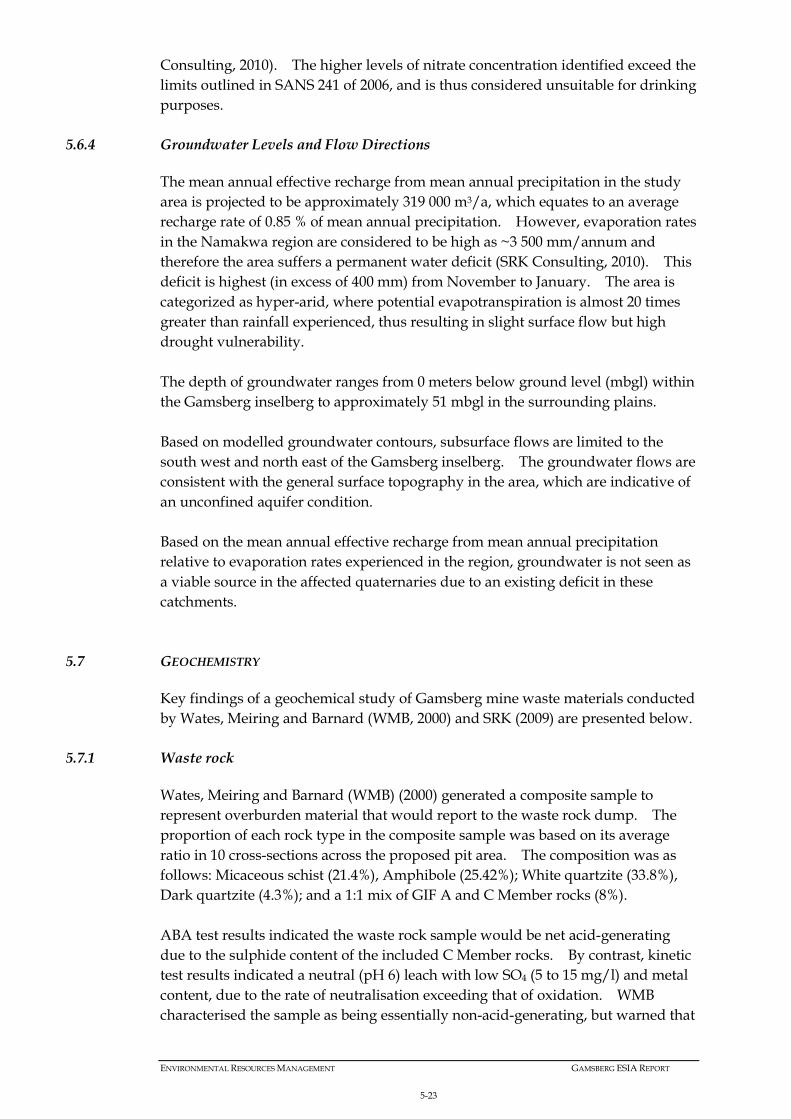
Consulting, 2010). The higher levels of nitrate concentration identified exceed the limits outlined in SANS 241 of 2006, and is thus considered unsuitable for drinking purposes.
5.6.4 Groundwater Levels and Flow Directions
The mean annual effective recharge from mean annual precipitation in the study area is projected to be approximately 319 000 m3/a, which equates to an average recharge rate of 0.85 % of mean annual precipitation. However, evaporation rates in the Namakwa region are considered to be high as ~3 500 mm/annum and therefore the area suffers a permanent water deficit (SRK Consulting, 2010). This deficit is highest (in excess of 400 mm) from November to January. The area is categorized as hyper-arid, where potential evapotranspiration is almost 20 times greater than rainfall experienced, thus resulting in slight surface flow but high drought vulnerability. The depth of groundwater ranges from 0 meters below ground level (mbgl) within the Gamsberg inselberg to approximately 51 mbgl in the surrounding plains. Based on modelled groundwater contours, subsurface flows are limited to the south west and north east of the Gamsberg inselberg. The groundwater flows are consistent with the general surface topography in the area, which are indicative of an unconfined aquifer condition. Based on the mean annual effective recharge from mean annual precipitation relative to evaporation rates experienced in the region, groundwater is not seen as a viable source in the affected quaternaries due to an existing deficit in these catchments.
5.7 GEOCHEMISTRY
Key findings of a geochemical study of Gamsberg mine waste materials conducted by Wates, Meiring and Barnard (WMB, 2000) and SRK (2009) are presented below.
5.7.1 Waste rock
Wates, Meiring and Barnard (WMB) (2000) generated a composite sample to represent overburden material that would report to the waste rock dump. The proportion of each rock type in the composite sample was based on its average ratio in 10 cross-sections across the proposed pit area. The composition was as follows: Micaceous schist (21.4%), Amphibole (25.42%); White quartzite (33.8%), Dark quartzite (4.3%); and a 1:1 mix of GIF A and C Member rocks (8%). ABA test results indicated the waste rock sample would be net acid-generating due to the sulphide content of the included C Member rocks. By contrast, kinetic test results indicated a neutral (pH 6) leach with low SO4 (5 to 15 mg/l) and metal content, due to the rate of neutralisation exceeding that of oxidation. WMB characterised the sample as being essentially non-acid-generating, but warned that

ENVIRONMENTAL RESOURCES MANAGEMENT GAMSBERG ESIA REPORT
5-24
this could be sensitive to the relative proportion of C Member rocks included in the waste rock dump.
5.7.2 Tailings
WMB Study
WMB indicated that the mineralogical composition of the pilot plant tailings sample that they assessed in 2000 could be expected to reflect that of the hanging wall and footwall gangue material associated with the Gamsberg ore. The tailings were therefore expected to contain quartz, pyroxenoid, amphibole, garnet, magnetite, hematite and clinopyroxene. XRF results presented by WMB in 2000 (summarised in Table 5.5) indicated that the Gamsberg pilot plant tailings sample they received was dominated by Si, Fe, Al and S. With regard to trace elements, the sample was enriched in As, Co, Cu, Ni, Pb and V with minor amounts of Cr, Rb and Zr.
Table 5.5 Composition of Pilot Tailings Samples as Reported by WMB (2000)
Parameter WMB (2000) Tailings Major elements by XRF
SiO2 (%) 41.28 TiO2 (%) 0.41 Al2O3 (%) 6.00 Fe2O3 (%) 30.33 MnO (%) 1.53 MgO (%) 1.21 CaO (%) 0.94 Na2O (%) 0.60 K2O (%) 1.28 P2O5 (%) 0.39 Cr2O3 (%) 0.02 NiO (%) 0.01 H2O loss (%) 0.67 LOI (%) 13.02 S (ppm) 23.6 Cl- (ppm) 1565 F (ppm) < 50
Selected trace elements by XRF As (ppm) 518 Co (ppm) 191 Cu (ppm) 191 Ni (ppm) 92 Pb (ppm) 1 537 V (ppm) 79 Cr (ppm) 87 Rb (ppm) 86 Zr (ppm) 140
ABA testing of the tailings samples provided to WMB indicated a high potential for ARD generation as a result of both a high acid potential (AP up to 318 kg CaCO3/t) and a low neutralisation potential (NP < 1.5 kg CaCO3/t).
ENVIRONMENTAL RESOURCES MANAGEMENT GAMSBERG ESIA REPORT
5-25
The tailings were expected to initially generate leachate of neutral pH and relatively low concentrations of SO4 and metals. However, if the tailings were to be left exposed to air for a month or more on deposition, then WMB anticipated that they would generate enough acidity to consume all neutralising potential and result in an acidic, metal-laden leachate. The latter kinetic test programme generated leachates of 1 000 mg/l SO4, pH 2.8 and metal concentrations of up to 180 mg/l. WMB calculated the time to exhaustion of NP at 3 to 5 years compared to exhaustion of AP in approximately 1 200 years. They noted that this represented a conservative (worst case) estimate in that it assumed sufficient availability of oxygen to allow oxidation of all available pyrite/pyrrhotite, as well as assuming that all AP and NP occurred in an available form. SRK Study
In 2010, SRK Consulting undertook a desktop geochemical analysis of tailings samples in order to characterise the potential to generate acidic, saline and/or metal rich leachates. The following tests and analyses were undertaken for the solid fraction: • Static acid based accounting test; • Net Acid Generating (NAG) test; and • Total Digest.
Based on the liquid fractions obtained, the following analyses were undertaken: • pH; • EC; • Alkalinity; • major cations and anions; and • metal/metalloid concentrations.
Based on the results of the total metal concentration, the sample is characterised by iron and aluminium with relatively high concentrations of calcium, lead, magnesium, manganese and potassium. Furthermore, the tailings contained arsenic, cadmium, cobalt, copper, lead, manganese, nickel, titanium, chrome and zinc. The composition of the SRK tailings sample therefore displayed compositional similarity to the WMB 2000 tailings sample. The static tests conducted by SRK on a zinc rougher tailings sample they received in 2010 showed a high propensity for the tailings to generate acidity, due to its high sulphide content (32% sulphide-S) and limited neutralisation potential. The duration of kinetic testing at the time that SRK drafted the preliminary Memo was insufficient to draw full conclusions. SRK anticipated that subsequent leachates from the humidity cells would be of low pH, high SO4 and high metal content. The risk and the impact of the tailings would therefore have to be calculated and determined by undertaking longer term kinetic testing (to determine acid and neutralisation potential) and relating the findings to the hydrogeological model.

ENVIRONMENTAL RESOURCES MANAGEMENT GAMSBERG ESIA REPORT
5-26
5.8 FLORA
5.8.1 The Gamsberg Inselberg in a Regional Context
The Gamsberg inselberg sits within what is termed the Bushmanland Inselberg Region (BIR), which includes all the large, quartzite-capped inselbergs located in the northern Bushmanland plains in South Africa. The BIR is said to cover a total area of about 6 300 km² (Desmet, 2010). The BIR extends through the boundary between summer and winter rainfall systems in Southern Africa. Based on this location, the vegetation found on the plains and along the warmer north-facing slopes is characteristic of the Nama Karoo Biome whereas that of cooler higher-elevation plains and south-facing slopes is characteristic of the Succulent Karoo Biome. The overlap of these biomes makes these inselbergs a unique feature, thus forming the fundamental difference of these inselbergs as compared to other inselbergs found elsewhere in the Nama Karoo. Due to erratic rainfall experienced during different seasons, summer and winter rainfall flora can co-exist in this region, and thus contributing to its unique value. The vegetation found on these inselbergs forms a distinct centre of plant endemism located within the larger Eastern Gariep Centre of Endemism (Desmet, 2010), which includes the Orange River valley between Vioolsdrif and Pofadder/Onseepkans. As there are a number of species identified that is considered to be endemic to the Bushmanland inselbergs and the BIR itself, the region has been termed “Bushmanland Inselberg Centre of Endemism”. The extent of the BIR is reflected below. A regional investigation undertaken by Dr Phillip Desmet (2000), confirmed that the Gamsberg inselberg is considered to be the most regionally important inselberg in the BIR in terms of its biodiversity and composition. This was based on multiple criteria with which to compare and rank sites with other inselbergs. The Gamsberg inselberg has the highest number of plant species of other inselbergs surveyed, which are representative of the entire regional flora. The plant diversity is unique at a local, regional and global perspective, especially in light of the diversity of species, habitats, presence of rare species and size of specific plant populations.

ENVIRONMENTAL RESOURCES MANAGEMENT GAMSBERG ESIA REPORT
5-27
Figure 5.14 The Extent of the BIR
(Sourced Desmet, 2010)
5.8.2 Regional Botanical Analysis
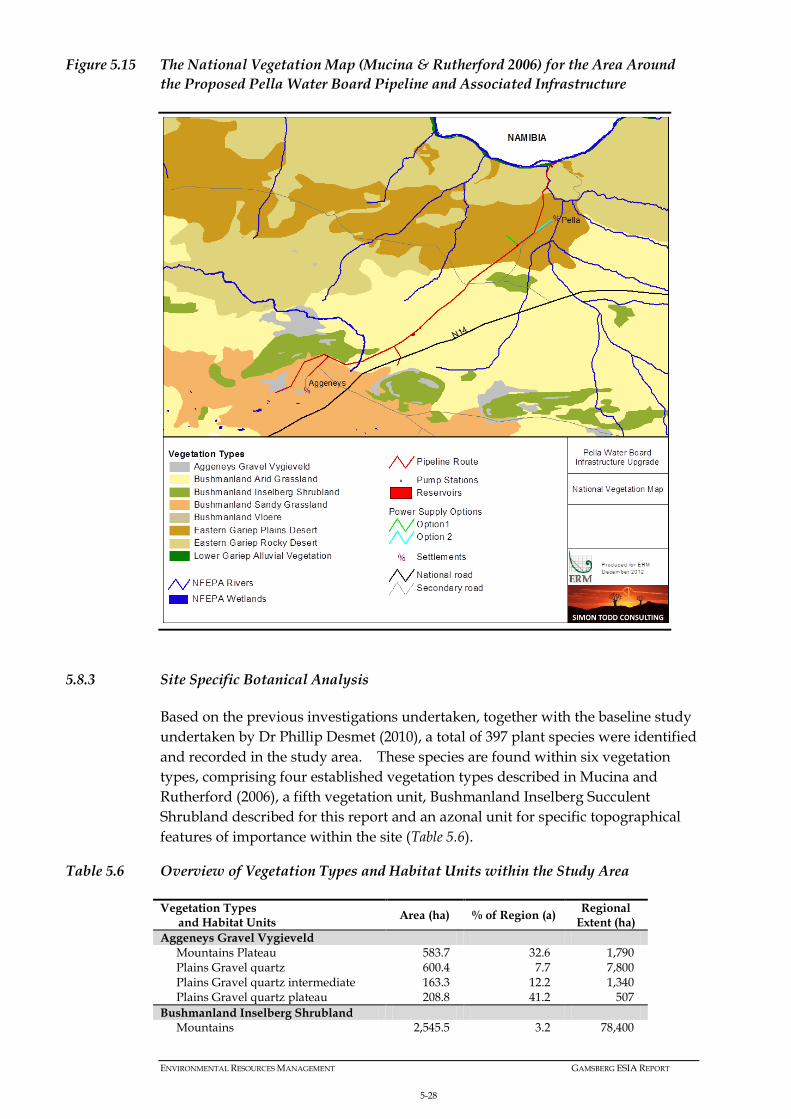
The national vegetation map (Mucina & Rutherford 2006) for the Study Area is depicted below in Figure 5.17. The area is remarkably heterogeneous for an arid area, with eight different vegetation types present within the broader Study Area. The vegetation diversity reflects the topographic and edaphic diversity of the area, with the Orange River valley with flanking mountain ranges, the open plains of the Bushmanland Plateau and the inselbergs breaking the monotony of the plains. Added to this is a diversity of substrates which include sandy plains, gravel, quartz and calcrete plains, rocky slopes and outcrops and drainage lines. In addition to this, the majority of vegetation types have not been heavily impacted by transformation and are still more than 95% intact (refer to Table 5.8 below). According to the National List of Threatened Ecosystems, only Lower Gariep Alluvial Vegetation is listed as Endangered on account of the large amount of transformation this unit has experienced owing to intensive agriculture in the area.
ENVIRONMENTAL RESOURCES MANAGEMENT GAMSBERG ESIA REPORT
5-28
Figure 5.15 The National Vegetation Map (Mucina & Rutherford 2006) for the Area Around the Proposed Pella Water Board Pipeline and Associated Infrastructure
5.8.3 Site Specific Botanical Analysis
Based on the previous investigations undertaken, together with the baseline study undertaken by Dr Phillip Desmet (2010), a total of 397 plant species were identified and recorded in the study area. These species are found within six vegetation types, comprising four established vegetation types described in Mucina and Rutherford (2006), a fifth vegetation unit, Bushmanland Inselberg Succulent Shrubland described for this report and an azonal unit for specific topographical features of importance within the site (Table 5.6).
Table 5.6 Overview of Vegetation Types and Habitat Units within the Study Area
Vegetation Types and Habitat Units Area (ha) % of Region (a) Regional
Extent (ha) Aggeneys Gravel Vygieveld
Mountains Plateau 583.7 32.6 1,790 Plains Gravel quartz 600.4 7.7 7,800 Plains Gravel quartz intermediate 163.3 12.2 1,340 Plains Gravel quartz plateau 208.8 41.2 507
Bushmanland Inselberg Shrubland Mountains 2,545.5 3.2 78,400

ENVIRONMENTAL RESOURCES MANAGEMENT GAMSBERG ESIA REPORT
5-29
Vegetation Types and Habitat Units Area (ha) % of Region (a) Regional
Extent (ha) Plains Rocky 626 3.8 83,000
Bushmanland Arid Grassland Plains Sandy flat 2,517.6 0.07 4,470,270 Plains Sandy hummocky 238.9 Plains Gravel calcrete 211.5 23.7 892
Bushmanland Sandy Grassland Plains Sandy mobile dunes 18.5 0.007 258,311
Azonal Kloof 176.6 - - Wash 1,173.0 - - Temporary rock pools No data - -
Bushmanland Inselberg Succulent Shrubland Study Area 480.0 10.4 4,600 Gamsberg only 400.0 8.7 4,600
(a) Region is defined as the Bushmanland Inselberg Region (BIR) The Aggeneys Gravel Vygieveld (Mucina and Rutherford, 2006), covers a total area of approximately 1 556 hectares within the study area, which is approximately 9% of the regional extent of this vegetation type. This vegetation type is generally found in Northern Cape Province, at elevations exceeding 950 m, and found generally along plateau summits of inselbergs and koppies. The vegetation in the region is characterised with sparse, low-growing species. The species found throughout the year are characterised by small to very small succulent plants, with a general absence of trees and grasses, except along drainage lines. Although the vegetation types can vary, Succulent Karoo vegetation is prominent in the area. This vegetation type has been divided into four habitat units within the study area (Table 5.6). The specific habitat unit of Mountains Plateau covers an area of approximately 587 hectares, which is equivalent to 36.7% of the regional extent of this habitat. Furthermore, the Plains Gravel Quartz Plateau habitat is also present, covering a total area of 208 hectares. This equates to 41% of the regional extent of this habitat type. The Bushmanland Inselberg Shrubland is comprised of two habitat units, covering a total area of just over 3 000 hectares within the study area (Table 5.6) and subdivided into two habitat units, namely the Mountains and Plains Rocky. The habitat units present on-site contain between 3,2% and 3,8% of the regional extent of these habitat units. The Bushmanland Inselberg Shrubland is generally found at elevations varying from 850 m – 1 150 m, typically found on the slopes of inselbergs and koppies. The vegetation is characterised with sparse to dense vegetation with varied composition. The vegetation is a mixture of low-growing grasses, leaf-succulent Karoo shrubs, microphyllous and spinescent karoo shrubs and succulent trees. The Bushmanland Arid Grassland vegetation type is present in the region, and contains three specific habitat units, namely, Plains Sandy flat, Plains Sandy hummocky and Plains Gravel Calcrete, which cumulatively covers a total area of approximately 3 000 hectares (Table 5.6). Of the three habitat units, the Plains Gravel calcrete forms the smallest area (ie 211.5 hectares), however equates to 23.7% of the regional extent of this vegetation type and represented by numerous isolated patches. The remaining habitat units form less than 1% of the regional

ENVIRONMENTAL RESOURCES MANAGEMENT GAMSBERG ESIA REPORT
5-30
extent of their respective vegetation units. The Bushmanland Arid Grassland vegetation is the dominant vegetation on the sandy plains around the base of the Gamsberg inselberg is and also extends along the plains to the north of the N14. The vegetation is typical of extensive grasses extending along sandy plains, containing a variety of shrubs. Due the arid nature of the unit, which receives between 70 and 200 mm annual rainfall, it has not been significantly disturbed by intensive agriculture and more than 99% of the original extent of the vegetation type is still intact.
Figure 5.16 Example of Bushmanland Arid Grassland Vegetation Type
The Bushmanland Sandy Grassland vegetation type is comprised of a single habitat unit called the Plains Sandy mobile dunes (Table 5.6). This habitat type covers a total area of 18.5 hectares, which equates to less than 1% of the regional extent of this vegetation type. The Bushmanland Sandy Grassland is generally found from the south of Aggeneys to the north of Pofadder, along large sand dunes present on the region. The vegetation is characterised as sparse to dense, with loose sandy grassland on dune ridges with a wealth drought-resistant shrubs and trees. Although no endemic flora species are listed for this vegetation unit, it is not very well known suggesting that there may be such species present. This vegetation unit is however the habitat of the Red Lark Calendulauda burra which is an endemic species that is listed as Vulnerable. An Azonal vegetation type was identified and is comprised of three vegetation habitat units, namely, Kloof, Wash and Temporary Rock Pools. The vegetation found in these habitats is generally comprised of surrounding vegetation as well as vegetation specific to the features (i.e. springs). The kloof on the northern portion of the Gamsberg inselberg is considered the largest in the BIR, covering a total area of 177 hectares. This Kloof comprises three separate but interlinked kloofs, which are as follows: • A main south-north kloof draining the basin in the interior of the inselberg; • An eastern kloof draining the north-eastern plateau; and

ENVIRONMENTAL RESOURCES MANAGEMENT GAMSBERG ESIA REPORT
5-31
• A western kloof, the smallest of the three, draining the north-western plateau.
With respect to vegetation types, the Kloofs contain Bushmanland Inselberg Shrubland along the north-facing slopes, Bushmanland Inselberg Succulent Shrubland along the south-facing slopes and lastly, wash vegetation in the floor of the Kloof. Wash vegetation type contains all drainage lines present in the Gamsberg inselberg and is characterised with many species found in the surrounding area. Due to seasonal rainfall experienced in the region, periodic flooding has created a high natural disturbance habitat, which some species have suitably adapted to. Lastly, temporary rock pools are pan like structures that develop ephemeral pan ecosystems, based on standing water in these rock pools. Generally, perennial plant species are absent in these rock pools, however, the ecosystem is recognised as a unique and complex ecosystem based on the faunal communities and extreme spatial and temporal heterogeneity and dynamics (Desmet, 2010). Lastly, the Bushmanland Inselberg Succulent Shrubland vegetation type has been defined on site as a distinctive vegetation type but is considered to extend throughout the BIR. This categorisation was undertaken in order to accommodate vegetation found on the upper (>950m) south-facing slopes of the Gamsberg inselberg. The Bushmanland Inselberg Succulent Shrubland is limited to the upper south-facing slopes (above approximately 950m) of the Gamsberg and adjoining inselbergs in the south of the study area. The vegetation is generally characterised with dense coverage of leaf-succulent shrubs, leaf-deciduous shrubs, trailing stem succulents and tree succulents.
Figure 5.17 Typical Composition of Bushmanland Inselberg Succulent Shrubland along Southern Face of Gamsberg Inselberg
A brief census was undertaken to review the relative population size of gravel-patch specialist plant species. A total of 13 patches were identified and assessed, which contained a total number of approximately 40 000 plants (Desmet, 2010).

ENVIRONMENTAL RESOURCES MANAGEMENT GAMSBERG ESIA REPORT
5-32
However, despite the sizes of these gravel patches, the importance of these gravel patches is measured in terms of specie density and habitat size. Further detailed analysis of gravel patches will be presented during the scoping phase.
Figure 5.18 Plains Quartz Gravel Patch at northern eastern base of Gamsberg Inselberg
5.8.4 On-Site Features of Botanical Concern
Based on previous investigations undertaken by Desmet (2000 and 2010), species of biodiversity concern were defined and assessed in terms of botanical sensitivity/ importance. The criteria used to define the species were rare, endemic or threatened plant species. These criteria considered the Gamsberg Centre of Endemism, IUCN threatened status (Red Data Listed species), rare species (restricted to 3 or less inselbergs) and relic species (common in their core range but rare in the BIR and considered relics of past wetter or drier climates). Using these criteria, the following species of conservation concern were identified:
Table 5.7 Species of Conservation Concern Present in the Study Area (Sourced Desmet, 2010)
Species Conservation Status Habitat
Anacampseros bayeriana Rare Calcrete gravel patches Crassula mesembrianthemopsis Rare Calcrete gravel patches Titanopsis hugo-schlechteri var. hugo-schlechteri Rare Calcrete gravel patches Conophytum ratum (plains form) END & VU Plains quartz gravel patch Mesembryanthemum inachabense END Plains quartz gravel patch Trachyandra sp.nov. END (DD) Plateau Tylecodon sulphureus END Plateau Adromischus nanus END Plateau quartz gravel patch Conophytum angelicae subsp. angelicae (dwarf form) Rare Plateau quartz gravel patch Conophytum ratum (dwarf/plateau form) END & VU Plateau quartz gravel patch Aloe microstigma Relic South slopes Conophytum limpidum (dwarf form) END South slopes Othonna sp. nov. END South slopes Sceletium tortuosum Relic South slopes Azima tetracantha Relic Springs Hydrodictyon sp.nov. END (DD) Kloof END – Endemic to the Bushmanland Inselberg Centre of Endemism;

ENVIRONMENTAL RESOURCES MANAGEMENT GAMSBERG ESIA REPORT
5-33
Species Conservation Status Habitat
VU – Vulnerable (IUCN Red List); (DD) represent undescribed species (sp.nov) and are considered within this report as Data Deficient in terms of the IUCN Red List criteria
Based on the species of conservation concern identified above, together with habitat rarity, ecosystem functioning and status, habitats of specialist concern were identified. A total of 11 habitats of special concern were identified, as presented in Table 5.8.
Table 5.8 Habitats of Conservation Value (Sourced Desmet, 2010)
Habitat name Criteria notes Kloofs Rare habitat, climate refuge, keystone resource (water). Springs Very rare habitat, climate refuge, keystone resource (water). Headwater Seeps Very rare habitat, keystone resource (forage). Headwater catchments Ecological support area. Temporary Rock Pools Very rare habitat. Plateau Quartz Gravel Patches Endemic species and rare habitat. Plains Quartz Gravel Patches Endemic species. Plateau Climate refuge and rare habitat. Calcrete Gravel Patches South Slopes Climate refuge. Washes Conduits for water movement in the landscape. During the baseline investigation undertaken (Desmet, 2010), it was confirmed that the habitats of conservation value were not rated and ranked in terms of sensitivities. Additional information in the form of detailed and quantitative assessments, together with further data sets to augment the population levels analysis. This exercise will be undertaken as part of the ESIA phase and the findings presented thereto. A limited amount of off-site infrastructure will be placed within sections of Eastern Gariep Plains Desert. This vegetation unit occupies the gently sloping plain towards the Orange River on sandy, gravel and stony soils. The extent found within the Study Area shows signs of prolonged heavy grazing, and is a relatively restricted vegetation unit which occupies 1578 km2 of the sloping plains and washes between the mountains of the Orange River from Henkries, Goodhouse, Kabis, Klein Pella to Onseepkans.
5.8.5 Off-site Features of Botanical Concern
A total of 132 plant species were observed at the site over the two site visits, and is considered representative of the perennial component of the vegetation. Of a total of 550 species known from the area, 30 species are of conservation concern (SANBI, 2012) but only four of these listed species were observed in the development footprint, Lithops olivacea (VU), Acacia erioloba (Declining), Aloe dichotoma (VU) and Hoodia gordonii (DDD). None of these species are especially rare or threatened and the loss of some individuals of these species as a result of the development would not be likely to compromise the local or regional populations of these species.

ENVIRONMENTAL RESOURCES MANAGEMENT GAMSBERG ESIA REPORT
5-34
5.8.6 Critical Biodiversity Areas and Broad-Scale Processes
The Gamsberg site lies within the planning domain of the Namakwa Biodiversity Sector Plan (Desment & Marsh, 2008). This biodiversity assessment identifies Critical Biodiversity Areas (CBAs) which represent biodiversity priority areas which should be maintained in a natural to near natural state. The CBA maps indicate the most efficient selection and classification of land portions requiring safeguarding in order to maintain ecosystem functioning and meet national biodiversity objectives. As can be seen from the CBA map for the area, depicted below in Figure 5.18, the CBAs in the area are complex and reflect the landscape diversity in the area as well as the abundance of specific habitats of conservation significance. Various broad-scale Ecological Support Areas are present and intended to promote the maintenance of the broad-scale connectivity of the landscape. This includes parts of the pipeline route near Pella, after it emerges from the canyon as well as a large proportion of the pipeline between the Horseshoe and Kokerboom reservoirs.
Figure 5.19 Critical Biodiversity Areas Map for the Area Surrounding the Proposed Pella Water Board Pipeline and Associated Infrastructure
Source: CBA map for the Namakwa District as produced by Desment & Marsh (2008)

ENVIRONMENTAL RESOURCES MANAGEMENT GAMSBERG ESIA REPORT
5-35
5.9 FAUNA
Faunal baseline studies were undertaken to update the existing faunal assessment previously undertaken during the initial EIA process (2000). Recent baseline studies have been undertaken by GroundTruth (2013) within the Gamsberg concession and by Simon Todd Consulting (2013) for the greater area. The findings of these investigations are presented below.
5.9.1 Terrestrial Invertebrates
Based on the field work and observations undertaken, it was confirmed that no Red Listed invertebrate species were identified in the Gamsberg region (Groundtruth, 2010). This was said to unlikely change through further investigations as most of the Red List invertebrates in South Africa are butterfly’s, none of which are expected to occur in the Gamsberg region. A total of 13 ant species were identified during the baseline study in 2010, which was undertaken during the dry season. It is speculated that this number of ant species could increase dramatically should a survey be undertaken during the wet season. Two ant species potentially endemic to the Northern Cape and Southern Namibia were identified during field observations (Groundtruth, 2013), which are as follows: 1. The pale Messor species (Figure 5.19); and 2. A Camponotus fulvopilosus-group species (Figure 5.20). The Camponotus species is distinct from the Karoo form of C. fulvopilosus commonly occurring in the region. The pale Messor species could not be identified using available keys, and currently remains as undescribed.
Figure 5.20 Undescribed Messor Species found in the Gamsberg Basin

ENVIRONMENTAL RESOURCES MANAGEMENT GAMSBERG ESIA REPORT
5-36
Figure 5.21 Undescribed Camponotus Fulvopilosus-group Species (left) Compared with the Karoo form of C. fulvopilosus (right) Commonly found at Gamsberg and in the Surrounding Regions
Scorpions
At least 24 scorpion species are expected to occur in the Gamsberg and surrounding areas, which are well known for exhibiting exceptionally high diversity of this group. A total of eight species have been confirmed present to date, but this is almost certainly an under representation of this group. However the species recorded includes four species that are protected within the Northern Cape.
Figure 5.22 Photographs of Parabuthus schlechteri (Left) and Parabuthus laevifrons (Right) Recorded from the Gamsberg Study Area
A significant observation during the 2012 was the high abundance and diversity observed in the wash area at the mouth of the kloof on the north of the Gamsberg. This may be due to relatively higher soil moisture levels here during the dry season resulting in more growing vegetation and consequently a higher abundance of the associated invertebrate prey on which the scorpions could feed.

ENVIRONMENTAL RESOURCES MANAGEMENT GAMSBERG ESIA REPORT
5-37
5.9.2 Amphibians
On-site
Three species of frog were recorded within the study area during the herpetofaunal surveys, namely Paradise Toad (Vandijkophrynus robonsoni), Cape Sand Frog (Tomopterna delalandii) and Marble Rubber Frog (Phynomantis annectens). The Gamsberg may support a slightly greater diversity of frogs in total, with up to nine species possible (Minter et al., 2004), however, the site falls within the ‘Namqualand Assemblage’ (Alexander et al., 2004) that supports relatively low amphibian diversity. No Red Data species are known or expected to occur within the study area. All three species of frog recorded within the study area are listed under Schedule 2 of the Northern Cape Nature Conservation Act (Act 9 of 2009) as “Protected”.
Figure 5.23 Paradise Toad Identified at Gamsberg Inselberg
Off-site
The site lies within the distribution range of a maximum of 10 frog species. However given the distance of the development sites to fresh water, the greater area is not likely to be important for very many amphibians. Given the likely low abundance of amphibians at the affected sites, the developments are not likely to have a significant impact on amphibians.

ENVIRONMENTAL RESOURCES MANAGEMENT GAMSBERG ESIA REPORT
5-38
5.9.3 Reptiles
On-site
The Gamsberg area supports a relatively rich diversity of reptiles, given the diversity of habitats and the presence of mountainous, rocky terrain, which supports a number species that do not occur on the surrounding low-lying plains that make up much of the broader landscape. Twenty-four species of reptile were recorded during the herpetofaunal surveys, including four snakes, 16 lizards, comprising eight species of gecko, and one tortoise. It is likely that the full species richness is closer to 40-50 species. Several reptile species in and around the Gamsberg inselberg were identified during the dry season investigation undertaken by GroundTruth (2013). The most commonly found reptile specie was the Variegated Skink (Trachylepis variegata), which was present in a range of habitats. The diversity of species identified is presented below in Table 5.10.
Table 5.9 Reptiles Recorded in the Gamsberg (GroundTruth, 2013)
Reptile Species Lizards and Geckos Namaqua Dwarf Legless Skink (Acontias tristis) Western Rock Skink (Trachylepis sulcata) Western Three-striped Skink (Trachylepis occidentalis) Variegated Skink (Trachylepis variegata) Ground Agama (Agama aculeata) Anchieta's Agama (Agama anchietae) Giant Ground Gecko (Chondrodactylus angulifer) Bibron's Gecko (Chondrodactylus bibronii) Striped Dwarf Leaf-toed Gecko (Goggia lineata) Spotted Desert Lizard (Meroles suborbitalis) Haacke’s Gecko (Pachydactylus haackei) Quartz Gecko (Pachydactylus latirostris) Montane Gecko (Pachydactylus montanus) Rough-skinned Gecko (Pachydactylus rugosus) Plain Sand Lizard (Pedioplanis inornata) Barking Gecko (Ptenopus garrulous maculatus) Karoo Girdled Lizard (Karusasaurus polyzonus) Plain Sand Lizard (Pedioplanis inornata) Namaqua Sand Lizard (Pedioplanis namaquensis) Western Rock Skink (Trachylepis sulcata) Snakes Schinz's Beaked Blind Snake (Rhinotyphlops schinzi) Karoo Sand Snake (Psammophis notostictus) Beetz’s Tiger Snake (Telescopus beetzi) Coral Shield Cobra (Aspidelaps lubricus) Black Spitting Cobra (Naja nigricollis woodi) Cape Cobra (Naja nivea) Desert Mountain Adder (Bitis xeropaga)
Tortoises Tent Tortoise (Psammobates tentorius )

ENVIRONMENTAL RESOURCES MANAGEMENT GAMSBERG ESIA REPORT
5-39
Figure 5.24 Various Geckos Recorded from the Study Area,
Haacke’s Gecko Pachydactylus haackei, Namaqua Mountain Gecko Pachydactylus montanus and Desert Mountain Adder Bitis xeropaga, are three other species that are range-restricted endemics confined to the lower Gariep River and adjacent regions, and are habitat specialists, restricted to rocky, mountainous habitat. All three of these species were recorded in the study area during the November 2012 survey (Namaqua Mountain Gecko was also recorded in the 2009 survey). Off-site
The site lies in or near the distribution range of at least 60 reptile species, comprising 1 tortoise, 25 snakes, 26 lizards and skinks, 12 geckos and 1 chameleon. A significant proportion of these are however associated with the Orange River and the adjacent mountains and not likely to occur within the footprint of the current developments. The habitat diversity within the affected areas is very low and is restricted to lowland sandy habitats and hence the reptile fauna is likely to be restricted to species associated with these habitats. Species observed in these areas include Ground Agama Agama aculeata, Spotted Desert Lizard Meroles suborbitalis, Plain Sand Lizard Pedioplanis inornata and Bushmanland Tent Tortoise Psammobates tentorius verroxii. The impacts on reptiles are not likely to be highly significant when considered in the landscape context and the relatively minor habitat loss resulting from the infrastructure. Furthermore, development such as the housing development would create novel habitat that would be utilised by species adapted to homes and gardens such as some geckos and skinks.
5.9.4 Avifauna
On-site
A total of 46 bird species have been recorded by GroundTruth (2013) during field surveys. These sightings supplement previous detailed avifaunal surveys conducted in April 1999 (Harrison and Harebottle, 2000) and records from the
To row: Barking Gecko (Ptenopus garrulous maculatus); Haacke’s Gecko (Pachydactylus haackei); Rough-skinned Gecko (Pachydactylus rugosus); Lower Row: Namaqua Mountain Gecko (Pachydactylus montanus); Striped Dwarf Leaf-toed Gecko (Goggia lineata); Quartz Gecko (Pachydactylus latirostris);
ENVIRONMENTAL RESOURCES MANAGEMENT GAMSBERG ESIA REPORT
5-40
South African Bird Atlas Project 2 (SABAP2), to produce a list of 87 bird species for the Gamsberg area. The diversity of birds is thus relatively high within the regional context (~ 35% species representation at Gamsberg), which is driven largely by the diverse range of habitats. The birds recorded at Gamsberg area can broadly be divided into four main communities based on the broader, topographical habitat types, namely Plains, Slopes and kloof, Plateaux and the Basin. This list includes four Red Listed and 14 range restricted bird species have been recorded within the study area. The Red listed species include Martial Eagle (Polemaetus bellicosus) listed as Vulnerable, Lanner Falcon (Falco biarmicus) and Secretarybird (Sagittarius serpentarius) both listed as Near Threatened. Other raptors observed include Verreaux's Eagle (Aquila verreauxii) which nest within the site, Jackal Buzzard (Buteo rufofuscus), Southern Pale Chanting (Goshawk Melierax canorus) and Greater Kestrel (Falco rupicoloides). Off-site
The bird species richness for the greater area is rather low due to the limited diversity if habitats and the arid conditions, however the site lies within an important area for several listed species as well as many biome-restricted species. The area around Aggeneys, particularly those areas consisting of Bushmanland Sandy Grassland lie within an Important Bird Area (IBA) as defined by Birdlife South Africa. This IBA known as the Haramoep and Black Mountain Mine Nature Reserve IBA (Birdlife South Africa - Bird Area factsheet: SA 035), extends from south of the N14 near Aggeneys to the Orange River in the north and includes both red sand dunes associated with the Koa River valley as well as barren stony plains between Aggeneys and Orange River. Only the western-most section of the pipeline near the Kokerboom Reservoir is actually within the IBA. According to the description provided by Birdlife South Africa for the IBA, this is one of the few sites protecting both the globally threatened Red Lark (Certhilauda burra), which inhabits the red sand dunes, and the near-threatened Sclater's Lark (Spizocorys sclateri), which occurs erratically on the barren stony plains. The area is also home to 16 of the 23 Namib-Karoo biome-restricted species, as well as a variety of other arid-zone birds. Other significant species in area associated with mountainous areas such as the Haramoep mountains to the north of the site include Black Stork (Ciconia nigra), Verreaux's Eagle (Aquila verreauxii), Booted Eagle (Hieraaetus pennatus), Peregrine Falcon (Falco peregrinus), Cape Eagle-Owl (Bubo capensis) and Bradfield's Swift (Apus bradfieldi).
Table 5.10 Range- and Biome-restricted Species Which Occur Within the Haramoep and Black Mountain Mine Nature Reserve IBA and Their Frequency as Estimated by Birdlife SA for the IBA
Name Status Name Status Ludwig's Bustard Common Karoo Korhaan Common Karoo Long-billed Lark Common Red Lark Fairly Common Sclater's Lark Uncommon Stark's Lark Uncommon Black-eared Sparrow-lark Fairly Common Tractrac Chat Fairly common Sickle-winged Chat Fairly Common Karoo Chat Common

ENVIRONMENTAL RESOURCES MANAGEMENT GAMSBERG ESIA REPORT
5-41
Name Status Name Status Layard's Titbabbler Common Karoo Eremomela Common Cinnamon-breasted Warbler Common Namaqua Warbler Uncommon Pale-winged Starling Fairly Common Sociable Weaver Common Black-headed Canary Fairly Common
5.9.5 Mammals
On-site
A total of 37 mammal species have been recorded from the Gamsberg area. This includes the 29 species recorded during the Anderson (1999) survey with an additional six species recorded by GroundTruth (2013). Table 5.12 provides a list of the mammals recorded. The results from these surveys highlights that the Gamsberg area supports over 50% of the expected regional diversity.
Table 5.11 Mammal Species Recorded Within the Gamsberg Study Area (GroundTruth, 2013)
Mammal Species Elephant-shrews Primate Western Rock Elephant-shrew (Elephantulus rupestris) Chacma Baboon (Papio ursinus) Round-eared Elephant-shrew (Macroscelides proboscideus) Carnivores Bats Brown Hyaena (Hyaena brunnea) NT Cape Horseshoe Bat (Rhinolophus capensis) NT, END Caracal (Felis caracal) Darling’s Horseshoe Bat (Rhinolophus darlingi) African Wild Cat (Felis silvestris) Robert’s Flat-headed Bat (Sauromys petrophilus) Leopard (Panthera pardus) NT Rabbits and Dassies Black-backed Jackal (Canis mesomelas) Scrub Hare (Lepus saxatilis) Bat-eared Fox (Otocyon megalotis) Smith's Red Rock Rabbit (Pronolagus rupestris) Cape Fox (Vulpes chama) Rock Dassie (Procavia capensis) Striped Polecat (Ictonyx striatus) Rodents Small Grey Mongoose (Galerella pulverulenta) Porcupine (Hystrix africaeaustralis) Slender Mongoose (Galerella sanguinea) Springhare (Pedetes capensis) Small Spotted Genet (Genetta genetta) Dassie Rat (Petromus typicus) NT Water Mongoose (Atilax paludinosus) Cape Ground Squirrel (Xerus inauris) Aardvark Namaqua Rock Mouse (Aethomys namaquensis) Aardvark (Orycteropus afer) Striped Mouse (Rhabdomys pumilio) Antelope Short-tailed Gerbil (Desmodillus auricularis) Springbok (Antidorcas marsupialis) Hairy-footed Gerbil (Gerbillurus paeba) Klipspringer (Oreotragus oreotragus) Karoo Bush Rat (Otomys unisulcatus) Steenbok (Rhaphicerus campestris) Littledale's Whistling Rat (Parotomys littledalii) NT Common Duiker (Sylvicapra grimmia) Pygmy Rock Mouse (Petromyscus collinus)
END – Endemic to South Africa; NT – Near Threatened
Figure 5.25 Examples of Small Mammals Recorded Within the Gamsberg Study Area

ENVIRONMENTAL RESOURCES MANAGEMENT GAMSBERG ESIA REPORT
5-42
Western Rock Elephant-shrew (Elephantulus rupestris)
Short-tailed Gerbil (Desmodillus auricularis)
Namaqua Rock Mouse (Aethomys namaquensis)
Four small mammals listed as Near Threatened were recorded during surveys, while incidental reports of Leopard and Brown Hyaena were received during the 2012 survey by GroundTruth. There was a recent report of a Brown Hyaena in the town of Aggeneys. Two of the mammal species recorded during the 2009 and 2012 surveys are listed as “Specially Protected under the Northern Cape Conservation Act (2009) Schedule 1, namely African Wild Cat and Striped Polecat.
Off-site
The areas surrounding the Gamsberg fall within the distribution range of up to 48 terrestrial mammals and 8 bats, indicating a high potential mammal diversity. The Black-footed Cat Felis nigripes (Vulnerable) is likely to occur across the site at low density, but is widely distributed across the arid parts of the country and the possible impacts on this species would be minimal. It was observed that many of the smaller burrowing mammals such as Ground Squirrel were preferentially using the existing pipeline footprint for the burrows. Although large parts of the site consist of relatively soft sand, it is usually not very deep and overlays a hard calcrete or ferricrete hardpan. As the existing pipeline lies within or beneath this layer, the footprint provides an area where the hardpan has been broken and borrows can be constructed with relative ease. Although this is not viewed as an overall benefit of the development, it nevertheless serves to illustrate that the impacts of the disturbance are not exclusively negative and that fauna are quick to adapt and take advantage of the situation.
5.9.6 Aquatic Biodiversity
The aquatic baseline may be characterised by two main aquatic ecosystems present within and around the Gamsberg inselberg, namely the springs within the kloof and on the north and northeast of the inselberg, and the river intermittently running through the kloof to the north and a much smaller drainage line on the east of the inselberg. Springs appear to be artesian and fed by the local groundwater table, and are largely perennial in nature. However, most of the flow from the springs disappears within a short distance from their origin. Pools may be present for lesser or greater periods of the year, particularly within the kloof, and these are maintained to some extent by the springs. During particularly wet periods as a result of thunderstorms or sustained rainfall over the region, surface wash and runoff within the main basin of the inselberg drains out through the kloof. The main channel of these systems is predominantly bedrock in nature and contained within the kloof. The main channel consists of a repeating sequence of bedrock pools and dry riffle/cobble sections. These riffle sections would only activate during intermittent flow periods associated with rainfall within the inselberg main basin.
ENVIRONMENTAL RESOURCES MANAGEMENT GAMSBERG ESIA REPORT
5-43
Besides the springs, the pools are the most persistent aquatic feature within this system and a key feature of the uniqueness of this environment. A number of other ecosystem processes are co-dependent on these water sources; e.g. as a direct water sources but also for food material and as a conduit and resupply route for material on the washout zone to the north of the inselberg. Diatoms were sampled and taken for analysis from four sites during the May 2009 and November 2012 surveys (Groundtruth, 2013), which included springs located to the south and south east, as well as the Gamsberg River and Gamsberg Spring. Results of the diatom sampling revealed that the aquatic ecosystems of Gamsberg are generally in a “poor” ecological state. Given that there were no obvious signs of water quality/river heath degradation, it would seem that this is rather a consequence of the sampled systems consisting of stagnant pools. The likely effect of this would be that any nutrients (or other water quality parameters) will accumulate, resulting in these parameters becoming more concentrated. Possible sources of nutrients could include any organic matter that enters into the pools. Diatom indices are designed to reflect a number of potential environmental impacts, the chief of these being plant nutrients, organic matter and salts. An increase in any of these water quality variables is generally deemed to be indicative of some form of pollution. Although diatom indices generally give a good indication of environmental conditions they may show a pollution impact were none exists in the case of naturally highly saline waters or waters with intermittent flow. One of the four water sources identified had flowing water (i.e. Gamsberg stream) and was suitable for application of the SASS5 method to determine aquatic integrity. This study revealed the ecological conditions of the Gamsberg stream to be “poor”, based on the aquatic macro-invertebrates present, the families and their respective tolerances to water quality.
5.9.7 Assessment of Faunal Species and Species-specific Habitats
Information of fauna recorded from the study area and their respective species-specific habitats was used to assess the level of dependence of fauna on the available habitats in the area. Habitats were grouped into three categories based on local and regional importance and sensitivity, these being:
• Irreplaceable (H1) – kloof, ephemeral watercourses, springs, seeps and rock pools;
• Constrained (H2) – cliffs, rocky slopes, outcrops, and crevices, mountain plateaux and drainage basin; and
• Flexible (H3) – flat plains. Key faunal species present within the Gamsberg study area were evaluated according to their dependence on each of the three habitat categories and against the habitats that will be lost, heavily affected and unaffected. All species of invertebrates, frogs and reptiles were evaluated in this manner; whereas only the

ENVIRONMENTAL RESOURCES MANAGEMENT GAMSBERG ESIA REPORT
5-44
species of concern (Red Data Near Threatened and Vulnerable species) were evaluated for the birds and mammals. The information obtained from the evaluation tables highlights key species that are potentially affected by the proposed Gamsberg Project, providing further insight to assessing their degree of sensitivity within the context of the project. Table 5.12 provides a consolidation of key fauna, assessed on their level of habitat dependence, the significance of impact on each group and their offset potential.
Table 5.12 Overview of the Potential Level of Impact Caused by the Mining Development on Key Faunal Species Present Within the Gamsberg Study Area
Species and Common Name
IUCN Red List Status
Habitat Dependence
Extent of range affected (Impact
Intensity)
Impact Significance on Species
Offset potential
Invertebrates Camponotus sp.nov. (AFRC-ZA-52)
(DD) Medium (H1 & H2)
High Medium Medium (RR)
Messor sp.nov. (AFRC-ZA-01)
(DD) Possible CR
High (only H2)
Medium Medium to High
Low - Medium (RR)
Herpetofauna Vandijkophrynus robinsoni Paradise Toad
Low (H1, H2 & H3)
Medium Low Medium (RR)
Strongylopus springbokensis Namaqua Stream Frog
Medium (H1 & H2)
High Medium Medium (RR)
Cacosternum namaquense Namaqua Caco
Medium (H1 & H2)
High Medium Medium (RR)
Pachydactylus goodi Good’s Gecko
VU Medium (H1 & H2)
Medium Medium Medium (RR)
Pachydactylus haackei Haacke’s Gecko
Medium (H1 & H2)
Medium Medium Medium (RR)
Pachydactylus montanus Namib Mountain Gecko
Medium (H1 & H2)
Medium Medium Medium (RR)
Bitis xeropaga Desert Mountain Adder
High (only H2)
Medium Medium to
High Medium (RR)
Birds Falco biarmicus Lanner Falcon
NT Medium (H1 & H2)
Low Low High
Polemaetus bellicosus Martial Eagle
VU Medium (H1 & H2)
High Medium to
High High
Mammals Rhinolophus capensis Cape Horseshoe Bat
NT Medium (H1 & H2)
High Medium to
High Medium
(Endemic) Rhinolophus darlingi Darling’s Horseshoe Bat
NT Medium (H1 & H2)
High Medium to
High High
Parotomys littledalii Littledale's Whistling Rat
NT Medium (only H3)
Medium Medium Medium
Petromus typicus Dassie Rat
NT High (only H1) habitat
specialist
Medium Medium to High
Medium
CR – Critically Endangered; VU – Vulnerable; NT – Near Threatened; LC – Least Concern H1 – Irreplaceable habitats; H2 – Constrained habitats; H3 – Flexible habitats; RR – Range restricted

ENVIRONMENTAL RESOURCES MANAGEMENT GAMSBERG ESIA REPORT
5-45
5.10 AIR QUALITY
5.10.1 Existing Air Quality Within The Region
Based on the air quality baseline studies undertaken by SRK Consulting (2010), the following existing sources of emissions were identified: • Agricultural activities; • Fugitive dust sources (windblown dust especially during the dry season); • Vehicle Tailpipe Emissions; • Household fuel combustion; and • Mining operations in the region.
Previous dust monitoring revealed the following results:
Table 5.13 Dust Deposition Results for June 2009 to October 2009
Location Monthly Averaged Concentrations (mg/m2/day)
June July August September October
GAM A1 109 1143 3 288 13
GAM A2 64 990 3 1957 216
GAM A3 73 1673 3 1759 12
GAM A4 161 2733 186 1305 142
GAM A5 246 1262 10 1765 241
GAM A6 6 1978 19 1901 67
GAM A7 679 1357 188 582 28
GAM A8 20 1557 564 1528 320
GAM A9 8 2028 630 665 298
GAM A10 5 2554 836 1796 400
Action Residential a 600
Action Industrial a 1200
Alert Threshold a 2400
a SANS 1929:2005 Source: DDA Environmental Engineers.
The dominant form of farming currently undertaken in the region is livestock farming. Due to climatic conditions, crop farming is prevalent along the Orange River. The activity of ploughing is generally limited to small plots of land, and not part of larger commercial farming activities. Due to the scale of farming in the region, agricultural activities are seen as a minor contributor to particulate matter (ie PM10 and Total Suspended Particles) concentrations in the region. Coal and wood are the dominant fuel source for the rural communities and can be responsible for the airborne particulates. Gaseous pollutants such as sulphur dioxide (SO2), nitrogen oxides (NOx), carbon monoxide (CO) and carbon dioxide (CO2), together with airborne particulate matter are the main emissions from coal
ENVIRONMENTAL RESOURCES MANAGEMENT GAMSBERG ESIA REPORT
5-46
and wood combustion. However, as the proposed area is sparsely populated, the expected levels of emissions contribution from wood and coal combustion are likely to be negligible. In addition, vehicle tailpipe emissions can act as a large contributor to air emissions. Vehicle emissions are categorised as primary or secondary pollutants, with the latter a result of chemical reactions in the atmosphere. However, due to the limited number of road users currently in the area, vehicle emissions are likely to contribute minor concentrations of air pollutants. Fugitive dust sources are generally considered primary pollutants (as they are unlikely to experience any chemical or physical reactions) and are generally associated with the use of gravel roads or windblown erosion. The soil moisture content and density of vegetation cover can influence fugitive dust emissions. Due to limited rainfall in the Gamsberg region, fugitive dust emissions are likely to increase during the dry seasons. Mining activities are likely to significantly contribute to air emissions in the region. Mining activities are generally associated with the release of sulphur dioxide (SO2), nitrogen oxides (NOx), carbon monoxide (CO) and carbon dioxide (CO2). In addition, fugitive dust emissions such as PM2.5, PM10 and Total Suspended Particles are also characteristic of mining activities such as materials handling, blasting, drilling, haul vehicles, stockpiling and waste management. Taking cognisance of the existing mining operations within Aggeneys, the existing Black Mountain Mine is likely to contribute to the ambient air concentration levels in the region. Air quality monitoring was undertaken from June to October of 2009 to determine the current ambient air quality concentrations related to PM10, SO2 and NO2 (SRK Consulting, 2010). The SO2 results obtained for the months of June and September were registered below the 24 hour South African standard of 125 µg/m3 and the SANS 1929:2005 24 hour standard of 125 µg/m3 for all monitoring points. Furthermore, NO2 levels were obtained from existing monitoring stations, which indicated that the concentration levels are below the South African Standard limit of 200 µg/m3 and SANS 1929:2005 limit of 200 µg/m3 for both the June and September sampling periods. PM10 data was collected from 28 May 2009 to November 2009. The PM10 monitor was situated at Aggeneys High School, because the high school is the closest human receptor to the Gamsberg inselberg. The average 24 hour PM10 concentration levels were below the South African Standard of 120 µg/m3 for all months. There was one 24 hour exceedance above the South African proposed standard of 75 µg/m3 during the month of November 2009. The PM10 level of 92 µg/m3 was observed in November 2009. However, the PM10, SO2 and NO2 concentration levels in the surrounding area are generally within the requirements outlined in terms of NEM:AQA and SANS. It should be noted however that dust fallout levels do fluctuate in the area, with higher concentration levels recorded during the dry, windy seasons (ie July and September). Dust concentration levels do exceed SANS 1929:2005 standards
ENVIRONMENTAL RESOURCES MANAGEMENT GAMSBERG ESIA REPORT
5-47
during months characterised with less rainfall (July to September) and greater wind speeds. Furthermore, as the dry season is characterised with limited vegetation, the potential for windblown dust is also greater. Due to existing dust concentration levels exceeding SANS 1929:2005 during certain periods of the year, future mining activities would need to ensure that dust generation and suppression is efficiently managed, so as to overcome potential cumulative impacts of a new mine in the region. Precipitation plays a critical role in terms of air quality, as during the wet season, air pollution and particulate matter concentrations are generally lower. The rainfall not only reduces air pollution concentrations, but also dampens the ground and thus reduces the potential of windblown dust. During the dry period, dust concentration levels increase due to drier conditions and reduced vegetation cover.
5.11 NOISE
The Gamsberg inselberg is located in an area that is sparsely populated, with limited sensitive noise receptors in the immediate area. Sensitive receptors in the area include the town of Aggeneys, adjacent land owners and road users (N14 and Loop 10 gravel road). The proposed Gamsberg zinc mine will result in the generation of noise through the use of diesel equipment, crushing, concentrating and activity of mining (ie blasting and drilling). Recognising the potential noise sources, the existing ambient noise levels in the area were identified. The N14 National Road and Loop 10 gravel road has been identified as major sources of noise, due to levels of traffic experienced in the area. Furthermore, the town of Aggeneys is characterised with community related activities and thus contributes to the existing ambient noise levels. However, as Aggeneys is approximately 14 km south west of the proposed mine, the town results in minimal noise emissions, relative to the Project area. A large source of noise identified in the immediate area is the existing Black Mountain Mine. Although the proposed mine is located more than 15 km south west of the proposed Gamsberg mine, the on-site diesel equipment and crusher contribute to the ambient noise levels of the area. However, due to the topography, existing koppies act as a natural screening mechanism to reduce the significance of noise impacts. Notwithstanding, the establishment of the proposed Gamsberg zinc mine will result in an increase in the ambient noise levels in the immediate surroundings and therefore further investigations is required.
5.12 BASELINE CONDITIONS AT LOOP 10
Loop 10 is the halfway camp along the Sishen-Saldanha railway, aptly known as ‘Halfweg’. It is located approximately 150 km to the south east of the Project site.

ENVIRONMENTAL RESOURCES MANAGEMENT GAMSBERG ESIA REPORT
5-48
As discussed in Section 3, BMM has an existing offloading facility at the Loop 10 siding. This section provides a brief description of the baseline environmental conditions associated with the Site. The site itself was reportedly cleared of all vegetation during the construction of the siding and associated loop infrastructure (include pers comm Mr. P. Venter). As such, the site footprint and the land that immediately surrounds it (ie the rail reserve), is considered to be highly transformed, with only limited areas of relict vegetation occurring in thin strips over this area (SHEcape Environmental, 2008). Loop 10 is situated in a remote area, with very little residential, commercial or industrial activities being undertaken in close proximity to the Site. In this regard, the surrounding land use is predominantly used as agricultural grazing land. Game farming and karakul farming are also identified as land uses in the vicinity of the Site (SHEcape Environmental, 2008). Table 5.13 provides a brief description of the biophysical conditions associated with the environment surrounding Loop 10. This description is based on limited information obtained through personal communication with site management, previous environmental studies undertaken (SHEcape Environmental, 2008 & GEOSS, 2012) at the site and GIS data.
Table 5.14 Baseline Biophysical Conditions of Surroundings at Loop 10
Biophysical aspect Baseline description Temperature Average temperatures in summer of 30°C to 35°C. Average temperatures
in winter of 18°C to 20°C. Maximum temperatures in summer can reach 40°C.
Rainfall Monthly average rainfall of 10-30 mm in summer and less than 10 mm per month in winter. During periods of summer peak rainfall, daily rainfall events have been recorded to exceed 70mm.
Fauna No sensitive species identified through review of available information. Flora The vegetation type in the surrounding area is predominantly made up of
Arid Karoo vegetation, although Bushmanland Arid Grassland and Basin Shrubland were also noted in a study undertaken in close proximity to the site. The vegetation was acknowledged to be in a good functional state where not previously disturbed.
Topography The topography is considered to be generally flat, with undulating topography which increases in gradient to the north of the Site.
Surface Drainage As discussed above, the site is bisected by two non-perennial drainage lines typical of the area.
Geology The Prince Albert Formation (Ecca Group) dominates the surface geology at Loop 10. This formation consists of predominantly shale and siltstone.
Archaeology No sites of archaeological importance identified through review of available information.
Landscape Typical Karoo landscape with generally vast and featureless views.