4th International Urban Research Symposiumsiteresources.worldbank.org/INTURBANDEVELOPMENT/...4th...
50
4th International Urban Research Symposium Does the ownership and management of public land matter to land market outcomes? Robin Rajack May 15 th 2006
Transcript of 4th International Urban Research Symposiumsiteresources.worldbank.org/INTURBANDEVELOPMENT/...4th...
4th International Urban Research Symposium
Does the ownership and management of public land matter to land market
outcomes?
Robin RajackMay 15th 2006
Context
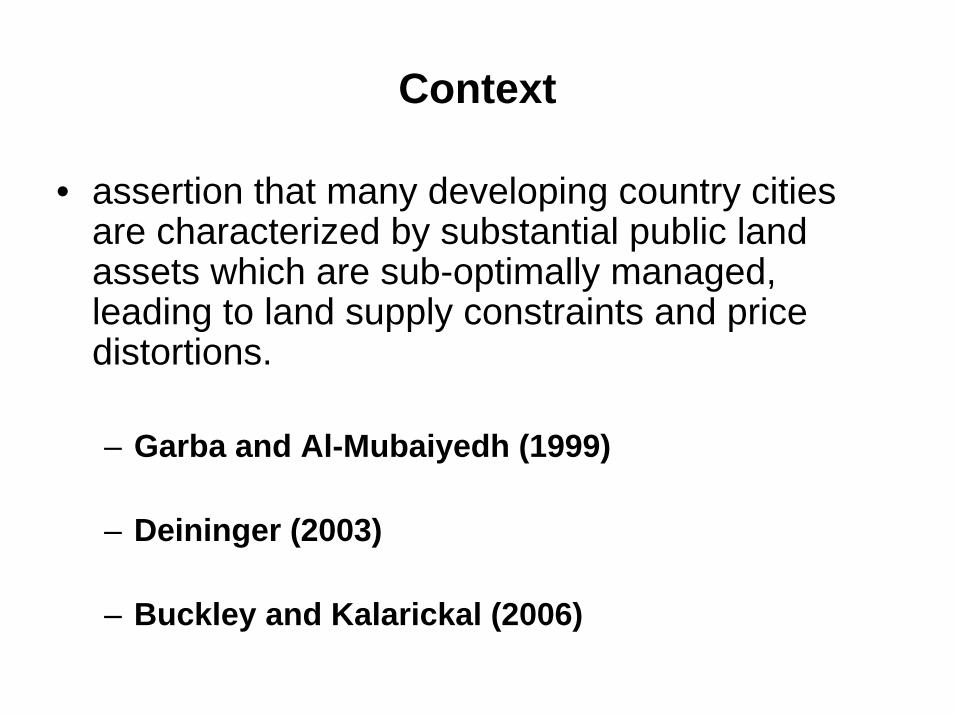
• assertion that many developing country cities are characterized by substantial public land assets which are sub-optimally managed, leading to land supply constraints and price distortions.
– Garba and Al-Mubaiyedh (1999)
– Deininger (2003)
– Buckley and Kalarickal (2006)
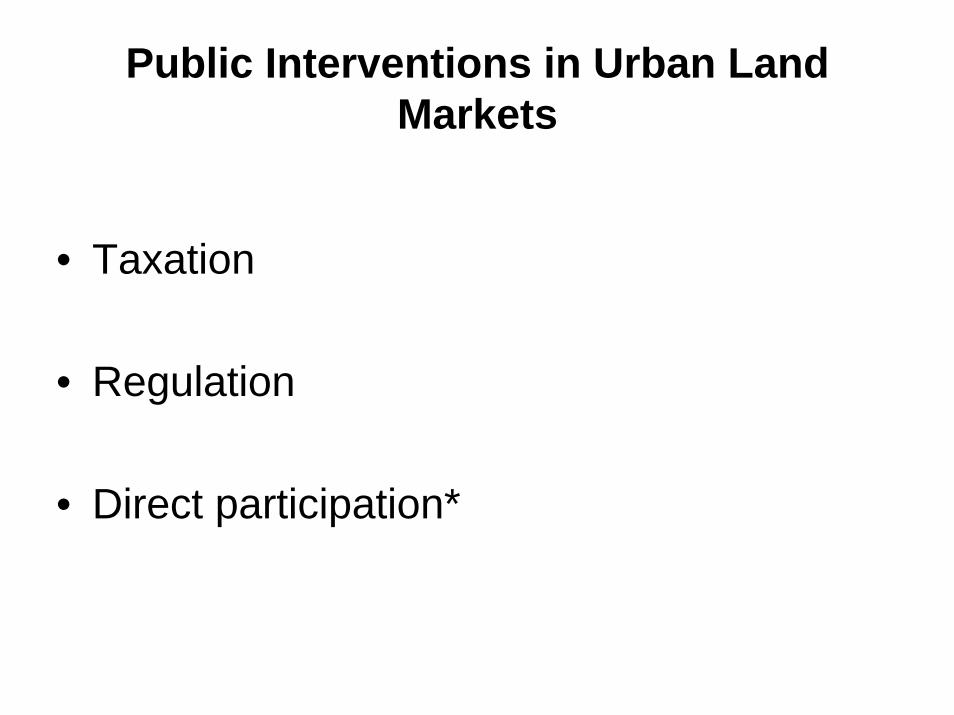
Public Interventions in Urban Land Markets
• Taxation
• Regulation
• Direct participation*
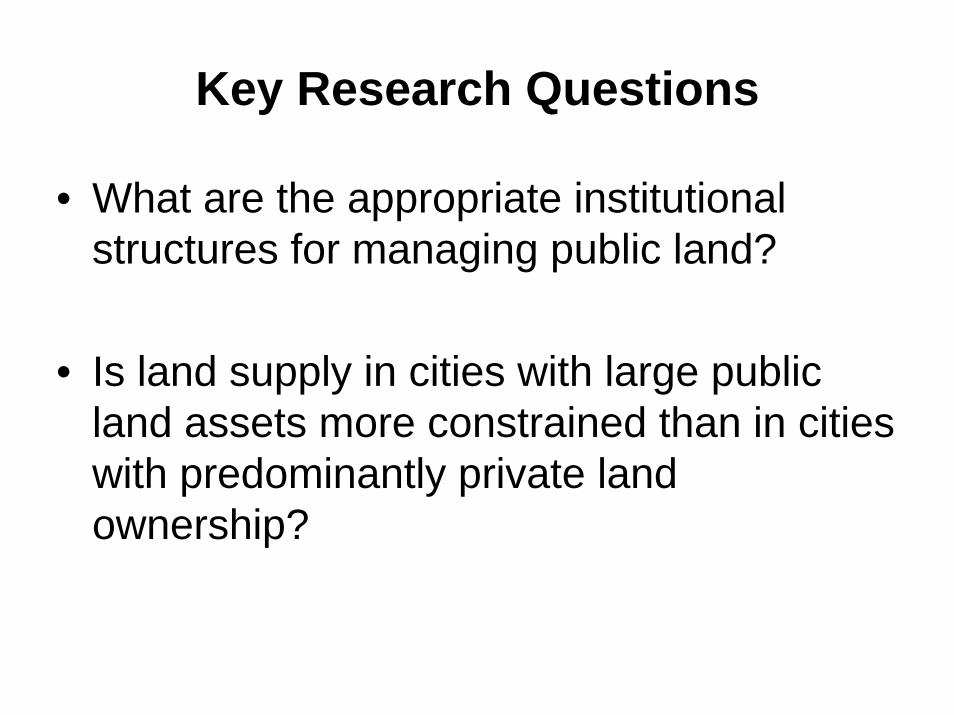
Key Research Questions
• What are the appropriate institutional structures for managing public land?
• Is land supply in cities with large public land assets more constrained than in cities with predominantly private land ownership?

Key Definitions
• public land includes all land under majority ownership or control of central government; municipalities and para-statal bodies such as State enterprises and statutory bodies however spatially the focus is on urban areas and on the rural-urban periphery.
• institutional arrangements imply organizational arrangements and associated human resource capacity; land information management; and land management practices
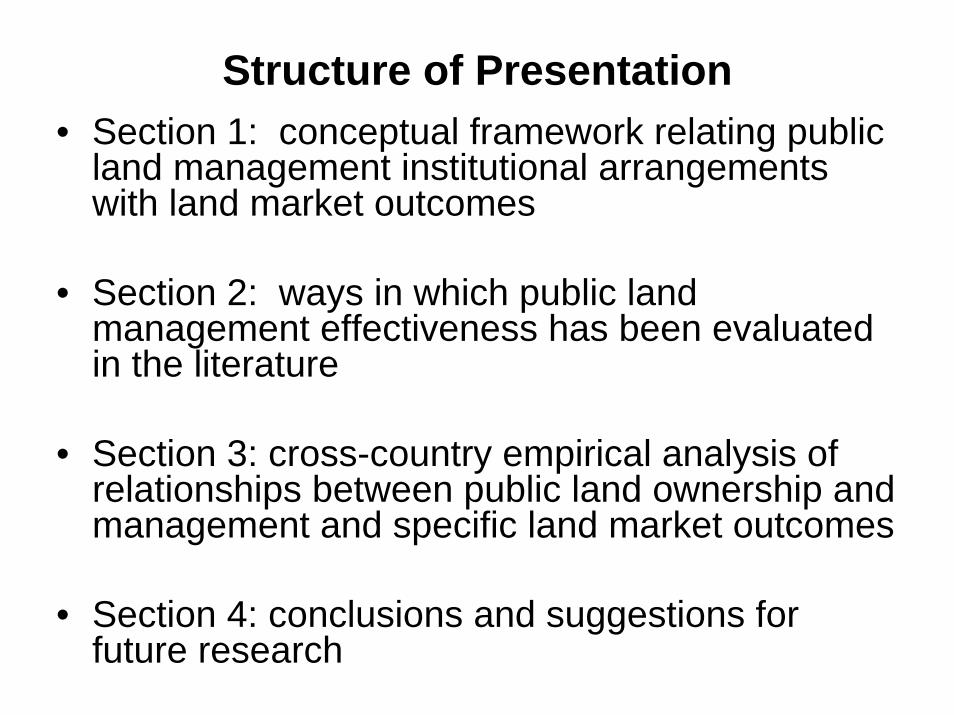
Structure of Presentation• Section 1: conceptual framework relating public
land management institutional arrangements with land market outcomes
• Section 2: ways in which public land management effectiveness has been evaluated in the literature
• Section 3: cross-country empirical analysis of relationships between public land ownership and management and specific land market outcomes
• Section 4: conclusions and suggestions for future research
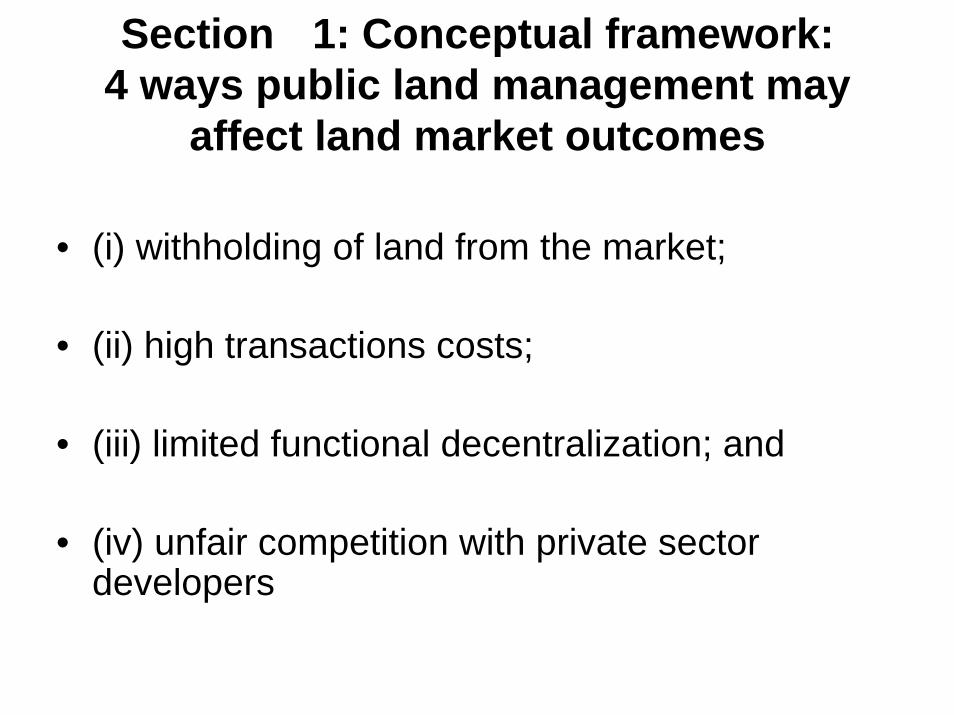
Section 1: Conceptual framework:4 ways public land management may
affect land market outcomes
• (i) withholding of land from the market;
• (ii) high transactions costs;
• (iii) limited functional decentralization; and
• (iv) unfair competition with private sector developers
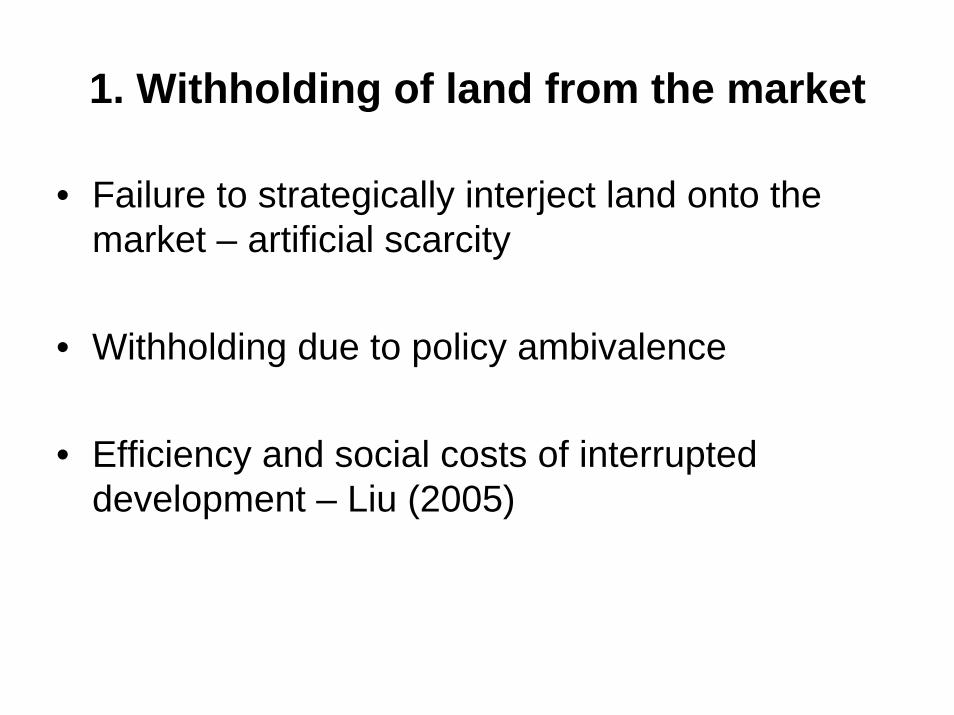
1. Withholding of land from the market
• Failure to strategically interject land onto the market – artificial scarcity
• Withholding due to policy ambivalence
• Efficiency and social costs of interrupted development – Liu (2005)
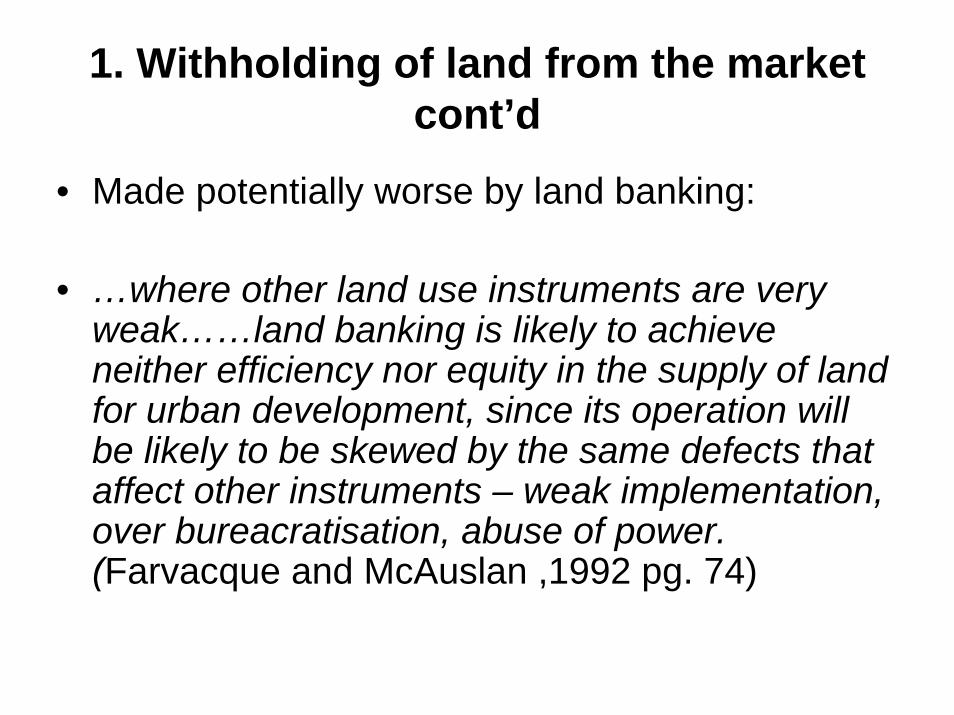
1. Withholding of land from the market cont’d
• Made potentially worse by land banking:
• …where other land use instruments are very weak……land banking is likely to achieve neither efficiency nor equity in the supply of land for urban development, since its operation will be likely to be skewed by the same defects that affect other instruments – weak implementation, over bureacratisation, abuse of power. (Farvacque and McAuslan ,1992 pg. 74)
1. Withholding of land from the market cont’d
• Instead advice is often for land auctions or land leasing
• Auctions: greater transparency (strong , 2003)
• Land leasing: more flexible when complimentary institutions are incipient Hong and Bourassa (2003)
2) High Transaction Costs
• The contention is that if institutional arrangements for public land management were more efficient, the elasticity of supply of land would be greater.
• Convoluted Procedures
• Inter-Agency Coordination
• Statutory Provisions Governing Public Expenditure
2) High Transaction Costs cont’d
• Incentive Framework of Public Land officials;
• Public Land Management Capacity

3) Public Land Management Insufficiently Decentralised
• Purported advantages of decentralisation:
– Greater knowledge of local needs and priorities
– Greater voice of local communities
– Stronger monitoring and enforcement
– Boosting of local revenue

3) Public Land Management Insufficiently Decentralised cont’d
• Mixed experience with decentralisation:
– Land Boards in Botswana
– Functional Duplication in Indonesia
– Decentralisation affected by capacity and lack of central guidance

(4) Unfair Competition between public and private developers
• When State Agencies enjoy both regulatory and development powers, they are viewed by private sector competitors as having an advantage.
• This can allow the state to approve its own projects and reject or delay proposals from competitors.
(4) Unfair Competition between public and private developers cont’d
• State often charges only nominally for raw land in its land development projects – inherent subsidy.
• In these ways private sector participation can be hamstrung leading to exacerbations in the shortage of supply of developed land.
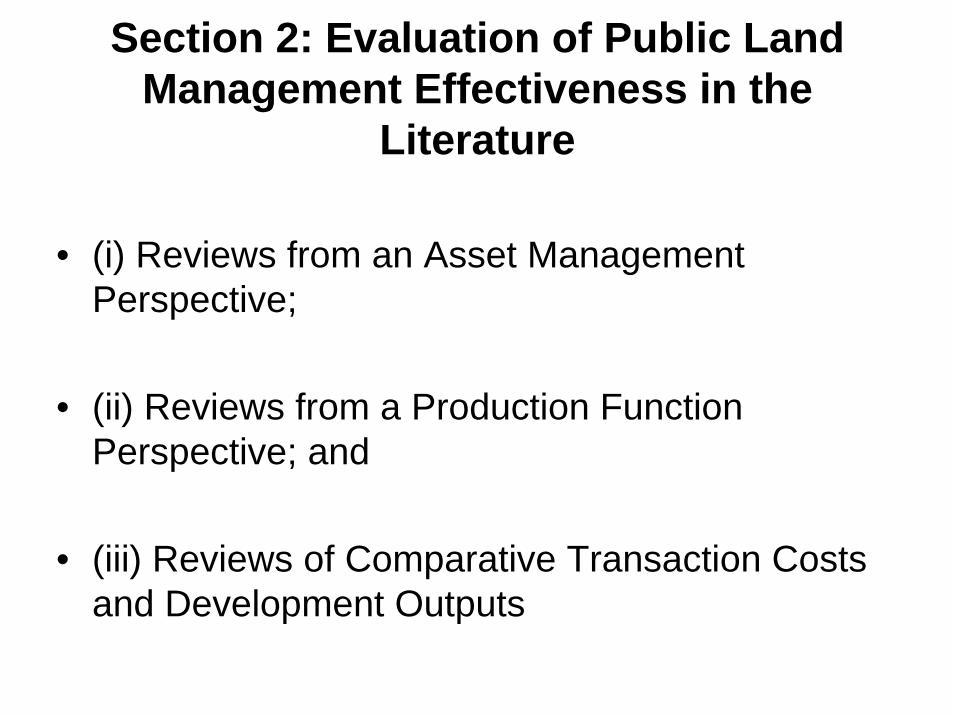
Section 2: Evaluation of Public Land Management Effectiveness in the
Literature
• (i) Reviews from an Asset Management Perspective;
• (ii) Reviews from a Production Function Perspective; and
• (iii) Reviews of Comparative Transaction Costs and Development Outputs
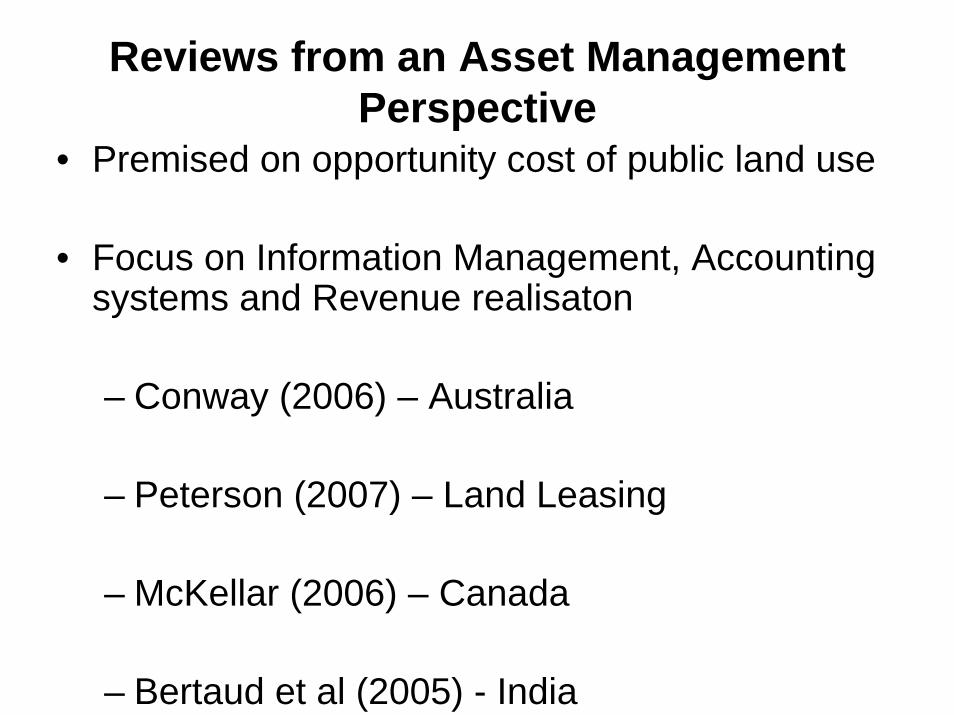
Reviews from an Asset Management Perspective
• Premised on opportunity cost of public land use
• Focus on Information Management, Accounting systems and Revenue realisaton
– Conway (2006) – Australia
– Peterson (2007) – Land Leasing
– McKellar (2006) – Canada
– Bertaud et al (2005) - India
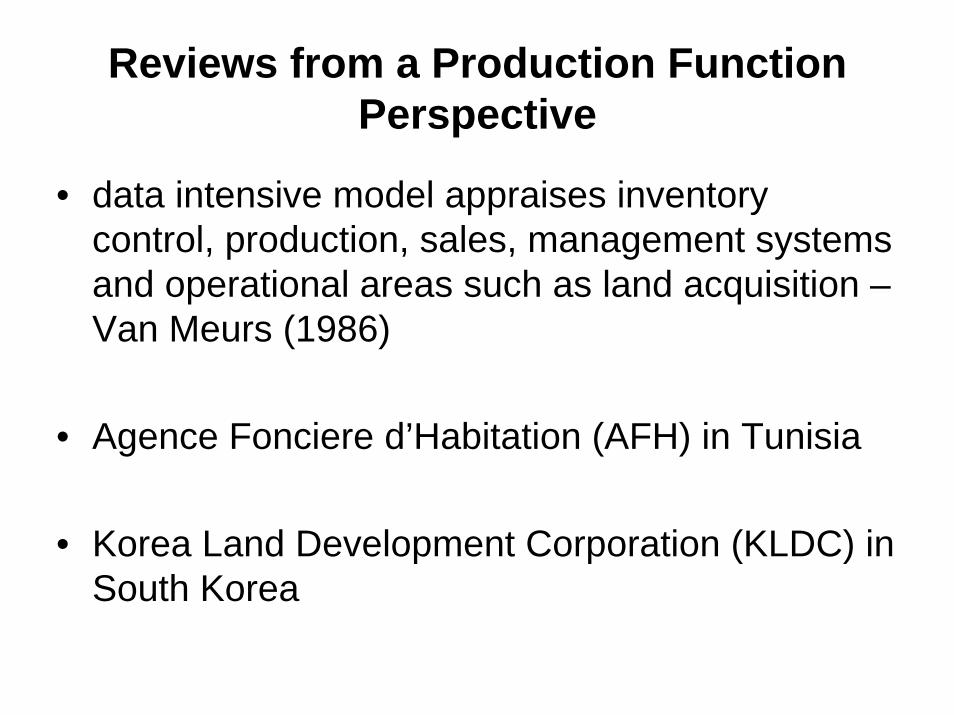
Reviews from a Production Function Perspective
• data intensive model appraises inventory control, production, sales, management systems and operational areas such as land acquisition –Van Meurs (1986)
• Agence Fonciere d’Habitation (AFH) in Tunisia
• Korea Land Development Corporation (KLDC) in South Korea
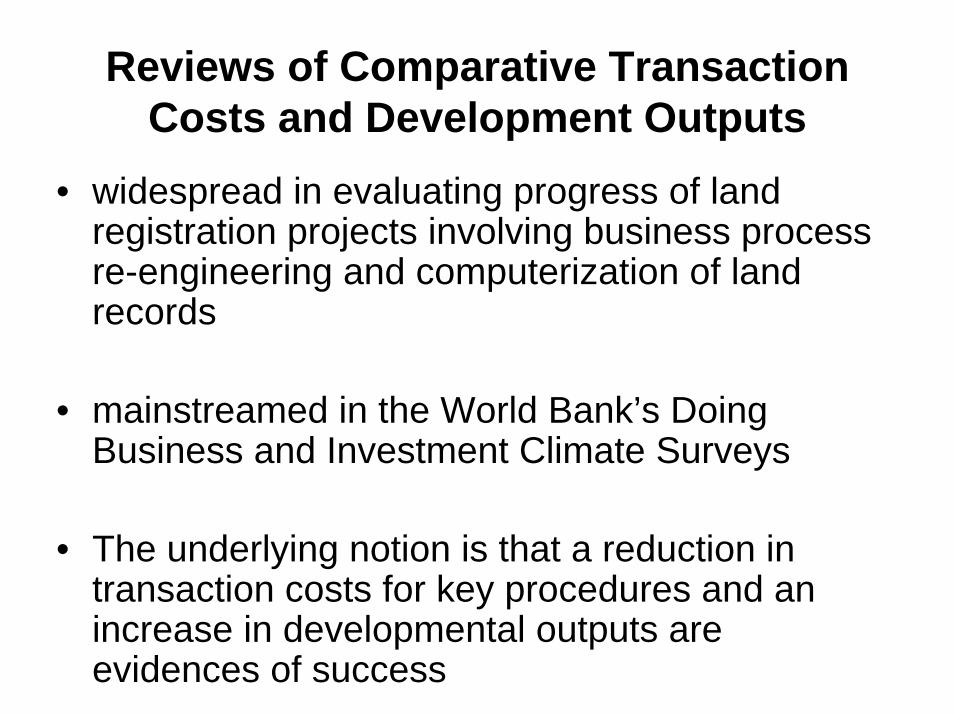
Reviews of Comparative Transaction Costs and Development Outputs
• widespread in evaluating progress of land registration projects involving business process re-engineering and computerization of land records
• mainstreamed in the World Bank’s Doing Business and Investment Climate Surveys
• The underlying notion is that a reduction in transaction costs for key procedures and an increase in developmental outputs are evidences of success

Reviews of Comparative Transaction Costs and Development Outputs cont’d
• Reforms at the Bangalore Development Authority (BDA), India– McKinsey,2004–
• Institutional reforms and development outputs in Trinidad– Rajack and Barhate (2004)
• Land Privitisation in the Russian Federation– Kisunko and Coolidge (2007)
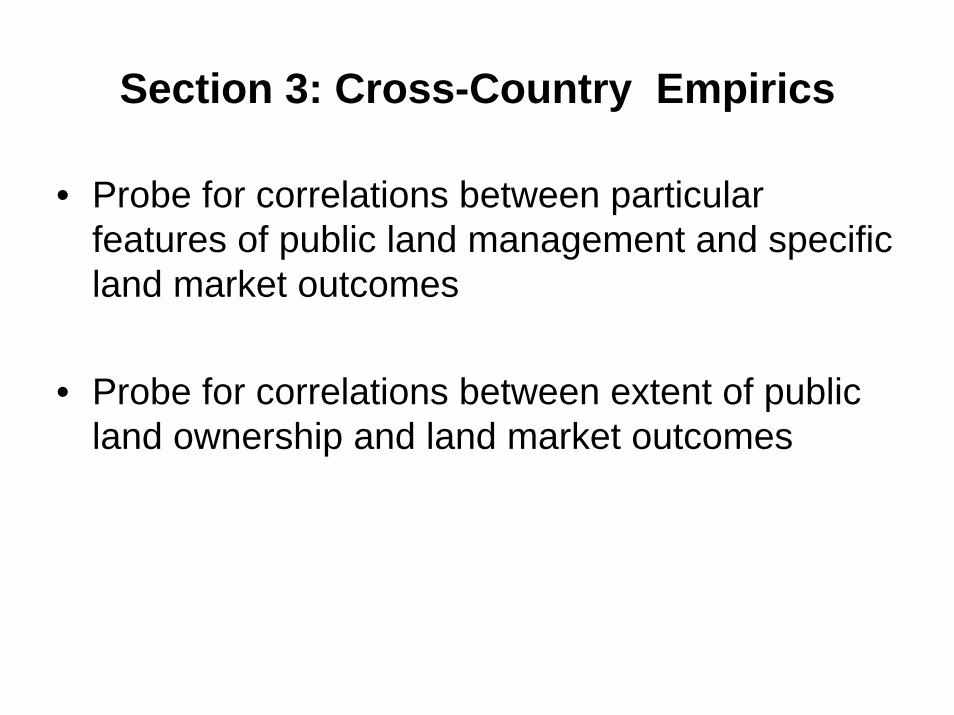
Section 3: Cross-Country Empirics
• Probe for correlations between particular features of public land management and specific land market outcomes
• Probe for correlations between extent of public land ownership and land market outcomes
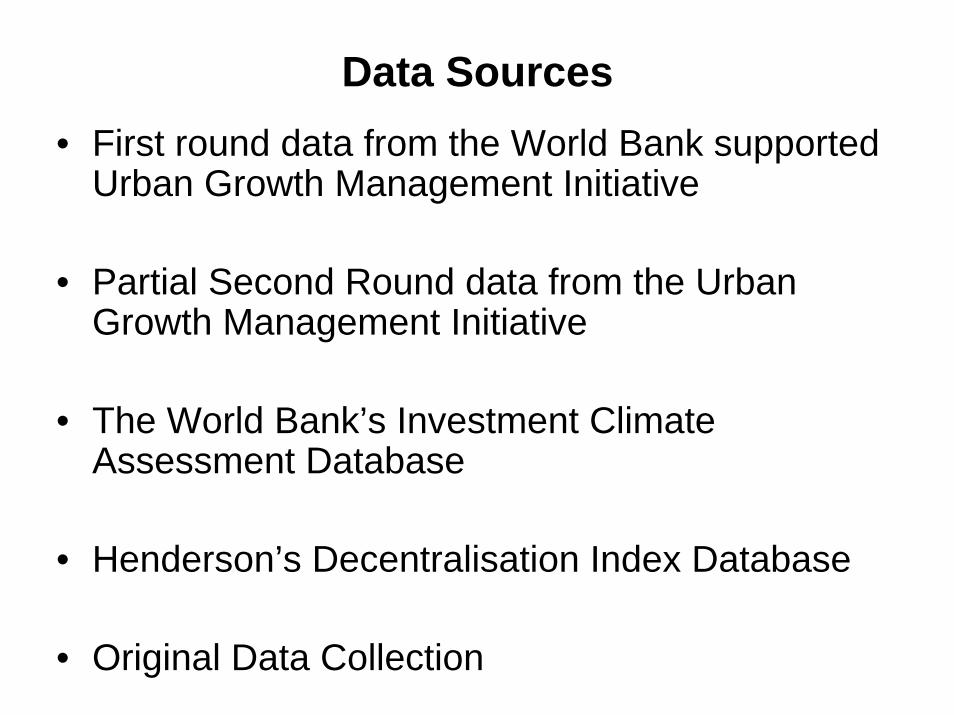
Data Sources• First round data from the World Bank supported
Urban Growth Management Initiative
• Partial Second Round data from the Urban Growth Management Initiative
• The World Bank’s Investment Climate Assessment Database
• Henderson’s Decentralisation Index Database
• Original Data Collection
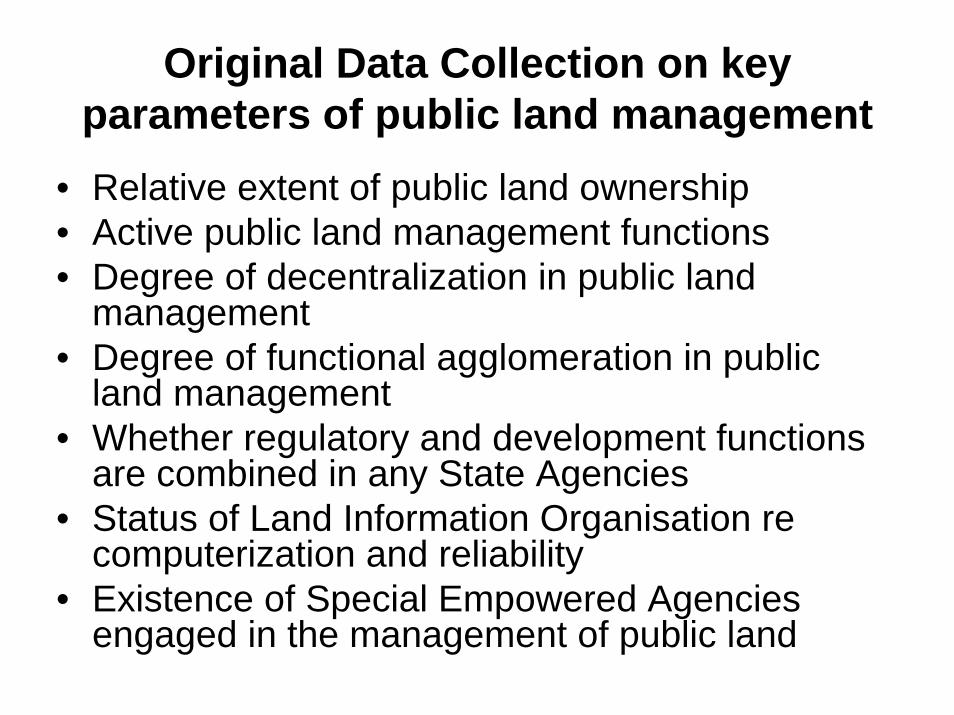
Original Data Collection on key parameters of public land management
• Relative extent of public land ownership • Active public land management functions• Degree of decentralization in public land
management• Degree of functional agglomeration in public
land management• Whether regulatory and development functions
are combined in any State Agencies• Status of Land Information Organisation re
computerization and reliability• Existence of Special Empowered Agencies
engaged in the management of public land
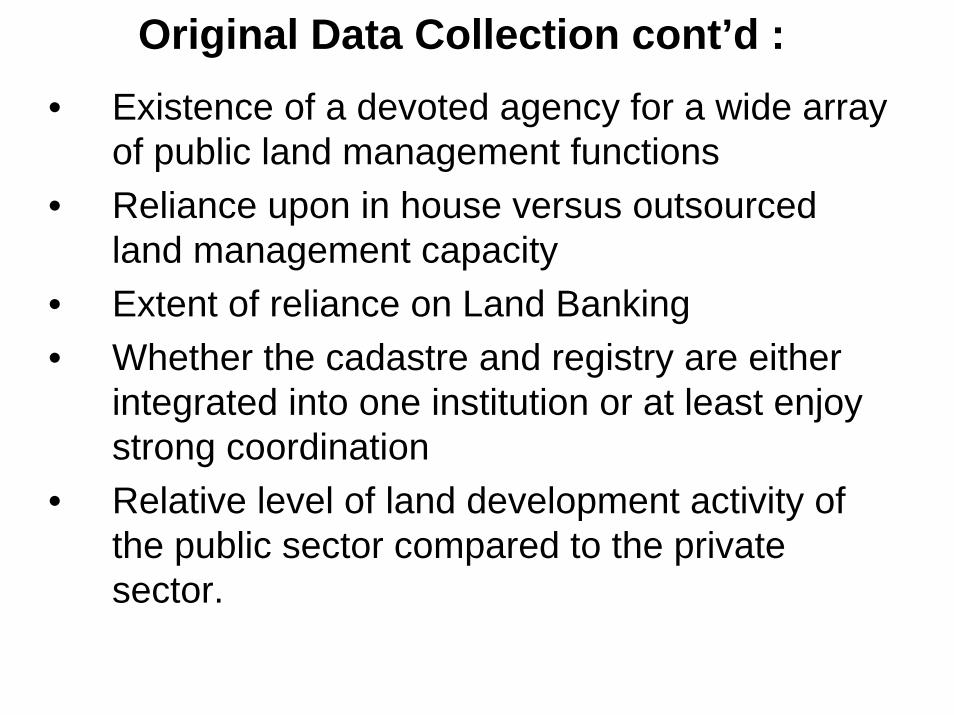
Original Data Collection cont’d :• Existence of a devoted agency for a wide array
of public land management functions• Reliance upon in house versus outsourced
land management capacity• Extent of reliance on Land Banking • Whether the cadastre and registry are either
integrated into one institution or at least enjoy strong coordination
• Relative level of land development activity of the public sector compared to the private sector.
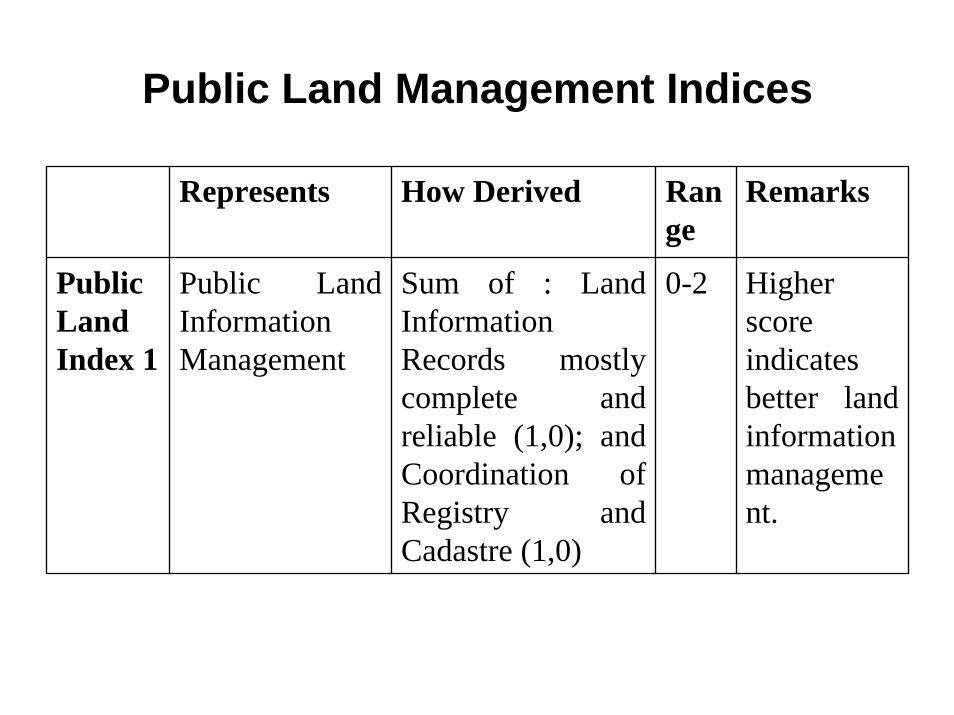
Public Land Management Indices
Represents How Derived Range
Remarks
Public Land Index 1
Public Land Information Management
Sum of : Land Information Records mostly complete and reliable (1,0); and Coordination of Registry and Cadastre (1,0)
0-2 Higher score indicates better land information management.
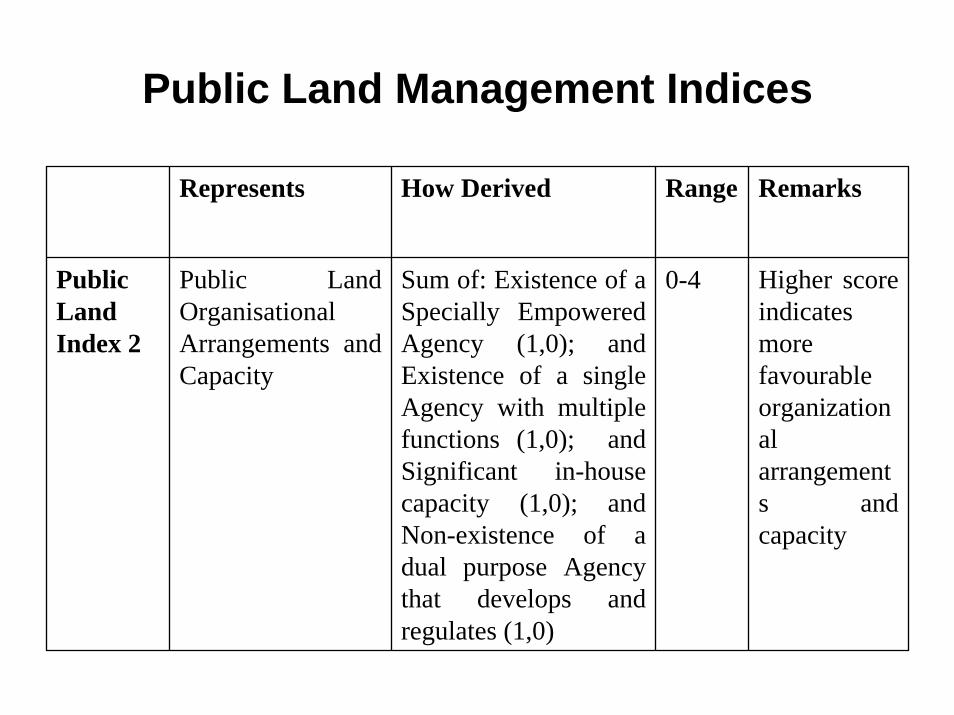
Public Land Management Indices
Represents How Derived Range Remarks
Public Land Index 2
Public Land OrganisationalArrangements and Capacity
Sum of: Existence of a Specially Empowered Agency (1,0); and Existence of a single Agency with multiple functions (1,0); and Significant in-house capacity (1,0); and Non-existence of a dual purpose Agency that develops and regulates (1,0)
0-4 Higher score indicates more favourableorganizational arrangements and capacity
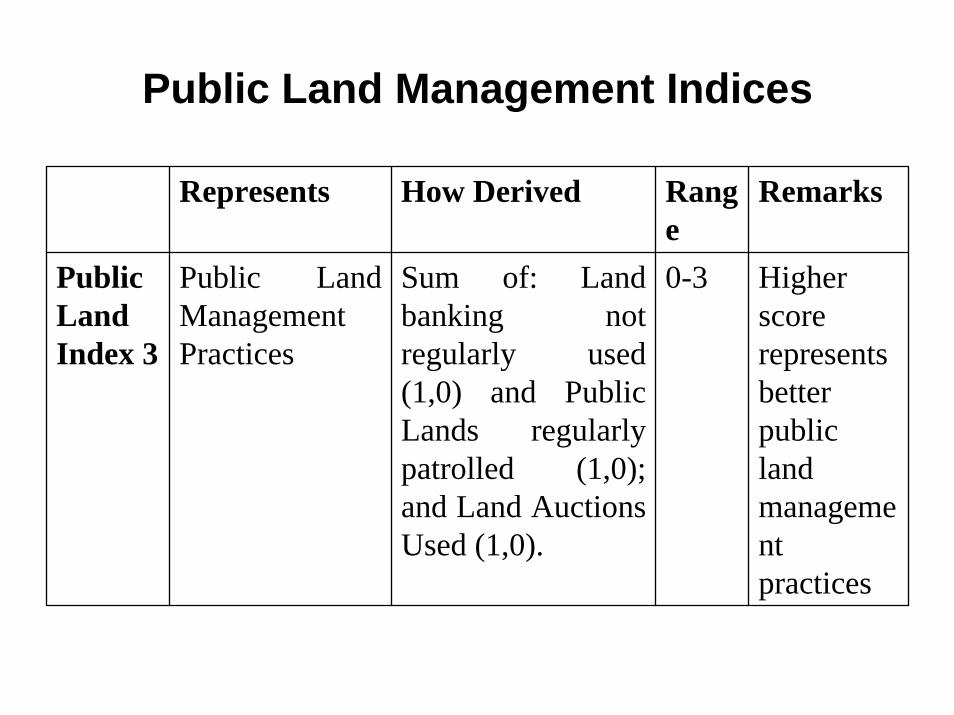
Public Land Management Indices
Represents How Derived Range
Remarks
Public Land Index 3
Public Land Management Practices
Sum of: Land banking not regularly used (1,0) and Public Lands regularly patrolled (1,0); and Land Auctions Used (1,0).
0-3 Higher score represents better public land management practices
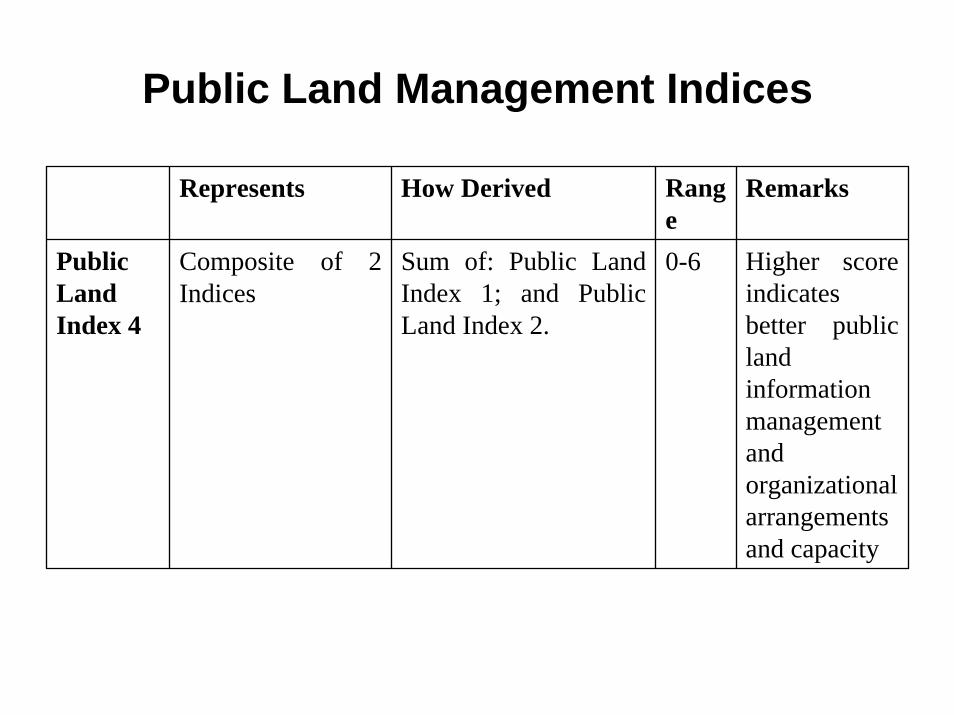
Public Land Management Indices
Represents How Derived Range
Remarks
Public Land Index 4
Composite of 2 Indices
Sum of: Public Land Index 1; and Public Land Index 2.
0-6 Higher score indicates better public land information management and organizational arrangements and capacity
Public Land Management Indices
Represents How Derived Range
Remarks
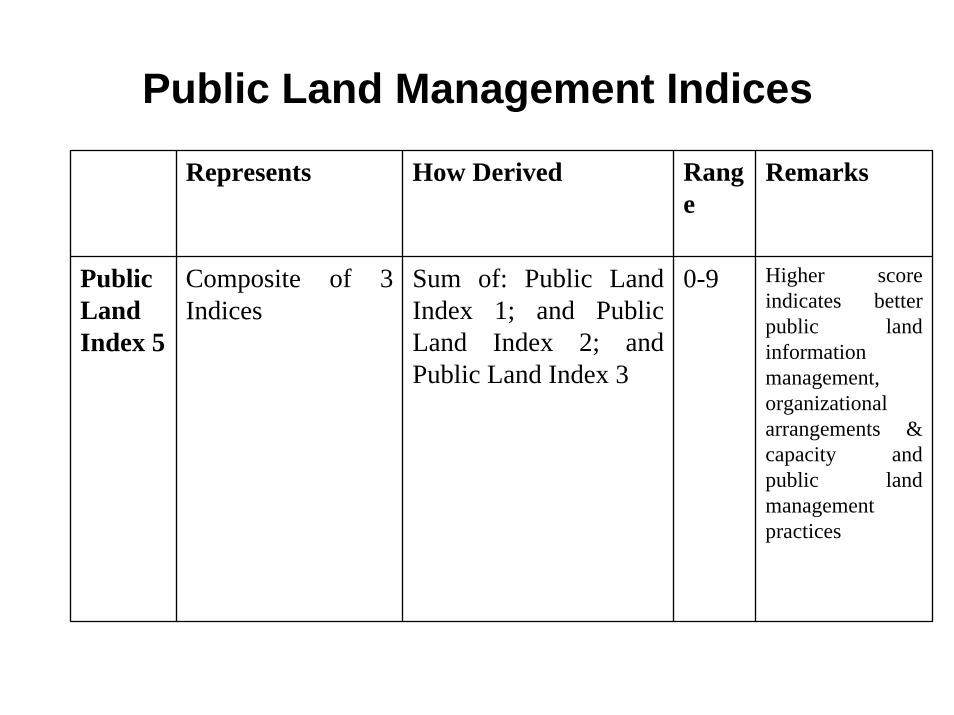
Public Land Index 5
Composite of 3 Indices
Sum of: Public Land Index 1; and Public Land Index 2; and Public Land Index 3
0-9 Higher score indicates better public land information management, organizational arrangements & capacity and public land management practices
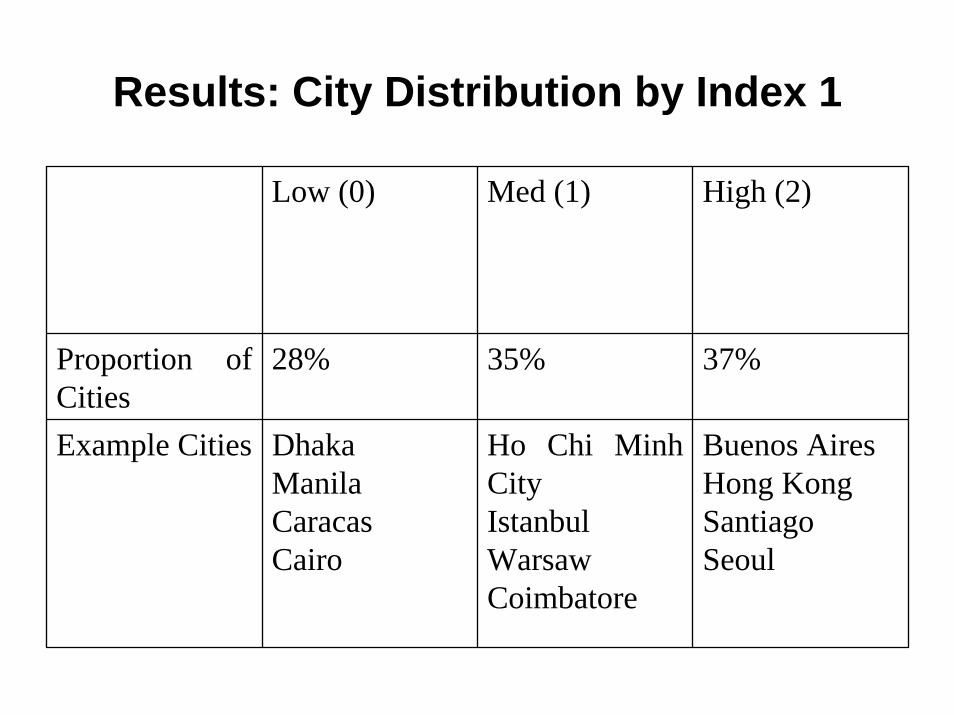
Results: City Distribution by Index 1
Low (0) Med (1) High (2)
Proportion of Cities
28% 35% 37%
Example Cities DhakaManilaCaracasCairo
Ho Chi MinhCityIstanbulWarsawCoimbatore
Buenos AiresHong KongSantiagoSeoul
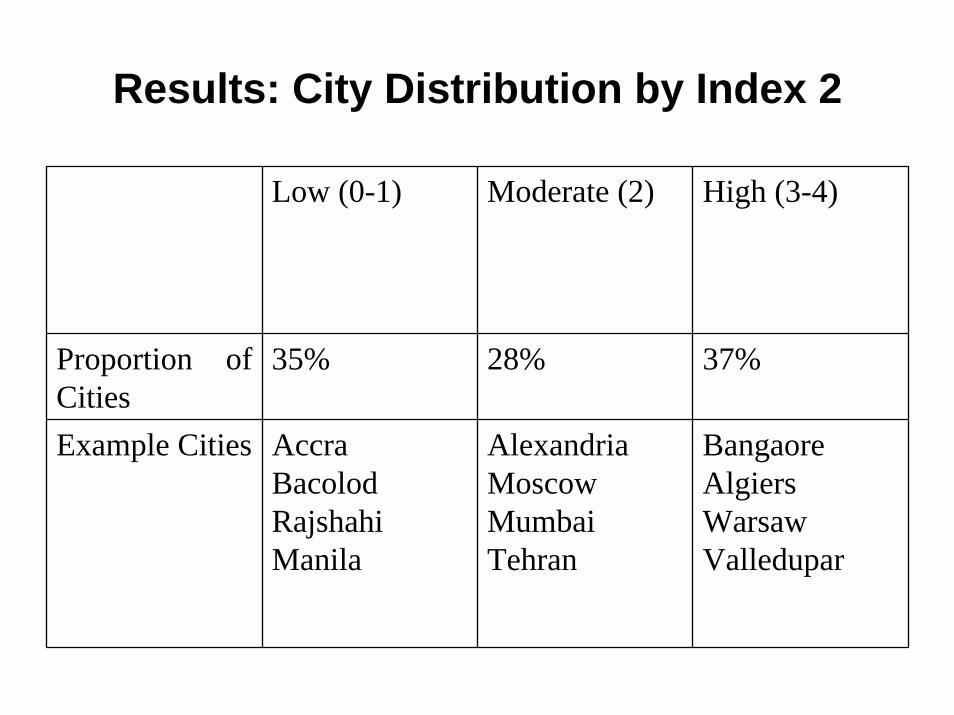
Results: City Distribution by Index 2
Low (0-1) Moderate (2) High (3-4)
Proportion of Cities
35% 28% 37%
Example Cities AccraBacolodRajshahiManila
AlexandriaMoscowMumbaiTehran
BangaoreAlgiersWarsawValledupar
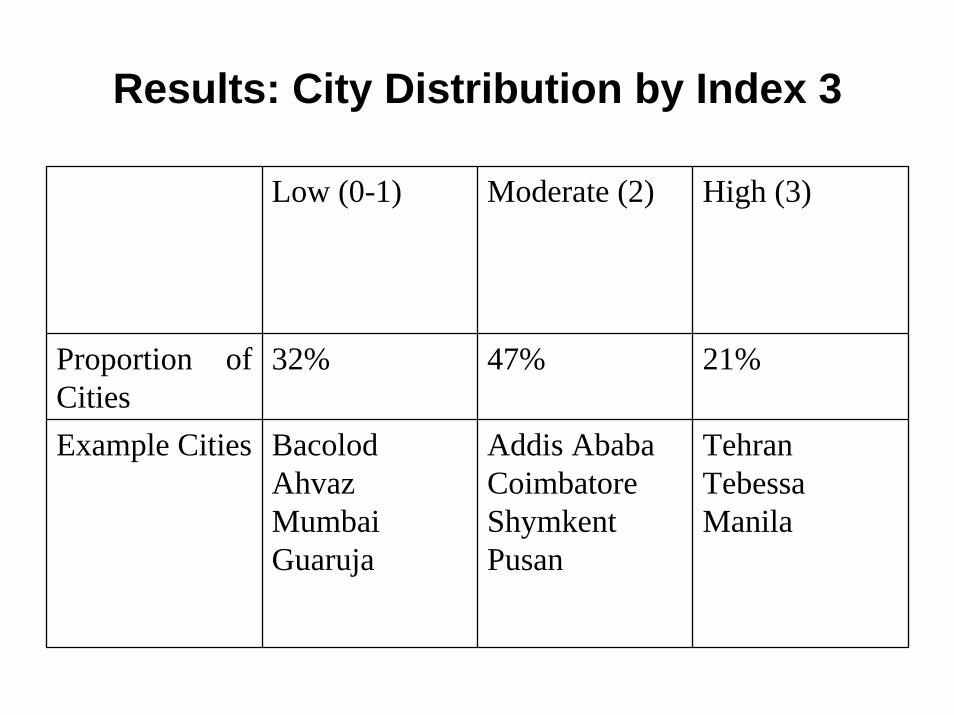
Results: City Distribution by Index 3
Low (0-1) Moderate (2) High (3)
Proportion of Cities
32% 47% 21%
Example Cities BacolodAhvazMumbaiGuaruja
Addis AbabaCoimbatoreShymkentPusan
TehranTebessaManila
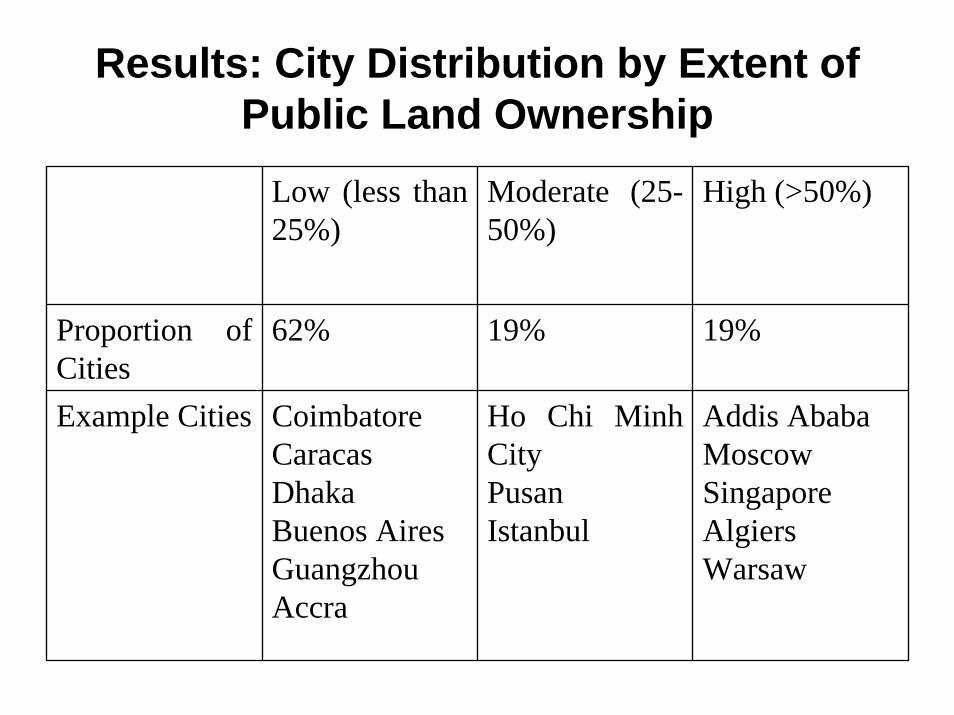
Results: City Distribution by Extent of Public Land Ownership
Low (less than 25%)
Moderate (25-50%)
High (>50%)
Proportion of Cities
62% 19% 19%
Example Cities CoimbatoreCaracasDhakaBuenos AiresGuangzhouAccra
Ho Chi MinhCityPusanIstanbul
Addis AbabaMoscowSingaporeAlgiersWarsaw
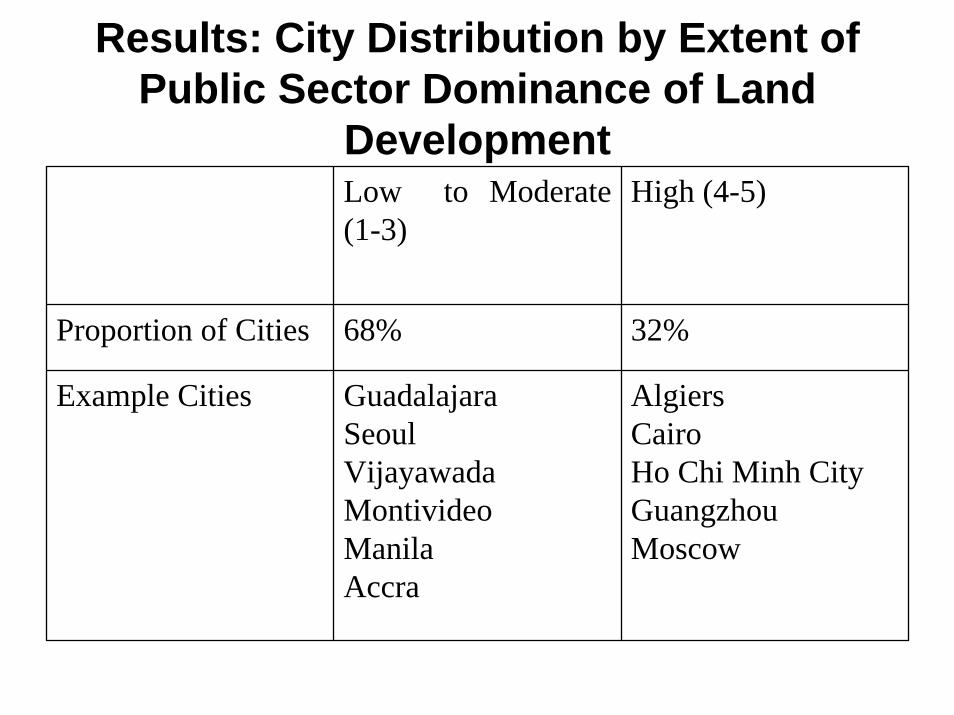
Results: City Distribution by Extent of Public Sector Dominance of Land
DevelopmentLow to Moderate (1-3)
High (4-5)
Proportion of Cities 68% 32%
Example Cities GuadalajaraSeoulVijayawadaMontivideoManilaAccra
AlgiersCairoHo Chi Minh CityGuangzhouMoscow
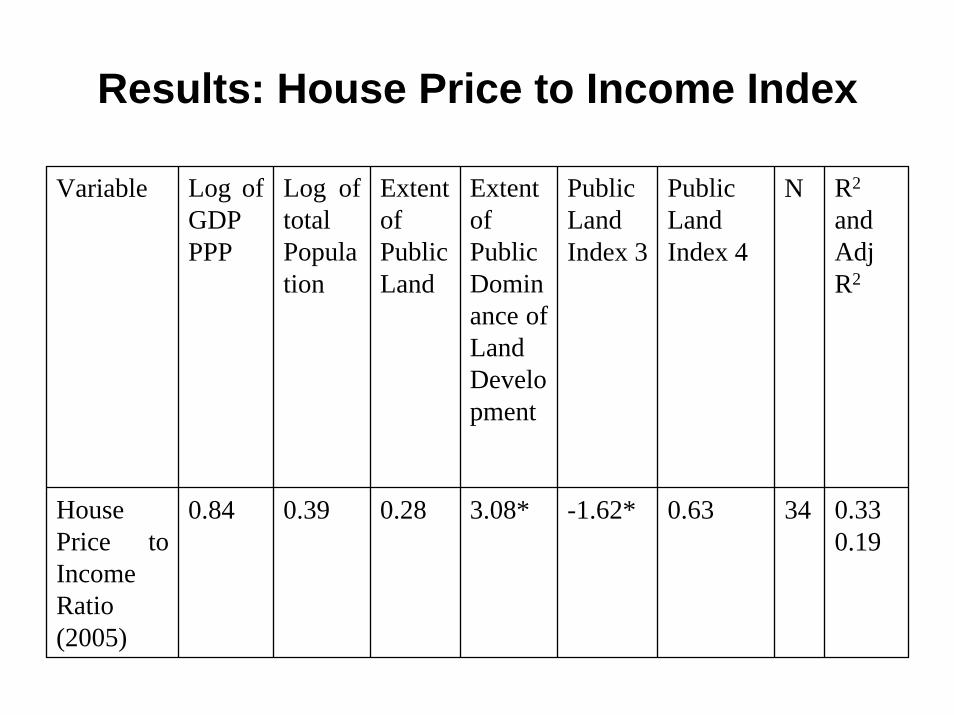
Results: House Price to Income Index
Variable Log of GDP PPP
Log of total Population
Extent of Public Land
Extent of Public Dominance of Land Development
Public Land Index 3
Public Land Index 4
N R2
and AdjR2
House Price to Income Ratio (2005)
0.84 0.39 0.28 3.08* -1.62* 0.63 34 0.330.19

Results: Shelter Price Inflation 2000-2005
Variable Log of GDP PPP
Log of total Population
Extent of Public Land
Extent of Public Dominance of Land Development
Public Land Index 3
Public Land Index 4
N R2
and AdjR2
Estimated Shelter Price Inflation 2000-2005
-0.17 0.12 0.28 0.45 -0.61*** -0.05 41 0.260.14

Results: Contiguity of Built Development
Contiguity of Built Development
0
0.2
0.4
0.6
0.8
1
1.2
Chona
nGorg
anHara
reGua
ruja
Algiers
Guang
zhou
Seoul
Jalna
Alexan
dria
Kanpu
rShy
mkent
Mumba
iMos
cow
Ho Chi
Minh C
ityDha
kaZug
didi
Warsaw
Istan
bul
Ribeira
o Pret
oBud
apes
tBan
julHyd
eraba
dGua
dalaj
araTiju
ana
Cebu
Bueno
s Aire
sBan
dung
Valled
upar
Jaipu
r

Results: Contiguity Index
Variable GDP PPP
Total Population
Slope Extent of Public Land
Extent of Public Dominance of Land Development
Public Land Index 3
Public Land Index 4
N R2
and AdjR2
Contiguity Index around 2000
-0.00 1.53e-08*
0.00 0.06 -0.05 -0.05 -0.03 42 0.220.06
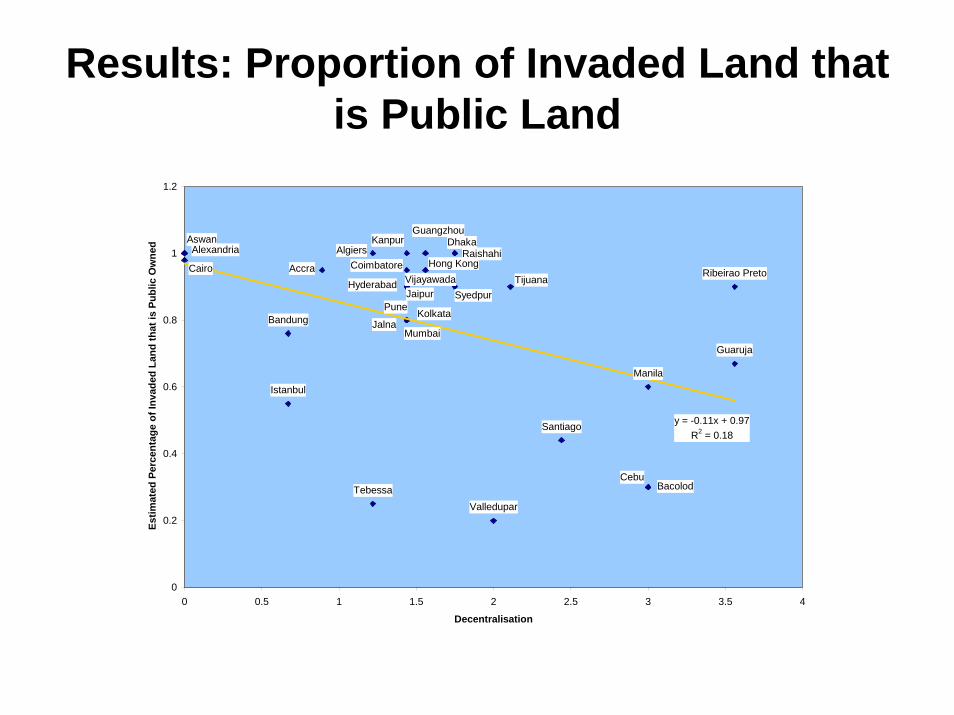
Results: Proportion of Invaded Land that is Public Land
Vijayawada
Valledupar
Tijuana
Tebessa
Santiago
Syedpur
Ribeirao Preto
Rajshahi
Pune
Mumbai
Manila
Kolkata
Kanpur
Jalna
Jaipur
Istanbul
Hyderabad
Hong Kong
Guaruja
GuangzhouDhaka
Coimbatore
Cebu
Cairo
Bandung
Bacolod
AswanAlgiersAlexandria
Accra
y = -0.11x + 0.97R2 = 0.18
0
0.2
0.4
0.6
0.8
1
1.2
0 0.5 1 1.5 2 2.5 3 3.5 4
Decentralisation
Est
imat
ed P
erce
ntag
e of
Inva
ded
Land
that
is P
ublic
Ow
ned
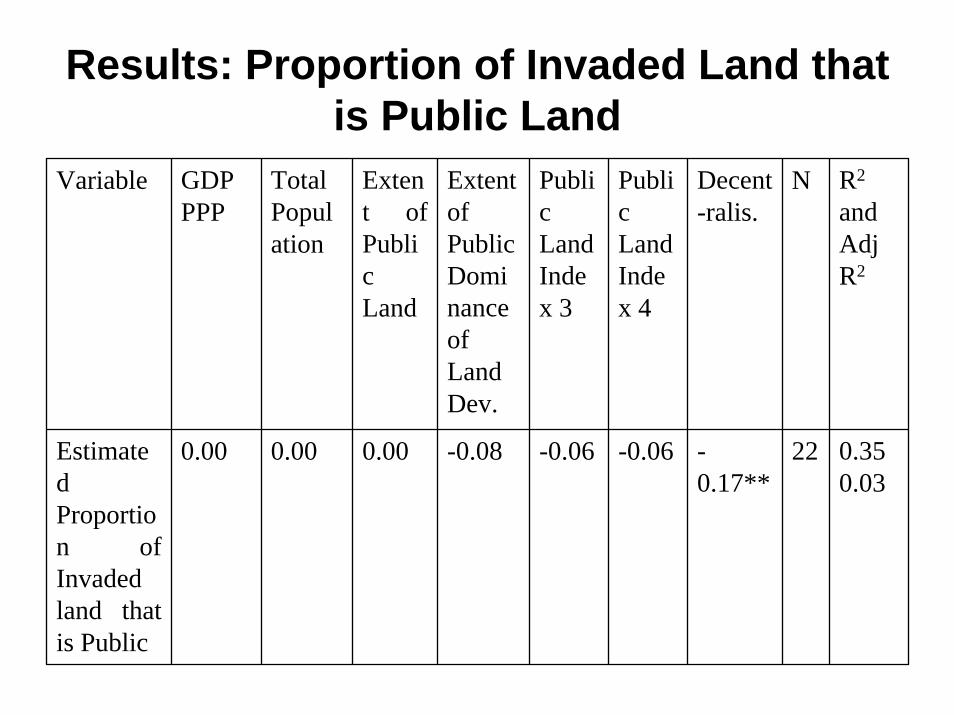
Results: Proportion of Invaded Land that is Public Land
Variable GDP PPP
Total Population
Extent of Public Land
Extent of Public Dominance of Land Dev.
Public Land Index 3
Public Land Index 4
Decent-ralis.
N R2
and AdjR2
Estimated Proportion of Invaded land that is Public
0.00 0.00 0.00 -0.08 -0.06 -0.06 -0.17**
22 0.350.03
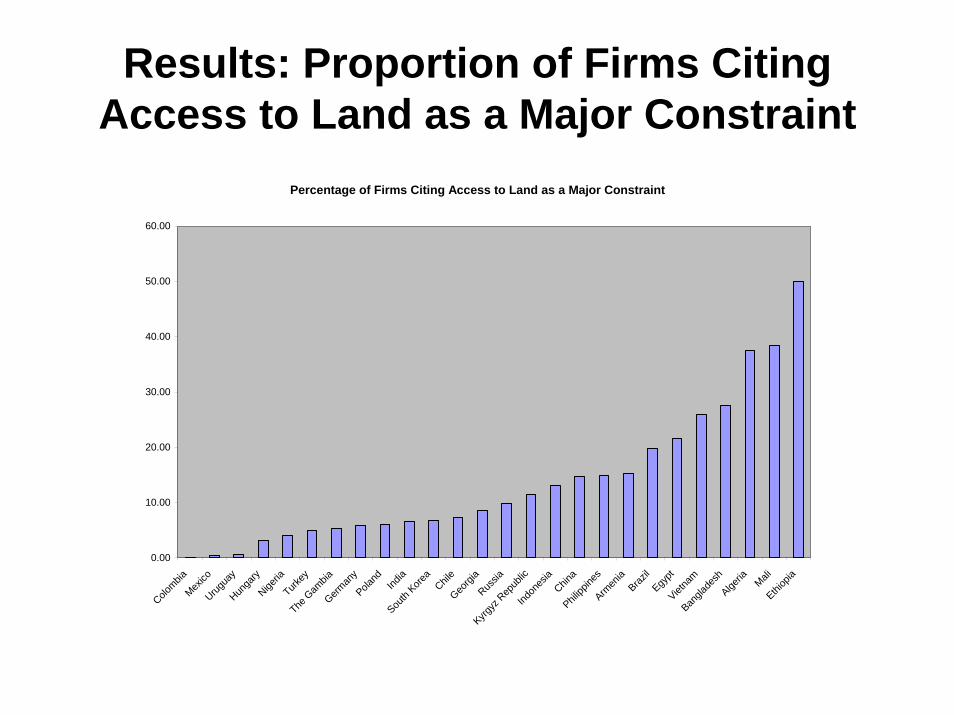
Results: Proportion of Firms Citing Access to Land as a Major Constraint
Percentage of Firms Citing Access to Land as a Major Constraint
0.00
10.00
20.00
30.00
40.00
50.00
60.00
Colombia
Mexico
Urugua
yHun
gary
Nigeria
Turkey
The G
ambia
German
yPola
ndInd
iaSou
th Kore
aChil
eGeo
rgia
Russia
Kyrgyz
Rep
ublic
Indon
esia
China
Philipp
ines
Armen
iaBraz
ilEgy
ptViet
nam
Bangla
desh
Algeria Mali
Ethiop
ia
Results: Proportion of Firms Citing Access to Land as a Major Constraint
Variable Log of GDP PPP
Log of total Population
Extent of Public Land
Extent of Public Dominance of Land Dev.
Contiguity Index
Public Land Index 5
N R2
and AdjR2
% of Firms Citing Land Access as a Major Constraint
-4.22* -0.28 4.26 7.71* -8.19 -1.28 36 0.330.18
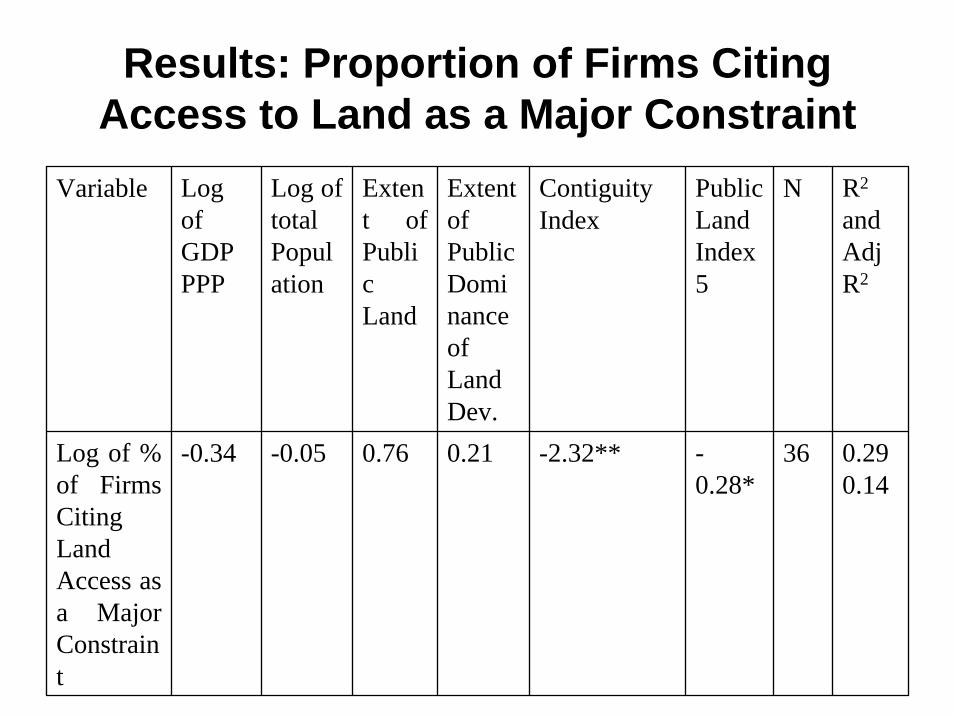
Results: Proportion of Firms Citing Access to Land as a Major Constraint
Variable Log of GDP PPP
Log of total Population
Extent of Public Land
Extent of Public Dominance of Land Dev.
Contiguity Index
Public Land Index 5
N R2
and AdjR2
Log of % of Firms Citing Land Access as a Major Constraint
-0.34 -0.05 0.76 0.21 -2.32** -0.28*
36 0.290.14
Conclusions
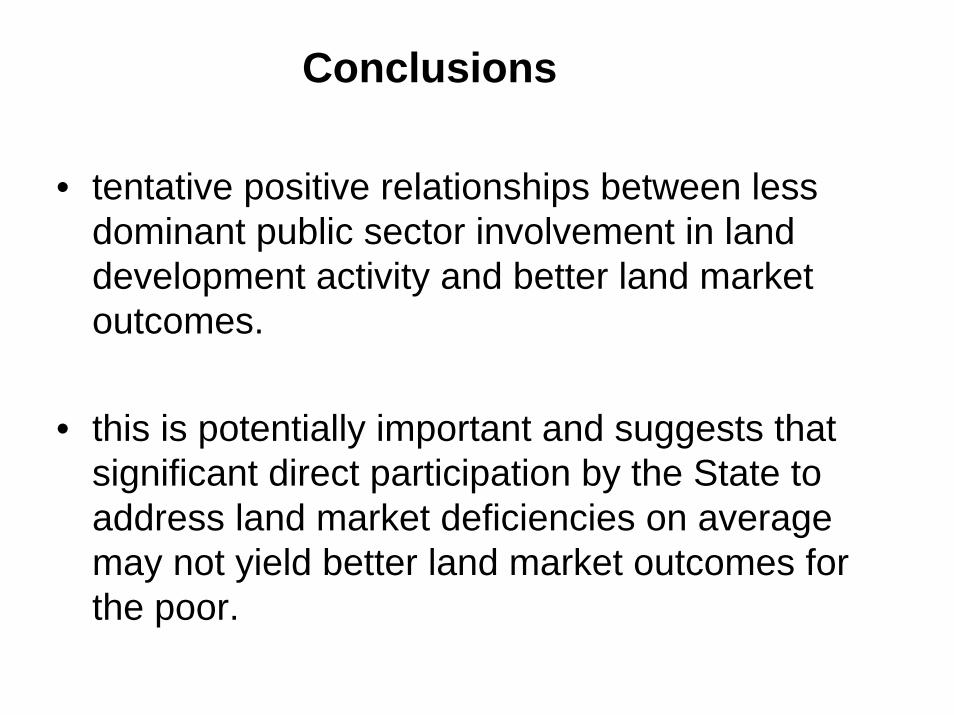
• tentative positive relationships between less dominant public sector involvement in land development activity and better land market outcomes.
• this is potentially important and suggests that significant direct participation by the State to address land market deficiencies on average may not yield better land market outcomes for the poor.
Conclusions
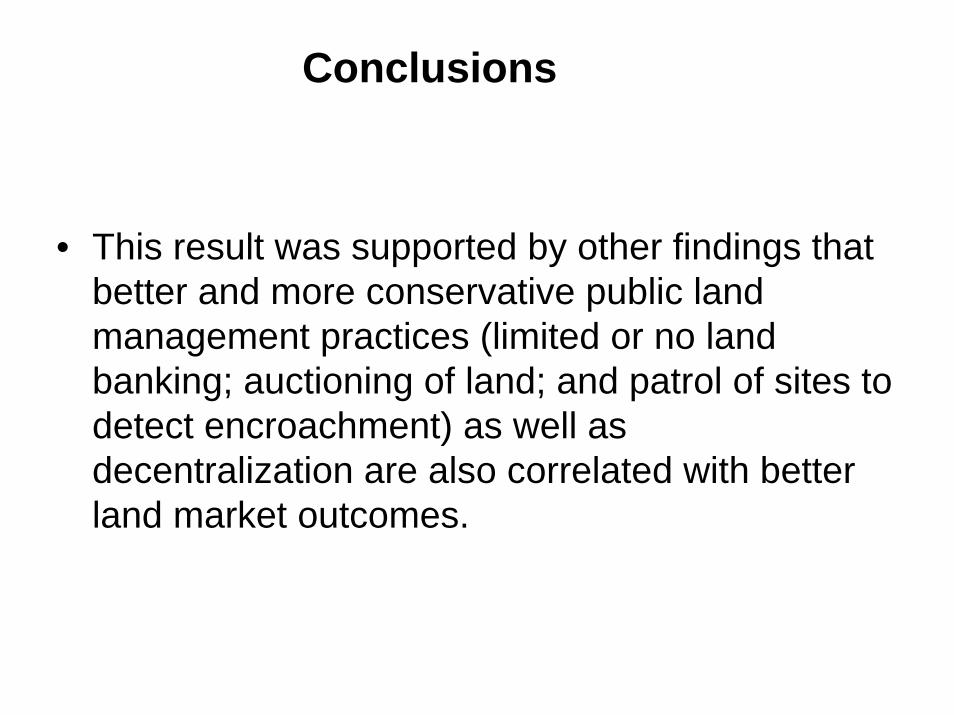
• This result was supported by other findings that better and more conservative public land management practices (limited or no land banking; auctioning of land; and patrol of sites to detect encroachment) as well as decentralization are also correlated with better land market outcomes.
Conclusions
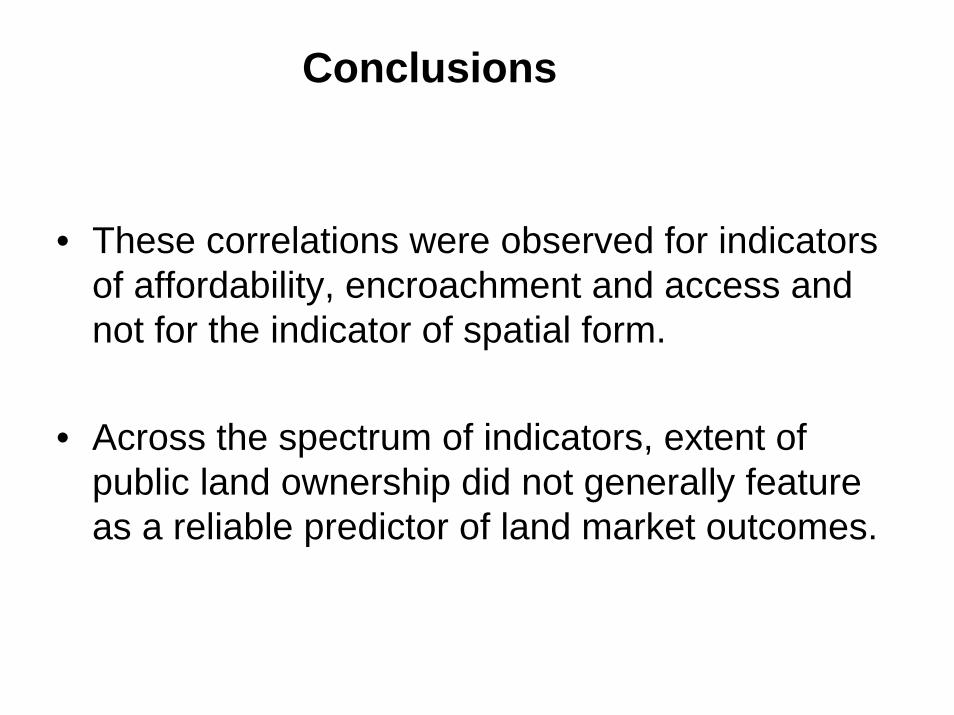
• These correlations were observed for indicators of affordability, encroachment and access and not for the indicator of spatial form.
• Across the spectrum of indicators, extent of public land ownership did not generally feature as a reliable predictor of land market outcomes.
Conclusions
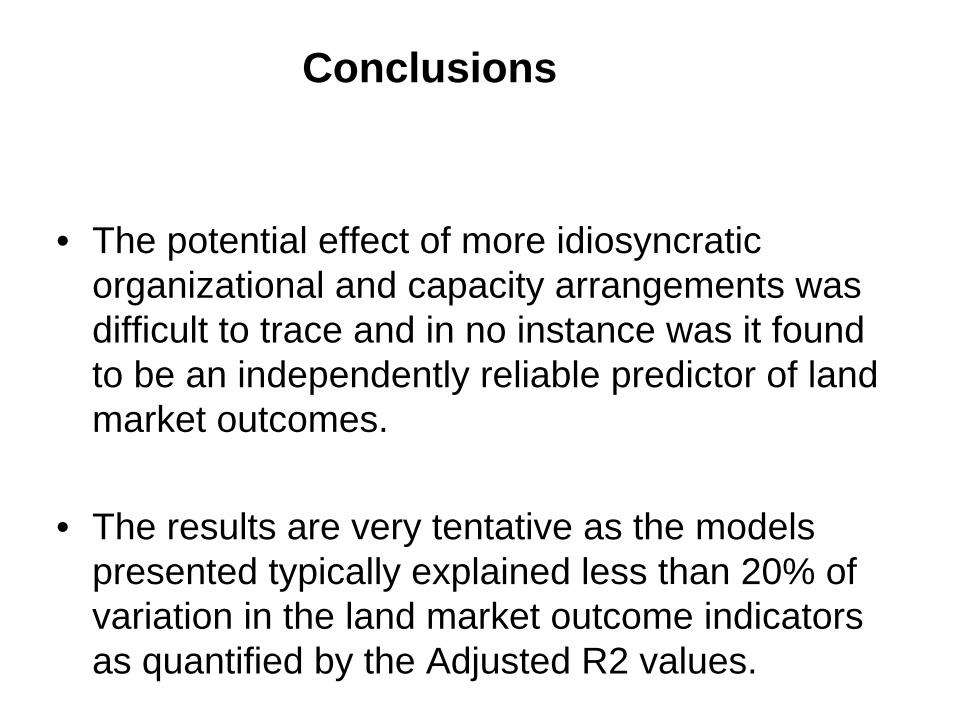
• The potential effect of more idiosyncratic organizational and capacity arrangements was difficult to trace and in no instance was it found to be an independently reliable predictor of land market outcomes.
• The results are very tentative as the models presented typically explained less than 20% of variation in the land market outcome indicators as quantified by the Adjusted R2 values.
Conclusions
• However, the frequency with which public land management variables featured as reliable predictors of a variety of land market outcome indicators suggests that we should also be cautious about dismissing their relevance to hastily.
• Even so, correlation between public land management and land price growth does not lend to straightforward interpretation
Future Research• The political economy of public land management and reform
• The social and environmental benefits that may be derived from vacant public land
• Are particular public land management institutional configurations better suited to specific public land intervention instruments?
• Pursuing specific land management practices and other institutional arrangements under widely varying land tenure systems
• Detailed country specific studies that utilize econometric tools to study comparative development outputs and impacts under evolvinginstitutional structures
• Wherever feasible, the type of analysis undertaken and proposed in this paper should be repeated using actual land market transaction data rather than expert opinion