4R Phosphorus Management Practices for Major Commodity ...
12
4R Phosphorus Management Practices for Major Commodity Crops of North America Phosphorus for Sustainable Crop Nutrition P hosphorus (P) fertilizers contribute considerably to the yields attained in North American cropping systems. For example, long-term research on irrigated corn in Kansas showed a yield reduction of more than 40% where P was not applied for over 30 years (Schlegel and Havlin, 2017). On the other hand, P losses from agricultural soils have contributed to eutrophication issues (Jarvie et al., 2017) and approximately 40% of lakes in the continental USA are considered “most disturbed” owing to high P levels (USEPA, 2016), with nonpoint source runoff from agricultural cropland a substantial contributor. The 4R Nutrient Stewardship concept emphasizes applying the right source of each plant nutrient at the right rate, right time, and in the right place. “Right” is defined in terms of making the cropping system more sustainable. Thus, 4R P application practices are those that support improvement of both crop yield and water quality. All four attributes—source, rate, time, and place—of P application can have a large influence on these two impacts, and need to be considered together (IPNI, 2012). The right combination, however, is specific not only to each crop and regional cropping system, but also to the factors unique to each farm and field. These factors include soils, local climate, weather, farmer management ability, markets, logistics of field operations, and vulnerability of local ecosystems. The site-specific nature of 4R practices limits the degree of detail with which they can be described across large regional cropping systems. There is nevertheless a need to describe 4R P practices, particularly in the context of agricultural sustainability initiatives, in which it is important that a wide range of stakeholders, with different levels of technical knowledge of crop production, have an appreciation for the practices employed by producers, and for the opportunities and costs associated with changing and optimizing such practices. Phosphorus plays a crucial role in sustainable crop production. Made from finite natural resources, phosphorus fertilizers support high and increasing crop yields, but their use can also elevate the risk for reduced water quality. Increasing the adoption of 4R phosphorus application practices—applying the right source at the right rate, right time, and right place—has great potential to improve both crop yields and water quality. This paper reviews a science-based effort to describe such practices for five major commodity crops produced in North America. ISSUE REVIEW Ref #17023 By Tom Bruulsema, Phosphorus Program Director, IPNI March 2017 International Plant Nutrition Institute (IPNI) 3500 Parkway Lane, Suite 550, Peachtree Corners, Georgia 30092-2844 USA Phone: 770-447-0335; E-mail: [email protected]; Website: www.ipni.net For Issue Review Series visit http://www.ipni.net/IssueReview
Transcript of 4R Phosphorus Management Practices for Major Commodity ...

4R Phosphorus Management Practicesfor Major Commodity Crops of North America
Phosphorus for Sustainable Crop Nutrition
Phosphorus (P) fertilizers contribute considerably to the yields attained in North American cropping systems.
For example, long-term research on irrigated corn in Kansas showed a yield reduction of more than 40%
where P was not applied for over 30 years (Schlegel and Havlin, 2017). On the other hand, P losses from
agricultural soils have contributed to eutrophication issues (Jarvie et al., 2017) and approximately 40% of lakes
in the continental USA are considered “most disturbed” owing to high P levels (USEPA, 2016), with nonpoint
source runoff from agricultural cropland a substantial contributor.
The 4R Nutrient Stewardship concept emphasizes applying the right source of each plant nutrient at the right rate, right time, and in the right place. “Right” is defined in terms of making the cropping system more sustainable. Thus, 4R P application practices are those that support improvement of both crop yield and water quality. All four attributes—source, rate, time, and place—of P application can have a large influence on these two impacts, and need to be considered together (IPNI, 2012). The right combination, however, is specific not only to each crop and regional cropping system, but also to the factors unique to each farm and field. These factors include soils, local climate, weather, farmer management ability, markets, logistics of field operations, and vulnerability of local ecosystems. The site-specific nature of 4R practices limits the degree of detail with which they can be described across large regional cropping systems.
There is nevertheless a need to describe 4R P practices, particularly in the context of agricultural sustainability initiatives, in which it is important that a wide range of stakeholders, with different levels of technical knowledge of crop production, have an appreciation for the practices employed by producers, and for the opportunities and costs associated with changing and optimizing such practices.
Phosphorus plays a crucial role in sustainable crop production. Made from finite natural resources, phosphorus fertilizers support high and increasing crop yields, but their use can also elevate the risk for reduced water quality. Increasing the adoption of 4R phosphorus application practices—applying the right source at the right rate, right time, and right place—has great potential to improve both crop yields and water quality. This paper reviews a science-based effort to describe such practices for five major commodity crops produced in North America.
ISSUE REVIEW Ref #17023
By Tom Bruulsema, Phosphorus Program Director, IPNI
March 2017
International Plant Nutrition Institute (IPNI) 3500 Parkway Lane, Suite 550, Peachtree Corners, Georgia 30092-2844 USA
Phone: 770-447-0335; E-mail: [email protected]; Website: www.ipni.net For Issue Review Series visit http://www.ipni.net/IssueReview

4R Phosphorus Management Practices... page 2
Science Workshop
To address this need, the International Plant Nutrition Institute and The Fertilizer Institute sponsored a science
workshop, in collaboration with the Field to Market® Alliance for Sustainable Agriculture. The workshop process
was modeled after a similar effort conducted a year earlier toward developing descriptions of 4R nitrogen practices
(Snyder, 2016). Scientists with recognized expertise in research on P losses from agriculture were invited to a
two-day workshop held in Washington, DC in June 2016. The goal of the workshop was to describe 4R practices
specific to each of the major commodity cropping systems of North America. Extensive discussions among the
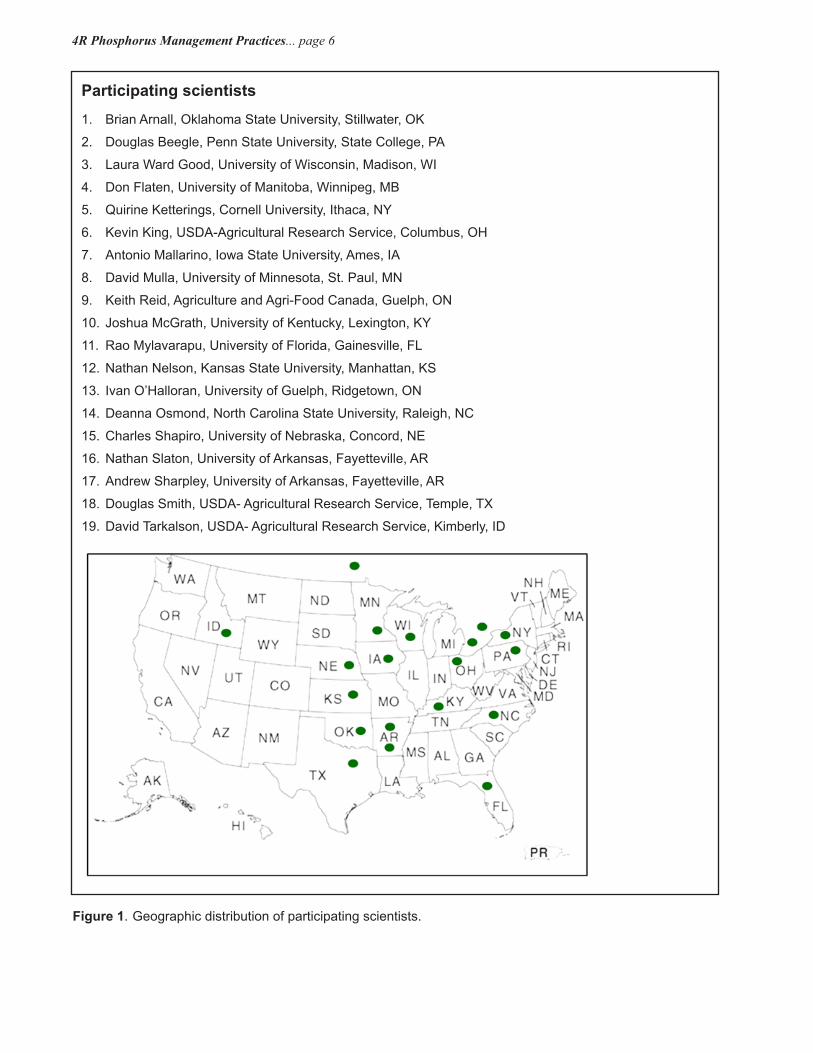
19 participating scientists (Figure 1) were also held by teleconference, in a total of eight sessions, both before
and after the workshop.
This paper summarizes the generalized science-based descriptions of 4R P application practices for five cropping
systems, as agreed to by consensus of the scientists involved. The following guidelines were kept in mind by
participants throughout the process.
• Increasing the adoption of these practices should reduce losses of both dissolved and particulate forms of P
that impact water quality, and be consistent with continued improvement in other sustainability metrics, such
as those in the Field to Market FieldPrint Calculator, enabling sustainable intensification of these cropping
systems by supporting high crop yields and fertile soils.
• These P practices are recommended assuming that best practices are applied to other management areas.
These include management of all other essential plant nutrients, including lime and soil pH, along with crop
management, pest management, and soil and water conservation. Where such practices interact with P
practices in terms of their water quality impacts, they are identified.
• The tier identified as ‘basic’ is intended to serve as a baseline level for farms participating in Field to
Market. Tiers identified as ‘intermediate’ and ‘advanced’ should be implementable, but are not currently in
widespread use. As an approximate guide, the practices identified as ‘basic’ are estimated to be currently
adopted or adoptable on ~50% of the land area in the cropping system. Those identified as ‘intermediate’
and ‘advanced’ may be in current use on ~20% and ~5% of the land area, respectively. The intent of using
these percentages of current adoption is to ensure that the practices identified are practical for farm level
adoption and are supported by currently available technology.
• Practice adoption changes over time. Periodic review on a five-year basis is encouraged, to keep these
practice descriptions current.
Participating scientists wrestled with how to define ‘right’ on a site-specific basis while broadening regions beyond
state and provincial borders, noting that site-specific differences exist even within current recommendations
for specific states and provinces. They were nevertheless able to come to consensus on descriptions for 4R P
practices for five regional cropping systems, as shown in Figure 2 and in detail in Tables 1-5. These cropping
systems include most of the major commodity crops included in the Field to Market FieldPrint Calculator. An
attempt was made to describe 4R P practices for irrigated vegetable production as well, but owing to the diversity
of crops and the multitude of geographic areas of production, it was concluded that insufficient resources were
available to complete the task.

4R Phosphorus Management Practices... page 3
Issues
1. Quantification of P Loss. Most sustainability initiatives aim to quantify as much as possible the outcomes
of all practices assessed. Quantification is needed to allow optimization in situations where there are trade-
offs among different outcomes. In the case of P losses, however, participants noted that quantification is
extremely difficult. Losses depend on the interaction of soils, weather, and all 4Rs of nutrient application, and
the effect of any one practice varies considerably from one field to another, and among years within fields.
Runoff risk models exist, but many are not up to the task of providing a quantitative answer in terms of either
percent reduction of loss, or amounts of loss per unit area of land (Bhandari et al., 2016; Sharpley et al. 2017).
Only recently have some of the P loss models been adapted to trace the impacts of timing and placement of
nutrient application (e.g., Collick et al., 2016) and there has not been sufficient time for widespread validation
of such adapted models. Phosphorus indexes also vary widely in their effectiveness as risk assessment tools
(Osmond et al., 2012; Osmond et al. 2017). In addition, practices differ in their effects on the two major forms
of P loss; some practices that reduce loss of the particulate form may increase loss of the dissolved form,
and vice versa (Dodd and Sharpley, 2015). In view of these concerns, participants agreed that this exercise
would be limited to identifying practices that were directionally correct in terms of their impacts on crop yields
and water quality. Practices identified for the basic tier serve as a description of baseline, useful for the future
application of models supporting sustainability assessment.
2. ‘Recognized’ decision information sources. For many decisions on source-rate-time-place combinations,
participants agreed that it was not appropriate to specify one right choice for all situations within a given regional
cropping system. In fact it was noted that recommendations varied even within the smaller geographic scale
of states or provinces, depending on differences in soils and microclimates. Thus it was often found necessary
to refer to ‘recognized’ jurisdictionally appropriate authorities or agencies for recommendations and guidelines
on practices and risk assessment tools. Participants agreed that these may include land grant universities
appropriate to each state, government extension agencies in Canadian provinces, or multi-stakeholder bodies
(including universities and/or government extension agencies) established to provide recommendations
relevant to soil fertility and plant nutrition. It was noted that the quality of ‘recognized’ recommendations, and
the availability of supporting data, varied greatly among states and provinces.
3. Adaptive management. It was noted that examples exist of consultants and agri-retailers developing their own
databases from adaptive management research in their clients’ fields, and that these sources of information
might be relevant to improvement of recommendations. Participants agreed that such recommendations
could be considered ‘recognized’ at the discretion of the jurisdictionally appropriate authorities or agencies,
as supported by the USDA Natural Resources Conservation Service Title 190 for Nutrient Management (Part
402.3) and the 590 Nutrient Management Conservation Practice Standard.
4. Nutrient management regulations. Participants agreed that all nutrient management practices must meet
or exceed requirements of any locally applicable regulations.
5. Other crop and soil management practices. Management of soil pH, lime, and other nutrients was assumed
to follow locally appropriate practices. Conservation practices (field and farm specific) were assumed to be
used to minimize sediment and nutrient loss in surface runoff and tile discharge.

4R Phosphorus Management Practices... page 4
6. Managing within-field variability. It was noted that jurisdictions vary considerably in recommendations for
sampling intensity (or zone definition) to develop maps of soil P fertility. Participants agreed, however, that use
of yield maps to estimate requirements for replenishing crop removal of P was an approach to be considered.
Also encouraged by several participants was use of terrain or landscape analysis to identify critical source
areas prone to runoff.
7. Knowledge standards. Given the complexity of choosing site-specific practices, the producer or adviser
involved in making practice decisions is encouraged to meet or exceed a knowledge standard equivalent
to that of a Certified Crop Adviser or Certified Nutrient Management Planner, preferably with demonstrated
knowledge of principles of 4R Nutrient Stewardship or comparable competency. The American Society of
Agronomy offers a 4R Nutrient Management Specialist certification.
8. Laboratory certification. For soil, plant or manure analysis, some of the participants noted the importance
of choosing a laboratory that participates in either the North American Proficiency Testing Program (NAPT)
and the Agricultural Laboratory Proficiency Program (ALP).
Caveats
The practice descriptions in the five tables that follow should be viewed as general 4R P management guidance.
More specific guidelines and recommendations are available from recognized information sources at the state and
province levels. The basic tier of management generally specifies that recommended management practices are
implemented at least at the farm level, but most often at the individual field management level. In the intermediate
tier, suites of practices are implemented at least on an individual field-by-field management level, and often
include a formal nutrient management plan, and recommended methods of sampling and analysis to determine
the P amounts in any manures applied. In the advanced tier, practices include implementation of within-field P
management, most often based on a combination of soil maps and crop yield maps. Intermediate and advanced
practices include and build upon practices in the basic tier. A producer should have the large majority (i.e., over
two thirds) of implemented P practices falling within the named tier to ‘qualify’ as having implemented that tier.
Any mention of trade names, products, or technologies does not necessarily imply endorsement, nor exclusion
of those not mentioned.
Acknowledgments
Sincere appreciation is expressed for:
• Contributions and science exchange by all workshop participants listed in Figure 1, before, during, and after
the workshop.
• Input from Bryan Hopkins, Brigham Young University, Bruce Linquist, University of California-Davis, Bobby
Golden, Mississippi State University, Dustin Harrell, Louisiana State University, and Chris Gross and Martin
Adkins, USDA Natural Resources Conservation Service.
• Cooperation of Field to Market leaders, particularly Allison Thomson, and members of its workgroups (Dave
De Geus, Todd Peterson).

4R Phosphorus Management Practices... page 5
• Guidance, budget, management and logistical oversight from Lara Moody and other staff of The Fertilizer
Institute.
• Support by IPNI scientists in North America, who contributed initial “straw dog” practice descriptions to initiate
discussion.
• Workshop facilitation by Bruce and Julie Knight, Strategic Conservation Solutions, LLC.
• Financial support for workshop expenses from The Fertilizer Institute and the International Plant Nutrition
Institute.
References
Bhandari, A.B., N.O. Nelson, D.W. Sweeney, C. Baffaut, J.A. Lory, A. Senaviratne, G.M. Pierzynski, K.A. Janssen, and P.L. Barnes. 2016. J. Environ. Qual. doi:10.2134/jeq2016.07.0272
Collick, A.S., T.L. Veith, D.R. Fuka, P.J.A. Kleinman, A.R. Buda, J.L. Weld, R.B. Bryant, P.A. Vadas, M.J. White, R.D. Harmel, and Z.M. Easton. 2015. J. Environ. Qual. 45:1215-1225. doi:10.2134/jeq2015.03.0135
Dodd, R.J., and A.N. Sharpley. 2016. Nutr. Cycling Agroecosyst. 104:373–392. doi:10.1007/s10705-015-9748-8
IPNI. 2012. 4R Plant Nutrition Manual: a manual for improving the management of plant nutrition, T.W. Bruulsema, P.E. Fixen, and G.D. Sulewski (Eds), International Plant Nutrition Institute, Norcross, GA, USA.
Jarvie, H.P., L.T. Johnson, A.N. Sharpley, D.R. Smith, D.B. Baker, T.W. Bruulsema, and R. Confesor. 2017. J. Environ. Qual. 46:123-132. doi:10.2134/jeq2016.07.0248
Osmond, D., A. Sharpley, C. Bolster, M. Cabrera, S. Feagley, B. Lee, C. Mitchell, R. Mylavarapu, L. Oldham, F. Walker, and H. Zhang. 2012. J. Environ. Qual. 41:1741-1749. doi:10.2134/jeq2012.0013
Osmond, D., C. Bolster, A. Sharpley, M. Cabrera, S. Feagley, A. Forsberg, C. Mitchell, R. Mylavarapu, L. Oldham, D. Radcliffe, J. Ramirez-Avila, D. Storm, F. Walker, and H. Zhang. 2017. J. Environ. Qual. doi: 10.2134/jeq2016.05.0200
Schlegel, A.J., and J.L. Havlin. 2017. Agron. J. 109:335-342. doi:10.2134/agronj2016.05.0294
Sharpley, A., C. Baffaut, D. Beegle, C. Bolster, Z. Easton, P. Kleinman, J. Lory, N. Nelson, D. Osmond, D. Radcliffe, and T. Veith. 2017. J. Environ. Qual. (provisionally accepted).
Snyder, C. 2016. Issue Review, International Plant Nutrition Institute, Peachtree Corners, GA, USA., Ref #16057. http://www.ipni.net/IssueReview
USEPA. 2016. National Lakes Assessment 2012: A collaborative survey of lakes in the United States. EPA 841-R-16-113. U.S. Environmental Protection Agency, Washington, DC. https://nationallakesassessment.epa.gov/
4R Phosphorus Management Practices... page 6
Figure 1. Geographic distribution of participating scientists.
Participating scientists
1. Brian Arnall, Oklahoma State University, Stillwater, OK
2. Douglas Beegle, Penn State University, State College, PA
3. Laura Ward Good, University of Wisconsin, Madison, WI
4. Don Flaten, University of Manitoba, Winnipeg, MB
5. Quirine Ketterings, Cornell University, Ithaca, NY
6. Kevin King, USDA-Agricultural Research Service, Columbus, OH
7. Antonio Mallarino, Iowa State University, Ames, IA
8. David Mulla, University of Minnesota, St. Paul, MN
9. Keith Reid, Agriculture and Agri-Food Canada, Guelph, ON
10. Joshua McGrath, University of Kentucky, Lexington, KY
11. Rao Mylavarapu, University of Florida, Gainesville, FL
12. Nathan Nelson, Kansas State University, Manhattan, KS
13. Ivan O’Halloran, University of Guelph, Ridgetown, ON
14. Deanna Osmond, North Carolina State University, Raleigh, NC
15. Charles Shapiro, University of Nebraska, Concord, NE
16. Nathan Slaton, University of Arkansas, Fayetteville, AR
17. Andrew Sharpley, University of Arkansas, Fayetteville, AR
18. Douglas Smith, USDA- Agricultural Research Service, Temple, TX
19. David Tarkalson, USDA- Agricultural Research Service, Kimberly, ID

4R Phosphorus Management Practices... page 7
Figure 2. Approximate geographic centers of the regional cropping systems for which 4R phosphorus practices were described. Map from 2011 National Land Cover Database. http://www.mrlc.gov
4R Phosphorus Management Practices... page 8
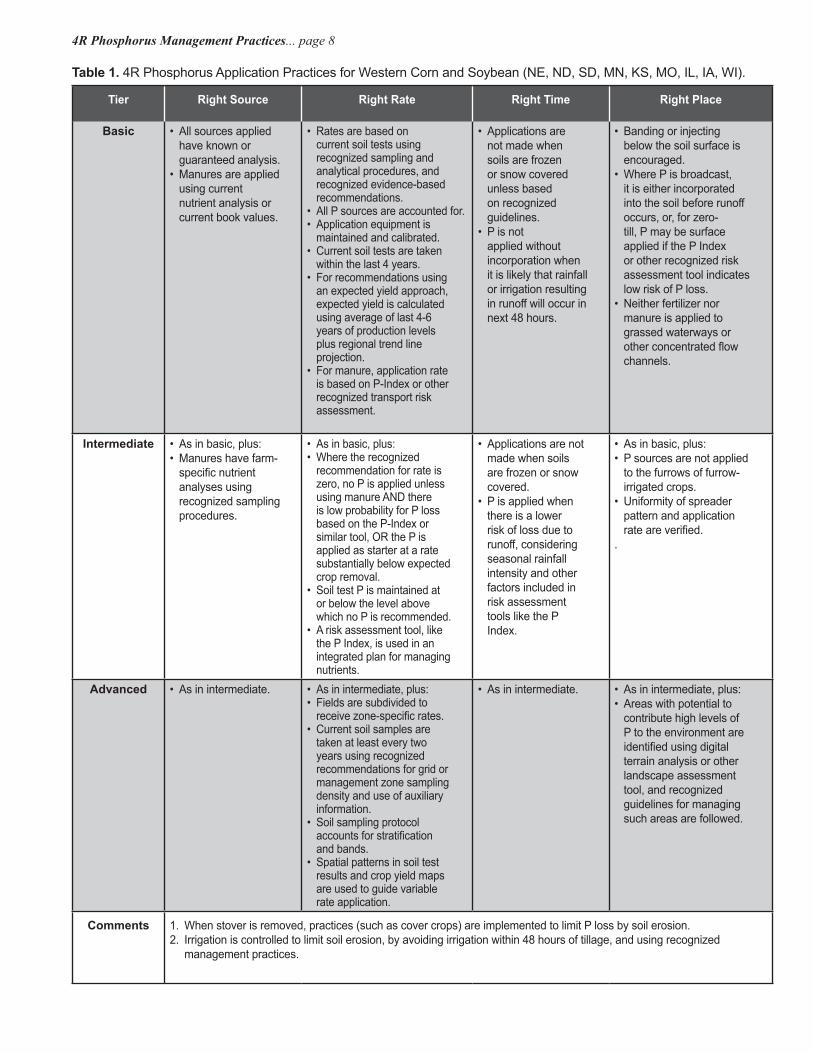
Table 1. 4R Phosphorus Application Practices for Western Corn and Soybean (NE, ND, SD, MN, KS, MO, IL, IA, WI).
Tier Right Source Right Rate Right Time Right Place
Basic • All sources applied have known or guaranteed analysis.
• Manures are applied using current nutrient analysis or current book values.
• Rates are based on current soil tests using recognized sampling and analytical procedures, and recognized evidence-based recommendations.
• All P sources are accounted for. • Application equipment is
maintained and calibrated.• Current soil tests are taken
within the last 4 years.• For recommendations using
an expected yield approach, expected yield is calculated using average of last 4-6 years of production levels plus regional trend line projection.
• For manure, application rate is based on P-Index or other recognized transport risk assessment.
• Applications are not made when soils are frozen or snow covered unless based on recognized guidelines.
• P is not applied without incorporation when it is likely that rainfall or irrigation resulting in runoff will occur in next 48 hours.
• Banding or injecting below the soil surface is encouraged.
• Where P is broadcast, it is either incorporated into the soil before runoff occurs, or, for zero-till, P may be surface applied if the P Index or other recognized risk assessment tool indicates low risk of P loss.
• Neither fertilizer nor manure is applied to grassed waterways or other concentrated flow channels.
Intermediate • As in basic, plus:• Manures have farm-
specific nutrient analyses using recognized sampling procedures.
• As in basic, plus:• Where the recognized
recommendation for rate is zero, no P is applied unless using manure AND there is low probability for P loss based on the P-Index or similar tool, OR the P is applied as starter at a rate substantially below expected crop removal.
• Soil test P is maintained at or below the level above which no P is recommended.
• A risk assessment tool, like the P Index, is used in an integrated plan for managing nutrients.
• Applications are not made when soils are frozen or snow covered.
• P is applied when there is a lower risk of loss due to runoff, considering seasonal rainfall intensity and other factors included in risk assessment tools like the P Index.
• As in basic, plus:• P sources are not applied
to the furrows of furrow-irrigated crops.
• Uniformity of spreader pattern and application rate are verified.
.
Advanced • As in intermediate. • As in intermediate, plus:• Fields are subdivided to
receive zone-specific rates.• Current soil samples are
taken at least every two years using recognized recommendations for grid or management zone sampling density and use of auxiliary information.
• Soil sampling protocol accounts for stratification and bands.
• Spatial patterns in soil test results and crop yield maps are used to guide variable rate application.
• As in intermediate. • As in intermediate, plus:• Areas with potential to
contribute high levels of P to the environment are identified using digital terrain analysis or other landscape assessment tool, and recognized guidelines for managing such areas are followed.
Comments 1. When stover is removed, practices (such as cover crops) are implemented to limit P loss by soil erosion.2. Irrigation is controlled to limit soil erosion, by avoiding irrigation within 48 hours of tillage, and using recognized
management practices.
4R Phosphorus Management Practices... page 9
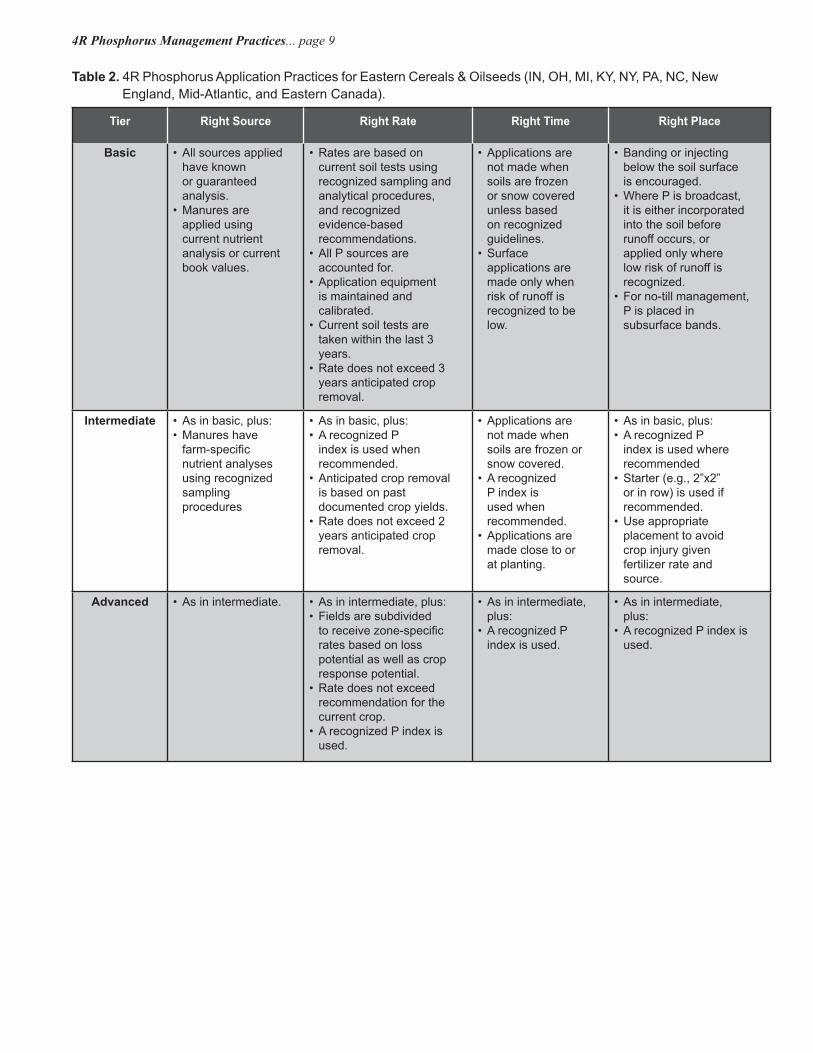
Table 2. 4R Phosphorus Application Practices for Eastern Cereals & Oilseeds (IN, OH, MI, KY, NY, PA, NC, New England, Mid-Atlantic, and Eastern Canada).
Tier Right Source Right Rate Right Time Right Place
Basic • All sources applied have known or guaranteed analysis.
• Manures are applied using current nutrient analysis or current book values.
• Rates are based on current soil tests using recognized sampling and analytical procedures, and recognized evidence-based recommendations.
• All P sources are accounted for.
• Application equipment is maintained and calibrated.
• Current soil tests are taken within the last 3 years.
• Rate does not exceed 3 years anticipated crop removal.
• Applications are not made when soils are frozen or snow covered unless based on recognized guidelines.
• Surface applications are made only when risk of runoff is recognized to be low.
• Banding or injecting below the soil surface is encouraged.
• Where P is broadcast, it is either incorporated into the soil before runoff occurs, or applied only where low risk of runoff is recognized.
• For no-till management, P is placed in subsurface bands.
Intermediate • As in basic, plus:• Manures have
farm-specific nutrient analyses using recognized sampling procedures
• As in basic, plus:• A recognized P
index is used when recommended.
• Anticipated crop removal is based on past documented crop yields.
• Rate does not exceed 2 years anticipated crop removal.
• Applications are not made when soils are frozen or snow covered.
• A recognized P index is used when recommended.
• Applications are made close to or at planting.
• As in basic, plus:• A recognized P
index is used where recommended
• Starter (e.g., 2”x2” or in row) is used if recommended.
• Use appropriate placement to avoid crop injury given fertilizer rate and source.
Advanced • As in intermediate. • As in intermediate, plus:• Fields are subdivided
to receive zone-specific rates based on loss potential as well as crop response potential.
• Rate does not exceed recommendation for the current crop.
• A recognized P index is used.
• As in intermediate, plus:
• A recognized P index is used.
• As in intermediate, plus:
• A recognized P index is used.

4R Phosphorus Management Practices... page 10
Table 3. 4R Phosphorus Application Practices for Wheat in the Great Plains (OK, TX, CO, KS, NE, ND, SD, MT, and Western Canada).
Tier Right Source Right Rate Right Time Right Place
Basic • All sources applied have known or guaranteed analysis.
• Manures are applied using current nutrient analysis or current book values.
• Rates are based on current soil tests using recognized sampling and analytical procedures, and recognized evidence-based recommendations.
• All P sources are accounted for.
• Application equipment is maintained and calibrated.
• Current soil tests are taken within the last 3-5 years by composite field level sampling.
• Applications are not made when soils are frozen or snow covered.
• P is applied prior to or at planting.
• Banding or injecting below the soil surface is encouraged
• Where any source of P is broadcast, it is either incorporated into the soil before runoff occurs, or recognized assessment of the soil and landscape indicates low risk of P loss.
Intermediate • As in basic, plus:• Manures have
farm-specific nutrient analyses using recognized sampling procedures.
• As in basic, plus:• Current soil tests are
collected either every year as field level composite samples, or within the last 3-5 years based on zones of soil type, field history, landscape, or crop productivity.
• Applications are not made when soils are frozen or snow covered.
• All commercial fertilizer P is applied at planting.
• Manure is applied prior to planting.
• As in basic, plus:• Fertilizer P, including
variable rate application, is applied in subsurface bands or as starter in the seed row
• Manure is injected or incorporated (using recognized methods for limiting soil erosion).
Advanced • As in intermediate. • As in intermediate, plus:
• Fields are subdivided to receive zone-specific rates.
• Current soil tests are collected within the last 3-5 years either based on zones of soil type, field history, landscape, or crop productivity, or based on a recognized geometric grid pattern.
• As in intermediate. • As in intermediate, plus:
• Manure is injected.• Where recommended
rate is for starter only, all P is applied as starter in the seed row.

4R Phosphorus Management Practices... page 11
Table 4. 4R Phosphorus Application Practices for Irrigated Potatoes in the Northwest.
Tier Right Source Right Rate Right Time Right Place
Basic • All sources applied have known or guaranteed analysis.
• Manures are applied using current nutrient analysis or current book values.
• Rates are based on current soil tests using recognized sampling and analytical procedures, and recognized evidence-based recommendations.
• All P sources are accounted for.
• Application equipment is maintained and calibrated.
• Recommendations use soil test P AND soil pH or lime content.
• Applications are not made when soils are frozen or snow covered unless based on recognized guidelines.
• Broadcast applications incorporated into the soil are applied in spring or fall.
• Band applications are applied at row markout or planting.
• Banding or injecting below the soil surface is encouraged.
• Where P is broadcast, it is either incorporated into the soil before runoff occurs, or applied only where low risk of runoff is recognized.
• At least 80% of applied P is incorporated into soil.
Intermediate • As in basic, plus:• Manures have farm-
specific nutrient analyses using recognized sampling procedures.
• P fertilizers applied in bands include ammonium.
• As in basic, plus:• Each soil sample
includes at least 20 cores composited from an area no larger than 20 acres.
• The soil test laboratory participates in and has good results from a recognized proficiency testing program.
• Applications are not made when soils are frozen or snow covered.
• Spring broadcast applications are incorporated within 24 hours.
• No P is applied in the fall.• Band applications
(not exceeding 80 lb P2O5/A) are applied at row markout or planting.
• As in basic, plus:• All applied P is
incorporated into soil within 24 hours after application.
Advanced • As in intermediate, plus:
• Enhanced efficiency fertilizers are applied at rates lower than those for conventional sources, as per vetted scientific research.
• As in intermediate, plus:• Fields are subdivided
to receive zone-specific rates.
• Management zones are based on in-season aerial assessments, yield maps, and other useful data layers.
• Site-specific rate is based on multiple-year analysis.
• Soil test P in the bulk root zone is kept below 35 ppm Olsen-P.
• As in intermediate, plus:
• Spring broadcast applications are close to planting and are incorporated within 24 hours (keeping soil undisturbed as long as possible).
• Band applications (40 to 80 lb P2O5/A) are made at row markout or planting.
• Surface applications of P (including fertigation) are avoided.
• As in intermediate, plus:
• Band-applied P at markout or planting is placed in the pathway of the roots.
Comments 1. Use reservoir tillage (uses a “paddle” to make evenly spaced large divots in the furrow so water can pool after irrigation; also called “damer diking.”)
2. Established irrigation best management practices (soil water balance, evapo-transpiration, soil water measurements, scheduling) are followed to minimize runoff.
3. Irrigation system components are maintained for uniform water distribution, minimal runoff, and high water use efficiency.
4. Previous crop residues are kept on the soils surface up to as close to planting as possible to minimize water and wind erosion.
5. Rooting characteristics for P uptake efficiency are considered in variety selection. 6. Diseases and pests that negatively affect root and vascular systems are managed.
4R Phosphorus Management Practices... page 12
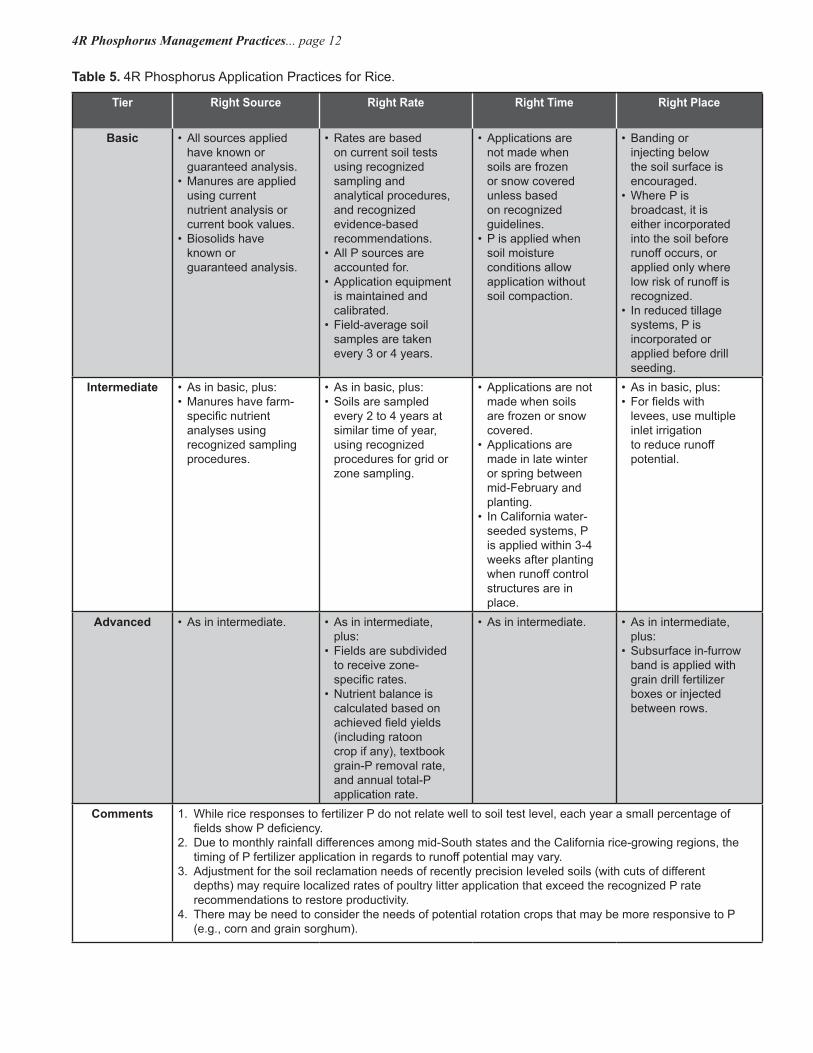
Table 5. 4R Phosphorus Application Practices for Rice.
Tier Right Source Right Rate Right Time Right Place
Basic • All sources applied have known or guaranteed analysis.
• Manures are applied using current nutrient analysis or current book values.
• Biosolids have known or guaranteed analysis.
• Rates are based on current soil tests using recognized sampling and analytical procedures, and recognized evidence-based recommendations.
• All P sources are accounted for.
• Application equipment is maintained and calibrated.
• Field-average soil samples are taken every 3 or 4 years.
• Applications are not made when soils are frozen or snow covered unless based on recognized guidelines.
• P is applied when soil moisture conditions allow application without soil compaction.
• Banding or injecting below the soil surface is encouraged.
• Where P is broadcast, it is either incorporated into the soil before runoff occurs, or applied only where low risk of runoff is recognized.
• In reduced tillage systems, P is incorporated or applied before drill seeding.
Intermediate • As in basic, plus:• Manures have farm-
specific nutrient analyses using recognized sampling procedures.
• As in basic, plus:• Soils are sampled
every 2 to 4 years at similar time of year, using recognized procedures for grid or zone sampling.
• Applications are not made when soils are frozen or snow covered.
• Applications are made in late winter or spring between mid-February and planting.
• In California water-seeded systems, P is applied within 3-4 weeks after planting when runoff control structures are in place.
• As in basic, plus:• For fields with
levees, use multiple inlet irrigation to reduce runoff potential.
Advanced • As in intermediate. • As in intermediate, plus:
• Fields are subdivided to receive zone-specific rates.
• Nutrient balance is calculated based on achieved field yields (including ratoon crop if any), textbook grain-P removal rate, and annual total-P application rate.
• As in intermediate. • As in intermediate, plus:
• Subsurface in-furrow band is applied with grain drill fertilizer boxes or injected between rows.
Comments 1. While rice responses to fertilizer P do not relate well to soil test level, each year a small percentage of fields show P deficiency.
2. Due to monthly rainfall differences among mid-South states and the California rice-growing regions, the timing of P fertilizer application in regards to runoff potential may vary.
3. Adjustment for the soil reclamation needs of recently precision leveled soils (with cuts of different depths) may require localized rates of poultry litter application that exceed the recognized P rate recommendations to restore productivity.
4. There may be need to consider the needs of potential rotation crops that may be more responsive to P (e.g., corn and grain sorghum).