4R Nutrient Stewardship - WordPress.com
53
To 4R or Not to 4R – Is There an Option?
Transcript of 4R Nutrient Stewardship - WordPress.com

To 4R or Not to 4R – Is There an Option?

August 3, 2014

Setting the Stage for 4R Nutrient Stewardship in Ontario
• “Phosphorus” in the Great Lakes with the focus on the western basin of Lake Erie.
• Multiple Point & Nonpoint Sources of Phosphorus:• Point sources include sewage
treatment plants and direct industrial sources.
• Nonpoint sources include agricultural and urban runoff, faulty septic tanks, etc.
• Recognition that agriculture needs to do its part in managing phosphorus loss – 4R Nutrient Stewardship is a major step in this direction.

Taking 4R from Theory to the Field
• Some examples of the ‘common sense’ aspects of 4R Nutrient Stewardship:– Fertility recommendations based on soil tests.
– Crop nutrients containing phosphorus will not be applied on snow-covered or frozen soil.
– Utilizing different strategies for the application and/or incorporation of crop nutrients.
– Taking the necessary steps to minimize the “non-growing season” loss of nutrients.
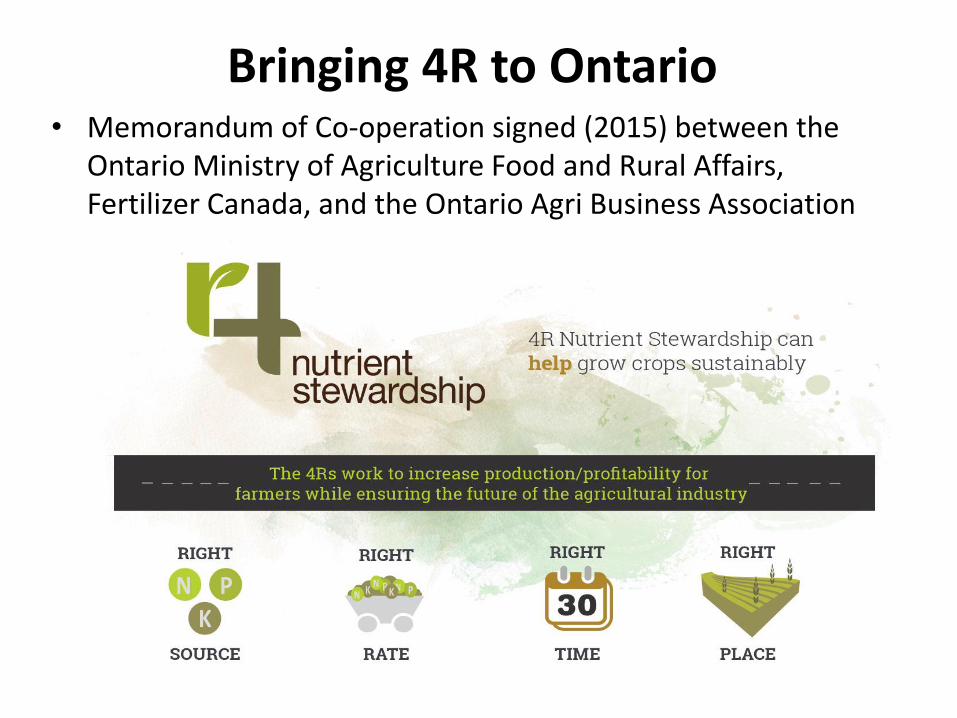
Bringing 4R to Ontario• Memorandum of Co-operation signed (2015) between the
Ontario Ministry of Agriculture Food and Rural Affairs, Fertilizer Canada, and the Ontario Agri Business Association

4R Ontario… What are the key messages?
1. Crop nutrients are essential for the growth of nutritious food to feed Ontarians, Canadians and people around the world.
2. The efficient use of nutrients from mineral fertilizers, manure or other sources, minimizes the risk of nutrient losses to ground and surface water sources.
3. 4R Nutrient Stewardship provides farmers with practical, evidence-based solutions that benefit both the environment and farm profitability.

Why 4R Nutrient Stewardship?
• The need to address algal blooms in Western Basin of Lake Erie
• Increased focus on environmental issues by current government
• 4Rs referenced in MOECC’s Great Lakes Action Plan and the Canada – U.S Great Lakes Agreement
• Farm sector needs to take a leadership role in developing a solution
• 4R is a ‘good fit’ with the current move toward sustainability programs
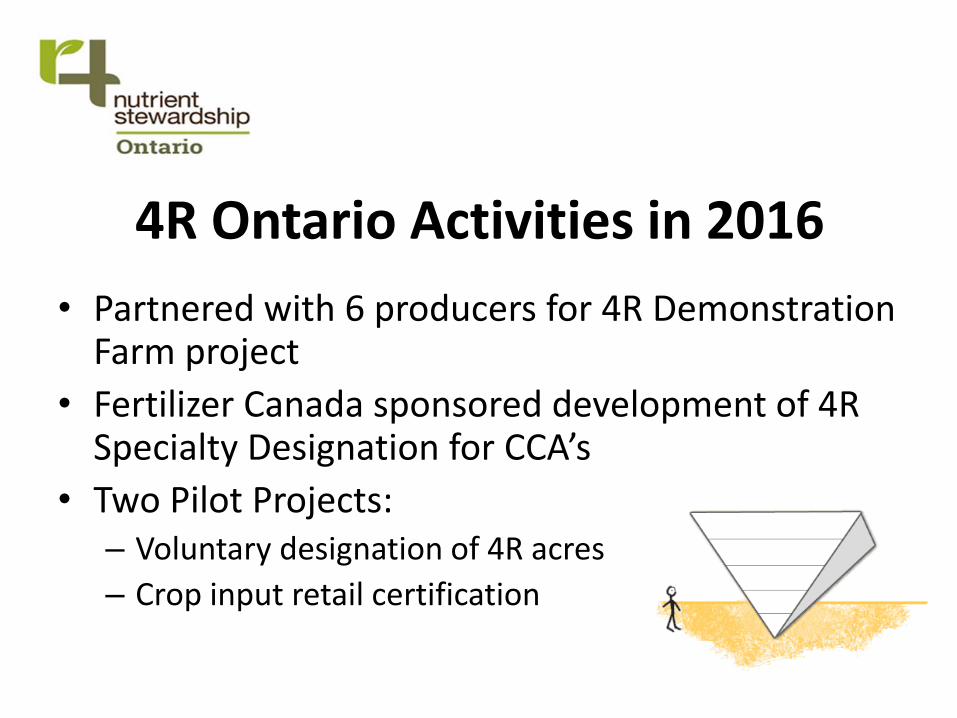
4R Ontario Activities in 2016
• Partnered with 6 producers for 4R Demonstration Farm project
• Fertilizer Canada sponsored development of 4R Specialty Designation for CCA’s
• Two Pilot Projects:– Voluntary designation of 4R acres
– Crop input retail certification

4R Retail Certification Pilot Program
• The 4R Ag Retail Certification pilot program involves voluntary certification of agri-retail facilities that focuses on a series of 41 auditable criteria established by the Ohio program and based on the principles of 4R Nutrient Stewardship.
• 4 Ontario agri-retail locations in the South Western Ontario volunteered to participate in the audit program for the pilot program: – Thompsons Limited– Setterington’s Fertilizer Service Ltd.– AGRIS Co-operative Ltd.– South West Ag Partners Inc.
• Exploratory audits conducted by the lead auditor from the 4R Ohio indicated that Ontario ag-retailers were very close to meeting the audit standards with their current “business as usual” practices.

4R Retailer Certification
• Based on pilot project results 4R Ontario Steering Committee has approved the development of a voluntary agri-retailer 4R certification program
• 4R Ontario Science & Technical Committee working on Ontario specific certification/audit standards

Learning from the “Ohio Experience”
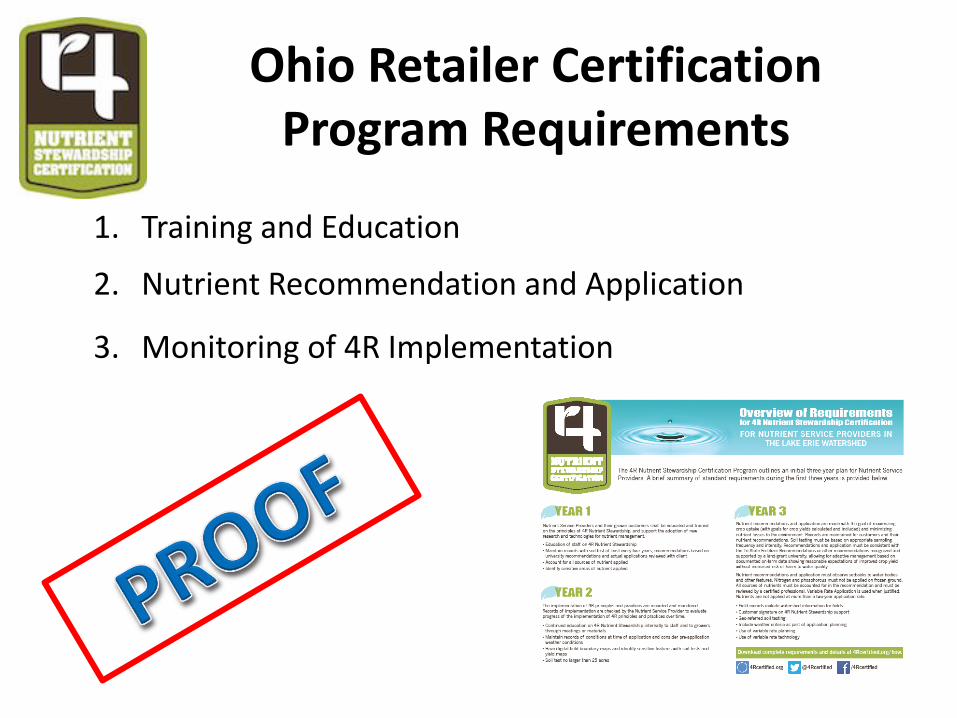
Ohio Retailer Certification Program Requirements
1. Training and Education
2. Nutrient Recommendation and Application
3. Monitoring of 4R Implementation

Ohio - Training & Education
• Certified Professionals must have Initial Training and 5 CEUs every 2 years
• Sales and application staff – 2 hours training every 2 years
• Provide 4R materials for all customers
• Sponsor training for growers/customers

Ohio -Nutrient Recommendations
• Soil Test – 4 year minimum
interval
• Nutrient Recommendations:
provided by certified
professional
science-based
• Utilize crop history and yield
goals

Ohio - Nutrient Application
• Annual calibration of equipment
• Nutrient application consistent with recommendations
• No application to frozen or snow-covered soil
• By year 3 of audit cycle - no surface application without immediate incorporation if NOAA weather forecast exceeds a 50% chance of one inch or more of rain
• By year 3 - utilize GIS and VRT on 35% of custom application acres

Ohio - Monitoring & Implementation
• Number of farm customers and acres participating
• Records that document recommended rates, application and compliance with 4R audit standards.
• Records that growers support 4R nutrient stewardship

Ohio - Validation by Third Party
Third party audits conducted by the Nutrient Stewardship Council
• Nutrient Stewardship Council (NSC)Agricultural Business
Grower Organization
Government
Environmental NGO (Nature Conservancy)
Universities / Researchers
4R Ontario is MovingForward in 2017!
• Continue to promote increased adoption of 4R; provide general agri-retailer staff and farmer training; and develop affiliated resources
• 4R Retailer Certification – focus on building capacity, industry accountability, relevant targets, program audit standards
• Identify research and science gaps
• Increased communication efforts with all stakeholders, including the grower organizations, government and environmental NGO’s
January 21 2017
4 R Plan Implementation
Dale CowanSenior Agronomist/ Sales Manager
AGRIS and Wanstead Farmers Cooperatives

4 R Plan implementation
• Focus on P Loss Reduction
• First step is to recognize the issue
• Steps to reduce losses
• Putting it all together

Understanding P Loss Reduction • P is an essential nutrient in all ecosystems
including the aquatic systems
• P supports normal plant growth
• Excess P in surface waters supports abnormal growth of algae
• It is the enrichment of surface water with excessive amounts of P that is the issue (from all sources)
• Agriculture is one of those sources
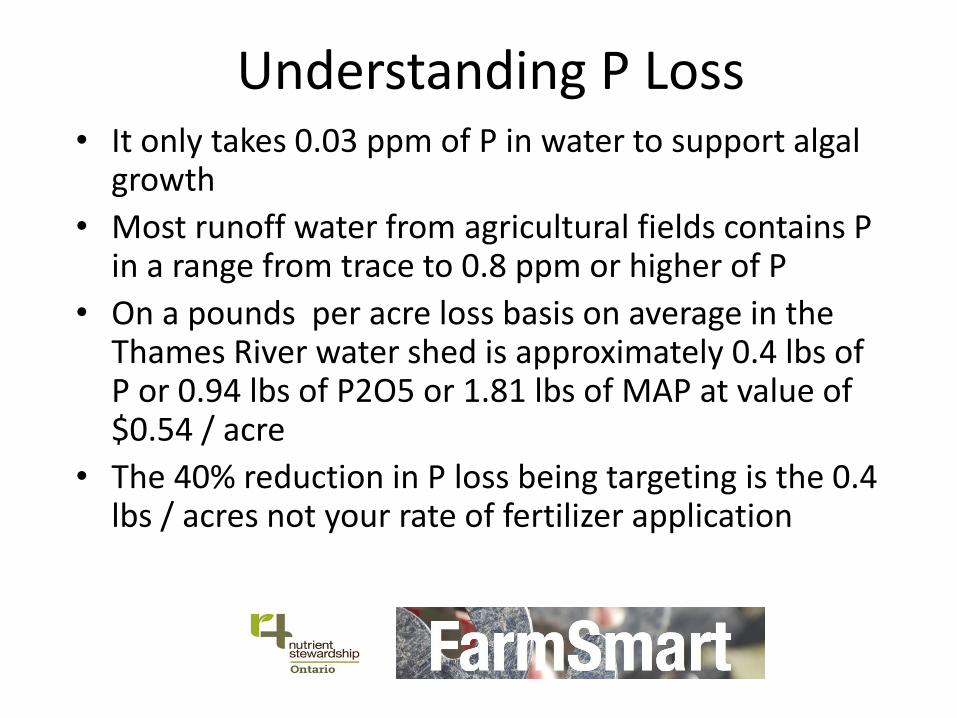
Understanding P Loss • It only takes 0.03 ppm of P in water to support algal
growth
• Most runoff water from agricultural fields contains P in a range from trace to 0.8 ppm or higher of P
• On a pounds per acre loss basis on average in the Thames River water shed is approximately 0.4 lbs of P or 0.94 lbs of P2O5 or 1.81 lbs of MAP at value of $0.54 / acre
• The 40% reduction in P loss being targeting is the 0.4 lbs / acres not your rate of fertilizer application


Understanding P Loss • When is the loss the greatest?
• In the non growing season
• Early spring with snow melt and spring rain runoff
• Late fall post harvest


What practices increase potential Loss of P
• Tillage that leaves very little residue on the surface
• Fall application of phosphorus left un-incorporated or shallow incorporation (no till, frozen ground)
• Not soil testing to determine rates of application and running the risk of over application

Sodium Bicarb P extraction by accredited soil test labs is an important feature of our soil test system in Ontario

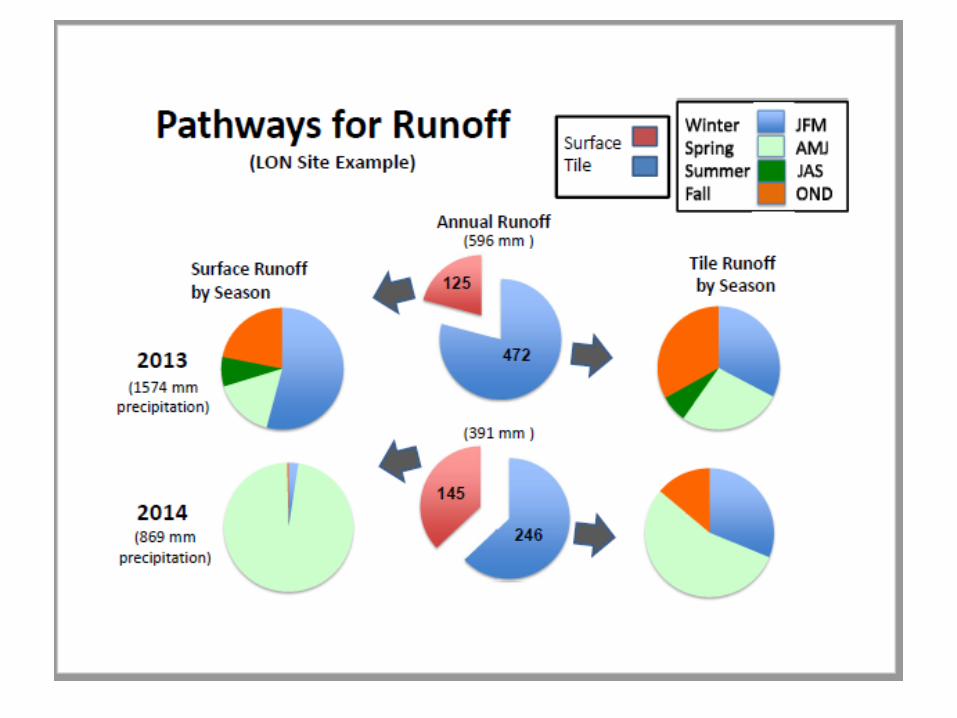
Understanding P Loss • To have P run off, two things need to be in play
• A source load
• An active transport mechanism
• Source load is the amount of P in a position and in a form to move
• The Transport mechanism(s) is most likely excessive rainfall that causes soil movement past the field edge
• And movement through tile


Management Factors that Influence the Source Load
• Types of Phosphorous
• Particulate P attached to soil particles – PP
• Dissolve Reactive Phosphorous – DRP
• Total P is then the sum of all sources
• The problem today is the DRP
• A small but highly biologically active form that supports algal growth


Management Factors that Influence the Source Load
• Application rates- Sources
• Timing
• Incorporation- stratification
• Placement
• Current Soil testing to determine application rates
• Yield goals
• Method and Timing of those applications
• Taking appropriate credits from other applications

Average P soil test is 22.9 ppm range is 7 to 73 ppm
21 of 46 acres are in the 15 to 20 ppm range
9 acres over 30 ppm
Use Precision Ag technologies to be site specific in management strategies

Site Specific 4 R Nutrient Stewardship• Our Build, Maintenance and Drawdown
recommendation system will support ..• Right Product, Right Rate, Right Time and Right place
nutrient management goals
Soil test Level
Rat
e o
f ap
plic
atio
n
Build
Maintenance
Drawdown
Principles of Build, Maintenance and Drawdown Recommendation Program
Target
Range

Factors that Influence the Transport Mechanisms
• Rainfall amounts and spring snow melt• Intensity and duration of storm events • Erodible surface• No crop residue• Complex slopes• Soil texture • Poor drainage • Tile• Soil compaction• Poor soil health


What can and is being done?• 4 R Nutrient Stewardship Initiatives in Ontario
• MOC signed by the crops input industry, OABA, Fertilizer Canada OMAFRA in 2015
• Certified Crop Advisors have added a 4 R NMS certification
• A 4 R Dealer Certification pilot based on Ohio

What can and is being done?
• What can you do?
• Be aware of your own practices what you do on your land matters
• What everybody does in a watershed matters
• No one snowflake ever thinks its responsible for avalanche either
• Start looking at planning nutrient applications and overlapping BMPs

The Makings of a 4 R Plan
• Soil Test
• Crop Yield goals
• Sources
• Rates
• Nutrient balances
• Placement
• Timing

Field Soil test Results 2016
1001 pH BpH OM P ppm K ppm Mg Zn Mn
7.2 3.1 7 75 120 15 15
Nutrient Recommendations lbs / acre
lime N P2O5 K2O
0 112 80 80
Crop : Corn Prev Crop: Wheat RC - Terminated in late fall but left untouched -Soil Texture M – Sandy loamYG 185 bushelsONC recs 95 lbs of N after Clover One spring tillage pass Manure : liquid Finishing Hog enough for 3000 gallons per acre early fall applied injected Starter – 6-24-6 pop upAdditional Fertilizer resources – Urea + Agrotain Plus, MAP, Potash broadcast incorporated in the spring

Crop Recommendations
Corn Rec YG N P2O5 K2O
185 bus 112 80 80
Sources N P2O5 K20
Manure 48 33/66 87
Balance 64 47 (7)
Popup 6 gal 4 17 4
MAP 57 lbs 6 30
Urea 117 54
Total 174 lbs 112 80/33 91
Crop Removal
185 bus corn
166 78 50
CR Balance
(54) 35 41
Soil Test chg
------ 1 ppm 2.0 ppm
Soil test up to 8 ppm - rec drops to 60 lbs

Social Pillar
• What ecological goods and services did this farmer supply?
• Cover Crop
• Fixed atmospheric N
• Reduced N requirements - NO2 emissions?
• Utilized organic nutrient source- not on frozen ground
• Used 4 R to balance nutrients and applications

Crop Plan
• 4 R s
• Rates
• Sources
• Placement
• Timing

Sustainability: The Triple Bottom Line
• Economic , Environmental and Social
• The economic driver for P loss is not very big $0.54 an acre
• Change is driven by Environmental and Social Pillars
• Environmental is sell explanatory – algal blooms no body wants that
• Social Pillar is the opportunity if viewed through the lens of ecological goods and services and accrued benefits from good land stewardship practices to be recognized …$$

Summary
• Industry is building knowledge capacity to implement 4 R practices
• We have an opportunity to demonstrate P loss reductions through overlapping BMP practices ( recorded)
• Can we move environmental policy from polluter pays to beneficiary pays for accrued benefits of good land stewardship practices?
• It will take documenting 4 R acres as a metric for sustainability