4D Flow MR1-short
9
4D Flow MRI Benjamin Culpepper December 2, 2014 Phase contrast (PC) MRI has seen broad clinical acceptance for the visualization and quantitative evaluation of blood flow in the heart, aorta and large vessels. Further development of phase contrast techniques has resulted in the acquisition of a time-resolved (CINE), 3D PC-MRI with three-directional velocity encoding. This is what we define, or refer to, as 4D Flow MRI, and concisely answers the initial question of, “What is 4D flow MRI?” Using this definition I will – in my presentation – move to the description of 4D flow MRI in the heart for obvious reasons. Once we appropriately define 4D flow MRI for investigating and properly imaging blood flow, I detail the various flows that are exhibited throughout blood vessels: stagnant flow, laminar flow, vortex flow, and turbulent flow. Due to the girth of the presentation, we do not spend lengthy moments discussing them any further than necessary. As one might assume, motion of material being imaged – particularly of flowing blood – can result in many possible effects in the produced images. Effects that can appear are: flow voids due to fast moving blood, ghost images of the vessel extending across the image in the phase encoding direction, and flow related dephasing occurring when spin isochromats are moving with different velocities in an external gradient field so that they acquire different phases. The inconsistency of the signal resulting from pulsatile flow can lead to artifacts in the image. Artifacts that are expanded upon include: spin phase effect, flow artifacts, radio frequency overflow, data clipping artifacts, and cerebro spinal fluid pulsation artifacts. Here we digress to a pre-4D flow situation where we examine standard 2D PC-MRI, PC-MRI and velocity encoding sensitivity, and then 4D flow MRI. The first two topics are used to build-up and transition into the realm of 4D flow MRI. Standard 2D PC-MRI (also termed as ‘flow-sensitive MRI’ or ‘MR velocity mapping’) takes advantage of the direct relationship between blood flow velocity and the phase of the MR signal that is acquired during an MRI measurement. In short, we acquire two acquisitions with 1
-
Upload
harry-benjamin-culpepper -
Category
Documents
-
view
80 -
download
1
Transcript of 4D Flow MR1-short
4D Flow MRI
Benjamin Culpepper
December 2, 2014
Phase contrast (PC) MRI has seen broad clinical acceptance for the visualization and quantitative evaluation of blood flow in the heart, aorta and large vessels. Further development of phase contrast techniques has resulted in the acquisition of a time-resolved (CINE), 3D PC-MRI with three-directional velocity encoding. This is what we define, or refer to, as 4D Flow MRI, and concisely answers the initial question of, “What is 4D flow MRI?” Using this definition I will – in my presentation – move to the description of 4D flow MRI in the heart for obvious reasons. Once we appropriately define 4D flow MRI for investigating and properly imaging blood flow, I detail the various flows that are exhibited throughout blood vessels: stagnant flow, laminar flow, vortex flow, and turbulent flow. Due to the girth of the presentation, we do not spend lengthy moments discussing them any further than necessary.
As one might assume, motion of material being imaged – particularly of flowing blood – can result in many possible effects in the produced images. Effects that can appear are: flow voids due to fast moving blood, ghost images of the vessel extending across the image in the phase encoding direction, and flow related dephasing occurring when spin isochromats are moving with different velocities in an external gradient field so that they acquire different phases. The inconsistency of the signal resulting from pulsatile flow can lead to artifacts in the image. Artifacts that are expanded upon include: spin phase effect, flow artifacts, radio frequency overflow, data clipping artifacts, and cerebro spinal fluid pulsation artifacts.
Here we digress to a pre-4D flow situation where we examine standard 2D PC-MRI, PC-MRI and velocity encoding sensitivity, and then 4D flow MRI. The first two topics are used to build-up and transition into the realm of 4D flow MRI.
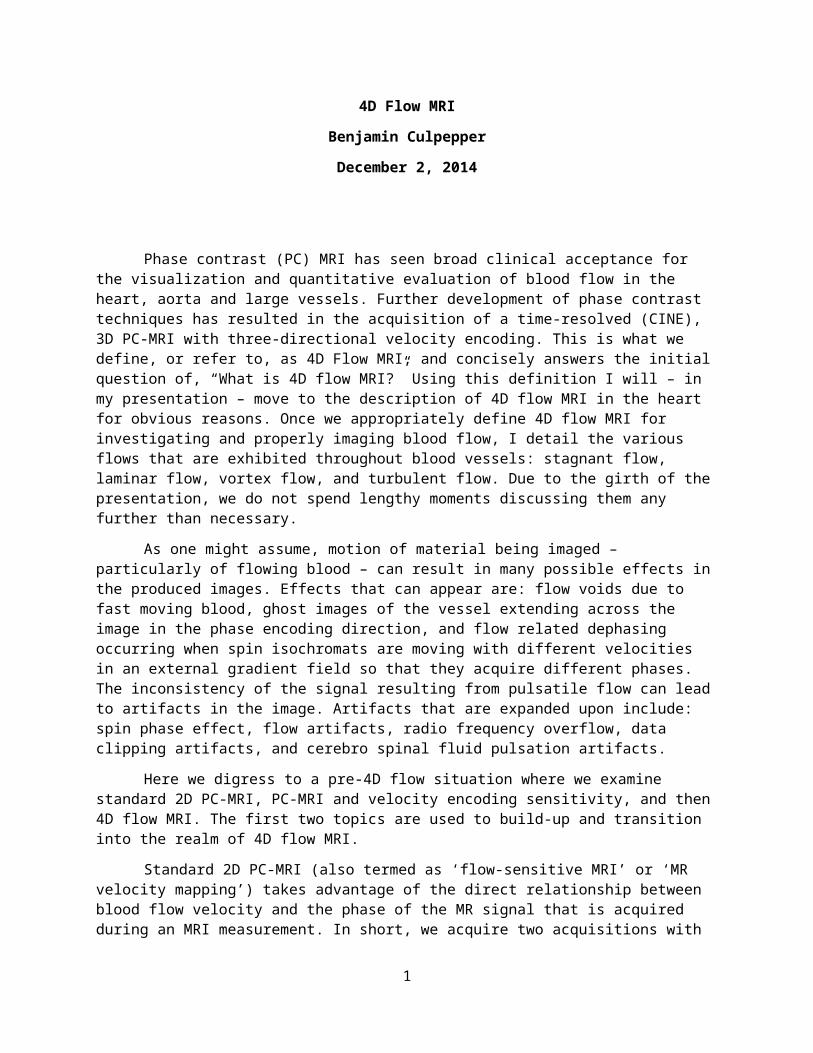
Standard 2D PC-MRI (also termed as ‘flow-sensitive MRI’ or ‘MR velocity mapping’) takes advantage of the direct relationship between blood flow velocity and the phase of the MR signal that is acquired during an MRI measurement. In short, we acquire two acquisitions with different velocity-dependent signal phases to encode and measure blood flow velocity along a single direction, remove “all” background phase effects via subtraction of the above phase images, and, finally, we obtain a resulting phase difference image directly related to the blood flow, which can be used to visualize and quantify blood flow. A clinical application is briefly described along with the technique in how data acquisition occurs for various patients. Typical measurement parameters for 2D CINE PC-MRI:
1) Spatial resolution, 1.5 – 2.5 mm2) Temporal resolution, 30 – 60 ms3) Slice thickness, 5 – 8 mm
1
For cardiac gating, this method synchronizes the heartbeat with the beginning of the repetition time (TR), whereas the R wave is used as the trigger. Cardiac gating times the acquisition of MR data to physiological motion in order to minimize motion artifacts. ECG gating techniques are useful whenever data acquisition is too slow to occur during a short fraction of the cardiac cycle. If a series of images using cardiac gating or real-time echo planar imaging EPI are acquired over the entire cardiac cycle, pixel-wise velocity and vascular flow can be obtained. In simple cardiac gating, a single image line is acquired in each cardiac cycle. Lines for multiple images can then be acquired successively in consecutive gate intervals. By using the standard multiple slice imaging and a spin echo pulse sequence, a number of slices at different anatomical levels is obtained.
2
Figure: Standard 2D CINE PC-MRI with one-directional through-plane (Z) velocity encoding. [4]
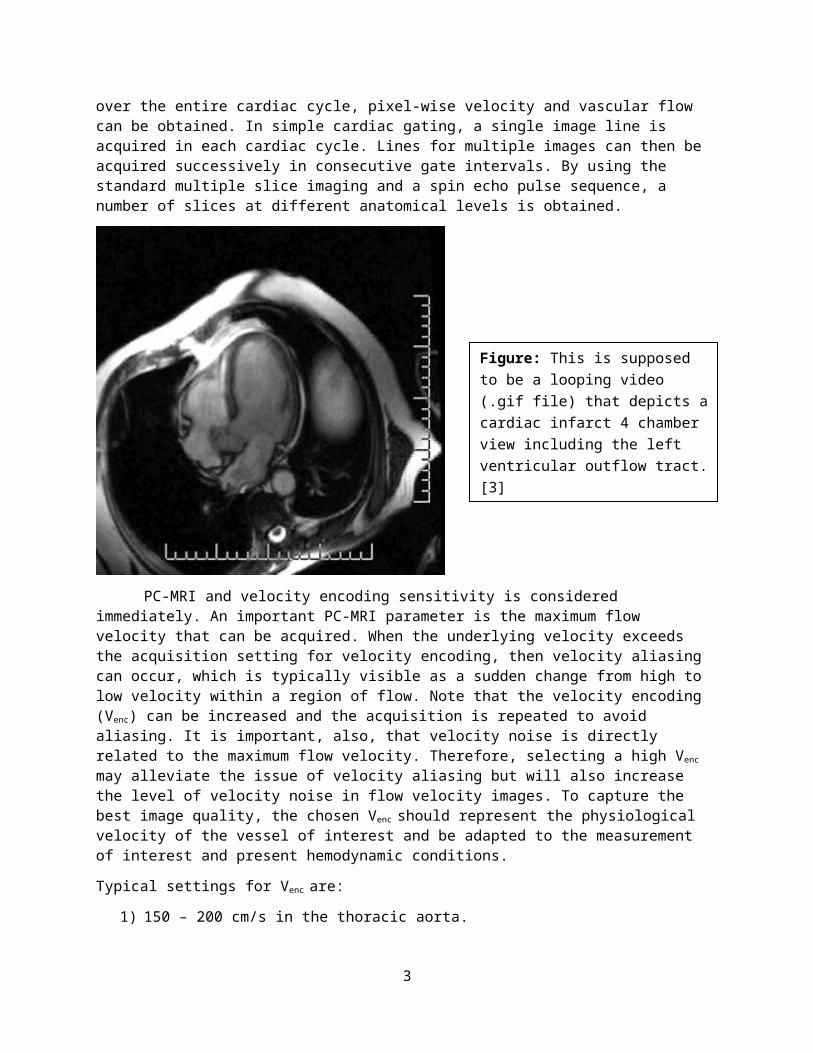
PC-MRI and velocity encoding sensitivity is considered immediately. An important PC-MRI parameter is the maximum flow velocity that can be acquired. When the underlying velocity exceeds the acquisition setting for velocity encoding, then velocity aliasing can occur, which is typically visible as a sudden change from high to low velocity within a region of flow. Note that the velocity encoding (Venc) can be increased and the acquisition is repeated to avoid aliasing. It is important, also, that velocity noise is directly related to the maximum flow velocity. Therefore, selecting a high Venc may alleviate the issue of velocity aliasing but will also increase the level of velocity noise in flow velocity images. To capture the best image quality, the chosen Venc should represent the physiological velocity of the vessel of interest and be adapted to the measurement of interest and present hemodynamic conditions.
Typical settings for Venc are:
1) 150 – 200 cm/s in the thoracic aorta.
2) 250 – 400 cm/s in the aorta with aortic stenosis or coarctation.
3) 100 – 150 cm/s for intra-cardiac flow.
4) 50 – 80 cm/s in large vessels of the venous system.
3
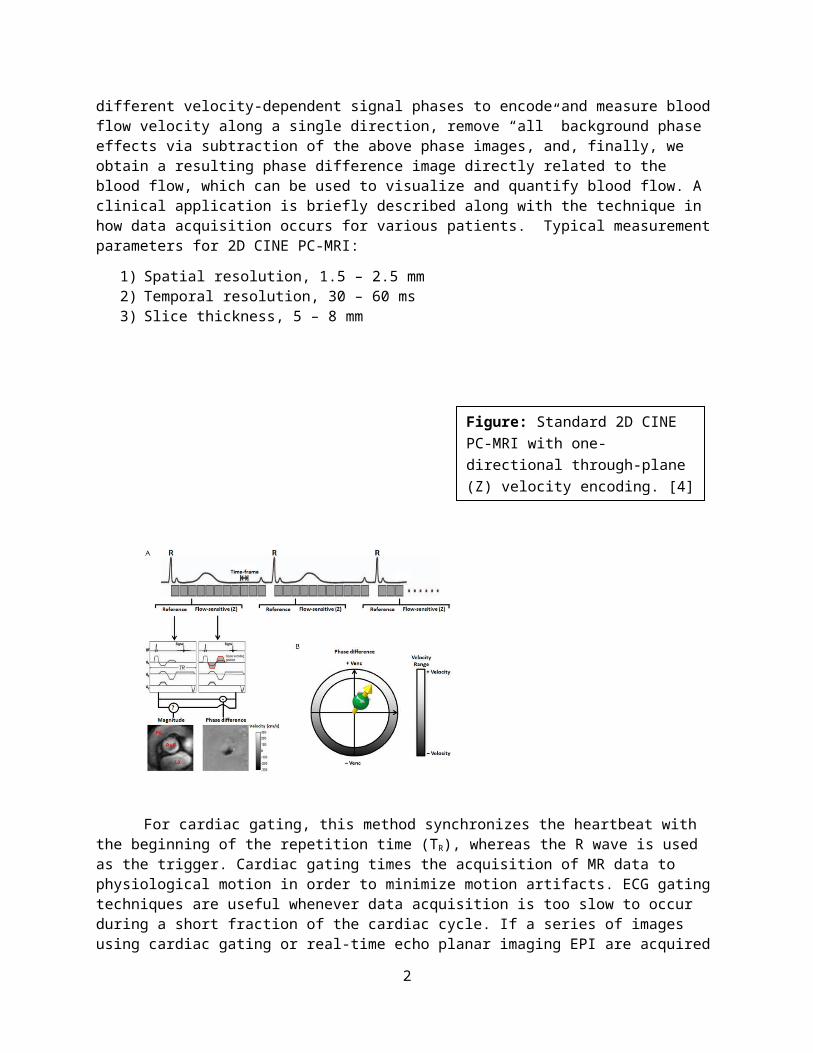
Figure: This is supposed to be a looping video (.gif file) that depicts a cardiac infarct 4 chamber view including the left ventricular outflow tract. [3]
In 4D flow MRI, velocity is encoded along all three spatial directions throughout the cardiac cycle, thus providing a time resolved 3D velocity field. Three-directional velocity measurements can be efficiently achieved by interleaved four-point velocity encoding. After completion of the 4D flow acquisition, four time-resolved 3D datasets are generated. Due to this large amount of data that has to be collected, efficient data acquisition is necessary to achieve practical scan times for 4D flow MRI in clinical applications. From a hardware point-of-view, the availability of high performance gradients has reduced both the echo and repetition times and, thereby, total scan time. The introductions of phased-array coils, multi-receiver channels, and parallel imaging technology have also been applied to PC-MRI, primarily to reduce the scan time. Other methodological improvements include the use of advanced accelerated imaging approaches such as:
1) Radial under-sampling, 2) Kt-BLAST,3) Kt-SENSE, 4) Kt-GRAPPA, 5) Or compressed sensing.
Once we have acquired all 4D flow MRI information, the next step in visualizing the data is to go through preprocessing and corrections analysis. The potential sources of error that might require corrections include: eddy currents, Maxwell terms, and gradient field nonlinearity, and it is important to apply appropriate correction strategies to compensate for these potential errors before further processing of the data for 3D visualization or flow quantification. Maxwell terms and gradient field nonlinearity can be corrected during image reconstruction, but eddy current correction has to be integrated into the data analysis workflow (the tactic considering eddy currents will be discussed in the presentation). Following applied corrections we may proceed to the 3D blood flow visualization, which will include a graphical depiction of 3D streamlines to identify specific systolic flow features such as outflow jets or helix flow. For visualization of the temporal evolution of 3D blood flow over one or more heartbeats, time-resolved pathlines are the visualization method of choice. These pathlines are best viewed and displayed dynamically to fully appreciate the dynamic information and changes in blood flow over the cardiac cycle.
4
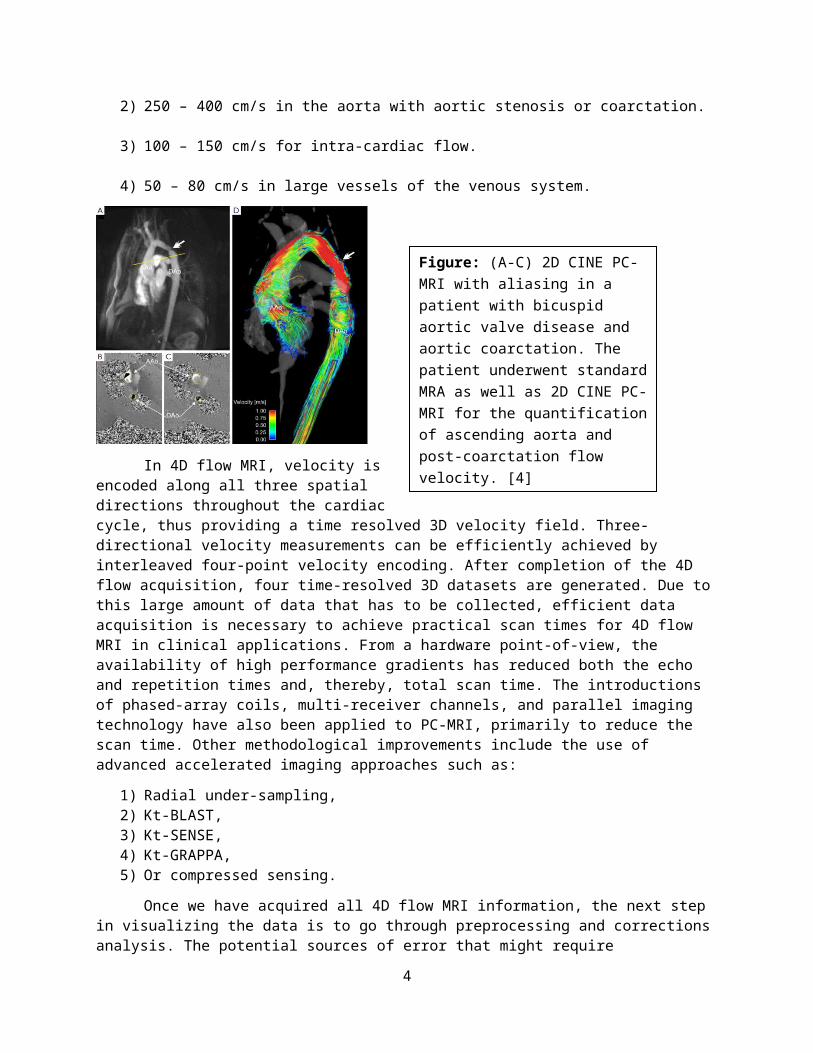
Figure: (A-C) 2D CINE PC-MRI with aliasing in a patient with bicuspid aortic valve disease and aortic coarctation. The patient underwent standard MRA as well as 2D CINE PC-MRI for the quantification of ascending aorta and post-coarctation flow velocity. [4]
Throughout this report (and – as shall occur – in the presentation) we have defined 4D flow MRI, discussed what artifacts might arise from visualization of uncorrected data, discussed 2D PC-MRI and PC-MRI and velocity encoding sensitivity so to build a foundation that led us to the discussion of 4D flow MRI, preprocessing, corrections, visualization, and quantification. Now we shift our attention to that of a clinical application through congenital heart disease (CHD).
When complex CHD is suspected, imaging evaluations provide clinicians with key diagnostic and surgical planning information. However, some patients develop serious complications and regular imaging evaluations are critical to their follow-up care. Whole heart 4D flow MRI techniques allow for a non-invasive comprehensive assessment of cardiovascular hemodynamics in the heart and surrounding great vessels. For this technique, the FOV (field of view) is adjusted to contain the heart and surrounding large vessels to obtain flow data for the entire region in one imaging protocol. The main advantages of whole heart imaging are that it facilitates the systematic assessment of blood flow in multiple vessels and enables the retrospective analysis of any region of interest within the imaging FOV. 4D flow MRI also has the potential to predict or detect complications of CHD earlier in the disease course, which could impact outcomes through improved risk stratification and disease management in these patients. 4D flow whole heart MRI with 3D visualization and quantitative flow analysis has been performed in patients after Tetralogy of Fallot (TOF) repair and marked variations in flow
5
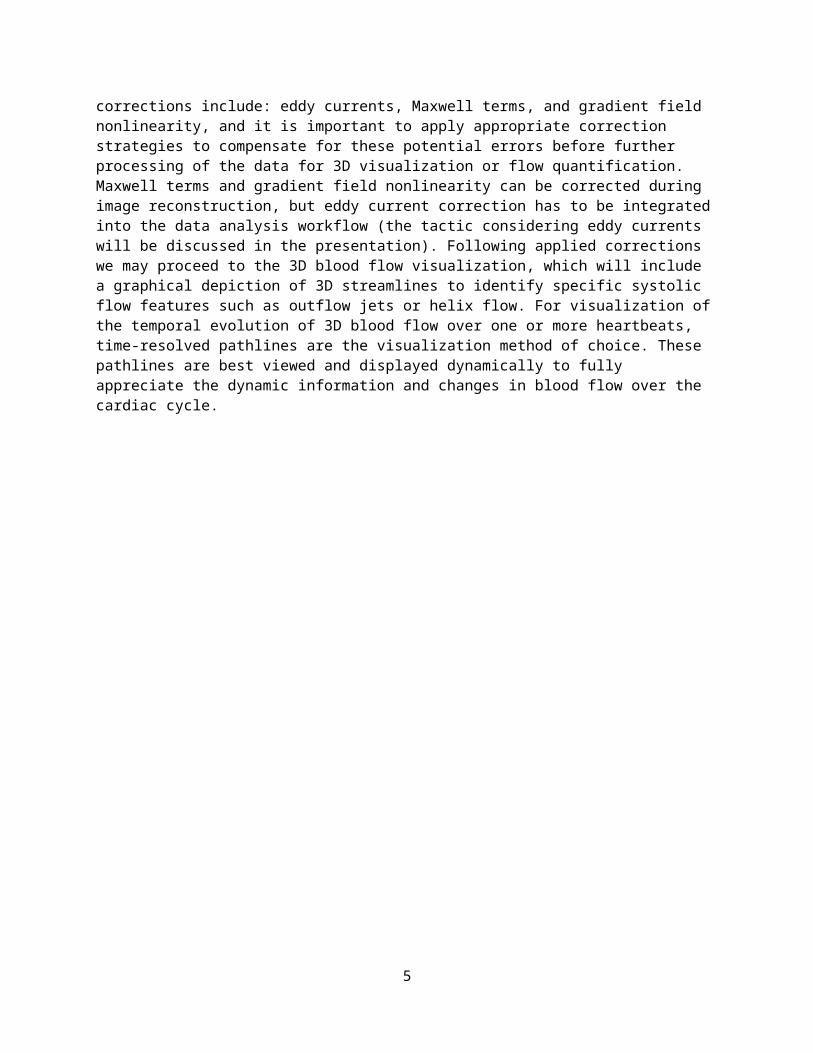
Figure: Data acquisition and analysis workflow for 4D flow MRI. This figure represents a very general procedure for acquiring image data, preprocessing that image data, and then constructing a visual graphic (of 2D or – in this case – 3D). [5]
characteristics were observed. Findings included retrograde flow and vortex formation in the pulmonary trunk (PT) and pulmonary arteries (PA) as well as higher right/left pulmonary artery blood flow ratios, flow velocity and WSS in the PT than healthy patients. These results indicate the feasibility of the comprehensive evaluation of 3D hemodynamics by 4D flow MRI for the post-surgical assessment of patients with TOF.
6
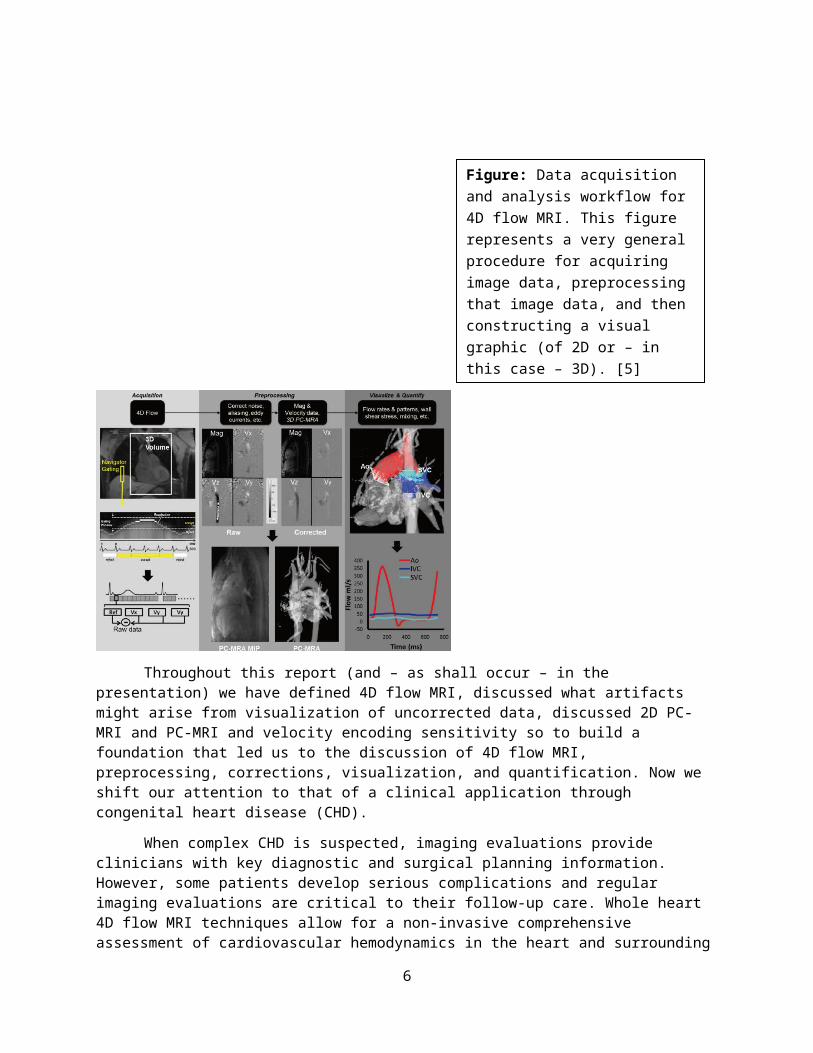
Figure: 17 year-old female with Tetralogy of Fallot repaired with transannular patch at 2 years of age. Particle trace visualization during a right ventricular diastolic time frame demonstrates pulmonary regurgitation (closed arrow). The majority of the flow from the right atrium (RA) into the RV is directed abnormally toward the RV apex (curved dashed arrow) with a smaller vortex just beyond the tricuspid valve (open arrow). Color-coding was achieved with respect to the absolute acquired velocities. SVC = superior vena cava; IVC = inferior vena cava; MPA = main pulmonary artery; RPA = right pulmonary artery. [6]
References:
[1] “Flow.” Magnetic Resonance – Technology Information Portal. Softways 2003. n.d. Web. 4 December 2014.
[2] “Flow Artifact.” Magnetic Resonance – Technology Information Portal. Softways 2003. n.d. Web. 4 December 2014.
[3] “Cardiac Gating.” Magnetic Resonance – Technology Information Portal. Softways 2003. n.d. Web. 4 December 2014.
[4] Stankovic, Zoran. Allen, Bradley D. Garcia, Julio. Jarvis, Kelly B. Markl, Michael. “4D flow Imaging with MRI.” The Cardiovascular Diagnosis & Therapy. 21 October 2013. Web. 1 December 2014.
[5] Choe, Yeon Hyeon. Kang, I-Seok. Park, Seung Woo. Lee, Heung Jae. “MR Imaging of Congenital Heart Disease in Adolescents and Adults.” US National Library of Medicine. National Institutes of Health. Korean Society of Radiology. 30 September 2001. Web. 1 December 2014.
[6] Geiger, J. Arnold, R. Frydrychowicz, A. Stiller, B. Langer, M. Markl, M. “Whole Heart Flow Sensitive 4D MRI in Congenital Heart Disease.” n.p. n.d. Web. 1 December 2014.
7