486-1705-1-PB
8
160 ISSN 1392–1320 MATERIALS SCIENCE (MEDŽIAGOTYRA). Vol. 17, No. 2. 2011 The Influence of Textile Materials Mechanical Properties upon Virtual Garment Fit Kristina ANCUTIENĖ ∗ , Dovilė SINKEVIČIŪTĖ Department of Clothing and Polymer Products Technology, Kaunas University of Technology, Studentu str. 56, LT-51424 Kaunas, Lithuania Received 10 November 2010; accepted 24 April 2011 3D virtual representation of garment provides high potential for design, product development and marketing processes, especially in mass customization strategies implementation. Clothing industry rapidly turns to virtual simulation which not only presents realistic 3D view of garment but also simulates mechanical behaviour of materials. 3D CAD systems can be used to define strain distribution in virtual garment which describes garment fit without actually producing the garment. Strain and distance ease between body and garment depends not only upon body measurements and garment construction, but also on mechanical and structural properties of selected material. The aim of this research was to investigate virtual garment fit using “Modaris 3D Fit” (Lectra) software subjected to fabrics mechanical (tensile, bending, shear) and structural (composition, thickness, area density) properties investigating strain distribution in garment and distance ease between garment and human body. It was defined that for diagonal cut garments the highest influence upon garment fit has fabric tensile properties in weft direction. The highest influence is obtained at high distance ease and small strain values zones and at negative distance ease and high strain values zones. Therefore, presented method could be used for tight-fitted garments also for garments with draperies on purpose to investigate garment fit upon fabrics used. Keywords: distance ease, KES-F, strain distribution, mechanical properties of textile materials, virtual garment fit. 1. INTRODUCTION ∗ Recently with the advancing of the 3D computer technology and the demand of made-to-measure garment, it becomes a major trend to extend the 2D garment CAD into 3D in the garment industry and computer technology. 3D garment modelling now is one of the most interesting topics in the textile engineering, computer graphics and 3D garment CAD [1, 2]. 3D virtual representation of garment provides high potential for design, product development and marketing processes. Advancements in 3D software usable for garment fit evaluation are being made [3] but technology is based on the ideal model, and the space relation between virtual body and virtual garment is not very clear [1, 4]. So, 3D garment design remains an active area of research and this survey is not meant to be complete [2]. Fitness of clothing with body is an important factor to design comfortable and functional clothing [5]. Now, most apparel CAD systems (Gerber Technology, Lectra, Optitex) have 3D virtual clothing simulation softwares for garment fit evaluation. While the garment is constructed from 2D patterns, the quality of fit is evaluated on 3D human models [2]. For this purpose distance ease, wearing silhouette and distribution of strain in virtual garment is analysed without actually producing the garment [6]. The distance ease between body and garment is a main concern of the apparel fit [4]. J. Xu and W. Zhang [1] keep distance ease of garment as the shortest distance from the body surface to the inner surface of clothes on the horizontal cross section curve. In other research [7], three ∗ Corresponding author Tel.: +370-37-300212; fax: +370-37-353989. E-mail address: kristina.ancutiene@ ktu.lt (K. Ancutienė) types of ease allowance were distinguished: standard ease, dynamic ease and fabric ease. Garment fit depends not only on body measurements and garment construction, but also on mechanical and structural properties of selected fabric [4, 5, 8]. Taya Y. et al. [5] found that clothing waveform depends on mechanical properties of material. She stated that material type changing has higher influence upon clothing wave- form than size changing. Xu J. et al. [4] also maintained that there are relation between distance eases and material mechanical properties. Garment pressure is closely related to the space allowance between the body and the garment during body movement [9]. When a garment girth measurement is smaller than human body, pressure is generated. Therefore, garment fit and pressure comfort plays an important role in clothing comfort and function of a garment, especially for tight-fit sportswear [10, 11], also for women’s foundation and burned patients’ recovery shell [12]. Garment pressure and garment fit are affected by body shape, mechanical properties of the fabric and the style of the garment [10, 9]. You F. et al. [11] defined that pressure wearing comfort is dependent upon extensibility of fabrics and fitness of garments. Krzywinski S. et al. [13] also affirmed that fabric extensibility is significant mechanical parameter for close-fitting garments. Garment construc- tion, fabrics used, garment fit and positioning on body plays a significant role in the amount of predictive pressure generated by the compression garments [14]. The aim of this research was to investigate virtual garment fit using “Modaris 3D Fit” (Lectra) software subjected to fabrics mechanical (tensile, bending, shear) and structural (composition, thickness, area density) properties investigating strain distribution in garment and distance ease between garment and human body.
-
Upload
reidaviqui-davilli -
Category
Documents
-
view
216 -
download
0
Transcript of 486-1705-1-PB

160
ISSN 1392–1320 MATERIALS SCIENCE (MEDŽIAGOTYRA). Vol. 17, No. 2. 2011
The Influence of Textile Materials Mechanical Properties
upon Virtual Garment Fit
Kristina ANCUTIENĖ ∗, Dovilė SINKEVIČIŪTĖ
Department of Clothing and Polymer Products Technology, Kaunas University of Technology,
Studentu str. 56, LT-51424 Kaunas, Lithuania
Received 10 November 2010; accepted 24 April 2011
3D virtual representation of garment provides high potential for design, product development and marketing processes,
especially in mass customization strategies implementation. Clothing industry rapidly turns to virtual simulation which
not only presents realistic 3D view of garment but also simulates mechanical behaviour of materials. 3D CAD systems
can be used to define strain distribution in virtual garment which describes garment fit without actually producing the
garment. Strain and distance ease between body and garment depends not only upon body measurements and garment
construction, but also on mechanical and structural properties of selected material. The aim of this research was to
investigate virtual garment fit using “Modaris 3D Fit” (Lectra) software subjected to fabrics mechanical (tensile,
bending, shear) and structural (composition, thickness, area density) properties investigating strain distribution in
garment and distance ease between garment and human body. It was defined that for diagonal cut garments the highest
influence upon garment fit has fabric tensile properties in weft direction. The highest influence is obtained at high
distance ease and small strain values zones and at negative distance ease and high strain values zones. Therefore,
presented method could be used for tight-fitted garments also for garments with draperies on purpose to investigate
garment fit upon fabrics used.
Keywords: distance ease, KES-F, strain distribution, mechanical properties of textile materials, virtual garment fit.
1. INTRODUCTION∗
Recently with the advancing of the 3D computer
technology and the demand of made-to-measure garment,
it becomes a major trend to extend the 2D garment CAD
into 3D in the garment industry and computer technology.
3D garment modelling now is one of the most interesting
topics in the textile engineering, computer graphics and 3D
garment CAD [1, 2]. 3D virtual representation of garment
provides high potential for design, product development
and marketing processes.
Advancements in 3D software usable for garment fit
evaluation are being made [3] but technology is based on
the ideal model, and the space relation between virtual
body and virtual garment is not very clear [1, 4]. So, 3D
garment design remains an active area of research and this
survey is not meant to be complete [2].
Fitness of clothing with body is an important factor to
design comfortable and functional clothing [5]. Now, most
apparel CAD systems (Gerber Technology, Lectra,
Optitex) have 3D virtual clothing simulation softwares for
garment fit evaluation. While the garment is constructed
from 2D patterns, the quality of fit is evaluated on 3D
human models [2]. For this purpose distance ease, wearing
silhouette and distribution of strain in virtual garment is
analysed without actually producing the garment [6].
The distance ease between body and garment is a main
concern of the apparel fit [4]. J. Xu and W. Zhang [1] keep
distance ease of garment as the shortest distance from the
body surface to the inner surface of clothes on the
horizontal cross section curve. In other research [7], three
∗
Corresponding author Tel.: +370-37-300212; fax: +370-37-353989.
E-mail address: kristina.ancutiene@ ktu.lt (K. Ancutienė)
types of ease allowance were distinguished: standard ease,
dynamic ease and fabric ease.
Garment fit depends not only on body measurements
and garment construction, but also on mechanical and
structural properties of selected fabric [4, 5, 8]. Taya Y.
et al. [5] found that clothing waveform depends on
mechanical properties of material. She stated that material
type changing has higher influence upon clothing wave-
form than size changing. Xu J. et al. [4] also maintained
that there are relation between distance eases and material
mechanical properties.
Garment pressure is closely related to the space
allowance between the body and the garment during body
movement [9]. When a garment girth measurement is
smaller than human body, pressure is generated. Therefore,
garment fit and pressure comfort plays an important role in
clothing comfort and function of a garment, especially for
tight-fit sportswear [10, 11], also for women’s foundation
and burned patients’ recovery shell [12].
Garment pressure and garment fit are affected by body
shape, mechanical properties of the fabric and the style of
the garment [10, 9]. You F. et al. [11] defined that pressure
wearing comfort is dependent upon extensibility of fabrics
and fitness of garments. Krzywinski S. et al. [13] also
affirmed that fabric extensibility is significant mechanical
parameter for close-fitting garments. Garment construc-
tion, fabrics used, garment fit and positioning on body
plays a significant role in the amount of predictive pressure
generated by the compression garments [14].
The aim of this research was to investigate virtual
garment fit using “Modaris 3D Fit” (Lectra) software
subjected to fabrics mechanical (tensile, bending, shear)
and structural (composition, thickness, area density)
properties investigating strain distribution in garment and
distance ease between garment and human body.

161
MATERIALS AND METHODS
Tests were performed with ten cotton or cotton
blended fabrics which differed in structure (Table 1) and
mechanical characteristics (Table 2).
Table 1. Structure characteristics of tested fabrics
Code
Yarn
composi-
tion, %
Thick-
ness,
mm
Weave
Area
density,
g/m2
View of draped
fabric sample
cotton11 100
Cotton 0.58 Plain 155
cotton30 100
Cotton 0.66 Plain 304
cotton80 100
Cotton 0.69 Plain 118
stretch
cotton17
99 Cotton,
1 EL 0.62 Plain 145
stretch
cotton20
98 Cotton,
2 EL 0.71 Twill 258
stretch
cotton22
91 Cotton,
8 PA,
1 EL
0.46 Plain 131
stretch
cotton23
94 Cotton,
5 PA,
1 Lycra
0.60 Plain 192
stretch
cotton28
45
Cotton,
50 PES,
5 EL
0.44 Plain 119
stretch
cotton73
45 PES,
53 Cotton,
2 Lycra
0.70 Twill 265
stretch
cotton86
82 PA,
16 Cotton,
2 EL
0.42 Twill 214
PA – polyamide, PES – polyester, EL – elastane.
In order to avoid size difference, it is better to use the
standard mannequin in the study of the garment distance
ease [1]. In our research the tests were performed with 36
size women mannequin (Fig. 1) dressed with close-fitted
dress (Fig. 2).
Because the distribution of distance ease is not even,
ease allowance is necessary to control on breast, waist and
hip areas [1, 15]. In these body areas nearly half of the
respondents reported fit problems [16]. Therefore, for
tested virtual dress different fabrics were adjusted and
distance eases also strains in three main zones – bust, waist
and hips were measured. It should be mentioned that all
three zones coincide with diagonal cut patterns (Fig. 2).
Distance ease between garment and virtual body could be
illustrated by cross-section at waist zone (Fig. 3).
847 mm
647 mm
915 mm
1720
mm
Fig. 1. Virtual mannequin with marked bust, waist and hip zones
Fig. 2. Direction of warp thread in patterns and virtual dress with
marked seam lines
Virtual garment
line - L3D
Tape-measure line -
Lb,w,h
Cross-section of
mannequin waist zone
Fig. 3. Cross-section of virtual mannequin waist zone with tape-
measure and virtual garment lines
Mechanical properties of tested fabrics defined using
KES-F system were inputted into the virtual garment
simulation software “Modaris 3D Fit” (Lectra). This
software was used in our research to investigate the
influence of textile materials mechanical properties upon
close-fitted virtual garment fit.
162
Table 2. Mechanical characteristics of tested fabrics
Code
Bending
resistance B
(10–6 Nm)
Tensile resistance Shearing resistance Friction MIU
EMT (%) LT WT (N/m) G (Nm–1/º) T (Nm–1)
Warp Weft Warp Weft Warp Weft Warp Weft Warp Weft Warp Weft Warp Weft
Cotton11 12.26 9.56 4.10 3.83 0.790 0.773 7.95 7.26 2.94 2.88 15 15 0.1815 0.1838
Cotton30 45.37 94.42 4.31 1.71 0.613 0.632 6.48 2.65 4.17 3.56 49 49 0.1360 0.1507
Cotton80 6.49 6.45 7.13 22.94 0.622 0.469 10.87 26.39 0.45 0.32 10 10 0.2142 0.2170
Stretch cotton17 7.60 5.15 8.38 12.10 0.680 0.633 13.98 18.79 1.28 1.25 15 15 0.1802 0.1730
Stretch cotton20 82.16 41.69 2.38 22.51 0.790 0.685 4.61 37.82 5.83 3.01 49 49 0.1582 0.1735
Stretch cotton22 7.97 2.82 4.58 33.65 0.677 0.532 7.60 43.90 1.28 1.15 10 10 0.1512 0.1635
Stretch cotton23 9.93 8.71 4.73 27.23 0.647 0.553 7.51 36.94 1.84 1.35 15 15 0.1755 0.1807
Stretch cotton28 10.18 3.43 4.79 16.95 0.647 0.538 7.60 22.37 1.59 1.25 15 15 0.1428 0.1518
Stretch cotton73 26.36 17.47 6.29 24.31 0.759 0.677 11.72 40.37 2.58 2.51 10 10 0.1628 0.1245
Stretch cotton86 47.48 4.42 3.45 23.45 0.623 0.506 5.27 29.09 1.10 0.66 15 15 0.1245 0.2638
For the investigation of virtual garment fit distance
ease values in patterns and virtual garment, also strain in
three zones – bust, waist and hips were measured. For this
reason measurable and calculable parameters were used.
The measurable parameters were as following:
1. Lb,w,h – length (mm) of virtual mannequin in
correspondent zone (bust, waist, hip) taken by virtual tape-
measure – dotted line in Figure 3.
2. L3D – length (mm) of virtual garment cross-section
in correspondent zone – continuous line in Figure 3.
3. L2D – length (mm) of 2D patterns measured in
correspondent zone.
Calculable parameters were as following:
1. ES2Db,w,h – distance ease (mm) of 2D patterns in
correspondent zone:
ES2Db,w,h= L2D - Lb,w,h (1)
2. ESb,w,h – distance ease (mm) of 3D garment in
correspondent zone – difference between continuous and
dotted lines (Fig. 3):
ESb,w,h= L3D - Lb,w,h (2)
3. ELb,w,h – strain (%) of 3D virtual garment in
correspondent zone (bust, waist, hip):
ELb,w,h= (EL/L2D)·100 (3)
here EL – elongation (mm) – difference between ease,
measured in 2D patterns and 3D garment and is adequate
to fabric elongation (mm) in tested zone:
EL = ESb,w,h - ES2Db,w,h (4)
In our research not only distance ease and strain values
in different zones were estimated but also distribution of
them in virtual garment was analyzed. In 3D system, the
garment is divided into hundreds of small triangular finite
elements. Each element is viewed as an elastic material [6].
Right size of triangle mesh should be chosen because the
accuracy of computation depends on it. Material behaviour
is attributed to the mesh to simulate the development
depending on the material type [8].
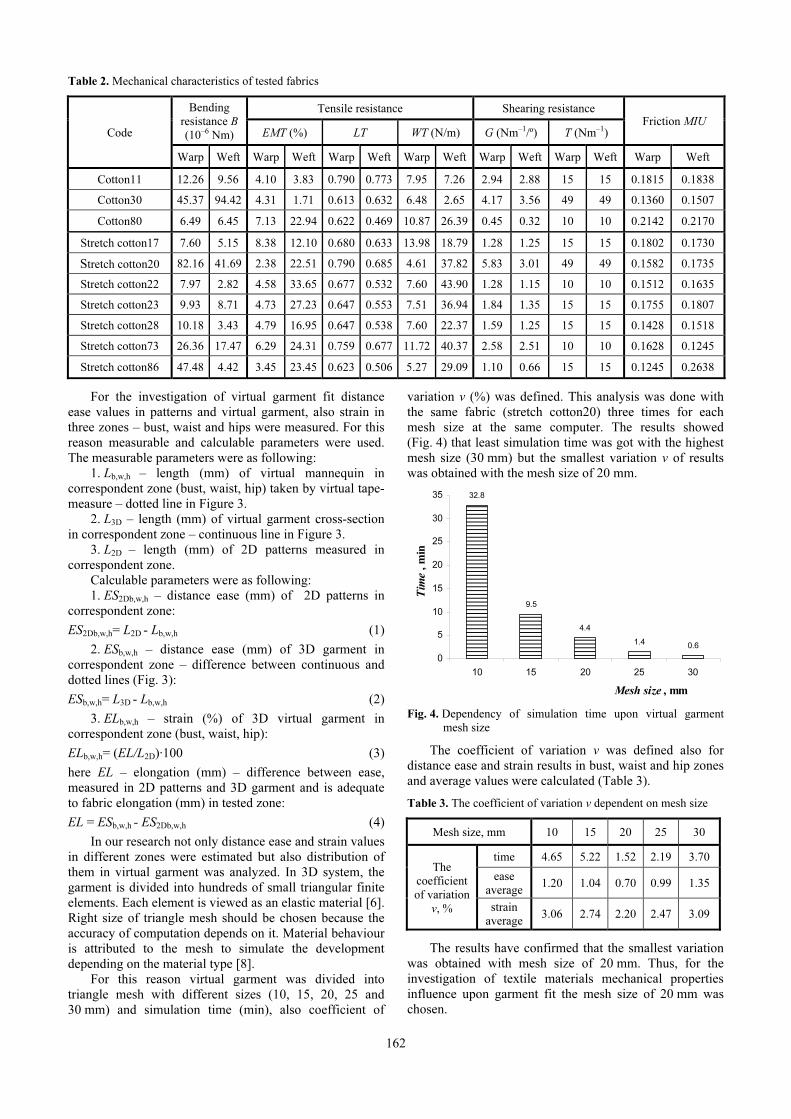
For this reason virtual garment was divided into
triangle mesh with different sizes (10, 15, 20, 25 and
30 mm) and simulation time (min), also coefficient of
variation v (%) was defined. This analysis was done with
the same fabric (stretch cotton20) three times for each
mesh size at the same computer. The results showed
(Fig. 4) that least simulation time was got with the highest
mesh size (30 mm) but the smallest variation v of results
was obtained with the mesh size of 20 mm.
0.61.4
4.4
9.5
32.8
0
5
10
15
20
25
30
35
10 15 20 25 30
Mesh size , mm
Tim
e,
min
Fig. 4. Dependency of simulation time upon virtual garment
mesh size
The coefficient of variation v was defined also for
distance ease and strain results in bust, waist and hip zones
and average values were calculated (Table 3).
Table 3. The coefficient of variation v dependent on mesh size
Mesh size, mm 10 15 20 25 30
The
coefficient
of variation
v, %
time 4.65 5.22 1.52 2.19 3.70
ease
average 1.20 1.04 0.70 0.99 1.35
strain
average 3.06 2.74 2.20 2.47 3.09
The results have confirmed that the smallest variation
was obtained with mesh size of 20 mm. Thus, for the
investigation of textile materials mechanical properties
influence upon garment fit the mesh size of 20 mm was
chosen.

163
For the possibility to compare distance ease and strain
distribution in virtual garment with different fabrics,
constant ease and strain values were chosen: for ease
50 mm (Fig. 5) and for strain 6 % (Fig. 6). Distribution
was analysed in virtual garment and in separate patterns.
Fig. 5. Distance eases ES2D distribution in virtual dress and
patterns
Fig. 6. Strain EL distribution in virtual dress and patterns
For the comparison of strain values in patterns, strain
measure point was chosen at maximum strain cross-section
– bust zone, in the middle of the front pattern (Fig. 7).
Strain measure
point
Fig. 7. Strain measure point in front pattern at bust level
Each measurement of distance ease and strain values
in bust, waist and hip zones was taken three times and
coefficient of variation v was calculated. The correlation
analysis was applied to find which mechanical parameters
(Table 2) influence distance ease and strain values of tested
virtual garment at bust, waist and hip zones.
RESULTS AND DISCUSSION
Distance ease and strain results at close-fitted virtual
garment tested zones – bust, waist and hip confirmed that
fabric influence garment fit (Table 4). The coefficient of
variation v did not exceed 6 %.
The highest distance ease values were obtained at hip
zone, when the highest elongation values were defined at
bust zone (Table 4). Also it was estimated that distance
ease ES2D values at bust zone were negative what means
that pressure would be generated [10]. At waist and hip
zones values were positive, so pressure would not be
generated.
The highest dependency of distance ease ES2D upon
used fabric was defined at hip zone because values spread
the most (46 %), when the smallest dependency was
defined at waist zone (10 %).
Next distribution of distance ease ES2D and elongation
EL in virtual garment with different tested fabrics was
analyzed (Figs. 8 – 10).
Table 4. The values of distance ease ES2Db,w,h, ESb,w,h and strain ELb,w,h for tested fabrics
Code
Bust Waist Hips
ES2Db ESb ELb ES2Dw ESw ELw ES2Dh ESh ELh
mm v, % mm v, % % v, % mm v, % mm v, % % v, % mm v, % mm v, % % v, %
Cotton11 –23.08 1.48 21.83 0.40 5.45 0.84 28.66 1.77 36.94 0.82 1.22 4.93 47.51 0.97 48.13 1.17 0.06 4.23
Cotton30 –21.01 1.11 26.59 2.57 5.33 2.52 27.87 0.73 38.65 3.05 1.50 3.01 45.14 1.93 47.94 1.06 0.21 4.76
Cotton80 –16.55 0.77 26.50 3.64 5.20 1.49 27.12 1.91 33.07 2.38 0.89 4.89 32.50 0.86 34.74 0.50 0.22 2.58
Stretch
cotton17 –21.58 3.60 21.93 1.51 5.27 1.84 27.52 2.22 35.3 0.47 1.22 1.26 41.86 0.85 42.74 0.77 0.09 0.00
Stretch
cotton20 –20.94 1.27 20.68 3.09 5.04 2.12 27.83 1.91 34.15 0.06 0.86 0.83 40.14 0.32 41.43 0.47 0.13 4.56
Stretch
cotton22 –18.07 0.71 21.67 0.51 4.79 0.12 27.13 1.68 33.25 1.27 0.91 2.55 35.52 2.84 37.49 3.09 0.14 4.22
Stretch
cotton23 –17.73 2.04 22.48 1.05 4.84 0.85 26.98 1.23 32.89 1.71 0.89 1.72 34.75 2.22 36.72 2.23 0.21 4.76
Stretch
cotton28 –21.79 1.59 20.49 2.13 5.17 1.10 27.58 4.74 33.77 3.1 0.91 4.42 41.41 1.76 42.32 1.22 0.10 5.59
Stretch
cotton73 –18.03 4.19 22.34 3.06 4.72 4.58 26.58 0.52 32.78 1.03 0.92 3.14 37.41 3.42 38.93 2.86 0.17 4.45
Stretch
cotton86 –16.46 2.53 25.68 0.78 5.06 0.30 26.04 0.09 32.36 0.33 0.94 1.06 32.57 0.99 35.57 0.72 0.32 6.44

164
Fig. 8. Distribution of distance ease ES2D in virtual dress with tested fabrics (sorted by ES2Dh value at hip zone from the lowest to the
highest (Table 4))
cotton80 Tight -26.50 mm
cotton11 Tight -35.50 mm
Fig. 9. Comparison of distance ease ES2D distribution in virtual dress front and back patterns with cotton80 and cotton11 fabrics
Fig. 10. Distribution of strain EL in virtual dress with tested fabrics (sorted by EL at strain measure point (Fig. 7, Table 5) from the
lowest to the highest)
For visual comparison of distance ease distribution
using different tested fabrics, virtual garments were sorted
by ES2Dh values at hip zone (Fig. 8). The lowest distance
ease values were obtained with fabric cotton80 and the
highest with fabric cotton11. The smallest distance ease
could be explained by the smallest shear rigidity G value
of fabric cotton80 (Table 2).
y = -0.27x + 22.14
r = 0.87
y = -2.05x - 1.07
r = 0.95
10
20
30
40
50
-24 -22 -20 -18 -16 -14
ES 2Db, mm
ES
2D
w, ES
2D
h,
mm
ES_2Dw
ES_2Dh
Fig. 11. Relationship between distance ease ES2D at bust zone and
distance ease at waist, also hip zones
Comparison between distance ease values of these two
marginal fabrics (Fig. 9) showed that difference of distance
ease at the same measure point (Fig. 7) is 34 %. Also we
can see that distance ease ES2D with fabric cotton11 at hip
zone is the highest when at bust zone is the smallest, e. g.
the most tight, and vice versa for fabric cotton80 (Table 4).
This means that distance ease at bust and hip zones is
inversely proportional, e. g. has negative relationship
(Fig. 11).
The same relationship at waist zone showed slight
negative character. Distance ease at bust and hip zones
could show such strong negative relationship because of
fabric elongation in virtual garment – at hip zone distance
ease values are the highest and strain values are the
smallest (Table 4). While at bust zone distance ease values
are negative with pressure generated, so the highest strain
of fabric is established.
Distribution of strain EL in virtual dress (Fig. 10) with
tested fabrics showed that the highest influence was
obtained in bust zone and strain differed here even 64 %
(at the same measure point (Table 5)).
Further distance ease in 3D virtual garment ESb,w,h
using different fabrics was analyzed. It was observed that
distance ease in 2D patterns (ES2D) and in 3D garment (ES)
has positive relationship (Fig. 12). The highest coefficient
of correlation r was observed at hip zone, where distance
eases were the highest. And the weakest correlation was
observed at bust zone, where pressure would be generated.
In this zone one fabric (cotton 30) dropped from relation
and after elimination of it coefficient of correlation
becomes r = 0.74. It could be stated that from distance ease
in 2D patterns ES2D distance ease in 3D virtual garment
could be predicted only if distance ease has positive
values.
strech cotton73 strech cotton22 strech cotton23 strech cotton86 strech cotton20 strech cotton28 cotton80 strech cotton17 cotton11 cotton30
cotton80 stretch cotton86 stretch cotton23 stretch cotton73 stretch cotton22 stretch cotton20 stretch cotton28 stretch cotton17 cotton30 cotton11

165
Table 5. Strain distribution in patterns with measured strain value
at bust point
1. stretch cotton73 (9.4 %)
6. stretch cotton28 (11.4 %)
2. stretch cotton22 (9.5 %)
7. cotton80 (strain 11.6 %)
3. stretch cotton23 (9.7 %)
8. stretch cotton17 (12.7 %)
4. stretch cotton86 (10.1 %)
9. cotton11 (13.8 %)
5. stretch cotton20 (10.8%)
10. cotton30 (15.4 %)
Next correlation analysis was done to define
mechanical parameters which influenced garment fit, e. g.
virtual garment distance ease and strain values. For this
reason correlation coefficients were calculated
(Table 6).Correlation analysis has shown that the highest
influence for distance ease and strain at bust, waist and hip
zones had fabric strain EMT and tensile energy WT in weft
direction. Influence of shear rigidity G was weaker and
more impact was defined for distance ease than for strain.
y = 0.91x + 5.07
r = 0.99
0
10
20
30
40
50
30 35 40 45 50
ES 2Dh, mm
ES
h,
mm
a
y = 2.16x - 24.60
r = 0.77
0
10
20
30
40
50
25 26 27 28 29
ES 2Dw, mm
ESw
, m
m
b
y = 0.48x + 32.32
r = 0.49
0
8
16
24
32
-24 -22 -20 -18 -16 -14
ES 2Db, mm
ES
b, m
m
c
Fig.12. Relationship between distance ease in 2D patterns
ES2Db,w,h and in 3D virtual garment ESb,w,h
Table 6. The correlation coefficients r between mechanical parameters of tested fabrics and measured distance ease ES2Db,w,h and ESb,w,h
and strain ELb,w,h (correlations ≥0.60 are picked out in italic)
Mechanical
parameters Direction
Bust Waist Hip
ES2Db, mm ESb, mm ELb, % ES2Dw, mm ESw, mm ELw, % ES2Dh, mm ESh, mm ELh, %
Bending B Warp –0.06 0.07 –0.02 –0.01 0.11 –0.01 0.08 0.13 0.27
Weft –0.28 0.38 0.27 0.33 0.70 0.65 0.45 0.55 0.13
Tensile
EMT Warp 0.10 0.13 0.06 –0.13 –0.07 0.12 –0.11 –0.15 –0.16
Weft 0.74 –0.19 –0.87 –0.68 –0.90 –0.87 –0.85 –0.88 0.32
LT Warp –0.44 –0.64 –0.06 0.43 0.09 –0.12 0.41 0.34 –0.61
Weft –0.71 –0.40 0.28 0.64 0.58 0.44 0.78 0.75 –0.60
WT Warp 0.00 –0.03 0.02 –0.06 –0.05 0.11 0.00 –0.07 –0.31
Weft 0.61 –0.35 –0.92 –0.61 –0.86 –0.86 –0.73 –0.77 0.20
Shear
G Warp –0.49 –0.22 0.12 0.50 0.48 0.26 0.54 0.56 –0.23
Weft –0.60 –0.15 0.22 0.59 0.70 0.55 0.75 0.78 –0.34
T Warp,
Weft –0.39 0.11 0.28 0.41 0.57 0.42 0.44 0.50 0.02

166
Relationship between distance ease (ES2Db,w,h and
ESb,w,h), strain (ELb,w,h) and fabric tensile strain EMTweft
(also tensile energy WTweft) in weft direction could be
described by linear equation (Fig. 13).
y = -0,43x + 47.02
r = 0.85
y = -0.05x + 28.25
r = 0.68
y = 0.17x - 22.80
r = 0.74-30
-20
-10
0
10
20
30
40
50
60
0 10 20 30 40
EMT weft, %
ES
2Db, E
S2Dw,
ES
2Dh,
mm
ES_2Dbust
ES_2Dwaist
ES_2Dhip
a
y = -0.04x + 23.85
r = 0.19
y = -0.18x + 37.74
r = 0.90
y = -0.41x + 48.41
r = 0.88
0
10
20
30
40
50
60
0 10 20 30 40
EMT weft, %
ES
b,
ESw,
ES
h,
mm
ES_bust
ES_waist
ES_hip
b
Fig. 13. Relationship between fabric tensile strain EMTweft and
distance ease ES2D (a) and ES (b)
This relation shows that by increasing of fabric tensile
strain (and tensile energy) in weft direction, distance ease
and strain in close-fitted garment declines slightly. This
could be explained by the fact that the higher the fabric
strain, the better it fits 3D form, so the smaller distance
ease is obtained. The decline at hip zone is the sharpest
because of the highest distance ease values at this zone
(Table 4). Also we can see that relationship where negative
distance ease values (bust zone) are defined (Fig. 13, a) is
positive, e.g. by increasing of fabric tensile strain EMTweft,
distance ease ES2D increases slightly too, e. g. declines
negative value of distance ease and therefore declines
pressure generated.
Relationship between fabric tensile strain EMTweft and
virtual garment strain EL at bust, waist and hip zones
showed (Fig. 14) that by increasing of fabric tensile strain
garment strain decreased slightly. This relation was not
defined at hip zone where garment strain was the smallest.
While at the highest strain zone (bust) the largest slope
angle was obtained. This means that influence of fabric
tensile strain upon virtual garment strain is the most
important in garment compression areas.
Our finding that tensile strain in weft direction is the
most important mechanical parameter influencing garment
fit corresponds to Lai S.S. investigations [17] who stated
that fabric weft elongation is important factor affecting
garment comfort.
y = -0.021x + 5.48
r = 0.87
y = -0.018x + 1.37
r = 0.87
y = 0.002x + 0.12
r = 0.32
0
1
2
3
4
5
6
0 10 20 30 40
EMT weft, %
EL
b, E
Lw,
EL
h,%
EL_bust
EL_waist
EL_hip
Fig. 14. Relationship between fabric tensile strain EMTweft and
virtual garment strain EL
The coefficient of correlation between shear rigidity
Gweft and distance ease ES2D (Table 6, Fig. 15) showed
positive relation in waist and hip zones and negative in
bust zone. Positive relation showed that by increasing of
fabric shear rigidity distance ease increases too.
y = 3.52x + 32.57
r = 0.75
y = 0.39x + 26.63
r = 0.59
y = -1.31x - 17.17
r = 0.60-30
-20
-10
0
10
20
30
40
50
60
0 1 2 3 4
G weft , N/m°
ES
2Db,w,h
, m
m
ES_2Dhips
ES_2Dwaist
ES_2Dbust
Fig. 15. Relationship between fabric shear rigidity Gweft and
distance ease ES2D
This phenomenon was analyzed and it was found that
because of diagonal direction of patterns a wave was
formed at hip zone in one side (Fig. 16). The biggest wave
was formed for the highest shear rigidity fabrics and this
give a reason why distance ease values increased. In waist
zone wave didn’t form, so relationship was almost
horizontal (Fig. 15). In bust zone, where distance ease
values were negative, growing of shear rigidity Gweft values
increased negative values of ES2Db slightly, so pressure
generated would grow, but relation was not strong.
wave
Fig. 16. Wave formed in virtual garment at hip cross-section zone
Obtained results and findings correspond to Xu J.
study [4] who stated that the main factors which affected
distance eases were tensile deformation, bending, shear
and overhanging factor of material. In our study bending

167
rigidity B was not estimated as parameter influencing
garment fit. It could be explained because of diagonal
direction of patterns. In this case tensile strain and shear
parameters play the main role in garment fit.
Existing garment CAD systems use 2D patterns with
predefined standard values of ease allowances for any
body shape and any type of fabric. Differences in fabric
properties that can produce differences in garment fit may
require the implementation of additional variables [18].
Krzywinski S. et al. [13] stated that for implementation of
material parameters into the pattern construction
elongation factors should be calculated. In our study it was
proved that fabric mechanical properties influence garment
fit and according this garment patterns can be corrected,
also proper fabrics could be chosen to achieve the best
garment fit.
CONCLUSIONS
In our research virtual garment fit measuring distance
ease and strain was investigated. It was proved that virtual
garment would fit different on the human body depending
on whether it is made. It was defined that for diagonal cut
garments the highest influence (r = 0.61 – 0.85) upon dis-
tance ease had fabric tensile properties in weft direction.
Shear rigidity in weft direction influences garment balance
especially in hip zone but influence was weaker
(r = 0.59 – 0.75). This result should be tested for straight
cut garments additionally and is intended in our further
research.
The highest influence (46 % – 64 %) of different fabric
used upon virtual garment fit was obtained at high distance
ease and small strain values zone (hip zone) and at
negative distance ease and high strain values zone (bust
zone). So, presented method could be used not only for
garments with draperies but also for close fitted garments
fit evaluation where high standards of fit should be hold.
Paper also provides important information for the
researchers to identify future research directions in 3D
garment fit investigations.
REFERENCES
1. Xu. J., Zhang, W. The Vacant Distance Ease Relation
between Body and Garment Proceedings of Information
and Computing Science Conference 2009: pp. 38 – 41.
2. Liu, Y. J., Zhang, D. L., Yuen, M. M. F. A Survey on
CAD Methods in 3D Garment Design Computers in
Industry 61 2010: pp. 576 – 593.
3. Apeagyei, P. R., Otieno, R. Usability of Pattern
Customising Technology in the Achievement and Testing of
Fit for Mass Customization Journal of Fashion Marketing
and Management 11 (3) 2007: pp. 349 – 365.
4. Xu, J., Zhang, W. A Study on Impact Factors of the
Distance Eases between Body and Garment Proceedings of
Information Conference on Computer-Aided Industrial
Design and Conceptual Design 2008: pp. 201 – 205.
5. Taya, Y. Shibuya, A., Nakajima, T. Evaluation method of
Clothing Fitness with Body – Part 4: Evaluation by
Waveform Spacing between Body and Clothing Journal
Textile Machinery Society of Japan 48 (11) 1995:
pp. 261 – 269.
6. Fan, J., Yu, W., Hunter, L. Clothing Appearance and Fit:
Science and Technology. Cambridge: Woodhead, 2004:
239 p.
7. Chen, Y., Happiette, M., Bruniaux, P., Ng. R., Yu, W. A
new Method of Ease Allowance Generation for
Personalization of Garment Design International Journal
of Clothing Science and Technology 51 (3) 2008:
pp. 161 – 173.
8. Rodel, H., Schenk, A., Herzberg, C., Krzywinski, S. Links
between Design, Pattern Development and Fabric
Behaviours for Clothes and Technical Textiles
International Journal of Clothing Science and Technology
13 (3/4) 2001: pp. 217 – 227.
9. Zhang, X., Yeung, K. W., Li, Y. Numerical Simulation of
3D Dynamic Garment Pressure Textile Research Journal
72 (3) 2002: pp. 245 – 252.
10. Wong, S. W., Li, Y., Zhang, X. Influence of Fabric
Mechanical Property on Clothing Dynamic Pressure
Distribution and Pressure Comfort on Tight-Fit Sportswear
Fiber 60 (10) 2004: pp. 293 – 299.
11. You, F., Wang, J. M., Luo, X. N., Li, Y., Zhang, X.
Garments’s Pressure Sensation (1): Subjective Assessment
and Predictability for the Sensation International Journal
of Clothing Science and Technology 14 (5) 2002:
pp. 307 – 316.
12. Jeong, Y., Hong, K., Kim, S. J. 3D Pattern Construction
and Its Application to Tight-Fitting Garments for Comfort-
able Pressure Sensation Fibers and Polymers 7 (2) 2006:
pp. 195 – 202.
13. Krzywinski, S., Rodel, H., Siegmuns, J. Virtual Product
Development for Close-Fitting Garments Proceedings of
AUTEX 2005 Conference, Slovenia, 27 – 29 June 2005:
pp. 600 – 605.
14. Troynikov, O., Ashayeri, E., Burton, M., Subic, A.,
Alam, F., Marteau, S. Factors Influencing the Effectiveness
of Compression Garments Used in Sports Procedia
Engineering 2 2010: pp. 2823 – 2829.
15. Li, J. Ye, J., Wang, Y., Li Bai, Lu, G. Fitting 3D Garment
Models onto Individual Human Models Computers &
Graphics 34 (6) 2010: pp. 742 – 755.
16. Pisut, G., Connell, J. L. Fit Preferences of Female
Consumers in the USA Journal of Fashion Marketing and
Management 11 (3) 2007: pp. 366 – 379.
17. Lai, S. S. Objective Evaluation for the Comfort of Free
Movement of a Narrow Skirt Clothing and Textiles
Research Journal 20 2002: pp. 45 – 52.
18. Ashdown, S. P., Dunne, L. A Study of Automated Custom
Fit: Readiness of the Technology for the Apparel Industry
Clothing and Textiles Research Journal 24 2006:
pp. 121 – 136.
Presented at the National Conference "Materials Engineering’2010"
(Kaunas, Lithuania, November 19, 2010)