
4.12 Long time effect of Legume Cover Crop (LCC), sugarcane
118
131 components differed in the key limiting factors. For the Karite, with a relatively shallow root system and ability to fix atmospheric nitrogen, water limitation dominated for (29%, 27% and 33% of the simulation period for unpruned, half-pruned and totally pruned trees, respectively). Water limitation was also found to restrict crop growth under this species (26% of the time in unpruned and half-pruned trees, and 30% of the growing season for totally pruned) trees. P limitation restricted crop growth only 8% of the season in unpruned and half-pruned trees and 4% in totally pruned trees. Water limitation under karite is probably due to its shallow root system indicating its high dependency on rainfall water and probable less access to the ground water table. For the Nere tree the main limitations were water (11 to 32% of the simulation time) and P (15 to 42 of the simulated time). Crop growth under Nere was mainly limited by P (32 to 50% of the simulated growing season) corroborate to the findings of Tomlinson et al. (1995) and Bayala et al. (2002). 4.12 Long time effect of Legume Cover Crop (LCC), sugarcane harvest residue (trash) and Bagas (sugarcane processing waste) on soil carbon and sugarcane yield Ultisols is a typical soil type in North Lampung, Indonesia. It is low in soil organic matter content as well as N, P and exchangeable cations. It also has high concentration of Al and Mn. Thus, the main problem in soils of North Lampung is low fertility. Soil organic matter is the key factor to soil fertility. One way to prevent more soil degradation is to maintain soil organic matter. Maintaining soil cover throughout the year, either by cover crop or by mulch, can do this. A continuous biomass is required to stabilize the organic matter content of the soil. According to Young (1989) about 8.5 Mg ha -1 annual input of aboveground biomass is required in order to maintain soil carbon content of 2%. One of the main crops in North Lampung is sugarcane. Sugarcane yields tend to drop rapidly if there is no fertilizer input. A potential source organic input to the systems is sugarcane harvest residue (trash) and Bagas (sugarcane processing waste). Thrash is normally burnt after harvest and Bagas (sugarcane processing waste) is normally piled up around the sugarcane factory creating high risk of fire.
Transcript of 4.12 Long time effect of Legume Cover Crop (LCC), sugarcane
131
components differed in the key limiting factors. For the Karite, with arelatively shallow root system and ability to fix atmospheric nitrogen, waterlimitation dominated for (29%, 27% and 33% of the simulation period forunpruned, half-pruned and totally pruned trees, respectively). Waterlimitation was also found to restrict crop growth under this species (26% ofthe time in unpruned and half-pruned trees, and 30% of the growing seasonfor totally pruned) trees. P limitation restricted crop growth only 8% of theseason in unpruned and half-pruned trees and 4% in totally pruned trees.Water limitation under karite is probably due to its shallow root systemindicating its high dependency on rainfall water and probable less access tothe ground water table. For the Nere tree the main limitations were water (11to 32% of the simulation time) and P (15 to 42 of the simulated time). Cropgrowth under Nere was mainly limited by P (32 to 50% of the simulatedgrowing season) corroborate to the findings of Tomlinson et al. (1995) andBayala et al. (2002).
4.12 Long time effect of Legume Cover Crop (LCC),sugarcane harvest residue (trash) and Bagas(sugarcane processing waste) on soil carbonand sugarcane yield
Ultisols is a typical soil type in North Lampung, Indonesia. It is low in soilorganic matter content as well as N, P and exchangeable cations. It also hashigh concentration of Al and Mn. Thus, the main problem in soils of NorthLampung is low fertility.
Soil organic matter is the key factor to soil fertility. One way to preventmore soil degradation is to maintain soil organic matter. Maintaining soilcover throughout the year, either by cover crop or by mulch, can do this. Acontinuous biomass is required to stabilize the organic matter content of thesoil. According to Young (1989) about 8.5 Mg ha-1 annual input ofaboveground biomass is required in order to maintain soil carbon content of2%.
One of the main crops in North Lampung is sugarcane. Sugarcaneyields tend to drop rapidly if there is no fertilizer input. A potential sourceorganic input to the systems is sugarcane harvest residue (trash) and Bagas(sugarcane processing waste). Thrash is normally burnt after harvest andBagas (sugarcane processing waste) is normally piled up around thesugarcane factory creating high risk of fire.
Wanulcas_Doc1_Rrev.qxd 8/12/2004 9:56 AM Page 131

132
Brawijaya University-Indonesia had conducted an experiment to test theeffect LCC, sugarcane harvest residue (trash) and Bagas (sugarcaneprocessing waste) on sugar cane growth and production. The followingapplications of organic materials were tested on a soil that had been croppedfor more than 10 years after forest conversion: (1) without organic materialsas a control, (2) bagas 8 Mg ha-1, (3) bagas 16 Mg ha-1, (4) sugarcane trash(harvest residue) 8 Mg ha-1. The whole plot was planted a mixed of legumecover crops (LCC) Mucuna pruriens var. utilis and Centrosema pubescens(1:1) and was given rock phosphate 1 Mg ha-1 at the first year and followedby sugarcane for another 2 years.
Based on this experiment, we simulate the systems using WaNuLCASmodel to see the long-term effect of the organic inputs on soil fertility
Chapter 4
Figure 4.14 Soilorganic mattercontent (average peryear) at depth 0 - 5and 5 - 20 cm of soil
Wanulcas_Doc1_Rrev.qxd 9/23/2004 5:22 PM Page 132

133
(Hairiah, et al., 2003). Three different scenarios were used: (A) externalorganic input given only at first year and N and P fertilizer every years withsimilar dosage, (B) external organic input gave every three years and N and Pfertilizer every years with same dosage, (C) external organic input gave everythree years and N and P fertilizer every years with different dosage (ratiodosage/years = 1.2:0.9:0.9 from default value and start from third years).
The simulation predicted that additional organic input do notsignificantly affect the long-term amount of organic carbon of the systems(Figure 4.14). The organic matter content at 0 - 5 cm depth decrease by 0.04 -0.07% per year, which is faster compare to 0.02 - 0.03 % per year at depth 5-20cm.
Figure 4.15 Sugarcane yield (in dry weightstem, Mg ha-1) for 16 years in differenttreatment and scenario
Wanulcas_Doc1_Rrev.qxd 9/23/2004 5:22 PM Page 133

134
The results also predicted that application of sugarcane residues to thesoil lead to a slower declining rate of sugar cane yield if accompanied byapplication of N fertilizer (Figure 4.15). Without N fertilizer application,returning sugarcane residues will cause N immobilization in the soil causinga decrease in sugarcane yield.
4.13 The effect of agroforestry systems based ondiffering leaf phenologies on water balanceand tree and crop growth
In Thika and NaroMoru, West of Mt. Kenya introduction of tree species intothe cropping systems might aggravate the crop since water limitation is animportant factor for the crop performance and yield. The differences of cropperformance and yield may have relation to the tree water uptake that iscorroborate to the tree leaf phonologies. The WaNuLCAS model was used tosimulate water balance of the agroforestry systems based on differing leafphenologies (Muthuri, 2003). The tree was focus on three species G. robusta,A. acuminata and P. fortunei associated with maize. G. robusta is evergreen,A. acuminata is semi-deciduous and P. fortunei is deciduous in term of treewater uptake.
Figure 4.16 and 4.17 shows the components of the water balance by the treesand crops using different leaf phenology for the Thika and Naro Moru site.The simulations of the water balance between Thika and Naro Moru siteshows was not too different. Changing leafing phenology from evergreen,through semi-deciduous to deciduous generally decreased water uptake bythe trees and interception of rainfall by all three trees species. Simulated totalwater uptake was never greater in all agroforestry systems than in solemaize, although the estimated water uptake by the crop component in theagroforestry systems was close to that for sole maize, especially when thedeciduous leafing phenology scenario was adopted.
4.14 Safety net efficiency - effect of root lengthdensity and distribution
The presence of hedgerow tree in the crop field may lessen nutrient leaching.For nutrients of higher mobility leaching could be reduced if tree have arelatively dense root system beneath the crop root zone (a safety net).Cadisch et al., 1997 have explore how such safety net function may depend
Chapter 4
Wanulcas_Doc1_Rrev.qxd 8/12/2004 9:56 AM Page 134

135
on tree root length density in the layer underneath the crop root zone.WaNuLCAS was used to test the positive (safety net functions) and negative(competition for water and N) impacts of simultaneous tree roots on maizeyield by separating relative tree root distribution from absolute root lengthdensity for topsoil and subsoil (van Noordwijk and Cadish, 2002).
Figure 4.16Simulated values forwater balancecomponents in (SM)sole maize andagroforestry systemscontaining (GR) G.robusta, (AA) A.acuminata and (PF) P.fortunei in five yearsimulation involving(E) evergreen, (SD)semi deciduous and(D) deciduous leafphenology scenariosat Thika
Wanulcas_Doc1_Rrev.qxd 9/23/2004 5:22 PM Page 135

136
Chapter 4
Figure 4.17 Simulated values for water balance components in (SM) sole maize and agroforestrysystems containing (GR) G. robusta, (AA) A. acuminata and (PF) P. fortunei in five year simulationinvolving (E) evergreen, (SD) semi deciduous and (D) deciduous leaf phenology scenarios at Naro Moru
Wanulcas_Doc1_Rrev.qxd 9/23/2004 5:22 PM Page 136

137
Figure 4.18 shows that negative effect of the tree can be expected fromtrees that have all their roots in the topsoil, and from trees with only 0 - 10%of their roots in the subsoil, at low overall tree root length. These samerelative tree root distributions at higher total root length (i.e. higher absoluteroot lengths in both top and subsoil) can have a moderate positive effect onmaize yield, while tree root systems with 20% or more of their roots in thesubsoil were consistently positive for crop, the higher the total root length,the more positive the impact on maize.
A remarkable feature of these results is that at default value for totalroot length, the tree root systems with 60% of their roots below the top soilled to (slightly) higher maize yields, than those with more (up to 100%) in thesubsoil, while at total root systems size the 100% in subsoil (0% in top soil)was better for the maize. Although this effect is much too subtle to berecognized in any field data, it seems counter-intuitive.
4.15 Tree root systems dynamic - root functionaland local response
Simulation models can represent belowground resource capture process atdifferent levels of sophistication (van Noordwijk and De Willigen, 1987):
Figure 4.18 Predicted maize yield (A) and tree biomass (B) for the default rainfall situation (2318 mmyear-1), when relative distribution of tree roots with depth as well as total amount of tree roots arevaried independently. Whereas the 'default' tree roots system had 21.5% of its roots in the top layer,a series of data was made that had 0 - 100% of its roots in the top layer and the remainder allocatedto the deeper layers in proportion to the root length densities of the default case (the relativedistribution over the four zones with increasing distance to the tree was not modified). For each ofthese root distributions, the total amount of roots was varied from 0.1 - 1 times the default, whilemaintaining the relative value.
Wanulcas_Doc1_Rrev.qxd 9/23/2004 5:22 PM Page 137

138
1) Level 0. models 'without roots' using empirical resource capture efficiencycoefficients for the relation between water and nutrient supply in the soiland the dynamics of plant growth,
2) Level 2.models that differentiate between soil layers and use empirical data onrelative root distribution to predict resource capture potential in eachzone; root distribution can be schematised via an exponential decreasewith depth (Jackson et al., 1996) or its 2-dimensional elliptical variant(Van Noordwijk et al., 1995), or they can be provided as 'independent'parameters for each layer or zone; change of root length densities withtime can be imposed on the basis of crop age,
3) Level 3. models that consider plants as organisms with the capacity to adjust thetotal amount of roots to the internal balance between above andbelowground resource capture, and the location of new root growth to theparts of the root system with the best opportunities for uptake of theresource that is most limiting overall plant growth.
WaNuLCAS model can predict competition for water and nutrientsbetween trees and crops at 'level 0' and 'level 1'. It can also be used at 'level 2'using spatial root distribution that restrictedly follows the exponential-decrease-with-depth or elliptical distributions. Stress of nutrient (N, P) orwater is an important factor for the crop growth. When nutrient (N, P) orwater stress occurs, the relative allocation of growth reserves to root canincrease quickly.
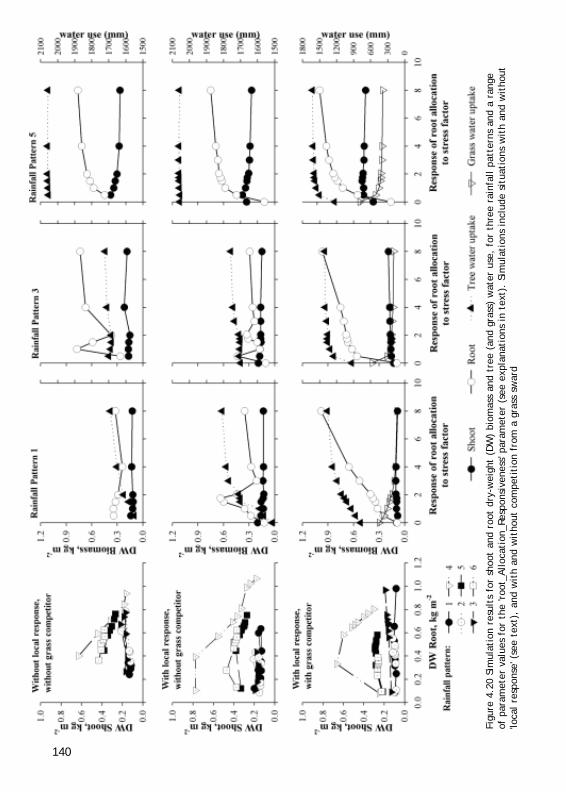
The WaNuLCAS model was used to explore the change of root patternsdue to local response (van Noordwijk, et al., 2003). A series of simulationswas made for a moderately deep soil (1 m) with an annual rainfall of 1000mm. Rainfall patterns ranged from '1 = every day 3 mm of rain' and '2 =every second day 6 mm', to '6 = every 32 days 96 mm'. As the potentialevapotranspiration was assumed to be 4 mm day-1, this environment wouldnot provide enough water to avoid water stress, even if all rainfall were to befully used. Figure 4.19 shows the rainfall patterns lead to situations ofpermanent moderate stress (rainfall pattern 1), alternations of sufficient waterand severe water shortage (rainfall patterns 5 and 6) or intermediate patterns.In the overall water balance, with a decrease in the number of rainy days(through patterns 1 to 6), a decrease in the values for the interception and soilevaporation terms can be noted, while the contribution to groundwater (deepinfiltration) and runoff increases but remains small in absolute value.
Chapter 4
Wanulcas_Doc1_Rrev.qxd 8/12/2004 9:56 AM Page 138

139
Cumulative tree water use tends to increase through rainfall patterns 1 to 6. Ifa grass sward is added to the simulations, canopy interception increases andthus the amount of soil water available to either tree or grass is reduced. Thegrass water use is predicted to benefit more from rainfall patterns 5 and 6than the tree causing a bell-shaped response curve for the tree.
A sensitivity analysis was carried out on the two key parameters for thefunctional shoot/root balance and root distribution:'Root_Allocation_Responsiveness' and 'local response'. Higher values of'Root_Allocation_Responsiveness' lead to a more rapid shift of currentgrowth resources to roots, at the expense of shoot growth, when the totaluptake of water and/or nutrients falls short of current 'demand'. Withincreasing 'local response', root distribution shifts towards the soil layer andspatial zone in which roots are most successful (per unit root length) intaking up the most limiting resource.
'Local response' is simulated in WaNuLCAS by a gradual change in theparameters of the elliptical root distribution, and constrained by the total newlength of roots that can be produced with the carbohydrates allocated. Theintensity of change depends on the T_DistResp parameter and on the degreeto which effective uptake per unit root length of the currently limitingresource differs between soil layers and zones. If roots in deeper layers aremore effective (e.g. in case of water stress), the root distribution can shift to amore gradual decrease of root length density with depth (or even an inverse
Figure 4.19 Water balance for a range of WaNuLCAS simulations, in the absence of functional orlocal response of the tree, with and without a grass sward
Trees Only Trees + Grass
Wanulcas_Doc1_Rrev.qxd 9/23/2004 5:22 PM Page 139
140
Figu
re 4
.20
Sim
ulat
ion
resu
lts
for
shoo
t an
d ro
ot d
ry-w
eigh
t (D
W)
biom
ass
and
tree
(an
d gr
ass)
wat
er u
se,
for
thre
e ra
infa
ll pa
tter
ns a
nd a
ran
geof
par
amet
er v
alue
s fo
r th
e 'ro
ot_A
lloca
tion
_Res
pons
iven
ess'
para
met
er (
see
expl
anat
ions
in
text
). S
imul
atio
ns i
nclu
de s
itua
tion
s w
ith
and
wit
hout
'loca
l re
spon
se' (
see
text
), a
nd w
ith
and
wit
hout
com
peti
tion
fro
m a
gra
ss s
war
d
Wanulcas_Doc1_Rrev.qxd 9/23/2004 5:22 PM Page 140

141
pattern…), if roots in topsoil are more effective (e.g. when P uptake is overalllimiting plant growth and the topsoil has sufficient water content to keep theP mobile) roots will expand (mainly) in topsoil.
The general patterns of root and shoot response in the simulations canbe understood from the re-wetting patterns of the soil (Figure 4.20). In theabsence of a competitor, a stronger root allocation leads to a larger rootsystem, but only in rare situations to a larger shoot biomass or total wateruse. For rainfall patterns 1-4 the 'local response' rules lead to a shallower treeroot system, as the rainfall events are insufficient to rewet the whole soilprofile and superficial roots are thus more effective in water uptake thandeep ones. For rainfall pattern 5 and 6, however, the local response rule leadsto a deeper root system. In the presence of a competing grass sward, totalwater use by the tree is expected to decrease substantially and the treebiomass will consequently be lower. A marked difference with the previoussimulations, however, is that now a larger root allocation can actuallyincrease tree water use and shoot biomass. The competitor is predicted toenhance the increase in the fraction of tree roots in the topsoil for rainfallpattern 1-4. For rainfall pattern 5 the presence of a grass sward is predicted todrive the tree root to a more superficial pattern, rather than the deeperpattern of the monoculture.
Figure 4.21 Relative tree root biomass in the upper 25 cm of the soil profile for a range of values ofthe factor that governs the response to stress of the biomass allocation to roots, with (right) andwithout (left) a competing grass; the grass is assumed not to show a functional or local response, soit has a constant fraction of its roots in the topsoil; the line Rt_TdistResp = 0 indicates a situationwithout 'local response', so the 'response to stress' can modify total root biomass, but not rootdistribution for this setting.
Wanulcas_Doc1_Rrev.qxd 9/23/2004 5:22 PM Page 141

Wanulcas_Doc1_Rrev.qxd 8/12/2004 9:57 AM Page 142

143
Appendix 1Introduction to STELLA
STELLA is a flowchart-based modelling software. It enable users to constructmodel by drawing boxes, circles and arrows. STELLA is similar toModelMaker.
During this session you will learn to build a model, step by step usingSTELLA. The purpose of this session is to familiarize yourself with STELLAand to learn how to use basic features of STELLA for simulation modelling.
STELLA is a multi-level hierarchical environment. It consist of 3 layers:(1) the High Level Mapping Layer; which contain input output relationship(2) Model Construction Layer; where you construct the model(3) an Equation View; to view list of all model elements and relations
Let's try building a simple model based on Trenbath (1984).
Trenbath formulated a simple model of restoration and depletion of 'soil fertility'during fallow and cropping periods, respectively.
'Soil fertility' is defined as a complex of effective nutrient supply and biologicalfactors (diseases, weeds) affecting crop yield. Crop yield is assumed to be directlyproportional to 'soil fertility'.
Assume during a cropping period soil fertility declines with a fraction D per crop,while during a fallow period soil fertility can be recreated with a fraction of R.
Initiating STELLA
Start STELLA by clicking on its icon on the window screen. You will be automaticallyinside a new file.
Move between layers
o Currently you are in the second layer. You can move between layers by clicking onarrow at the top left hand corner.
o You will find all the layers are still empty because you have not construct anything.
appendix 1-3.qxd 9/23/2004 5:42 PM Page 143

144
STELLA has 4 types of building box:
4. Connectors
Constructing a model
o Make sure you are in the second layer. You will notice a globe (world) iconunderneath the arrow at the top left hand corner. On the top you will see 14 icons,starting with 'box' icon at the furthest left and 'ghost' at the furthest right.
o Make a variable of soil fertility. To do this, click on the box icon then click againanywhere on the empty space. Change the name from 'Noname1' into 'Soil Fertility'or any variable name you like. There are no restriction on length. What you havejust made is called building blocks.
1. Stocks
Stocks are accumulations. They collect whateverflows into and out of them.
2. Flows
The job of flows is to fill and drain accumulations.The unfilled arrow head on the flow pipe indicatedthe direction of the flow.
3. Converters
The converter serves a practical and handy role. Itholds values for constants, defines external inputsto the model, calculates algebraic relationships andserves as the repository for graphical functions. Ingeneral it converts inputs into outputs.
The job of the connector is to connectmodel elements.This is an example of how buildingblocks are used.
appendix 1-3.qxd 9/23/2004 5:15 PM Page 144

145
1 MOD(TIME,(TimeCrop+TimeFallow)) will give current time minus the already completed cycles. Theearly part of a new cycle is cropped, the latter part is fallow.
Constructing a model (Continued.)
o Since 'Soil Fertility' will decrease during cropping year, you will have to make anoutflow from 'Soil Fertility'. Name the flow as 'Depletion'.
o 'Depletion' depend on depleting factor (D), length of cropping year and length offallow year (if it is a fallow year, depletion will not occur). Make 3 converters andname them as D, TimeCrop and TimeFallow. Connect all 3 converters to 'Depletion'
o Now you will need to define the relationship between those parameters into anequation in 'Depletion'. See what happen if you click twice on 'Depletion'.
o Click Cancel and see what happen if you click on the globe icon then clicking twiceon 'Depletion'.
o You are now in equation box. Type out the following equation:
IF(MOD(TIME, (TimeCrop+TimeFallow)) <TimeCrop) THEN(Soil_Fertility*D) ELSE(0)1Make sure there is a connection from 'Soil Fertility' to 'Depletion'
o You will see that all building blocks except 'Depletion' has question mark on them.They are asking for a value. Put the following value just for a try out. D=0.4, Soilfertility=10, TimeFallow=3, TimeCrop=3
o Now, do the same step for recreation factor, which is an inflow to 'Soil Fertility'.What do you think should be the equation in 'Recreation'? First try a constant value,for example put
IF(MOD(TIME, (TimeCrop+TimeFallow)) > TimeCrop)THEN(0.2) ELSE(0)
o The Trenbath model used a 'saturation' function in which the recreation depends onthe difference between current fertility and a maximum value (Finf), modified by a'half-recovery time' Kfert, so we make converters for Finf (value e.g. 10) and Kfert(value e.g. 5):
IF(MOD(TIME, (TimeCrop+TimeFallow)) >TimeCrop)THEN((Finf-Soil_Fertility)*Soil_Fertility/(Finf-Soil_Fertility+Kfert*Finf)) ELSE(0)
o Now go to the third layer. You will now see the values and equations of your model.
appendix 1-3.qxd 9/23/2004 5:42 PM Page 145

146
Two types of output can be generated from STELLA; graphs and tables.
Making an Output
o To make a graph click on graph icon (7th icon from left) and click again anywhere. Abox named untitled graph will emerge.
o Click twice on the graph then select 'Soil Fertility' from Allowable Box. Click thearrow pointing to the right. Then click OK.
o You may do the same thing with table icon (8th icon from left)
Running the Program
o To run the program choose Run from Run Menu. You can also run the program bypressing Ctrl-R or clicking the running-man icon in the bottom left hand corner thenclick an arrow pointing to the right.
o To see the simulation result, click twice on the graph or table.
o You will notice that the simulation run until time 12 with Delta Time (DT)=0.25. Youcan change this by choosing Time Spec on Run Menu. Try putting DT=1 and lengthsimulation to 50.
o Run the model again and see what happen.
o Try changing R and D value. At what value would they result in stable condition?
Sensitivity Analysis
STELLA has a sensitivity analysis option. Let's try to see how sensitive 'Soil fertility' tochanges in 'Depletion'
o Choose Sensi Spec from Run Menu. Choose D from Allowable Box then click anarrow pointing to right.
o Click D on Selected Box, then fill the following value: Start=0.2, End=0.6. Click onSet then OK.
o Click twice on graph, then choose graph type as Comparative.
o Now Run the model and see the result.
appendix 1-3.qxd 9/23/2004 5:42 PM Page 146

147
Exercises
The model you have built is very simple. Now try adding other variables to addcomplexity into it. Below are several exercises you may like to try out.
o Add crop production into it. Assume crop production is linearly proportional todecreased in 'soil fertility'/depletion. Find the total crop production duringsimulation.
o Assume that in the sum of cropping time and fallow time is a constant over time (aconstant cycle). Fallow time is a function of total cumulative production. If thecumulative production meet a certain target then continue with the same length offallow time. If cumulative production below target you need to shortened thelength of fallow time to make up for.
o Assume target production as a function of population density and food needed percapita.
appendix 1-3.qxd 9/23/2004 5:42 PM Page 147

appendix 1-3.qxd 9/23/2004 5:42 PM Page 148

149
Appendix 2User's guide to WaNulCAS
Introduction
This user's guide is designed to help users in working with WaNuLCASmodel. Throughout this document, we assumed users have a basic experienceon using software under Microsoft Windows.
To be able to run WaNuLCAS reasonably well the recommended systemrequirements are:Pentium processor or betterMicrosoft WindowsTM 9564 MB RAMVGA display of at least 256 colors
There are two options for running WaNuLCAS:1. Under Stella 5.0 Commercial Run Time (CRT), which is a 'stripped'
version of Stella Research. You can:a. run the modelb. change most of the parameter values within the ranges set (directly or
by copying from EXCEL files), andc. save/save as to maintain modified parametersd. save graphs as pictures for printer
2. Under Stella Research 5.11. In addition to the above you can also:a. modify parameters ('constant') not included in the input listsb. modify the parameter rangesc. save output tables as text files for further data handling with other
softwared. create new graphs or tablese. print a listing of all program equationsf. modify the layout of the modelg. modify equations, add or delete pools and flows, i.e. modify 'the model
itself'.
appendix 1-3.qxd 9/23/2004 5:42 PM Page 149

150
If you do any modification, please keep track of changes made for any futurereport on your 'modified WaNuLCAS'.
This document deals with the second option that is running WaNuLCAS inStella Regular/Research version. A free downloable version of Stella isavailable at http://www.iseesystems.com/. All option available except savinga file.
Installing WaNuLCAS
Decompressed WaNuLCAS model and excel file from the disk. You maycopy the model and the excel file into any directory You may change thename of the model but not for the excel file. Change the name of excel filemeans break the link to the model. You can save on the different directory forrepresenting different parameterization.
Starting WaNuLCAS
Initiate EXCEL. Open Wanulcas.xls. It will give warning that the file containsa macro.
Choose enabled macro. This is to make sure the macro built to ease inputtingparameters in the model is working properly.
Then run Stella. It will automatically open a blank working model. Close itthen open Wanulcas.stm from appropriate directory. You are now inside theMain Menu of WaNuLCAS and ready to work! In your screen you will seesomething like Figure App2.1.
Please be patient in waiting for the model to load. Inside WaNuLCAS youwill see several buttons, each has specific function written on it.
To familiarize yourself with WaNuLCAS we suggest you to try the followingexercise:o First, view the model then return to main menuo Second, run the model using default parameters, then look into the
simulation resulto Third, check nitrogen, phosphorus, carbon and water input-output
summary of modelo Fourth, modify input parameters and try new runo Fifth, import output resulting from new run
appendix 1-3.qxd 9/23/2004 5:42 PM Page 150

151
In the following sections you will find description on how to perform each ofthe suggested exercise.
To View ModelThis option will give you a bird's eye view of model structure: sectors, pools,flows and influences (see figure below). Using Stella 5.0 Research you canmodify the model at this level.
To return to Main Menu you may click on the available button or click on anarrow pointing upwards in the top left corner.
Figure App2.1. View of WaNuLCAS Main Menu
appendix 1-3.qxd 9/23/2004 5:15 PM Page 151

152
Figure App2.2. A bird's eye view of WaNuLCAS
To Run and See Simulations ResultsTo run or to see simulation result from Main Menu click on TO RUN ANDOUTPUT SECTION button.
Running WaNuLCAS
On the output screen you will find 5 buttons which control simulation run aslisted below.
Buttons Purpose Run To start simulation Pause To pause during simulation run Stop To stop simulation Resume To resume simulation after pausing Time Spec To specify length of simulation time
appendix 1-3.qxd 9/23/2004 5:15 PM Page 152

153
Figure App2.3. View of Output Section
Below the running control buttons, you will see a box displaying time lapsedsince start of simulation (see Figure App2.3).
There are 6 sliders to simplify running different type of simulations. SeeAppendix 7 on acronyms to know more of the function of these sliders. TheTime Specs screen will appear (Figure App2.4) allowing you to changebeginning and ending period of simulation, also DT which is incrementaltime of simulation. We strongly advise you to keep DT value at 1.
There are 6 sliders under Click Me button. These sliders are options of ageneral different simulation you can run. Click on Click Me button to findout more on the function of each slider.
appendix 1-3.qxd 9/23/2004 5:15 PM Page 153

154
Figure App2.4. View of Time Specification screen
Output Result
There are two types of output result, (1) Tables and (2) Graphs.
To view a graph/table, click twice on the graph icon. What you will see isactually a stack of graphs/tables. To view the rest of graphs, click on thefolded page at the bottom left corner.
When you look at graphs, notice that the scale on Y axis between parameterson the same graph can be different. Match the index number of parameterswith index number of scales in Y axis.
Listed below is summary of available output on display. More detaileddescriptions on output parameters are listed in Appendix 4 of this document.
appendix 1-3.qxd 9/23/2004 5:42 PM Page 154

155
A. GRAPHSOverall: Summaries of overall zones and specific output related to Tree
Zone 1, Zone 2, Zone 3, and Zone 4 : Each of these graphs contain similaroutput parameter related to zone 1, 2, 3 and 4
Output Content Graph Type
Page 1 Plant biomass, tree biomass presence as total biomass Time series Page 2 Distribution of rainfall Time series Page 3 Distribution of cumulative amount of water drained out Time series Page 4-5 Distribution of cumulative amount of nutrient leached out Time series Page 6 Cumulative plant water uptake Time series Page 7 Total plant N & P uptake per day Time series Page 8-9 Amount of nutrient presence in plant aboveground biomass Time series Page 10 Water available, demanded and taken up by tree per day Time series Page 11-12 Nutrient available, demanded and taken up by tree per day Time series Page 13-15 Factors limiting tree growth Time series Page 16 C and Nutrient in SOM + litter pool Time series Page 17 Tree biomass and diameter Time series Page 18 Plant biomass, tree biomass presence as leaf and twig biomass Time series Page 19 Tree canopy biomass and cumulative pruned biomass Time series Page 20 Plant (Leaf and Twig) biomass Histogram Page 21 Water stock Histogram Page 22 - 23 Nutrient stock Histogram Page 24 - 25 Pore volume Histogram
Output Content Page 1 Factors limiting crop growth Page 2 Distribution of water stock Page 3-4 Distribution of nutrient in soil Page 5 Distribution of crop water uptake Page 6 Distribution of tree water uptake Page 7,9 Distribution of crop nutri ent uptake Page 8,10 Distribution of tree nutrient uptake Page 11-12 Nutrient available, demanded and taken up by crop per day
appendix 1-3.qxd 9/23/2004 5:42 PM Page 155

156
Tree comp: spesific output related to the tree phenology
B. TABLESThere is only one table containing 2 pages of water balance, plant biomass,water, N and SOM in soil.
Adding additional output parameters
To add more parameters to your tables or graphs do the following:o Click twice on your graph/table. After a graph/table appear, click twice
again on it. Now, you will see a box emerge with 2 small boxes in theupper section. The left box contains parameters that can be loaded intograph/table. The right box contains parameters already in thegraph/table. A graph can contain up to 5 parameters while a table cancontain more than 40 parameters.
o To load a parameter into the graph/table, highlight the parameter inallowable box then click an adjacent arrow pointing to the right.
o If you want to load a parameter to a new clean page, prior to the aboveyou need to click an arrow pointing upward at the bottom left cornerpointing (adjacent to Page). Keep on clicking until you see NEW as pagenumber.
Locking graphs or tables to speed your simulation
You can lock pages in your graphs and tables that you do not need. Lockedgraphs or tables will not be updated in the next simulation run. This wouldsave a lot of time needed to run the model. To lock graph or table click onthe lock icon. It is in the bottom left corner of your graph or on the top rightcorner of your table.
Output Content Page 1 Tree Leaf Area Index (LAI)
OilPalms: spesific output for oilpalm
Output Content Page 1-3 Fruit biomass Page 4 Biomass and oil harvested
appendix 1-3.qxd 9/23/2004 5:42 PM Page 156
157
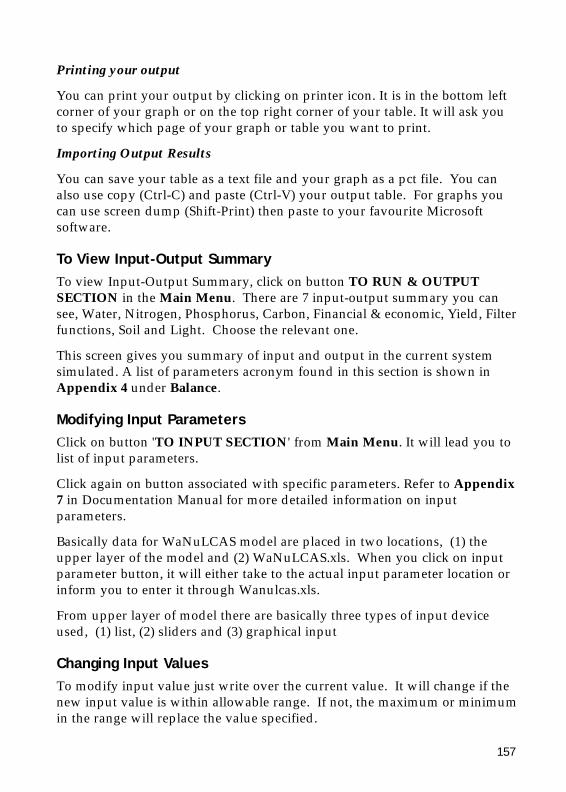
Printing your output
You can print your output by clicking on printer icon. It is in the bottom leftcorner of your graph or on the top right corner of your table. It will ask youto specify which page of your graph or table you want to print.
Importing Output Results
You can save your table as a text file and your graph as a pct file. You canalso use copy (Ctrl-C) and paste (Ctrl-V) your output table. For graphs youcan use screen dump (Shift-Print) then paste to your favourite Microsoftsoftware.
To View Input-Output SummaryTo view Input-Output Summary, click on button TO RUN & OUTPUTSECTION in the Main Menu. There are 7 input-output summary you cansee, Water, Nitrogen, Phosphorus, Carbon, Financial & economic, Yield, Filterfunctions, Soil and Light. Choose the relevant one.
This screen gives you summary of input and output in the current systemsimulated. A list of parameters acronym found in this section is shown inAppendix 4 under Balance.
Modifying Input ParametersClick on button 'TO INPUT SECTION' from Main Menu. It will lead you tolist of input parameters.
Click again on button associated with specific parameters. Refer to Appendix7 in Documentation Manual for more detailed information on inputparameters.
Basically data for WaNuLCAS model are placed in two locations, (1) theupper layer of the model and (2) WaNuLCAS.xls. When you click on inputparameter button, it will either take to the actual input parameter location orinform you to enter it through Wanulcas.xls.
From upper layer of model there are basically three types of input deviceused, (1) list, (2) sliders and (3) graphical input
Changing Input Values To modify input value just write over the current value. It will change if thenew input value is within allowable range. If not, the maximum or minimumin the range will replace the value specified.
appendix 1-3.qxd 9/23/2004 5:42 PM Page 157

158
To check allowable value, please refer to Appendix 7 in documentationmanual. If you experience problems, please let us know.
Please refer to Stella Technical Manual to change input values on specificinput device.
Figure App2.5. View of input menu
Description on Wanulcas.xlsThis Excel file is contains data used as input parameters and routines to helpusers in generating these input parameters. To be able to open the file youneed at least Excel ver. 5.0 (MSOffice 97). The Excel must have Visual BasicApplication as add-in working. The descriptions of each sheet are listedbelow.
All the sheets are protected by default in such a way that you will still be ableto change input parameters. You can unprotect the sheets using passwordwanulcas (all lower case).
appendix 1-3.qxd 9/24/2004 9:43 AM Page 158

159
Linking dataSTELLA Research has a DDE facility, which enable users to link model tooutside file.
Sheet Content READ ME General information
Pedotransfer Program to generate soil hydraulic properties. Output generated from this program forms data input for WaNuLCAS. These can automatically be copied to the sheet ‘SOIL HYDRAULIC’ where it is linked to WANuLCAS model.
Soil Hydraulic Soil Hydraulic input parameters for each soil layer and zone. Linked to WaNuLCAS STELLA model
Phosphorus Program to generate Ka (adsorption constant) of P, based on double Langmuir equation and related P_Bray to total mobile soil P content
Weather Daily rainfall, daily soil temperature and daily potential evaporation
Slash and Burn Slashing schedule and parameter impacts on the burning event
Crop Parameters/Library Crop specific parameters
Tree Parameters/Library Tree specific parameters
Crop Management Planting schedule, fertilization schedule
Tree Management Tree planting & timber harvesting schedule and pruning management.
Pedo SOM Bulk density pedotransfer and Soil Organic Matter pedotransfer
Profitability Input prices and labour requirement for the agroforestry system simulated and output produced.
Julian day Information to converting calendar days per month into the 'day-of-year' (DOY) or 'Julian days' format used in the stella model
Link output Information on how to make proper link between WaNuLCAS.xls and WaNuLCAS.stm and examples output that can get from WaNuLCAS simulation
All input parameters in Wanulcas.xls are linked to WaNuLCAS model. Forthese parameters you should change it directly from the Excel sheet. Formore detail description, please see Appendix 3.
appendix 1-3.qxd 9/23/2004 5:42 PM Page 159

160
Most of the contents of Wanulcas.xls are linked to WaNuLCAS model asinput pa-rameters. Linking enable you to change input value in WaNuLCASby changing associated values in Wanulcas.xls. The linked values aremarked by blue font.
When you open WaNuLCAS model in STELLA Research version, STELLAwill ask if you want to establish link. Answer Yes if you want to have themodel linked with Wanulcas.xls, but be sure that you already have EXCELrunning in the background and Wanulcas.xls have already been copied.
STELLA only allows the changes to occur when both Excel and STELLA filesare open simultaneously. Changes made in Excel prior to establishing thelink will not change parameter values in STELLA. To overcome this problemwe have built an updating macro in Excel. Run this macro by pressing Ctrl-uafter you have the link between STELLA and Excel file establish to make sureall the input parameters value in STELLA model corresponds to the value inExcel.
With this macro, you will be able to have different excel files representingdifferent parameterization. Rename the file to Wanulcas.xls when you wantto use it. Click the updating macro. All the parameter values in Stella will beupdated.
To Make Changes in the Model There are 2 levels of model changes you can do; (1) change a constantparameter into a dynamic variable and (2) adding additional influencingparameter /factor to existing equations.
Changing a constant into dynamic variableYou can do this by making a constant parameter depends on existing-statevariable.For example: change biomass-to-height conversion factor(Cq_HBiomConv[Cr]) into crop stage (Cq_Stage) dependent.
Adding influencing factor to existing equationsYou can do this by adding additional parameter to existing equations. Forexample: add effect of slope as a parameter influencing potential evaporation(Evap_Pot).
appendix 1-3.qxd 9/23/2004 5:42 PM Page 160

161
Appendix 3Description on Excel filesaccompanying WaNuLCAS model
The WaNuLCAS model is accompanied by 2 excel file; Wanulcas.xls andTreeParameterization.xls. Wanulcas.xls contains input parameters androutines to generate these input parameters. The input parameters are linkedto WaNuLCAS model. See table in Appendix 2, page 149 for shortdescriptions of Wanulcas.xls content. TreeParameterization.xls is developedto generate input parameters for tree. There are several other help files toassist users in generating input parameters as well as better understandWaNuLCAS model. See our web page for more information.
Wanulcas.xls
The basic purpose of this Excel file is to ease users in modifying inputparameters needed to run WaNuLCAS model. Input parameters in this fileare linked to the model (in the WaNuLCAS.stm file).
There are two ways to change input parameters in excel, making surechanges also occur inside the model:1. Change input values in excel ONLY if you run the model and excel
simultaneously with links established, or 2. Change input values in excel before hand then save the file. When you
run the model and establish links with excel later, make sure you pressCtrl-U, Ctrl-Y or Ctrl W. This is an updating macro built within this file,that re-activates the links and sends the current parameter values of theexcel file to their counterparts in stella. The macro activated by Ctrl-U willupdate crop and tree parameters, the Ctrl-Y will update the soil and CtrlW will update climate parameters.
The second option also allows you to store a number of parameter sets forspecific locations under separate names (e.g. WanSite1.xls) and use them forsimulations by renaming them to Wanulcas.xls and running the update macro's.
If in doubt whether parameters are actually sent across, you can open a tablein Stella and ask to show (a sample of) the parameter values in the model andcompare them with the input you expected to be used.
appendix 1-3.qxd 9/23/2004 5:42 PM Page 161
162
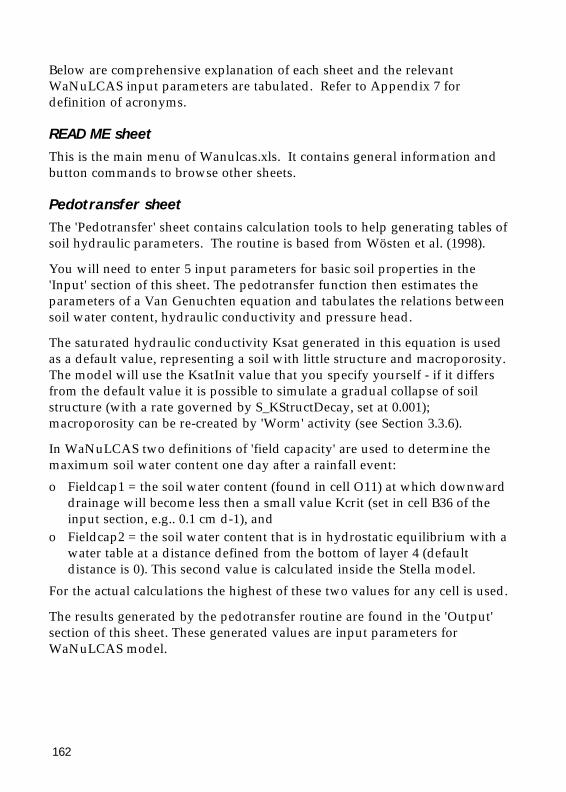
Below are comprehensive explanation of each sheet and the relevantWaNuLCAS input parameters are tabulated. Refer to Appendix 7 fordefinition of acronyms.
READ ME sheetThis is the main menu of Wanulcas.xls. It contains general information andbutton commands to browse other sheets.
Pedotransfer sheetThe 'Pedotransfer' sheet contains calculation tools to help generating tables ofsoil hydraulic parameters. The routine is based from Wösten et al. (1998).
You will need to enter 5 input parameters for basic soil properties in the'Input' section of this sheet. The pedotransfer function then estimates theparameters of a Van Genuchten equation and tabulates the relations betweensoil water content, hydraulic conductivity and pressure head.
The saturated hydraulic conductivity Ksat generated in this equation is usedas a default value, representing a soil with little structure and macroporosity.The model will use the KsatInit value that you specify yourself - if it differsfrom the default value it is possible to simulate a gradual collapse of soilstructure (with a rate governed by S_KStructDecay, set at 0.001);macroporosity can be re-created by 'Worm' activity (see Section 3.3.6).
In WaNuLCAS two definitions of 'field capacity' are used to determine themaximum soil water content one day after a rainfall event: o Fieldcap1 = the soil water content (found in cell O11) at which downward
drainage will become less then a small value Kcrit (set in cell B36 of theinput section, e.g.. 0.1 cm d-1), and
o Fieldcap2 = the soil water content that is in hydrostatic equilibrium with awater table at a distance defined from the bottom of layer 4 (defaultdistance is 0). This second value is calculated inside the Stella model.
For the actual calculations the highest of these two values for any cell is used.
The results generated by the pedotransfer routine are found in the 'Output'section of this sheet. These generated values are input parameters forWaNuLCAS model.
appendix 1-3.qxd 9/23/2004 5:42 PM Page 162

163
These input parameters need to be copied to the sheet 'Soil Hydraulic'properties. To copy the parameters for soil layer i and zone j, fill in i and j incell N8 and N9 then click on the COPY button.
You can set up the model with the same properties for all zones and layersby repeating this for i = 1...4 and j = 1...4, modify the properties by layer oruse different properties for any of the 16 cells.
Phosphorus sheetThe 'Phosphorus' sheet contains a procedure to calculate Ka_P, the apparentP adsorption constant as a function of the P concentration and P availabilityindices such as the P_Bray value. To run this, click on button Psorptionisotherm & Soil Database. In this section you need to fill in the soil type foreach layer of your soil in cells M8...M11. We provide default values for 9 soiltypes, as listed in U12....U20 If you have your own data, you can fill inparameters of a single or two-term Langmuir isotherm to describe your soiltype. The parameters currently used for each soil layer are found in cellsN8...R11. You also have to specify the bulk density of each layer (it is possibleto use a value here that differs from the one used in the pedotransfersheet...).
The parameters of the Langmuitr sorption isotherm are used to derive valuesof Ka_P for each layer, tabulated in the 'P Sorption Output' section of theworksheet These values are linked to the WaNuLCAS.stm model.
This sheet also includes a section to initialize P in each cell (zone * layer), onthe basis of indices of P availability such as the P_Bray value. To do this, youfirst have to specify two properties of the P availability index: the volume
WaNuLCAS input parameters Location in Excel W_PhiTheta cells N13 – N64 W_Ptheta cells O13 – O64 W_PhiP (this is linked to 4 tables in the stella: W_PhiPH, W_PhiPMH, W_PhiPML, W_PhiP)
cells R13 – R64
W_ThetaPMax, W_ThetaP cells U13 – U64 KsatDflt (default value, endpoint of loss of soil structure) N11 Ksat (value used to initializa the model) M11 Field Capacity1 (conductivity-limited) O11
appendix 1-3 R.qxd 9/24/2004 10:03 AM Page 163

164
ratio of soil to solution used during the extraction, and the relative sorptionaffinity in the extraction medium (at the temperature and other conditionsused). For two methods we provide these parameters P-water (compare DeWilligen and Van Noordwijk, 1987) and P-Bray (with a tentative, poorlytested estimate of the relative sorption affinity of 2% of the original value).
Once the method has been thus defined, click on 'Initial P Soil' and fill in theinitial P soil indices for each cell (AD8...AG11). The values will be convertedto amount of soil P in the units expected in WaNuLCAS.stm in cells(AD14...AG17). These converted values are linked to the Stella model.
Weather sheetThis sheet stores daily data for 3 weather components in WaNuLCAS:Rainfall, Soil Temperature and Potential Evaporation. Default length of dataand links are 1 year (365 days). These data are linked.
Slash&Burn sheetThis sheet holds input parameters related to impacts of slash and burn on soilas a function of increased temperature at the soil surface.
WaNuLCAS input parameters Location Initial P in soil, N_Initi[P,Zone]; i = 1, .., 4 cells AC14 – AF17 N_KaPDef[Layer] cells C93 – C143, E93 – E143, G93 – G143,
I934 – I143
WaNuLCAS input parameters Location Rain_Data cells C5 – C369 Temp_DailyData cells D5 – D369 Temp_DailyPotEvap cells E5 – E369
appendix 1-3 R.qxd 9/24/2004 10:03 AM Page 164

165
Crop Management sheetThis sheet holds a schedule for planting crops (by zone and type) andapplying N or P fertilizers. The current simulation year is defined as YEAR 0.
In this sheet you will be able to define the type of crop you plan to use in thesimulation. In cell B2-F2 fill the letter code of crop type associated with thecode in the database. It is written as options on the left hand side or see sheetCROP LIBRARY. The type of crop you choose here determine the parametervalues copied to sheet CROP PARAMETERS and PROFITABILITY, wherethe values are linked to model.
WaNuLCAS input parameters Location S&B_SurfLitBurnFrac cells B12 – B26 S&B_NecroBurnFrac cells C12 – C26 S&B_DeadWoodBurnFrac cells D12 – D26 S&B_AerosolFrac cells E12 – E26 S&B_NvolatFrac cells F12 – F26 S&B_PvolatFrac cells G12 – G26 S&B_SOMBurnFrac cells J12 – J19 S&B_FirMortSeedBank cells K12 – K19 S&B_FirIndPMobiliz cells L12 – L19 S&B_FirImpPSorption cells O12 – O26
WaNuLCAS input parameters Location Ca_PlantYear[Zone] cells B11 – B31, G11 – G31, L11 – L31, Q11 – Q31 Ca_PlantDoY[Zone] cells C11 – C31, H11 – H31, M11 – M31, R11 – R31 Ca_CType[Zone] cells D11 – D31, I11 – I31, N11 – N31, S11 – S31 Ca_FertOrExtOrgAppYear cells V11 – V51 Ca_FertOrExtOrgAppDoY cells W11 – W51 Ca_FertApply?[SINut] cells X11 – X51, Y11 – Y51
Ca_ExtOrgApply?[Type] cells Z11 – Z51, AA11 – AA51
Ca_FertOrExtOrgAmount[Zone] [] cells AB11 – AB51, AC11 – AC51, AD11 – AD51, AE11 – AE51
appendix 1-3 R.qxd 9/24/2004 10:03 AM Page 165
166
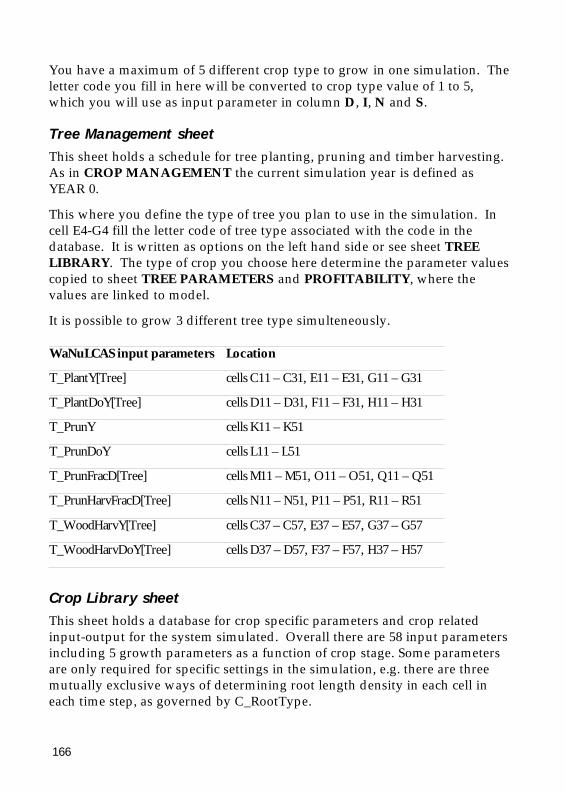
You have a maximum of 5 different crop type to grow in one simulation. Theletter code you fill in here will be converted to crop type value of 1 to 5,which you will use as input parameter in column D, I, N and S.
Tree Management sheetThis sheet holds a schedule for tree planting, pruning and timber harvesting.As in CROP MANAGEMENT the current simulation year is defined asYEAR 0.
This where you define the type of tree you plan to use in the simulation. Incell E4-G4 fill the letter code of tree type associated with the code in thedatabase. It is written as options on the left hand side or see sheet TREELIBRARY. The type of crop you choose here determine the parameter valuescopied to sheet TREE PARAMETERS and PROFITABILITY, where thevalues are linked to model.
It is possible to grow 3 different tree type simulteneously.
Crop Library sheetThis sheet holds a database for crop specific parameters and crop relatedinput-output for the system simulated. Overall there are 58 input parametersincluding 5 growth parameters as a function of crop stage. Some parametersare only required for specific settings in the simulation, e.g. there are threemutually exclusive ways of determining root length density in each cell ineach time step, as governed by C_RootType.
WaNuLCAS input parameters Location T_PlantY[Tree] cells C11 – C31, E11 – E31, G11 – G31 T_PlantDoY[Tree] cells D11 – D31, F11 – F31, H11 – H31 T_PrunY cells K11 – K51 T_PrunDoY cells L11 – L51 T_PrunFracD[Tree] cells M11 – M51, O11 – O51, Q11 – Q51 T_PrunHarvFracD[Tree] cells N11 – N51, P11 – P51, R11 – R51 T_WoodHarvY[Tree] cells C37 – C57, E37 – E57, G37 – G57 T_WoodHarvDoY[Tree] cells D37 – D57, F37 – F57, H37 – H57
appendix 1-3 R.qxd 9/24/2004 10:03 AM Page 166

167
Currently there are 10 possible type of crops in the database. For 5 of themwe have provided default values, that is for crop Cassava, Maize, UplandRice, Groundnut and Cowpea. If you have your own data you can fill yourdata values under crop type Yours1, ..., Yours5. For the whole list of inputparameters stored, please refer directly to the excel sheet.
To choose the type of crop you use in simulation fill in relevant cell in sheetCROP MANAGEMENT.
Tree Library sheetThis sheet holds tree specific parameters. There are 95 input parameters. Asin crop specific parameters, some inputs are only required if you run certaintype of simulations.
All you need to fill in this sheet is the letter code of tree type (cell E8 - G9)associated with the code in the database. You have a maximum of 3 differenttree type grow simultaneously in one simulation. The tree type you fill in islink to PROFITABILITY sheet
In the database we have so far provided only 2 default values for the treesGliricidia sepium and Peltophorum dasyrrachis. If you have your own datayou can fill in this value into the database (see cell L6).
For the whole list of input parameters stored, please refer directly to the excelsheet.
Soil Hydraulic sheetThis sheet contains soil hydraulic input parameters as generated and copiedfrom Pedotransfer sheet. The cells here are linked to the WaNuLCAS model.There are no user inputs required here, as all input is generated by thepedotransfer sheet. You can, however, check that the COPY command haslead to the expected results or not.
Profitability sheetThe sheet contains input needed in the simulated systems and outputproduced. There are basically 3 categories of input, for the whole field, treesand crops. Input for the whole field you will need to fill in this sheet, whilefor plant input it is filled in database TREE/CROP LIBRARY
See directly in the excel sheet the whole list of input parameters.
appendix 1-3.qxd 9/23/2004 5:42 PM Page 167

168
Tree parameterization.xls
This file for generate input parameters in tree library in WaNuLCAS.xls.Below are the detail explanation for each sheet carried out.
Main sheet, this sheet is the main menu of tree parameterization.xls which isconducted in to two parts tree survey and FBA model. Tree survey is morefor estimate the tree specific parameter while FBA model for estimateallometric branching for WaNuLCAS. It contains general information andbutton commands to browse tree survey and FBA model.
Survey sheet, this sheet contains 39 question that split in to 10 categories,growth stage, growth, canopy, light capture, rain interception, tree water, Nfixation, N and P concentration, litterfall and litterquality. Users may answerall questions or only some of those related to the certain category.
WaNuLCAS sheet, while user answer the question on sheet survey, the inputparameter for WaNuLCAS.xls (tree library sheet) will be automaticallyestimated on this sheet, later user can copy the result from this sheet to thetree library sheet.
WanFBA sheet, all input that needed to run FBA model are prepared on thissheet based on the observational data in the field. The input are needed splitin to 4 categories, information of branching pattern, information of tree size,information of woody part and information of final links.
Input sheet, when user had finished fill in all the information, with 'Ctrl H'will be automatically estimated all input that needed to run the FBA modelon this sheet, and 'Ctrl R' will be automatically estimated biomass allometricequation for each part (total biomass, wood, leaf and twig and litterfall). Thebiomass allometric equation will be automatically copied on sheetWaNuLCAS.
Sumoutput sheet, the sumoutput shows not only allometric equation but alsoall the important information that can be obtained from this program.
Estimate sheet, this sheet contains estimate input for WanFBA inputcompared to the default value.
appendix 1-3.qxd 9/23/2004 5:42 PM Page 168

169
Appendix 4List of Output Acronyms andDefinition
No. Acronym Definition
1. AF “Agroforestry Zone” – overall design on the system
2. B Balance (carbon=BC, nutrient=BN, BS=Soil or water=BW)
3. C Crop (C = Crop, C_N = Crop Nutrient or CW = Crop Water)
4. E Erosion
5. Light Light
6. P Profitability (economic sector of the model)
7. Rain Rain
8. T Tree (T = Tree, T_N = Tree Nutrient or TW = Tree Water)
9. TF Oil Palm
No Acronym Definition Units Location
1. AF_DepthLay1 Initial soil thickness in layer 1 m Soil Balance
2. B_T_HarvCum [DW,Tree]
Cumulative biomass harvested from each type of tree
kg m-2 Yield
3. BC_CO2FromBurn Cumulative amount of carbon released into air from burning event
g m-2 Carbon Balance
4. BC_CPhotosynth Amount of carbon produced by crop through photosynthesis
g m-2 Carbon Balance
5. BC_CRespforFix Amount of carbon released by crop due to respiration needed for N fixation
g m-2 Carbon Balance
6. BC_Crop Amount of carbon currently presence as crop biomass
g m-2 Carbon Balance
7. BC_CropInit Initial amount of carbon presence as crop biomass
g m-2 Carbon Balance
8. BC_ExtOrgInput Amount of carbon in external organic input eg. mulch
g m-2 Carbon Balance
appendix 4-7.qxd 9/24/2004 10:16 AM Page 169
170
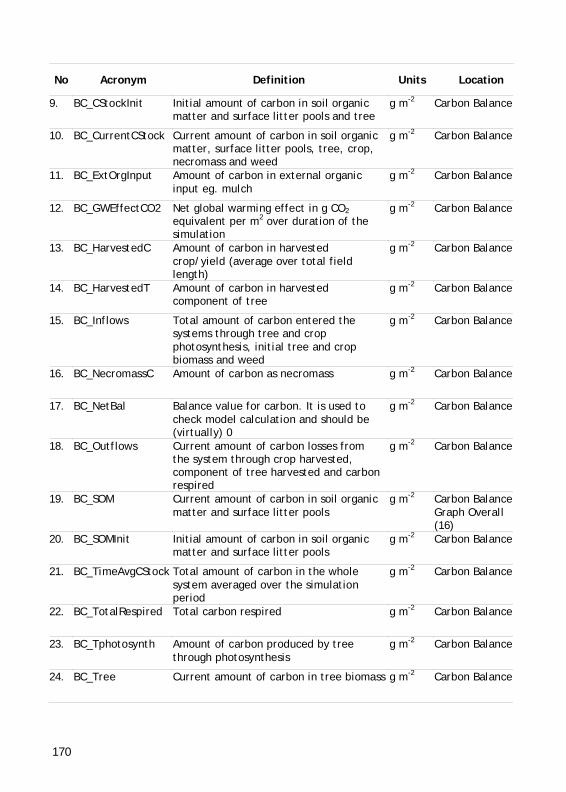
No Acronym Definition Units Location
9. BC_CStockInit Initial amount of carbon in soil organic matter and surface litter pools and tree
g m-2 Carbon Balance
10. BC_CurrentCStock Current amount of carbon in soil organic matter, surface litter pools, tree, crop, necromass and weed
g m-2 Carbon Balance
11. BC_ExtOrgInput Amount of carbon in external organic input eg. mulch
g m-2 Carbon Balance
12. BC_GWEffectCO2 Net global warming effect in g CO2 equivalent per m2 over duration of the simulation
g m-2 Carbon Balance
13. BC_HarvestedC Amount of carbon in harvested crop/yield (average over total field length)
g m-2 Carbon Balance
14. BC_HarvestedT Amount of carbon in harvested component of tree
g m-2 Carbon Balance
15. BC_Inflows Total amount of carbon entered the systems through tree and crop photosynthesis, initial tree and crop biomass and weed
g m-2 Carbon Balance
16. BC_NecromassC Amount of carbon as necromass g m-2 Carbon Balance
17. BC_NetBal Balance value for carbon. It is used to check model calculation and should be (virtually) 0
g m-2 Carbon Balance
18. BC_Outflows Current amount of carbon losses from the system through crop harvested, component of tree harvested and carbon respired
g m-2 Carbon Balance
19. BC_SOM Current amount of carbon in soil organic matter and surface litter pools
g m-2 Carbon Balance,Graph Overall (16)
20. BC_SOMInit Initial amount of carbon in soil organic matter and surface litter pools
g m-2 Carbon Balance
21. BC_TimeAvgCStock Total amount of carbon in the whole system averaged over the simulation period
g m-2 Carbon Balance
22. BC_TotalRespired Total carbon respired g m-2 Carbon Balance
23. BC_Tphotosynth Amount of carbon produced by tree through photosynthesis
g m-2 Carbon Balance
24. BC_Tree Current amount of carbon in tree biomass g m-2 Carbon Balance
appendix 4-7.qxd 9/24/2004 10:16 AM Page 170

171
No Acronym Definition Units Location
25. BC_TreeInitTot Total amount of carbon initialized as tree biomass
g m-2 Carbon Balance
26. BC_TRespforFix Amount of carbon released by crop resulted from respiration for N fixation
g m-2 Carbon Balance
27. BC_Weed Amount of carbon currently presence as weed
g m-2 Carbon Balance
28. BC_WeedSeeds Amount of carbon as seeds of weed g m-2 Carbon Balance
29. BN_CBiomInit [SlNut]
Initial amount of nutrient in crop biomass
g m-2 N Balance, P Balance
30. BN_CHarvCum [SlNut]
Amount of nutrient in harvested crop/yield (average over whole field)
g m-2 N Balance, P Balance
31. BN_CNdfaFrac Fraction of N derived from fixation by all crop
dimen-sionless
Yield
32. BN_CNFixCum Total amount of N fixed by crop g m-2 N Balance
33. BN_CropBiom [SlNut]
Current amount of nutrient (N or P) in crop biomass (average over total field length)
g m-2 Graph Overall (8 – 9)
34. BN_CropBiom [SlNut]
Current amount of nutrient in tree biomass
g m-2 N Balance, P Balance, Graph Overall, (8 – 9)
35. BN_CUptTot [SlNut]
Total amount of nutrient taken up by crop (average over total field length)
g m-2 Graph Overall, (7)
36. BN_EffluxTot [SlNut]
Current amount of nutrient loss from the system through crop harvested, leaching, surface run off, etc
g m-2 N Balance
37. BN_ExtOrgInputs [SlNut]
Total amount of nutrient entered the system from external organic input
g m-2 N Balance, P Balance
38. BN_FertCum [SlNut]
Cumulative amount of fertilizer input (average over total field length)
g m-2 N Balance, P Balance
39. BN_Immob[SlNut] Current amount of nutrient in immobile pool
g m-2 N Balance, P Balance
40. BN_ImmPool [SlNut]
Initial amount nutrient in immobile pool g m-2 N Balance, P Balance
41. BN_InfluxTot [SlNut]
Total amount of nutrient entered the system from initial crop biomass, fertilizer, external organic input, etc
g m-2 N Balance
42. BN_LatInCum [SlNut]
Nutrient input due to lateral flow g m-2 N Balance, P Balance
appendix 4-7.qxd 9/24/2004 10:16 AM Page 171
172
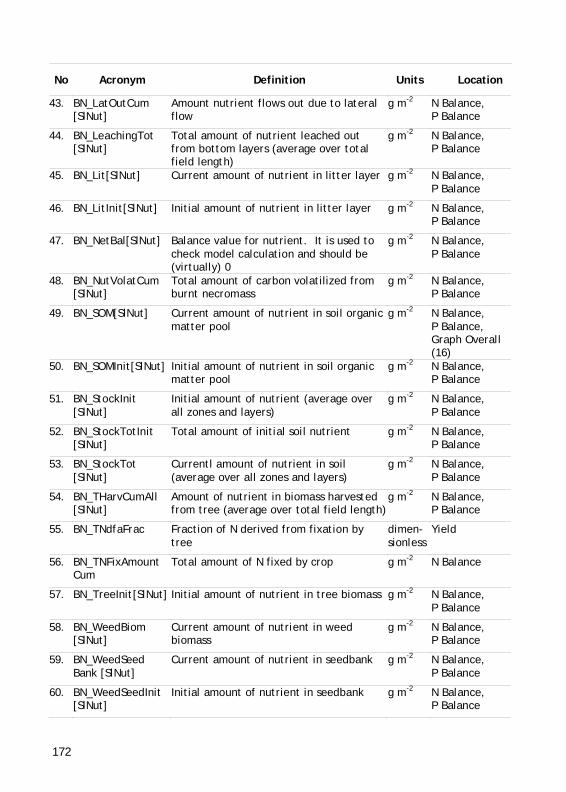
No Acronym Definition Units Location
43. BN_LatOutCum [SlNut]
Amount nutrient flows out due to lateral flow
g m-2 N Balance, P Balance
44. BN_LeachingTot [SlNut]
Total amount of nutrient leached out from bottom layers (average over total field length)
g m-2 N Balance, P Balance
45. BN_Lit[SlNut] Current amount of nutrient in litter layer g m-2 N Balance, P Balance
46. BN_LitInit[SlNut] Initial amount of nutrient in litter layer g m-2 N Balance, P Balance
47. BN_NetBal[SlNut] Balance value for nutrient. It is used to check model calculation and should be (virtually) 0
g m-2 N Balance, P Balance
48. BN_NutVolatCum [SlNut]
Total amount of carbon volatilized from burnt necromass
g m-2 N Balance, P Balance
49. BN_SOM[SlNut] Current amount of nutrient in soil organic matter pool
g m-2 N Balance, P Balance, Graph Overall (16)
50. BN_SOMInit[SlNut] Initial amount of nutrient in soil organic matter pool
g m-2 N Balance, P Balance
51. BN_StockInit [SlNut]
Initial amount of nutrient (average over all zones and layers)
g m-2 N Balance, P Balance
52. BN_StockTotInit [SINut]
Total amount of initial soil nutrient g m-2 N Balance, P Balance
53. BN_StockTot [SlNut]
Currentl amount of nutrient in soil (average over all zones and layers)
g m-2 N Balance, P Balance
54. BN_THarvCumAll [SlNut]
Amount of nutrient in biomass harvested from tree (average over total field length)
g m-2 N Balance, P Balance
55. BN_TNdfaFrac Fraction of N derived from fixation by tree
dimen-sionless
Yield
56. BN_TNFixAmount Cum
Total amount of N fixed by crop g m-2 N Balance
57. BN_TreeInit[SlNut] Initial amount of nutrient in tree biomass g m-2 N Balance, P Balance
58. BN_WeedBiom [SlNut]
Current amount of nutrient in weed biomass
g m-2 N Balance, P Balance
59. BN_WeedSeed Bank [SlNut]
Current amount of nutrient in seedbank g m-2 N Balance, P Balance
60. BN_WeedSeedInit [SlNut]
Initial amount of nutrient in seedbank g m-2 N Balance, P Balance
appendix 4-7.qxd 9/24/2004 10:16 AM Page 172

173
No Acronym Definition Units Location
61. BS_SoilCurr Current amount of soil kg m-2 Soil Balance
62. BS_SoilDelta Overall balance of input and output of soil in the model. A value of 0 means that the model calculation is in balance.
kg m-2 Soil Balance
63. BS_SoilInflowcum Total amount of soil inflow kg m-2 Soil Balance
64. BS_SoilInit Initial amount of soil kg m-2 Soil Balance
65. BS_SoilLossCum Total amount of soil loss kg m-2 Soil Balance
66. BW_DrainCumV Total amount of water draining (average over all zones and layers)
l m-2 Water Balance
67. BW_EvapCum Total amount of water evaporates from soil surface (average over all zones and layers)
l m-2 Water Balance
68. BW_LatInCum Amount of lateral inflow (subsurface) of water
l m-2 Water Balance
69. BW_LatOutCum Amount of lateral outflow (subsurface) of water
l m-2 Water Balance, Graph Overall (3)
70. BW_NetBal Overall balance of input and output of water in the model. A value of 0 means that the model calculation is in balance.
l m-2 Water Balance, Graph Overall (10)
71. BW_RunOffCum Amount of (surface) run off water l m-2 Water Balance
72. BW_RunOnCum Amount of (surface) run on water l m-2 Water Balance
73. BW_StockInit Initial total amount of water in all layers and zones of soil
l m-2 Water Balance
74. BW_StockTot Current total amount of water in soil profile
l m-2 Water Balance
75. BW_UptCCum Cumulative amount of water uptake by crop
l m-2 Water Balance, Graph Overall (6)
76. BW_UptTCum [Tree]
Cumulative water uptake by each tree l m-2 Water Balance Graph Overall (6)
77. C_AgronYields [Crop]
Agronomic yield for each type of crop kg m-2 Yield
78. C_Biom[Zone,DW] Current crop biomass in each zone (including canopy, storage, roots)
kg m-2 Graph Overall (1), Graph Zonei (1)
appendix 4-7.qxd 9/24/2004 10:16 AM Page 173

174
No Acronym Definition Units Location
79. C_BiomCan[Zone, DW]
Current crop canopy biomass in each zone
kg m-2 Graph Overall (18)
80. C_FracLim[LimFac] Average value over the simulation for each limiting factor for crop growth, value between 0 and 1
- Yield
81. C_NDemand[Zone] Amount of nutrient demanded by crop in each zone
kg m-2 Graph Zonei (11 – 12)
82. C_NPosGro [Zone,SlNut]
The effect of nutrient stress on crop growth (0=no growth, 1=no stress)
dimen-sionless
Graph Zonei (1)
83. C_NUptPot[Zone] Amount of nutrient available for crop uptake in each zone
g m-2 Graph Zonei (11 – 12)
84. C_NUptTot[Zone] Amount of nutrient uptake by crop in each zone
g m-2 day-1
Graph Zonei (11 – 12)
85. Cent_BalTotal [SlNut]
Overall balance of input and output in mineralization module (adapted from CENTURY model). A value of 0 means that model calculations are in balance
g m-2 N Balance, P Balance
86. CW_PosGro[Zone] The effect of water stress on crop growth in each zone (0=no growth, 1=no stress)
dimen-sionless
Graph Zonei (1)
87. E_TopSoilDepthAct [Zone]
Current soil thickness in layer 1 m Soil Balance
88. GHG_CumCH4 Emission
Cumulative emission of CH4 g m-2 N Balance
89. GHG_GWP_N2O& CH4
Global Warming Potential of the systems based on the emmsion of CH4 and NO2. It is expressed relative to CO2
- N Balance
90. GHG_N2_Fraction Fraction of N2 emission dimen-sionless
N Balance
91. GHG_NO_Fraction Fraction of NO emission dimen-sionless
N Balance
92. GHG_N2O_Fraction Fraction of N2O emission dimen-sionless
N Balance
93. Light_CRelCap [Zone]
Relative light capture by crop (on scale 0-1)
g m-2 Graph Zonei (1)
94. Light_CRelSupply [Zone]
Potential crop growth limited by light capture relative to the potential without presence of trees (1 = no limitation, 0 = no growth)
- Light
95. N_CumAtmInput [SlNut]
Amount of nutrient derived from atmospheric deposition
g m-2 N Balance, P Balance
appendix 4-7.qxd 9/24/2004 10:16 AM Page 174

175
No Acronym Definition Units Location
96. N_CUpti[Zone, SlNut]
Amount of nutrient uptake by crop from i-th soil layer of each zone per day
g m-2 day-1
Graph Zonei (7, 9)
97. N_EdgeFFH[SlNut] A value describing filter function horizontally at the edge of plot
dimen-sionless
Filter Function
98. N_EdgeFFV[SlNut] A value describing filter function vertically at the edge of plot
dimen-sionless
Filter Function
99. N_LeachCumV [Zone,SlNut]
Total amount of nutrient leached out from bottom layer of each zone
g m-2 Graph Overall (4 – 5)
100. N_Leachi[Zone, SlNut]
Amount of nutrient leached out from i-th layer of each zone
g m-2 Graph Zonei (13 – 14)
101. N_LocFF3i[SlNut] A value describing filter function in the 3rd layer of soil
dimen-sionless
Filter Function
102. N_Stocki[Zone, SlNut]
Amount of nutrient stock in each zone of layer i
g m-2 Graph Zonei (3, 4)
103. N_TotFFTot[SlNut] A value describing how the whole system function as a filter. Filter function defined as nutrient taken up by plant divided by total nutrient taken up and loss
dimen-sionless
Filter Function
104. N_TUpti[Zone, SlNut]
Amount of nutrient taken up by tree from i-th soil layer of each zone per day
g m-2
day-1 Graph Zonei (8, 10)
105. P_CCostAvg[Price] Average cost of crop management currency unit ha-1
Economic & Financial Balance
106. P_CReturnAvg [Price]
Amount of money contributed from crop production
currency unit ha-1
Economic & Financial Balance, Yield
107. P_CumLabUse Total amount of labour use to manage the system
man days
Yield
108. P_GeneralCost [Price]
Total cost needed to maintain the system currency unit ha-1
Economic & Financial Balance
109. P_NPV[Price] Net present value of the system currency unit ha-1
Economic & Financial Balance
110. P_TCostTot[Price] Total cost of crop management currency unit ha-1
Economic & Financial Balance
111. P_TReturn[Price] Amount of money contributed from tree production
currency unit ha-1
Yield
112. P_TReturnTot [Price]
Total amount of money contributed from tree production
currency unit ha-1
Economic & Financial Balance, Yield
appendix 4-7.qxd 9/24/2004 10:16 AM Page 175

176
No Acronym Definition Units Location
113. Rain Amount of rain per day l m-2 day-1
Graph Overall (2)
114. Rain_Cum Cumulative amount of rainfall l m-2 Water Balance, Table 1 (1)
115. Rain_In[Zone] Actual amount of rain going into each zone
l m-2 day-1
Graph Overall (2), Table 1 (1)
116. Rain_IntercEvap Cum
Amount of water evaporated from intercepted water
l m-2 Water Balance
117. T_Biom[Tree] Current amount of biomass for each tree (above and belowground)
kg m-2 Graph Overall (1)
118. T_BiomCumTot Total cumulative amount of tree biomass (including litterfall, rootdecay, harvested pruning)
kg m-2 Yield
119. T_CumLatexHarv [Tree]
Total latex harvested kg m-2 Yield
120. T_FracLim [Tree,LimFrac]
Average value over the simulation for each limiting factor for tree growth, value between 0 and 1
dimen-sionless
Yield
121. T_FruitHarvCum [Tree]
Total fruit harvested kg m-2 Yield
122. T_GroRes[Tree] Current amount of biomass in tree growth reserves
kg m-2 Graph Overall (17)
123. T_LAI[Tree] Tree Leaf Area Index dimen-sionless
Graph Tree Comp
124. T_LfTwig[Tree] Current amount of biomass in tree canopy kg m-2 Graph Overall (17, 18, 19)
125. T_Light[Tree] Fraction of light received by tree dimen-sionless
Graph Overall (13 – 15)
126. T_NBiom[SlNut, Tree]
Current amount of nutrient in tree aboveground biomass
g m-2 N Balance, P Balance, Graph Overall (8 – 9)
127. T_NDemandAll [SlNut]
Amount of nutrient demanded by tree per day
g m-2
day-1 Graph Overall (11 – 12)
128. T_NfixCum [SlNut,Tree]
Cumulative amount of nutrient derived from fixation by tree
g m-2 N Balance
129. T_NPosgro[SlNut] The effect of nutrient stress on tree growth (0=no growth, 1=no stress)
dimen-sionless
Graph Overall (13 – 15)
130. T_NUptPotAll [SlNut]
Total amount of nutrient in all soil layers available for tree per day
g m-2
day-1 Graph Overall (11 – 12)
appendix 4-7.qxd 9/24/2004 10:16 AM Page 176

177
No Acronym Definition Units Location
131. T_NUptTotAll [SlNut]
Total amount of nutrient taken up by tree (average over total field length)
g m-2
day-1 Graph Overall (7,11 – 12)
132. T_Root[Tree] Current amount of tree root biomass kg m-2 Graph Overall (17)
133. T_StemDMax Stem diameter of tree m Graph Overall (17)
134. T_Wood Current wood/stem biomass kg m-2 Graph Overall (17)
135. T_WoodHarvCum [Tree]
Total timber/wood harvested kg m-2 Yield
136. TF_BunchWeight [Tree,FruitBunch]
Total weight of oil palm fruit per fruit stages
kg m-2 Graph OilPalm
137. TF_CumFruitHarv [Tree]
Cumulative amount of oil palm fruit harvested
kg m-2 Graph OilPalm
138. TF_CumOilHarvest [Tree]
Cumulative amount of oil harvested kg m-2 Graph OilPalm
139. TF_FemBunchFrac [Tree]
Fraction of female flowers/fruit kg m-2 Graph OilPalm
140. TF_FruitperBunch [Tree, FruitBunch]
Number of oil palm fruit per fruit stages kg m-2 Graph OilPalm
141. TF_WatNutSuff [Tree]
The effect of water and nutrient stress on the oilpalm growth
dimen-sionless
Graph OilPalm
142. TW_DemandActAll Amount of water demanded by all tree per day
l m-2 day-1
Graph Overall (10)
143. TW_Posgro[Tree] The effect of water stress on tree growth (0=no growth, 1=no stress)
dimen-sionless
Graph Overall (10, 13 – 15)
144. TW_UptPotAll Total amount of water in all soil layers available for tree per day
l m-2 day-1
Graph Overall (10)
145. TW_UptTotAll Current amount of water uptake by tree from all soil layers per day
l m-2 day-1
Graph Overall (10)
146. W_CUpti[Zone] Amount of water taken up by crop from i-th soil layer of each zone per day
l m-2 day-1
Graph Zonei (5)
147. W_DrainCumV [Zone]
Cumulative amount of water drained out from bottom layer
l m-2 Graph Overall (3)
148. W_Stocki[Zone] Amount of water each zone in i-th soil layer
l m-2 Graph Zonei (2)
149. W_TUpti[Zone] Amount of water taken up by all tree from i-th soil layer of each zone per day
l m-2 day-1
Graph Zonei (6)
appendix 4-7.qxd 9/24/2004 10:16 AM Page 177

appendix 4-7.qxd 9/24/2004 10:16 AM Page 178
179
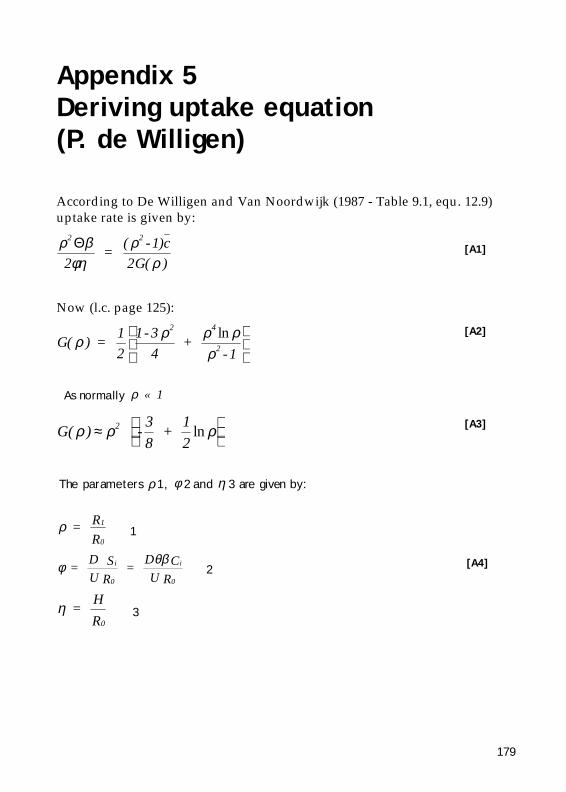
Appendix 5Deriving uptake equation(P. de Willigen)
According to De Willigen and Van Noordwijk (1987 - Table 9.1, equ. 12.9)uptake rate is given by:
Now (l.c. page 125):
2 2
2 = ( -1)c
2G( )ρ β
φηρ
ρΘ [A1]
G( ) = 12
1- 34
+ -1
2 4
2ρ ρ ρ ρρ
ln
[A2]
As normally ρ « 1
G( ) - 38
+ 12
2ρ ρ ρ≈
ln [A3]
The parameters ρ φ η1, 2 and 3 are given by:
ρ = RR
1
0
φ θβ = D SU R
= D CU R
i
0
i
0
η = HR0
1
2
3
[A4]
appendix 4-7.qxd 9/24/2004 10:16 AM Page 179

180
and the dimensionless concentration by:
where D is the diffusion coefficient (m2.d-1), H is the thickness of the soillayer (m), U is the uptake rate (g.m-2.d-1), R0 the radius of the root (m) andR1 the radius of the soil cylinder surrounding the root. The latter is given by:
The parameter 4 denotes the buffer power of the soil. Substitution of (A2)-(A6) into (A1) leads to:
where D0 is the diffusion coefficient of the nutrient in question in water,whereas the concentration can be calculated from the amount in the layerNstock (g.m-2):
Ka being the adsorption constant. Substitution of (A2)-(A9) into (A1)ultimately yields (A10) which is the basis for equation (10) in WaNuLCAS.
c = CCi
[A5]
1
rvR = 1
Lπ [A6]
U = DCH
R - 38
+ 121
2 ln ρ
[A7]
The diffusion coefficient is a funct ion of the water content Θ5, according to:
D = (a + a ) D1 0 0Θ Θ [A8]
C = NK +
stock
a Θ[A9]
U = D ( a + a ) H N
( K + ) - 38
+ 12
1R L
0 1 0 stock
a0 rv
π
π
Θ Θ
Θ ln
[A10]
appendix 4-7.qxd 9/24/2004 10:16 AM Page 180

181
Appendix 6Trouble-shooting and Tips
As for any complex system, the number of ways in which the model can gowrong is nearly infinite, while there is only one (or a few) ways it can goright., So the odds certainly are against us. If things go wrong, however, thereare a number of ways to identify the source of the errors as a step towardsmending it.
Difficulties in loading the files: o Links can not be established: check whether you have indeed opened the
right XLS file and have not changed the position of any of the linkedparameters by adding or deleting rows or columns or moving cellcontents around,
o Low Memory ('cannot continue DDE conversation'); it may help toremove all memory demanding programs, including net-work links andmicrosoft office toolbars from the memory; sometimes it helps to re-bootthe computer and start afresh; this type of error message may occur whenyou update the links by running the Ctrl+Y, Ctrl+W or Ctrl+U macro inthe excel; if the problem persists you'll have to get more RAM on yourcomputer (32 MB is a bare minimum); you can also make runs in the Stellamodel without opening the excel + links, or close the excel file afterupdating parameter values, to increase the memory allocation for theStella model.
o Running speed can be increased by locking graphs/tables that you're notcurrently interested in.
o Links are not working; WaNulCAS.xls is developed using MS Excel withEnglish language as the settings. If you use MS Excel with settings onother languages the link will not work. You will need to modify the linkswithin the model (WaNuLCAS.stm) using STELLA version 6 or above.
Error message at start or during RUN
It is possible that when you press RUN you get an error message, in stead ofoutput. The message will indicate a parameter name and the error usuallyconsists of division by zero. We have tried to protect all equations from suchan event, but if necessary you can add an 'If *** <> 0 then '...existingequation...' else 0' statement to the equation involved, with the *** replacedby any divisor in the equation.
appendix 4-7.qxd 9/24/2004 10:20 AM Page 181
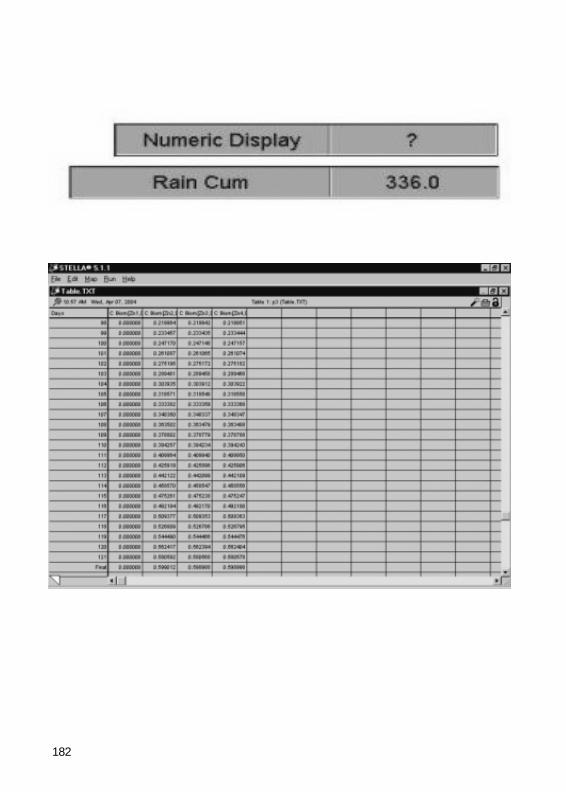
182
appendix 4-7.qxd 9/24/2004 10:21 AM Page 182

183
Trees or crops do not grow at all
A second class of errors is that trees or crops do not grow as expected, orother events do not ha pen as you thought you asked for in the calendar. Insuch case you can add a new table to the output screen and check where theerror originates by tabulating output values related to the event. For treesand crops it is helpful to tabulate the growth stage as well as components ofthe biomass, to check whether the error is in the plants not getting started atall, or not making biomass. It may be necessary to tabulate input values andcompare with the values you intended. Sometimes the x axis for tabulatedinput parameters, such as the strings of crop or tree parameter, gets changedand all parameter values are shifted by one or
more positions, leading to nonsensical results; if this happens open the graphand read just the number of points. You can try the 'return to default' buttonon the 'input' screen to restore (unintentional) modifications of parametersettings that may be responsible for unexpected run results; if you want tomodify the 'default' values to which you return with this button, you have tomodify the values in the dialogue boxes on the 'second level' (the modellinglayer).
appendix 4-7.qxd 9/24/2004 10:20 AM Page 183

appendix 4-7.qxd 9/24/2004 10:20 AM Page 184

185
Appendix 7Input parameters and their definition
Abbreviations used in parameter namesNo Acronym Definition No Acronym Definition
1. AF “Agroforestry Zone” – overall design of the system
14. Mn Nutrients in Litter Layer
2. C Crop (C = Crop, C_N = Crop Nutrient or CW = Crop Water)
15. Mn2 Nutrients in Soil Organic Matter (SOM)
3. Ca Crop Calendar (schedule) 16. N Nutrient (currently including N and P)
4. Cent Input Output Summary for Litter (based on Century Model)
17. P Profitability (economic sector of the model)
5. Cent2 Input Output Summary for SOM (based on Century Model)
18. PD Pest and Disease
6. Cq Crop Sequence (crop parameters) 19. Rain Rain
7. E Erosion 20. Rt Root
8. Evap Evaporation 21. S&B Slash and Burn
9. G Grazing 22. S Soil Structure
10. LF Lateral Flow 23. T Tree (T=Tree, T_N=Tree Nutrient or TW=Tree Water)
11. Light Light 24. TF Tree Fruit (oil Palm Module)
12. Mc Carbon in Litter Layer 25. Temp Temperature
13. Mc2 Carbon in Soil Organic Matter (SOM) 26. W Water
Note: In plain style means CORE modules, in italic style means ADDITIONAL modules.
appendix 4-7 R.qxd 9/27/2004 10:36 AM Page 185

186 No Acronym Definition Dimensions Range of value (Default value)
Input Section (Link location in Excel)
1. AF_AnyTrees? Parameter governing an option to simulate system with trees. Value 0 means system without trees, value 1 means system with trees is possible
dimensionless 0 or 1 (1) RUN & OUTPUT SECTION
2. AF_Circ? Switch to decide on circular versus linear symmetry. 1 = circular system, 0 =linear system
dimensionless 0 or 1 (0) Agroforestry Zone
3. AF_Crop? Parameter governing an option to simulate system with crop. Value 0 means system without crop, value 1 means system with crop
dimensionless 0 or 1 (0) RUN & OUTPUT SECTION
4. AF_DeepSubSoil Equivalent depth of the subsoil below layer 4, that is used to calculate the effective water outflow from the soil column, via S_KsatVDeepSub
m 0 - 10 (3) Agroforestry Zone
5. AF_DepthDynamic? Swicth for making the depth of soil layer 1 on sloping land system a dynamic property
dimensionless 0 or 1 (0) Agroforestry Zone/Sloping Land and Parkland System
6. AF_DepthGroundWater Table
Depth of groundwater table below the bottom of layer 4, expressed in m. For the time being the value is used as a constant in defining 'field capacity'.
m 0 – 10 (0) Agroforestry Zone
7. AF_DepthLayi[Zone] Soil depth increment in (= layer thickness of) i-th soil layer, i = 1, 2, 3, 4. For sloping land systems the value for the layer 1 is used as average topsoil depth at the start of the run; actual depth of layer 1 will be calculated from the two AF_Slope parameters
m 0 - 1 (.05, .15, .3, .5 for i = 1,..,4)
Agroforestry Zone
appendix 4-7 R.qxd 9/27/2004 10:36 AM Page 186

187
No Acronym Definition Dimensions Range of value (Default value)
Input Section (Link location in Excel)
8. AF_DynPestImpacts? Switch governing an option to simulate system with dynamic pest impact. Value 0 means no dynamic pest impacts, value 1 means dynamic pest impacts is possible.
dimensionless 0 – 1 (0) RUN & OUTPUT SECTION
9. AF_PlotNumberUphill Number of similar uphill plot neighbors as source of Lateral Inflow & Run-on
dimensionless (0) Agroforestry zone
10. AF_RunNutLim[SiNut]? Switch governing an option to simulate system with nutrient limitation. Value 0 means no nutrient limitation, value 1 means nutrient is possible.
dimensionless 0 – 1 (1) RUN & OUTPUT SECTION
11. AF_RunOnFrac Fraction of surface runoff from the area uphill that enters the simulation area as run-on.
dimensionless 0 – 1 (0) Agroforestry Zone
12. AF_RunWatLim? Parameter governing an option to simulate system with water limitation. Value 0 means no water limitation, value 1 means water limitation is possible.
dimensionless 0 – 1 (1) RUN & OUTPUT SECTION
13. AF_SimulateWeeds? Parameter governing an option to simulate weed growth. Value 0 means no weed growth, value 1 means weed will start growing whenever crop is absent.
% 0 or 1 (0) RUN & OUTPUT SECTION
14. AF_SlopeInit Slope (expressed as percent elevation increment per horizontal distance) of the soil surface at the start of the simulation; this value can differ from the slope of the soil profile AF_SlopeSoilHoriz, but should not differ too much.
% 0 – 100 (0) Agroforestry Zone/Sloping Land and Parkland System
appendix 4-7 R.qxd 9/27/2004 10:36 AM Page 187

188 No Acronym Definition Dimensions Range of value (Default value)
Input Section (Link location in Excel)
15. AF_SlopeSoilHoriz Slope (expressed as percent elevation increment per horizontal distance) of the soil horizons below the surface, especially that of the topsoil, used to calculate actual topsoil depth per zone.
% 0 – 100 (0) Agroforestry Zone/Sloping Land and Parkland System
16. AF_StoneFrac [Zone,SoilLayer]
Fraction of stone in each soil layer and zone dimensionless 0 – 1 (0) Agroforestry Zone
17. AF_TreePosit[Tree] Position of each tree type. It can be in zone 1 (1) or zone 4 (4); if one wants it to be in both, two otherwise equal tree types can be defined.
dimensionless 1 or 4 (1) Agroforestry Zone
18. AF_Zone[Zone] Width of each zone. Width of zone 4 is calculated back from AF_ZoneTot minus the sum of zone 1+2+3
m 0 – 100 (.5, 1,1) Agroforestry Zone
19. AF_ZoneTot Total width of agroforestry system simulated m 0 – 100 (3.5) Agroforestry Zone
20. C_AgronYMoistFrac[Cr] Standard moisture content for expressing marketable yields of each crop
dimensionless 0 – 1 (.15) (Crop Library)
21. C_ApplyMaintResp? On/Off switch for applying the maintenance respiration; 1 = on, 0 = off
dimensionless 0 or 1 (0) Maintenance Respiration
22. C_DailyWeedSeedDecay Frac
Fraction of the weed seed bank that looses viability and is transferred to the litter pool for decomposition
fraction day-1 0 – 1 (.02) Management/ Weed Growth
23. C_HostEffForT1[Cr] Effectiveness of crop roots as host for a parasitic tree (T1)
cm3 cm-1 (0) Root Parasitism
24. C_RelRespGroRes Relative weighting factor for growth used in calculating daily maintenance respiration
dimensionless (.5) Maintenance Respiration
25. C_RelRespRt Relative weighting factor for roots used in calculating daily maintenance respiration
dimensionless (.3) Maintenance Respiration
appendix 4-7 R.qxd 9/27/2004 10:36 AM Page 188

189
No Acronym Definition Dimensions Range of value (Default value)
Input Section (Link location in Excel)
26. C_RelRespStLv Relative weighting factor for stem & leaves used in calculating daily maintenance respiration
dimensionless (.5) Maintenance Respiration
27. C_RelRespYieldCurr Relative weighting factor for developing fruits/Yield as part of total biomass as used for maintenance respiration
dimensionless (1) Maintenance Respiration
28. C_ResidRemovalFrac Fraction of crop residue removed from field (not returned as mulch). The same value applies for all zones and all crops used in the simulation
fraction 0 – 1 (0) Management/ Mulching
29. C_RespperBiom The relative use of resources for maintenance respiration per unit biomass
dimensionless 0 – 0.2 (.05) Maintenance Respiration
30. C_RespTemp A graphical relation between temperature and maintenance respiration
dimensionless (see C_Resp Temp graph)
Maintenance Respiration
31. C_WeedGermFrac Fraction of weed seeds in the seed bank that germinates when a new opportunity arises, e.g. at the end of a cropping season
fraction 0 –1 (.1) Management/ Weed Growth
32. C_WeedSeedBankInit Initial dry weight of weed seeds in seed bank kg m-2 0 –1 (.01) Management/ Weed Growth
33. C_WeedSeedExtInflux Daily influx of weed seeds from outside of the plot
kg m-2 day-1 0 – 0.1 (.00001) Management/ Weed Growth
34. Ca_CType[Zone] A graphical input parameter governing the type of crop planted in sequence, with the possibility of having different crops (and/or planting times) in different zones. Associated with type of crop in database. See WaNuLCAS.xls
dimensionless 1 – 5 (2) (Crop Management)
appendix 4-7 R.qxd 9/27/2004 10:36 AM Page 189

190 No Acronym Definition Dimensions Range of value (Default value)
Input Section (Link location in Excel)
35. Ca_DoYStart Day of year at which simulation starts julian days 1 – 365 (300) RUN & OUTPUT SECTION
36. Ca_ExtOrgApp?[Type] Parameter governing an option to have simulation with applying external organic input or not. Value 0 means not applying external organic input, value 1 means applying external organic input
dimensionless 0 or 1 (0) (Crop Management)
37. Ca_FertApp?[SiNut] Parameter governing an option to have simulation with applying fertilizer or not. Value 0 means not applying fertilizer, value 1 means applying fertilizer
dimensionless 0 or 1 (1) (Crop Management)
38. Ca_FertOrExtOrgApp Amount[Zone]
Amount of N or P fertilizer or external organic applied. A graphical input parameter.
g m-2 0 – 10 (4.5 for each N and P)
(Crop Management)
39. Ca_FertOrExtOrgAppDoY [SiNut]
Time of fertilizer or external organic input application. A graphical input parameter.
julian days 1 – 365 (see excel sheet Crop Management)
(Crop Management)
40. Ca_FertOrExtOrgAppYear [SiNut]
Year of fertilizer or external organic input application. A graphical input parameter.
dimensionless any integer value (see excel sheet Crop Management)
(Crop Management)
41. Ca_ImmAmount[P,Zone] Amount of immobile P fertilizer applied. A graphical input parameter
g m-2 (see Ca_ImmAmount graph)
Management/ P Immobile Input
42. Ca_ImmDOY[P] Time of immobile P fertilizer application. A graphical input parameter
julian days 1 – 365 (see Ca_ImmDOY graph)
Management/ P Immobile Input
appendix 4-7 R.qxd 9/27/2004 10:36 AM Page 190

191
No Acronym Definition Dimensions Range of value (Default value)
Input Section (Link location in Excel)
43. Ca_ImmY[P] Year of immobile P fertilizer application. A graphical input parameter
dimensionless Any integer value (see Ca_ImmY graph)
Management/ P Immobile Input
44. Ca_PlantDoY[Zone] Day of crop planting for each subsequent crop. A graphical input parameter.
julian days 1 – 365 (see excel sheet Crop Management)
(Crop Management)
45. Ca_PlantYear[Zone] Year of planting for each subsequent crop. A graphical input parameter
dimensionless any integer value (see excel sheet Crop Management)
(Crop Management)
46. Cq_CHarvAlloc[Cr] Allocation of biomass to harvested parts (grain, tuber) as a function of crop growth stage.
dimensionless (see Cq_CHarv Alloc table)
(Crop Library)
47. Cq_ClosedCan[Cr] Amount of crop canopy biomass at which canopy is closed and nutrient demand per unit new biomass shifts from Cq_ConcYoung to Cq_ConcOld.
kg m-2 0 – 0.5 (0.2) (Crop Library/ Nutrient Uptake)
48. Cq_CLWR[Cr] Crop leaf weight ratio = gram of green leaf area per gram of shoot, for each crop species as a function of crop growth stage.
g m-2 (see Cq_CLWR table)
(Crop Library)
49. Cq_ConcOld[Cr,SiNut] Nutrient concentration in crop tissue formed after biomass has reached the Cq_ClosedCan value.
dimensionless 0 – 0.1 (N = .01, P = .0025
(Crop Library/ Nutrient Uptake)
50. Cq_ConcRt[Cr] N concentration in crop roots dimensionless 0 – 0.1 (.01) (Crop Library/ Nutrient Uptake)
51. Cq_ConcYoung[Cr,SlNut] Nutrient concentration in young crop biomass (before biomass has reached the Cq_ClosedCan value).
dimensionless 0 – 0.1 (N = .015 P = .007)
(Crop Library/ Nutrient Uptake)
appendix 4-7 R.qxd 9/27/2004 10:36 AM Page 191
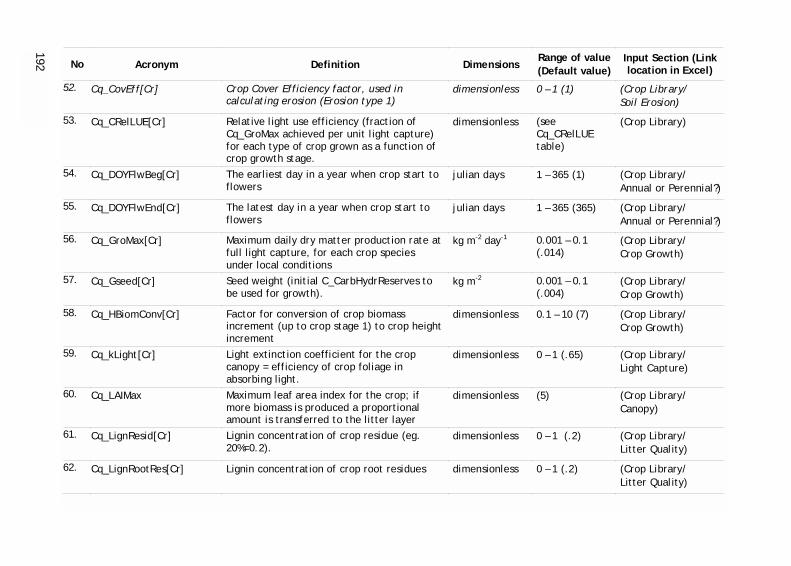
192 No Acronym Definition Dimensions Range of value (Default value)
Input Section (Link location in Excel)
52. Cq_CovEff[Cr] Crop Cover Efficiency factor, used in calculating erosion (Erosion type 1)
dimensionless 0 – 1 (1) (Crop Library/ Soil Erosion)
53. Cq_CRelLUE[Cr] Relative light use efficiency (fraction of Cq_GroMax achieved per unit light capture) for each type of crop grown as a function of crop growth stage.
dimensionless (see Cq_CRelLUE table)
(Crop Library)
54. Cq_DOYFlwBeg[Cr] The earliest day in a year when crop start to flowers
julian days 1 – 365 (1) (Crop Library/ Annual or Perennial?)
55. Cq_DOYFlwEnd[Cr] The latest day in a year when crop start to flowers
julian days 1 – 365 (365) (Crop Library/ Annual or Perennial?)
56. Cq_GroMax[Cr] Maximum daily dry matter production rate at full light capture, for each crop species under local conditions
kg m-2 day-1 0.001 – 0.1 (.014)
(Crop Library/ Crop Growth)
57. Cq_Gseed[Cr] Seed weight (initial C_CarbHydrReserves to be used for growth).
kg m-2 0.001 – 0.1 (.004)
(Crop Library/ Crop Growth)
58. Cq_HBiomConv[Cr] Factor for conversion of crop biomass increment (up to crop stage 1) to crop height increment
dimensionless 0.1 – 10 (7) (Crop Library/ Crop Growth)
59. Cq_kLight[Cr] Light extinction coefficient for the crop canopy = efficiency of crop foliage in absorbing light.
dimensionless 0 – 1 (.65) (Crop Library/ Light Capture)
60. Cq_LAIMax Maximum leaf area index for the crop; if more biomass is produced a proportional amount is transferred to the litter layer
dimensionless (5) (Crop Library/ Canopy)
61. Cq_LignResid[Cr] Lignin concentration of crop residue (eg. 20%=0.2).
dimensionless 0 – 1 (.2) (Crop Library/ Litter Quality)
62. Cq_LignRootRes[Cr] Lignin concentration of crop root residues dimensionless 0 – 1 (.2) (Crop Library/ Litter Quality)
appendix 4-7 R.qxd 9/27/2004 10:36 AM Page 192
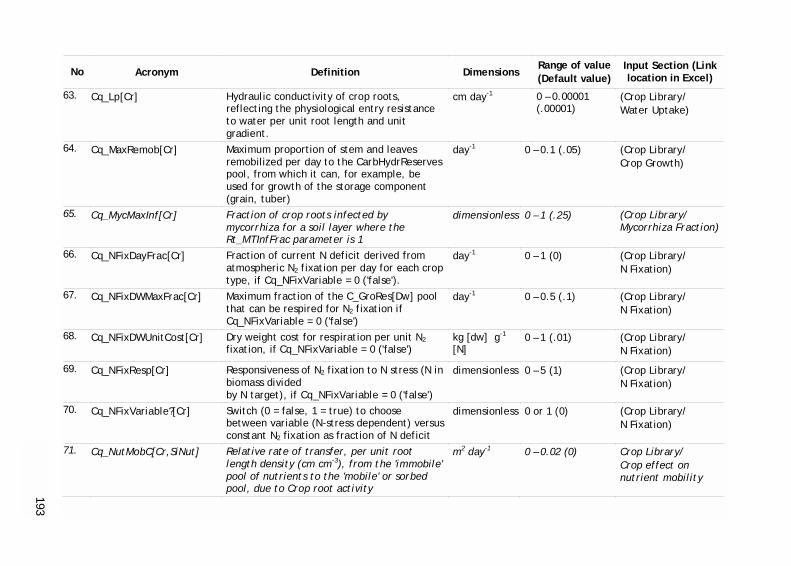
193
No Acronym Definition Dimensions Range of value (Default value)
Input Section (Link location in Excel)
63. Cq_Lp[Cr] Hydraulic conductivity of crop roots, reflecting the physiological entry resistance to water per unit root length and unit gradient.
cm day-1 0 – 0.00001 (.00001)
(Crop Library/ Water Uptake)
64. Cq_MaxRemob[Cr] Maximum proportion of stem and leaves remobilized per day to the CarbHydrReserves pool, from which it can, for example, be used for growth of the storage component (grain, tuber)
day-1 0 – 0.1 (.05) (Crop Library/ Crop Growth)
65. Cq_MycMaxInf[Cr] Fraction of crop roots infected by mycorrhiza for a soil layer where the Rt_MTInfFrac parameter is 1
dimensionless 0 – 1 (.25) (Crop Library/ Mycorrhiza Fraction)
66. Cq_NFixDayFrac[Cr] Fraction of current N deficit derived from atmospheric N2 fixation per day for each crop type, if Cq_NFixVariable = 0 ('false').
day-1 0 – 1 (0) (Crop Library/ N Fixation)
67. Cq_NFixDWMaxFrac[Cr] Maximum fraction of the C_GroRes[Dw] pool that can be respired for N2 fixation if Cq_NFixVariable = 0 ('false')
day-1 0 – 0.5 (.1) (Crop Library/ N Fixation)
68. Cq_NFixDWUnitCost[Cr] Dry weight cost for respiration per unit N2 fixation, if Cq_NFixVariable = 0 ('false')
kg [dw] g-1 [N]
0 – 1 (.01) (Crop Library/ N Fixation)
69. Cq_NFixResp[Cr] Responsiveness of N2 fixation to N stress (N in biomass divided by N target), if Cq_NFixVariable = 0 ('false')
dimensionless 0 – 5 (1) (Crop Library/ N Fixation)
70. Cq_NFixVariable?[Cr] Switch (0 = false, 1 = true) to choose between variable (N-stress dependent) versus constant N2 fixation as fraction of N deficit
dimensionless 0 or 1 (0) (Crop Library/ N Fixation)
71. Cq_NutMobC[Cr,SiNut] Relative rate of transfer, per unit root length density (cm cm-3), from the 'immobile' pool of nutrients to the 'mobile' or sorbed pool, due to Crop root activity
m2 day-1 0 – 0.02 (0) Crop Library/ Crop effect on nutrient mobility
appendix 4-7 R.qxd 9/27/2004 10:36 AM Page 193

194 No Acronym Definition Dimensions Range of value (Default value)
Input Section (Link location in Excel)
72. Cq_PotSuctAlphMax[Cr] Plant potential where transpiration is (1-Alpha)*potential transpiration,Alpha is a small value (e.g. 0.01). Value could be different depend on crop type.
cm -6000 – -4000 (-5000)
(Crop Library/ Water Uptake)
73. Cq_PotSuctAlphMin[Cr] Plant potential where transpiration is Alpha*potential transpiration, Alpha is a small value (e.g. 0.01). Value could be different depend on crop type.
cm -16000 – -14000 (-15000)
(Crop Library/ Water Uptake)
74. Cq_RainWStorCap[Cr] Rainfall water stored as thin film at leaf surface
mm 0 – 2 (1) (Crop Library/ Rain Interception)
75. Cq_RelLightMaxGr[Cr] Relative light intensity at which shading starts to affect tree growth
dimensionless 0 – 1 (1) (Crop Library/ Light Capture)
76. Cq_RhizEffKaPC[Cr] Proportional reduction of the apparent adsorption constant for P due to root activity of the crop, expressed as fraction of N_KaPdef per unit crop root length density
m2 day-1 0 – 0.2 (0) (Crop Library/ Crop effect on nutrient mobility)
77. Cq_RtAlloc[Cr] Fraction of crop growth reserves allocated to root biomass in the absence of water or nutrient stress as a function of crop stage (only for Rt_ACType=2).
day-1 (see Cq_RtAlloc table)
(Crop Library)
78. Cq_RtAllocResp[Cr] Crop root allocation responsiveness to water or nutrient (the factor currently in minimum supply) stress; 0 = constant root allocation, 1 = linear response to water and nitrogen stress, >1 more-than-proportional response (only for Rt_ACType = 2)
dimensionless 0 – 2 (2) (Crop Library/Roots)
79. Cq_RtDiam[Cr] Crop root diameter. It is used in calculating water and nutrient uptake.
cm 0.05 – 1 (.02) (Crop Library/Roots)
appendix 4-7 R.qxd 9/27/2004 10:36 AM Page 194

195
No Acronym Definition Dimensions Range of value (Default value)
Input Section (Link location in Excel)
80. Cq_SingleCycle?[Cr] A parameter deciding what happens after fruits are ripe: 1 = annual that dies back, 0 = perennial that returns to crop stage =1.
dimensionless 0 or 1 (1) (Crop Library/ Annual or Perennial?)
81. Cq_SLA[Cr] Crop specific leaf area = green surface area (one-sided) per unit leaf dry weight, for each crop species as a function of crop growth stage. For Cq_Atype =1, .., 5, default values are provided. Cq_AType = 6, .,10 user defined, as before.
m2 g-1 (see Cq_SLA table)
(Crop Library)
82. Cq_TimeGen[Cr] Length of generative stage for each crop. For Cq_Atype =1, .., 5, default values are provided, but can be modified to adopt the default crop parameters to local conditions.
days 0 – 1000 (30) (Crop Library/ Crop Stage)
83. Cq_TimeVeg[Cr] Length of vegetative stage for each crop. For Cq_Atype =1, .., 5, default values are provided, but can be modified to adopt the default crop parameters to local conditions.
days 0 – 1000 (60) (Crop Library/ Crop Stage)
84. Cq_TranspRatio[Cr] Amount of water needed per unit dry matter production of each crop species. For Cq_Atype =1, .., 5, default values are provided. For Cq_AType=6, .., 10 user defined
l kg-1 200 – 600 (300) (Crop Library/ Crop Growth)
85. Cq_WeedType Weed type. This is user defined. Weed biomass growth follows the rules of crop growth. It takes the same type of parameters as crop. All the related input parameters are in Excel sheet
dimensionless (5) Management/ Weed Growth
86. E_BulkDens Bulk density used in converting soil mass movement to changes in volume of topsoil per zone
g cm-3 0.5 – 1.6 (1.4) (Soil Hydraulic)
87. E_CovEffT[Tree] Tree cover efficiency factor (per unit tree LAI)
dimensionless 0 – 1 (.5) (Tree Library/ Erosion Protection)
appendix 4-7 R.qxd 9/27/2004 10:36 AM Page 195

196 No Acronym Definition Dimensions Range of value (Default value)
Input Section (Link location in Excel)
88. E_EntrailmentCoeffBare Plot
Entrailment coefficient for sediment movement (Rose equation) in the absence of vegetative soil cover
kg-1 (soil) mm-1 m2
0 – 1 (.002) Soil Erosion and Sedimentation
89. E_ErosiType Parameter to decide on model of erosion used. 1 = using USLE, 0 = using Rose Equation
dimensionless 0 or 1 (0) Soil Erosion and Sedimentation
90. E_IntvPloughPlant Length of ploughing time julian days 1 – 365 (10) Management/Tillage
91. E_PloughBefPlant? Paramater governing option to plough before planting (0 = no ploughing, 1 = ploughing before planting)
dimensionless 0 or 1 (0) Management/Tillage
92. E_PloughDoY Date of ploughing julian days 1 – 365 (364) Management/Tillage
93. E_PloughY Year of ploughing dimensionless 0 – 100 (100) Management/Tillage
94. E_RainFac A multiplier determining impact of rainfall on soil erosion, for calculation soil loss using USLE
dimensionless 0 – 10 (1) Soil Erosion and Sedimentation
95. E_SoilMoveperPlough Amount of soil moved per ploughing event, for calculation soil loss using USLE
kg m-2 0 – 500 (399) Soil Erosion and Sedimentation
96. E_SoilType Type of soil. 1 = medium, 2 = sandy, 3 = clay dimensionless 1, 2, 3 (1) Soil Erosion and Sedimentation
97. E_TillZone?[Zone] On/off switch for tilling activity in each zone (0 = no tillage, 1 = with tillage)
dimensionless 0 or 1 (0, 1, 1, 1)
Management/Tillage
98. Evap_MulchEffSurfLit Effect of mulch on the amount of water evaporating from the soil
dimensionless (1) Soil Evaporation
99. GHG_LitMinMultiplier Multiplier of litter mineralization for quick modifications of nitrogen oxide emission
dimensionless (1) Soil Water & Nutrient/ Nox emissions
appendix 4-7 R.qxd 9/27/2004 10:36 AM Page 196

197
No Acronym Definition Dimensions Range of value (Default value)
Input Section (Link location in Excel)
100. GHG_N2perNOx Ratio of nitrous and nitric oxide dimensionless See graph GHG_N2perNOx
Soil Water & Nutrient/ Nox emissions
101. LF_FracGWReleaseAsInflow The fraction of groundwater that flow out that reaches the simulated zone (this depends on subsoil stratification and landscape characteristics beyond the scope of out current model)
dimensionless (0) Agroforestry Zone
102. LF_GWReleaseFraction The fraction of the current stock of groundwater that flows out on a daily basis. A stock of groundwater stored uphill depends on the ‘number of plots uphill’.
dimensionless (.05) Agroforestry Zone
103. LF_SubSurfInflow4 Amount of sub surface water inflow in layer 4
mm day-1 0 – 5 (0) Agroforestry zone
104. Mc_Carbon Proportion of total carbon in plant litter and residue
dimensionless 0 – 0.5 (.42) Soil Organic Matter and Litter Quality/ Litter Quality
105. Mc_CExtOrg[type] Carbon concentration of external input dimensionless 0 – 1 (.4) Litter Quality/ Quality of Ext. Organic Input
106. Mc_CNRatInitMetab[zone] Initial C:N ratio metabolic pool of litter dimensionless (8) Soil Organic Matter and Litter Quality/ Initial C & N in Litter Pool
107. Mc_KAct Decay rate for decomposition of active pool of soil organic matter
dimensionless (.02) Soil Organic Matter and Litter Quality/ Other Factors Affecting Decomposition
appendix 4-7 R.qxd 9/27/2004 10:36 AM Page 197

198 No Acronym Definition Dimensions Range of value (Default value)
Input Section (Link location in Excel)
108. Mc_KMetab Decay rate for decomposition of active pool of soil organic matter
dimensionless (.05) Soil Organic Matter and Litter Quality/ Other Factors Affecting Decomposition
109. Mc_KPass Decay rate for decomposition of active pool of soil organic matter
dimensionless (.0000186) Soil Organic Matter and Litter Quality/ Other Factors Affecting Decomposition
110. Mc_KSlw Decay rate for decomposition of active pool of soil organic matter
dimensionless (.000543) Soil Organic Matter and Litter Quality/ Other Factors Affecting Decomposition
111. Mc_KStruc Decay rate for decomposition of active pool of soil organic matter
dimensionless (.013429) Soil Organic Matter and Litter Quality/ Other Factors affecting Decomposition
112. Mc_LignExtOrg[Type] Lignin concentration of external input. dimensionless 0 – 1 (.2) Soil Organic Matter and Litter Quality/ Quality of Ext. Organic Input
113. Mc_PolypExtOrg[Type] Polyphenol concentration of external input dimensionless 0 – 1 (0) Soil Organic Matter and Litter Quality/ Quality of Ext. Organic Input
appendix 4-7 R.qxd 9/27/2004 10:36 AM Page 198

199
No Acronym Definition Dimensions Range of value (Default value)
Input Section (Link location in Excel)
114. Mc2_Clay Proportion of clay in soil (only for soil organic matter type 2)
dimensionless 0 – 1 (.316) Soil Organic Matter and Litter Quality/ Other Factors Affecting Decomposition
115. Mc2_ClayCoeffCref Coefficient of clay based on tabulated Cref for soil organic matter type 2
dimensionless (.94) Soil Organic Matter and Litter Quality/ Other Factors Affecting Decomposition
116. Mc2_CNRatInitMetab [zone]
Initial C:N ratio metabolic pool of soil organic matter
dimensionless (8) Soil Organic Matter and Litter Quality/ Initial C & N in SOM Pool
117. Mc2_CorgInitMeth3 Initial soil organic carbon value in soil organic matter pool using Type 3.
gr cm-2 (2) Soil Organic Matter and Litter Quality/ Initial C & N in SOM Pool
118. Mc2_CorgpCref Initial soil organic carbon value in soil organic matter pool using Type 3.
gr cm-2 (.8) Soil Organic Matter and Litter Quality/ Initial C & N in SOM Pool
119. Mc2_CrefMeth3 Initial C-ref value in soil organic matter pool using Type 2.
gr cm-2 (3) Soil Organic Matter and Litter Quality/ Initial C & N in SOM Pool
120. Mc2_CrefOffset Constant for C reference tabulated for soil organic matter type 2.
dimensionless (1.256) Soil Organic Matter and Litter Quality/ Other Factors Affecting Decomposition
appendix 4-7 R.qxd 9/27/2004 10:36 AM Page 199

200 No Acronym Definition Dimensions Range of value (Default value)
Input Section (Link location in Excel)
121. Mc2_pH Soil pH (only for soil organic matter type 2) dimensionless (5) Soil Organic Matter and Litter quality/ Other Factors Affecting Decomposition
122. Mc2_pHCoeffCref Coefficient of pH based on tabulated of Cref for soil organic matter type 2
dimensionless (-.156) Soil Organic Matter and Litter Quality/ Other Factors Affecting Decomposition
123. Mc2_RainTransfer[Pool] Rain factor which control transferring process of litter to SOM pool
dimensionless (.001) Soil Organic Matter and Litter Quality Litter → SOM Transfer
124. Mc2_Silt Proportion of silt in soil (only for soil organic matter type 2)
dimensionless 0 – 1 (.2) Soil Organic Matter and Litter Quality/ Other Factors Affecting Decomposition
125. Mc2_SiltClayCoeffCref Coefficient of clay and silt based on tabulated Cref for soil organic matter type 2
dimensionless (.703219) Soil Organic Matter and Litter Quality/ Other Factors Affecting Decomposition
126. Mc2_SoilTillTransfer [Pool]
Soil tillage factor which control transferring process of litter to SOM pool
dimensionless (1) Soil Organic Matter and Litter Quality/ Litter → SOM Transfer
127. Mc2_SOMDistribution [SoilLayer]
Relative distribution of carbon between different soil layers
fraction 0 – 1 (1, .2, .1, .05)
Soil Organic Matter and Litter Quality/ SOM Distribution
appendix 4-7 R.qxd 9/27/2004 10:36 AM Page 200

201
No Acronym Definition Dimensions Range of value (Default value)
Input Section (Link location in Excel)
128. Mc2_SOMInitType Parameter defining methods to initialize soil organic matter pool. Three methods are provided for initializing the soil organic matter pools: Type = 1 the user can specify all pool sizes for all zones, Type = 2 the user can specify the size of all pools relative to those for a forest soil (Cref) that is calculated from soil texture data, Type = 3 the user specifies the Corg and Cref directly, but otherwise follows the procedure of Type 2
dimensionless 1, 2, 3 (1) Soil Organic Matter and Litter Quality/ Initial C & N in SOM Pool
129. Mc2_WormTransfer [Pool]
Worm factor which control transferring process of litter to SOM pool
dimensionless 0.003 – 0.1 (Struc, Metab and Act = .1; Slow = .3; Pass = .003)
Soil Organic Matter and Litter Quality/ Litter → SOM Transfer
130. Mn_CNAct C:N ratio of active pools dimensionless 5 – 10 (8) Soil Organic Matter and Litter Quality/ C:N Ratio of Litter Pool
131. Mn_CNPass C:N ratio of passive pools dimensionless 8 – 15 (11) Soil Organic Matter and Litter Quality/ C:N Ratio of Litter Pool
132. Mn_InitAct[Zone] Initial amount of N in active Litter pool of each zone
mg cm-3 0 – 1 (.00002) Soil Organic Matter and Litter Quality/ Initial C & N in Litter Pool
133. Mn_InitMetab[Zone] Initial amount of N in metabolic Litter pool of each zone
mg cm-3 0 – 1 (0) Soil Organic Matter and Litter Quality/ Initial C & N in Litter Pool
appendix 4-7 R.qxd 9/27/2004 10:36 AM Page 201
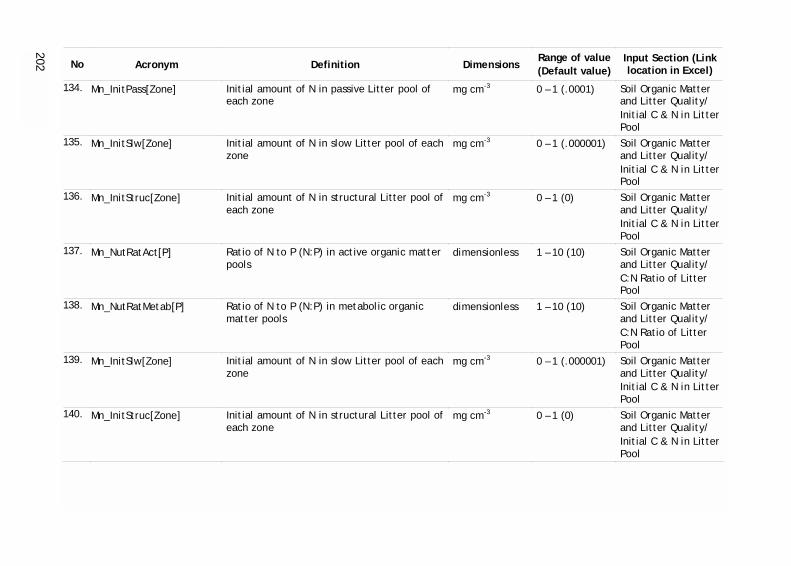
202 No Acronym Definition Dimensions Range of value (Default value)
Input Section (Link location in Excel)
134. Mn_InitPass[Zone] Initial amount of N in passive Litter pool of each zone
mg cm-3 0 – 1 (.0001) Soil Organic Matter and Litter Quality/ Initial C & N in Litter Pool
135. Mn_InitSlw[Zone] Initial amount of N in slow Litter pool of each zone
mg cm-3 0 – 1 (.000001) Soil Organic Matter and Litter Quality/ Initial C & N in Litter Pool
136. Mn_InitStruc[Zone] Initial amount of N in structural Litter pool of each zone
mg cm-3 0 – 1 (0) Soil Organic Matter and Litter Quality/ Initial C & N in Litter Pool
137. Mn_NutRatAct[P] Ratio of N to P (N:P) in active organic matter pools
dimensionless 1 – 10 (10) Soil Organic Matter and Litter Quality/ C:N Ratio of Litter Pool
138. Mn_NutRatMetab[P] Ratio of N to P (N:P) in metabolic organic matter pools
dimensionless 1 – 10 (10) Soil Organic Matter and Litter Quality/ C:N Ratio of Litter Pool
139. Mn_InitSlw[Zone] Initial amount of N in slow Litter pool of each zone
mg cm-3 0 – 1 (.000001) Soil Organic Matter and Litter Quality/ Initial C & N in Litter Pool
140. Mn_InitStruc[Zone] Initial amount of N in structural Litter pool of each zone
mg cm-3 0 – 1 (0) Soil Organic Matter and Litter Quality/ Initial C & N in Litter Pool
appendix 4-7 R.qxd 9/27/2004 10:36 AM Page 202

203
No Acronym Definition Dimensions Range of value (Default value)
Input Section (Link location in Excel)
141. Mn_LatFlowFertKm Runoff flow that causes half of the (undissolved) surface fertilizer to move to the next zone
mm (10) Soil Water & Nutrient/ Fertilizer Movement
142. Mn_NutRatAct[P] Ratio of N to P (N:P) in active organic matter pools
dimensionless 1 – 10 (10) Soil Organic Matter and Litter Quality/ C:N Ratio of Litter Pool
143. Mn_NutRatMetab[P] Ratio of N to P (N:P) in metabolic organic matter pools
dimensionless 1 – 10 (10) Soil Organic Matter and Litter Quality/ C:N Ratio of Litter Pool
144. Mn_NutRatPass[P] Ratio of N to P (N:P) in passive organic matter pools
dimensionless 1 – 10 (10) Soil Organic Matter and Litter Quality/ C:N Ratio of Litter Pool
145. Mn_NutRatSlw[P] Ratio of N to P (N:P) in slow organic matter pools
dimensionless 1 – 10 (10) Soil Organic Matter and Litter Quality/ C:N Ratio of Litter Pool
146. Mn_NutRatStruc[P] Ratio of N to P (N:P) in structural organic matter pools
dimensionless 1 – 10 (10) Soil Organic Matter and Litter Quality/ C:N Ratio of Litter Pool
147. Mn2_InitAct[Zone] Initial amount of N in active SOM pool of each zone
mg cm-3 0 – 1 (.2) Soil Organic Matter and Litter Quality/ Initial C & N in SOM Pool
appendix 4-7 R.qxd 9/27/2004 10:36 AM Page 203

204 No Acronym Definition Dimensions Range of value (Default value)
Input Section (Link location in Excel)
148. Mn2_InitMetab[Zone] Initial amount of N in metabolic SOM pool of each zone
mg cm-3 0 – 1 (0) Soil Organic Matter and Litter Quality/ Initial C & N in SOM Pool
149. Mn2_InitPass[Zone] Initial amount of N in passive SOM pool of each zone
mg cm-3 0 – 1 (3.9) Soil Organic Matter and Litter Quality/ Initial C & N in SOM Pool
150. Mn2_InitSlw[Zone] Initial amount of N in slow SOM pool of each zone
mg cm-3 0 – 1 (1) Soil Organic Matter and Litter Quality/ Initial C & N in SOM Pool
151. Mn2_InitStruc[Zone] Initial amount of N in structural SOM pool of each zone
mg cm-3 0 – 1 (0) Soil Organic Matter and Litter Quality/ Initial C & N in SOM Pool
152. N15_Addi [Zone] Initial amount of N15 in soil layer i of each zone
mg cm-3 (0) N15 model sector
153. N_BypassMacroi[Zone] Prefential flows of nutrients in the leachate relative to average concentration * water flow; values < 1 indicates retardation of nutrients due to bypass flow of water in macropores at soil layer i
dimensionless 0 – 2 (1) Soil Water and Nutrient/ Macropore Bypass Flow
154. N_DiffCoef[SiNut] Nitrogen diffusion coefficient cm2 day-1 0 - 1 (N = 1, P = .76896)
Soil Water and Nutrient/ Diffusivity coefficient
155. N_FracNO3i[Zone] Fraction of NO3 of total N in i-th soil layer dimensionless 0 - 1 (0.4) Soil Water and Nutrient/Nitrate Fraction
appendix 4-7 R.qxd 9/27/2004 10:36 AM Page 204

205
No Acronym Definition Dimensions Range of value (Default value)
Input Section (Link location in Excel)
156. N_ImInit[Zone,SiNut] Initial amount of nutrient in immobile pool of each zone
mg cm-3 0 – 0.1 (N = .05, P = .01)
Soil Water and Nutrient/ Initial Immobile Nutrient
157. N_NIniti[Zone,SiNut] Initial amount of nutrient in soil layer i of each zone. N layer 1 = .003, layer 2 – 4 = .01 ; P layer 1 = .1, layer 2 = .08, layer 3 – 4 = .04
mg cm-3 0 – 0.5 (see definition)
For N in Soil Water and Nutrient/Initial Soil Nutrient, For P in (Phosphorus/Initial P availability Index per Zone and Layer)
158. N_KaNH4i[Zone] Apparent (instantaneous) adsorption constant or ratio of amount NH4 adsorbed and amount in solution for i-th layer
mg cm-3 0 – 1 (5) Soil Water and Nutrient/Adsorption constant for N
159. N_KaNO3i[Zone] Apparent (instantaneous) adsorption constant or ratio of amount NO3 adsorbed and amount in solution for i-th layer
mg cm-3
0 – 1 (.3) Soil Water and Nutrient/Adsorption constant for N
160. N_KaPDefi[Zone] Apparent (instantaneous) adsorption constant for inorganic P, or ratio of amount of inorganic P adsorbed ant the amount in soil solution; the adsorption constant depends on the P concentration on soil solution and is read in a tabular form (as graphical input parameter).
mg cm-3 (see N_KaPDefi table)
(Phosphorus/ to P sorption data)
161. N_Lat4InflowRelConc Nutrient concentrations in the incoming sub-surface flows into zone 4, relative to the current average nutrient concentration in that layer across all zones in the simulated area
dimensionless 0 – 10 (1) Agroforestry Zone
162. N_NutMobi[SiNut] Relative rate of transfer from the 'immobile' pool of nutrients to the 'mobile' or sorbed pool, due to processes other than root activity in soil layer i
day-1 0 – 0.02 (0) Soil Nutrient/ Nutrient Mobilization
appendix 4-7 R.qxd 9/27/2004 10:36 AM Page 205

206 No Acronym Definition Dimensions Range of value (Default value)
Input Section (Link location in Excel)
163. N_RtSynloci Root synlocation, or degree to which roots of the crop and tree are co-occurring within the various soil layers, affecting the way in which benefits of rhizosphere modification are shared; 1 = sharing of rhizosphere modifications by all roots present, based on their share in total root length, 0 = complete monopoly by roots modifying the rhizosphere
dimensionless 0 – 1 (.5) Roots and Mycorrhiza
164. N_UseNGassLossEst? A switch determining simulate system with gaseous N losses. 0 = no gaseous N losses, 1 = with gaseous N losses
dimensionless (0) Soil Water & Nutrient
165. P_BurnLab Amount of labour involved in burning the field per unit simulated filed
person days ha-1
(see excel sheet Profitability)
(Profitability)
166. P_CfertPrice[SiNut,Price] Cost of fertilizer at social and private prices, respectively.
currency unit kg-1
(see excel sheet Profitability)
(Profitability)
167. P_CHarvLab[Cr] Amount of labour involved in harvesting crop products per unit dry weight
person days Mg-1 per cropping season
(see excel sheet Crop Library)
(Crop Library/ Profitability)
168. P_CPestContLab[Cr] Amount of labour involved in pest control per cropping season
person days ha-1 per cropping season
(see excel sheet Crop Library)
(Crop Library/ Profitability)
169. P_CpestContPrice[Price] Amount of direct costs (outside labour) involved in pest control per cropping season
currency unit per ha-1 per cropping season
(see excel sheet Profitability)
(Profitability)
170. P_CPlantLab[Cr] Amount of labour involved in planting per cropping season
person days ha-1 per cropping season
(see excel sheet Crop Library)
(Crop Library/ Profitability)
171. P_CropProfThreshold Threshold value for crop profitability. Relevan to parameter P_UseCropStopRule? = 1
Currency unit (100000) Management/ Ending a Crop Cycle
appendix 4-7 R.qxd 9/27/2004 10:36 AM Page 206

207
No Acronym Definition Dimensions Range of value (Default value)
Input Section (Link location in Excel)
172. P_CSeedPrice[Cr,Price] Cost of crop seed per kg at social and private prices, respectively.
currency unit kg-1
(see excel sheet Crop Library)
(Crop Library/ Profitability)
173. P_CWeedLab[Cr] Amount of labour involved in weeding per cropping season
person days ha-1 per cropping season
(see excel sheet Crop Library)
(Crop Library/ Profitability)
174. P_CyieldPrice[Cr, Price] Price of crop yield per unit dry weight at social and private prices, respectively.
currency unit kg-1
(see excel sheet Crop Library)
(Crop Library/ Profitability)
175. P_DiscountRate Discount rate (% per year) that applies to both social and private prices
% year-1 (see excel sheet Profitability)
(Profitability)
176. P_ExtOrgPrice [Type,Price]
Price of external organic input currency unit kg-1
(see excel sheet Profitability)
(Profitability)
177. P_FenceMatCost [Price]
Price of off-farm material used for building or maintaining a fence around the field
currency unit ha-1
(see excel sheet Profitability)
(Profitability)
178. P_TFruitHarvLab Amount of labour involved in harvesting fruits per unit dry weight
person days kg-1 (see excel sheet Tree Library)
(Tree Library/ Profitability)
179. P_TFruitPrice[Price] Price of tree fruit yield per unit dry weight at social and private prices, respectively.
currency unit kg-1
(see excel sheet Tree Library)
(Tree Library/ Profitability)
180. P_TLatexHarvLab Amount of labour involved in harvesting latex per unit dry weight
person days kg-1 (see excel sheet Tree Library)
(Tree Library/ Profitability)
181. P_TLatexPrice[Price] Price of tree latex yield per unit dry weight at social and private prices, respectively.
currency unit kg-1
(see excel sheet Tree Library)
(Tree Library/ Profitability)
182. P_TPlantLab Amount of labour involved in planting trees per unit dry weight
person days kg-1
(see excel sheet Tree Library)
(Tree Library/ Profitability)
183. P_TPrunLab[Tree] Amount of labour involved in pruning trees per unit dry weight
person days kg-1
(see excel sheet Tree Library)
(Tree Library/ Profitability)
appendix 4-7 R.qxd 9/27/2004 10:36 AM Page 207

208 No Acronym Definition Dimensions Range of value (Default value)
Input Section (Link location in Excel)
184. P_TPrunPrice[Price] Price of tree prunings harvested from the field per unit dry weight at social and private prices, respectively.
currency unit kg-1
(see excel sheet Tree Library)
(Tree Library/ Profitability)
185. P_TSeedPrice[Price] Costs of tree planting material per unit initial tree biomass at social and private prices, respectively.
currency unit tree-1
(see excel sheet Tree Library)
(Tree Library/ Profitability)
186. P_TWoodHarvLab Amount of labour involved in harvesting wood products per unit dry weight
person days kg=1
(see excel sheet Tree Library)
(Tree Library/ Profitability)
187. P_TWoodPrice[Price] Price of tree wood product yield per unit dry weight at social and private prices, respectively.
currency unit kg-1
(see excel sheet Tree Library)
(Tree Library/ Profitability)
188. P_UnitLabCost[Price] Cost per unit labour at social and private prices, respectively
currency unit person days-1
(see excel sheet Profitability)
(Profitability)
189. PD_CeatenBy[Cr,Animals] Fraction of crop component lost if eaten by animals. Default animals are pigs, monkey, locust, nematode, goat, buffalo and birds
dimensionless 0 – 1 (0) (Crop Library/ Sensitivity to Pest Damage)
190. P_UseCropStopRule? A switch determining the simulation will continue to growth crop or not when the previous crop profitability lower than the threshold value. 0 means continue to growth crop, 1 = stop to growth crop
dimensionless (0) Management/ Ending a Crop Cycle
191. PD_CFrugivore? [Animals]
A switch determining the presence of attack by each default animal. 0 = animals is not a crop frugivore,1 = animal is frugivore
dimensionless 0 or 1 (0) Pest and Disease
192. PD_CFrugivory[Cr] Constant daily fraction of crop fruit biomass removed due to the action of frugivores
dimensionless 0 – 1 (0) Pest and Diseases
193. PD_CHerbivore? [Animals]
A switch determining the presence of attack by each default animal. 0 = animals is not a crop herbivore,1 = animal is herbivore
dimensionless 0 or 1 (0) Pest and Disease
appendix 4-7 R.qxd 9/27/2004 10:36 AM Page 208

209
No Acronym Definition Dimensions Range of value (Default value)
Input Section (Link location in Excel)
194. PD_CHerbivore? [Animals]
A switch determining the presence of attack by each default animal. 0 = animals is not a crop herbivore,1 = animal is herbivore
dimensionless 0 or 1 (0) Pest and Disease
195. PD_CHerbivory[Cr] Constant daily fraction of crop leaf biomass removed due to the action of herbivores
dimensionless 0 – 1 (0) Pest and Diseases
196. PD_CRhizovore? [Animals]
A switch determining the presence of attack by each default animal. 0 = animals is not a crop rhizovore,1 = animal is rhizovore
dimensionless 0 or 1 (0) Pest and Disease
197. PD_CRhizovory[Cr] Constant daily fraction of crop root biomass removed due to the action of rhizovores
dimensionless 0 – 1 (0) Pest and Diseases
198. PD_FenceBuildDOY Schedule for day of fencing for each fencing event. A graphical input.
julian days (see PD_FenceBuild DOY graph)
Pest and Disease
199. PD_FenceBuildLab Amount of labour needed to build fence for each fencing event. A graphical input.
person days (see PD_FenceBuild Lab graph)
Pest and Disease
200. PD_FenceBuildY Schedule for year of fencing for each fencing event A graphical input.
dimensionless (see PD_FenceBuildY graph)
Pest and Disease
201. PD_FenceDecK Daily fractional decay of fence quality day-1 0 – 1 (.02) Pest and Diseases
202. PD_FenceFullQua Maximum quality of fence dimensionless 1 – 4 (2) Pest and Diseases
203. PD_FenceMaint? Switch determining fence maintenance. 1 = fence maintenance will be done automatically, 0 = no fence maintenance
dimensionless 0 or 1 (0) Pest and Disease
204. PD_FenceMUnit Unit improvement of fence quality once it falls below the threshold set in PD_FenceQThresh
dimensionless 0 – 2 (.25) Pest and Disease
appendix 4-7 R.qxd 9/27/2004 10:36 AM Page 209

210 No Acronym Definition Dimensions Range of value (Default value)
Input Section (Link location in Excel)
205. PD_FenceQThresh Threshold of (relative) fence quality below which labour will be used to repair the fence
dimensionless 0 – 2 (1.1) Pests and Disease
206. PD_HalfFenceTime Time constant of decay of fence quality: time interval after which quality is reduced by 50%
days 0 – 365 (50) Pest and Disease
207. PD_JumptheFence? [animals]
The degree to which animals are deterred by a fence from entering the plot
- 0 – 1 (0) Pest and Diseases
208. PD_PopDensOutside [animals]
Population density outside the plot, influencing the presence
- 0 or 1 Pest and Diseases
209. PD_TEatenBy?[Animals] A switch determining tree attacks by specific animals. Default animals are pigs, monkey, locust, nematode, goat, buffalo and birds. 0 = no attack, 1 = attacked
0 or 1 (0) 0 – 1 (0) (Tree parameters/ Pest Impacts)
210. PD_TFrugivore?[Animals] A switch determining the presence of attack by each default animal. 0 = animals is not a tree frugivore,1 = animal is frugivore
dimensionless 0 or 1 (0) Pest and Disease
211. PD_Tfrugivory&Abort[Tree] Constant daily fraction of tree fruit biomass removed due to the action of frugivores
- 0 – 1 (0) Pest and Diseases
212. PD_THerbivore?[Animals] A switch determining the presence of attack by each default animal. 0 = animals is not a tree herbivore,1 = animal is herbivore
dimensionless 0 or 1 (0) Pest and Disease
213. PD_THerbivory[Tree] Constant daily fraction of tree leaf biomass removed due to the action of herbivores
- 0 – 1 (0) Pest and Diseases
214. PD_TLignivory[Tree] Constant daily fraction of tree woody stem biomass removed due to the action of lignivores
- 0 – 1 (0) Pest and Diseases
215. PD_TLignovore?[Animals] A switch determining the presence of attack by each default animal. 0 = animals is not a tree lignovore,1 = animal is lignovore
dimensionless 0 or 1 (0) Pest and Disease
appendix 4-7 R.qxd 9/27/2004 10:36 AM Page 210
211
No Acronym Definition Dimensions Range of value (Default value)
Input Section (Link location in Excel)
215. PD_TRhizovore?[Animals] A switch determining the presence of attack by each default animal. 0 = animals is not a tree rhizovore, 1 = animal is rhizovore
dimensionless 0 or 1 (0) Pest and Disease
216. PD_TRhizovory[Tree] Constant daily fraction of tree root biomass removed due to the action of rhizovores
- 0 – 1 (0) Pest and Diseases
217. Rain_AType A number 1, 2 or 3 to decide rainfall rate (1= rainfall rate follows precipitation data from external file, rainfall rate follows tabulated data, 2 = rainfall rate follows random generator, 3= rainfall rate follows tabulated monthly total data)
dimensionless 1, 2 or 3 (1) Rainfall
218. Rain_BoundHeaLi Boundary value between heavy and light rain (only for Rain_AType=1)
mm 20 – 30 (25) Rainfall
219. Rain_CoeffVar2 Coefficient variation of rainfall in mm, used in rainfall generated randomly (Rain_Atype=2)
dimensionless 0 – 1 (.05) Rainfall
220. Rain_CoeffVar3 Coefficient variation of rainfall in mm, rainfall based on tabulated monthly rainfall (Rain_Atype=3)
dimensionless 0 – 1 (.05) Rainfall
221. Rain_Cycle? Parameter governing ways to read rainfall data. Corresponds to Rain_AType=1 (0 = use multiple year rainfall data, 1 = use 1 year data in cycle/continuously)
dimensionless 0 or 1 (1) Rainfall
222. Rain_Data Actual daily rainfall data. Entered as graphical function or read from WaNuLCAS.XLS (Stella non-CRT users only). Corresponds to Rain_AType=1.
mm (see table in excel sheet weather)
(WEATHER)
223. Rain_DayP Probability of raining each day as a function of Julian day scaled monthly. Corresponds to Rain_AType=2 and 3.
dimensionless 0 – 1 (.32) Rainfall
appendix 4-7 R.qxd 9/27/2004 10:36 AM Page 211
212 No Acronym Definition Dimensions Range of value (Default value)
Input Section (Link location in Excel)
224. Rain_GenSeed Seed Random Generator. For Rain_AType=2 and 3.
dimensionless 1 – 32767 (300) Rainfall
225. Rain_Heavy Average precipitation rate of on a heavy rain day; for Rain_AType=2.
mm day-1 0 – 100 (42) Rainfall
226. Rain_HeavyP Probability of heavy rain; for Rain_AType=2. dimensionless 0 – 1 (.5) Rainfall
227. Rain_IntensCoefVar
Coeficient variance of rain intensity. Rain intensity is a factor affecting water infiltration. It is assumes to follow normal distribution with an average of Rain_IntensMean and standard deviation Rain_IntensMean*Rain_IntensCoefVar
dimensionless
(.3)
Rainfall
228. Rain_IntensMean Average rain intensity per hour. Rain intensity is a factor affecting water infiltration. It is assumes to follow normal distribution with an average of Rain_IntensMean and standard deviation Rain_IntensMean*Rain_IntensCoefVar
mm hr-1
(50)
Rainfall
229. Rain_IntercDripRt The rate of water dripping from water on interception surface
mm hr-1 (10)
Rainfall
230. Rain_IntMult Indicates the maximum temporary storage of water on interception surfaces
dimensionless (3) Rainfall
231. Rain_Light Average precipitation rate of a light rain day day; for Rain_AType=2.
mm day-1 0 – 40 (9) Rainfall
232. Rain_MaxIntDripDur Maximum value of water interception delay before start to dripping
mm hr-1 (.5) Rainfall
appendix 4-7 R.qxd 9/27/2004 10:36 AM Page 212
213
No Acronym Definition Dimensions Range of value (Default value)
Input Section (Link location in Excel)
233. Rain_MonthTot Tabulated data of monthly rainfall; for Rain_AType=3. Entered as graphical function or read from WaNuLCAS.XLS (Stella non-CRT users only).
mm month-1 (see Rain_MonthTot graph)
Rainfall
234. Rain_Multiplier Multiplier of rainfall for quick modifications of rainfall amount
dimensionless 0 – 4 (1) RUN & OUTPUT SECTION
235. Rain_PondFlwRt The rate at which water ponding on the surface will actually flow to a neighbouring zone or plot
mm hr-1 per m of zone width
(10) Rainfall
236. Rain_PondStoreCp The storage capacity of water ponding on the surface
mm (5) Rainfall
237. Rain_Weight[Zone] Input weight value to decide amount of rain falling on each zone relative to other zones (eg. equal rainfall in each zone on area basis means 1:1:1:1)
dimensionless 0 – 10 (1) Rainfall
238. Rain_YearStart Initial year based on rainfall data at which simulation starts
dimensionless any integer value (0)
Rainfall
239. Rt_ACType Parameter governing type of root density data for crop. 0=Lrv data available, 1=Lrv calculated using exponential function model where length root area is constant, 2= Lrv calculated using exponential function model where length root area is derived from root biomass
dimensionless 0, 1, or 2 (0) Roots and Mycorrhiza/ Crop Root
240. Rt_ATType Parameter governing type of root density data for tree. 0=Lrv data available, 1=Lrv is constant calculated using ellipticall function model, 2= Lrv is calculated using elliptical function but dynamically changes according to water or N stress
dimensionless 0, 1 or 2 (0) Roots and Mycorrhiza/ Tree Root
appendix 4-7 R.qxd 9/27/2004 10:36 AM Page 213

214 No Acronym Definition Dimensions Range of value (Default value)
Input Section (Link location in Excel)
241. Rt_CDecDepth[Cr] Parameter governing decrease of crop root with depth; corresponds to Rt_ACType=1 and Cq_AType.
m-1 0 - 10 (7) (Crop Library/Roots)
242. Rt_CDistResp[Cr]
Responsiveness of crop root distribution to the depth at which uptake of the currently limiting resource (water, N or P) is most successful. Value 0 = no response to stress, 0 – 1 = mild response, 1 = proportional change to inverse of relative depth of uptake, > 1 = strong response. Only for Rt_ACType = 2.
dimensionless 0 – 3 (1) (Crop Library/Roots)
243. Rt_CHalfLife[Cr] Crop root half-life (only for Rt_ACType=2) days 30 – 100 (50) (Crop Library/Roots)
244. Rt_CLraConst[Cr] Total root length per unit area. It is used to calculate crop root density in exponential decrease model (Rt_ACType=1). Also corresponds to Cq_AType.
cm cm-2 0 – 150 (100) (Crop Library/Roots)
245. Rt_CLrvmi[Cr] Maximum crop root length density in i-th soil layer; corresponds to Rt_ACType=0 and Cq_A Type.
cm cm-3 0 – 15 (layer 1 = 5, layer 2 = 3, layer 3 = .3, layer 4 = 0)
(Crop Library/Roots)
246. Rt_CMultiplier Multiplier of root for quick modifications of crop root length density
dimensioless (1) Root and Mycorrhiza
247. Rt_CSRL[Cr] Specific root length (length per unit dry weight) of crop roots
m g-1 50 – 100(200) (Crop Library/Roots)
248. Rt_MCHypDiam Diameter of crop mycorrhizal hyphae cm 0.001 – 0.05 (.01)
Roots & Mycorrhiza/ Mycorrhiza
249. Rt_MCHypL Length of crop mycorrhizal hyphae per unit infected root length
dimensionless 10 – 100 (100) Roots & Mycorrhiza/ Mycorrhiza
appendix 4-7 R.qxd 9/27/2004 10:36 AM Page 214

215
No Acronym Definition Dimensions Range of value (Default value)
Input Section (Link location in Excel)
250. Rt_MCInfFraci Fraction of crop roots that is mycorrhizal (infected) in i-th soil layer. Layer 1 =.05, layer 2 =.25, layer 3 = .05, layer 4 = 0
dimensionless 0 – 1 (see definition)
Roots & Mycorrhiza/ Mycorrhiza
251. Rt_MTHypDiam Diameter of tree mycorrhizal hyphae cm 0.001 – 0.05 (.01)
Roots & Mycorrhiza/ Mycorrhiza
252. Rt_MTHypL Length of tree mycorrhizal hyphae per unit infected root length
dimensionless 10 – 100 (100) Roots & Mycorrhiza/ Mycorrhiza
253. Rt_MTInfFraci[Zone] Fraction of tree roots that is mycorrhizaal (infected)
dimensionless 0 – 1 (0) Roots & Mycorrhiza/ Mycorrhiza
254. Rt_TAlloc[Tree] Fraction of tree growth reserves allocated to roots in the absence of water or nutrient stress (only for Rt_ATType=2)
dimensionless 0 – 1 (.1) (Tree Library/Roots)
255. Rt_TAllocResp[Tree] Responsiveness of tree root allocation to stress factors; 0 = constant root allocation, 1 = linear response to water and nitrogen stress, >1 more-than-proportional response (only for Rt_ACType = 2),
dimensionless 0 – 2 (2) (Tree Library/Roots)
256. Rt_TDecDepthC[Tree] Parameter governing decrease of tree root with depth ; for Rt_ATType=1
m-1 0 – 10 (3) (Tree Library/Roots)
257. Rt_TDistResp[Tree] Responsiveness of crop root distribution to the depth at which uptake of the currently limiting resource (water, N or P) is most successful. Value 0 = no response to stress, 0 – 1 = mild response, 1 = proportional change to inverse of relative depth of uptake, > 1 = strong response. Only for Rt_ACType = 2.
dimensionless 0 – 5 (2) (Tree Library/Roots)
appendix 4-7 R.qxd 9/27/2004 10:36 AM Page 215

216 No Acronym Definition Dimensions Range of value (Default value)
Input Section (Link location in Excel)
258. Rt_TDistShapeC[Tree] Tree root distribution shape for Rt_ATType=1 and 2; for a value of 1 root length density decreases as much with horizontal as with vertical distance to the tree stem
dimensionless 0 – 2 (.05) (Tree Library/Roots)
259. Rt_THalfLife[Tree] Tree root half life (only for Rt_ATType=2) days 30 – 150 (60) (Tree Library/Roots)
260. Rt_THostEffForT1[Tree] An option for simulation root parasitism tree 1 on others tree root
dimensionless (0) Root Parasitism
261. Rt_TLengDiam1[Tree] Length of (branch) roots of a tree root with a proximal (at stem base) diameter of 1 cm; Intercept (a) of allometric equation (RootLength = a StemDiameterb). Calculation from Functional Branch Analysis (FBA). Input needed to run FBA refer to tree parameterization
cm 0.01 – 1 (10) (Tree Library/Roots)
262. Rt_TLengDiamSlope [Tree]
Power coefficient (b) of allometric equation (RootLength = a StemDiameterb). Calculation from Functional Branch Analysis (FBA). Input needed to run FBA refer to tree parameterization
dimensionless 1 – 3 (1.5) (Tree Library/Roots)
263. Rt_TLraX0[Tree] Total root length per unit area at X(distance to tree)=0 (tree stem). for Rt_ATType=1
cm 0 – 150 (1) (Tree Library/Roots)
264. Rt_TLrvDatai[Zone,Tree] Tree root density in soil layer i in each zone; for Rt_ATType=0
cm cm-2 0 – 15 (see excel sheet Tree Library/ Roots)
(Tree Library/Roots)
265. Rt_TMultiplier Multiplier of root for quick modifications of tree root length density
dimensioless (1) Root and Mycorrhiza
appendix 4-7 R.qxd 9/27/2004 10:36 AM Page 216

217
No Acronym Definition Dimensions Range of value (Default value)
Input Section (Link location in Excel)
266. Rt_TProxGini Distribution coefficient of proximal root diameters (CumFreq = (Diam/Diammax)TProxGini of a tree, used in calculation of the specific root length of a tree root system
dimensionless 0.001 – 10 (.3) (Tree Library/Roots)
267. Rt_TWghtDiam1[Tree] Biomass of a (branched) tree root with a proximal (at stem base) diameter of 1 cm; Intercept (a) of allometric equation (Root weight = a StemDiameterb). Calculation from Functional Branch Analysis (FBA). Input needed to run FBA refer to tree parameterization
kg 0.01 – 1 (.5) (Tree Library/Roots)
268. Rt_TWghtDiamSlope [Tree]
Power coefficient (b) of allometric equation (RootWeight = a StemDiameterb). Calculation from Functional Branch Analysis (FBA). Input needed to run FBA refer to tree parameterization
dimensionless 1 – 3 (2.3) (Tree Library/Roots)
269. S&B_2ndFireafterPileup Number of days between puile up and secondary burn event
days 1 – 100 (5) Management/ Slash and Burn
270. S&B_CritMoist Limit value for internal + adhering (intercepted from rainfall) moisture content of slashed necromass; below this value necromass is categorized as dry and fire can take place
l kg-1 0 – 1(.05) Management/ Slash and Burn
271. S&B_DeadWoodFuelFact Temperature of the fire per unit dry weight of fuel in dead wood
oC kg-1 0 – 100 (.1) Management/ Slash and Burn
272. S&B_FirImpPSorption Fire impacts on P sorption, as a function of soil surface temperature increase
dimensionless (see table in excel sheet Slash& Burn)
Management/ Slash and Burn
appendix 4-7 R.qxd 9/27/2004 10:36 AM Page 217

218 No Acronym Definition Dimensions Range of value (Default value)
Input Section (Link location in Excel)
273. S&B_FirIndPMobiliz Fire impact on mobilization fraction of P from the inorganic P immobile pool, as a function of soil surface temperature increase
dimensionless (see table in excel sheet Slash& Burn)
Management/ Slash and Burn
274. S&B_FirMortSeedBank Fractional mortality in the weed seed bank as a function of soil surface temperature increment
dimensionless (see table in excel sheet Slash& Burn)
Management/ Slash and Burn
275. S&B_FuelLoadFactor Temperature of the fire per unit dry weight of fuel in slashed necromass and structural surface litter
oC kg-1 0 – 100 (10) Management/ Slash and Burn
276. S&B_MaxDryingPer The latest time after slashing when fire can occur; if the fuel does not get dry enough before this time, no fire will be occur
days 1 – 200 (30) Management/ Slash and Burn
277. S&B_MinDryingPer The earliest time after slashing that fire can occur
days 0 – 100 (20) Management/ Slash and Burn
278. S&B_NecroBurnFrac Fraction of surface necromass burnt as a function of fire temperature at the soil surface.
dimensionless (see table in excel sheet Slash& Burn)
Management/ Slash and Burn
279. S&B_NutVolatFracN Volatilization fraction of N in the burnt necromass, as a function of soil surface temperature increment
dimensionless (see table in excel sheet Slash& Burn)
(Slash&Burn)
280. S&B_NutVolatFracP Volatilization fraction of P in the burnt necromass, as function of soil surface temperature increment
dimensionless (see table in excel sheet Slash& Burn)
(Slash & Burn)
appendix 4-7 R.qxd 9/27/2004 10:36 AM Page 218

219
No Acronym Definition Dimensions Range of value (Default value)
Input Section (Link location in Excel)
281. S&B_pHRecFrac Daily recovery fraction of soil pH in the topsoil from its post-fire towards its pre-fire value
fraction 0.001–0.1 (.01) Management/ Slash and Burn
282. S&B_PSorpRecFrac Daily recovery fraction of the P_sorption in the topsoil from its post-fire towards its pre-fire value
fraction 0.001–0.1 (.01) Management/ Slash and Burn
283. S&B_ScorchWRemFra Fraction of scorched wood removed after slash and burn event
fraction 0 – 1 (.3) Management/ Slash and Burn
284. S&B_SlashDOY A graphical input tabulating day of year at which slashing is performed
julian days (see S&B_SlashDOY graph)
Management/ Slash and Burn
285. S&B_SlashYear A graphical input tabulating year at which slashing is performed
dimensionless any integer value (100)
Management/ Slash and Burn
286. S&B_SOMBurnFrac Fraction of all SOM pools in the topsoil (Layer 1) respired (C) or mineralized (N & P) as a function of soil surface temperature increment
dimensionless (see table in excel sheet Slash&Burn)
Management/ Slash and Burn
287. S&B_SurfLitBurnFrac Fraction of all surface litter respired (C) or mineralized (N & P) as a function of soil surface temperature increment
dimensionless (see table in excel sheet Slash&Burn)
Management/ Slash and Burn
288. S&B_TimetoPileUp Number of days between primary burn and pile up (redictribnution across the zones) for a secondary burn
days 1 – 100 (15) Management/ Slash and Burn
289. S&B_TimetoWoodRem Number of days between primary burn and removal of scorched wood
days 1 – 50 (10) Management/ Slash and Burn
290. S&B_TTempTol[Tree] Maximum fire temperature that a tree can tolerate. Temperature above the value will induce tree mortality
oC 40 – 90 (75) (Tree Library/ Slash&Burn)
291. S&B_WatRetRecFrac Daily recovery fraction of soil water retention in the topsoil from its post-fire towards its pre-fire value
fraction 0.001 – 0.1 (0.005)
Management/ Slash and Burn
appendix 4-7 R.qxd 9/27/2004 10:36 AM Page 219

220 No Acronym Definition Dimensions Range of value (Default value)
Input Section (Link location in Excel)
292. S&B_WetnessTempImp Fractional reduction in fire temperature per unit of moisture content of the fuel
fraction 0 – 1 (.5) Management/ Slash and Burn
293. S_C_RtStrucFormFrac Fraction of contribution of crop root decay on root channels
fraction per m (.1) Soil Structure
294. S_KSatDefVi Saturated hydraulic conductivity of the soil in the absence of macropore structure, as derived from texture-based pedotransfer functions. Read and calculation from WaNuLCAS.XLS. Input needed to run pedotranfer refer to the sheet pedotranfer. Layer 1 = 319, layer 2 = 54, layer 3 = 45, layer 4 = 40
cm day-1 1 – 500 (see definition)
(Soil Hydraulic)
295. S_KsatHperVi Ratio of saturated hydraulic conductivity in horizontal and vertical direction for layer i
dimensionless 0 – 5 (1) Soil Structure/ K Sat ratio
296. S_KSatInitVi[Zone] Saturated hydraulic conductivity of the soil at the macropore structure existing at the start of the simulation. Read and calculation from WANULCAS.XLS. Input needed to run pedotranfer refer to the sheet pedotranfer. Layer 1 = 319, layer 2 = 54, layer 3 = 45, layer 4 = 40
cm day-1 1 – 500 (see definition)
(Soil Hydraulic)
297. S_KSatVDeepSub Saturated hydraulic conductivity of the soil below layer 4, determining the rate of vertical drainage from the soil column
cm day-1 1 – 100 (20) Soil Structure
298. S_BDBDRefDecay Relative rate of decay of the bulk density, returning the surface infiltration rate toward S_SurfInfiltrPerKsatDef and the saturated hydraulic conductivity towards S_KSatDefV
day-1 0 – 0.1 (.001) Soil Structure
299. S_RelWormLiti Relative impact of 'worms' (soil fauna) on increase of saturated hydraulic conductivity in each layer
dimensionless 0 – 1 (1, 0.6, 0.3, 0.1)
Soil Structure
appendix 4-7 R.qxd 9/27/2004 10:36 AM Page 220
221
No Acronym Definition Dimensions Range of value (Default value)
Input Section (Link location in Excel)
300. S_RelWormSurf Relative impact of 'worms' (soil fauna) increase of infiltration rate of the soil surface
dimensionless 0 – 1 (1) Soil Structure
301. S_SoilStructDyn? Switch determining dynamics of soil structure (0 = false, 1 = true) based on decay and re-creation of macropores by soil fauna above the texture-based default values
day-1 0 or 1 (0) Soil Structure
302. S_SurfInfiltrPerKsatDef [Zone]
Ratio of surface infiltration and Ksat for the first soil layer in the default condition of the soil as defined by the pedotransfer function
mm day1 25 – 10000 (25) Soil Structure
303. S_RelSurfInfiltrInit[Zone] Surface infiltration rate at the start of the simulation relative to its default value
mm day1 100 – 10000 (1000)
Soil Structure
304. S_T_RtStrucFormFrac Fraction of contribution of tree root decay on root channels
fraction per m (.3) Soil Structure
305. S_WormsLikeLitMetab Activity (in arbitrary units) of soil fauna (“worms'') per unit of organic inputs in the litter metabolic pool
m2 kg-1 0.00001 – 0.1 (.00001)
Soil Structure
306. S_WormsLikeLitStruc Activity (in arbitrary units) of soil fauna (“worms'') per unit of organic inputs in the litter structural pool
m2 kg-1 0.0000005 – 0.1 (.0000005)
Soil Structure
307. S_WormsLikeSOMMetab Activity (in arbitrary units) of soil fauna (“worms'') per unit of organic inputs in the SOM metabolic pool
m2 kg-1 0.000001 – 0.1 (.000001)
Soil Structure
308. S_WormsLikeSOMStruc Activity (in arbitrary units) of soil fauna (“worms'') per unit of organic inputs in the SOM structural pool
m2 kg-1 0.00000005 – 0.1 (.00000005)
Soil Structure
309. T_ApplyFBA?[Tree] Switch (1 = yes, 0 = no) to determine whether the allocation of biomass from the canopy to the wood (branches + stem) pools is governed by the fractal branching parameters (allometric equations).
dimensionless 0 or 1 (1) Tree Parameters
appendix 4-7 R.qxd 9/27/2004 10:36 AM Page 221

222 No Acronym Definition Dimensions Range of value (Default value)
Input Section (Link location in Excel)
310. T_ApplyPalm?[Tree] Switch (1 = yes, 0 = no) to determine whether the allocation of biomass to storage pool follows oil palm rule.
dimensionless 0 or 1 (0) (Tree Library/Fruit)
311. T_CanBiomInit[Tree] Initial amount of biomass in tree canopy (leaf and small stems)
kg m-2 0 – 1 (0) Tree parameters
312. T_CanHMax[Tree] Maximum height of tree canopy m 0 – 15 (8.2) (Tree Library/ Canopy)
313. T_CanShape[Tree] Factor determining in which part of the tree leaves are concentrated. A value of 1 gives an even spread of tree leaves over the alley, a higher value (eg 2) concentrates tree leaves above the hedgerow
dimensionless 0 – 2 (.567) (Tree Library/ Canopy)
314. T_CanWidthMax[Tree] Maximum tree canopy width, half the canopy width (radius).
m 0 – 10 (4.655) (Tree Library/ Canopy)
315. T_ConcFruit[SiNut,Tree] Nutrient concentration in fruit component dimensionless 0 – 0.1 (N = .02, P = .002)
(Tree Library/ N-P concentration)
316. T_ConcGroRes [SiNut,Tree]
Nutrient concentration in carbohydrate reserves
dimensionless 0 – 0.1 (N = .01, P = .0005)
(Tree Library/ N-P concentration)
317. T_ConcLf[SiNut,Tree] N concentration in leaf component of tree dimensionless 0 – 0.1 (N = .0173, P = .0009)
(Tree Library/ N-P concentration)
318. T_ConcRt[SiNut,Tree] Nutrient concentration in tree roots (only for Rt_ATType=2)
dimensionless 0 – 0.1 (N = .0122, P = .0006)
(Tree Library/ N-P concentration)
319. T_ConcTwig[SiNut,Tree] Nutrient concentration in twig component of tree
dimensionless 0 – 0.1 (N = .00073, P = .0016
(Tree Library/ N-P concentration)
appendix 4-7 R.qxd 9/27/2004 10:36 AM Page 222

223
No Acronym Definition Dimensions Range of value (Default value)
Input Section (Link location in Excel)
320. T_ConcWood [SiNut,Tree]
Nutrient concentration in wood component of tree
dimensionless 0 – 0.1 (N = .0047, P = .0008)
(Tree Library/ N-P concentration)
321. T_DiamBiom1[Tree] Biomass of a tree of diameter 1 cm; Intercept (a) of allometric equation (Branch biomass = a StemDiameterb). Calculation from Functional Branch Analysis (FBA). Input needed to run FBA refer to tree parameterization
kg 0.01 – 1 (.6513) (Tree Library/ Allometric branching)
322. T_DiamBranch1[Tree]
Intercept (a) of allometric equation (Tree branch biomass = a Diameterb). Calculation from Functional Branch Analysis (FBA). Input needed to run FBA refer to tree parameterization
kg 0.01 – 1 (.0334) (Tree Library/ Allometric branching)
323. T_DiamCumLit1[Tree] Cumulative litterfall expected for a stem diameter of 1 cm. Calculation from Functional Branch Analysis (FBA). Input needed to run FBA refer to tree parameterization
kg 0.01 – 1 (.0302) (Tree Library/ Allometric branching)
324. T_DiamLfTwig1[Tree] Intercept (a) of allometric equation (Leaf &Twigbiomass = a StemDiameterb). Calculation from Functional Branch Analysis (FBA). Input needed to run FBA refer to tree parameterization
kg 0.01 – 1 (.9656) (Tree Library/ Allometric branching)
325. T_DiamSlopeBiom[Tree] Power coefficient (b) of allometric equation (Branch biomass = a StemDiameterb). Calculation from Functional Branch Analysis (FBA). Input needed to run FBA refer to tree parameterization
cm-1 0 – 3 (2.0937) (Tree Library/ Allometric branching)
326. T_DiamSlopeBranch [Tree]
Power coefficient (b) of allometric equation (Tree branch biomass = a Diameterb). Calculation from Functional Branch Analysis (FBA). Input needed to run FBA refer to tree parameterization
cm-1 0 – 3 (2.4195) (Tree Library/ Allometric branching)
appendix 4-7 R.qxd 9/27/2004 10:36 AM Page 223

224 No Acronym Definition Dimensions Range of value (Default value)
Input Section (Link location in Excel)
327. T_DiamSlopeCumLit [Tree]
Power coefficient (b) of the alloemtric equation describing the increase of cumulative litterfall with stem diameter. Calculation from Functional Branch Analysis (FBA). Input needed to run FBA refer to tree parameterization
cm-1 0 – 3 (3.0937) (Tree Library/ Allometric branching)
328. T_DiamSlopeLfTwig [Tree]
Power coefficient (b) of allometric equation (Leaf&Twig biomass = a StemDiameterb). Calculation from Functional Branch Analysis (FBA). Input needed to run FBA refer to tree parameterization
dimensionless 1 – 3 (1.7270) (Tree Library/ Allometric branching)
329. T_DiamTreshHarv[Tree] Tree diameter of timber harvested cm 100 Management/ Timber Harvesting
330. T_DOY 1 LfFlush[Tree] Day of the first cycle of leaf flush julian days 1 – 365 (1) Tree parameters/ Tree leaf phenology)
331. T_DOY 2 LfFlush[Tree] Day of the second cycle of leaf flush julian days 1 – 365 (400) Tree parameters/ Tree leaf phenology
332. T_DOY SeaLitFall1Start [Tree]
Day when the first season of leaf starts dropdown
julian days 1 – 365 (400) Tree parameters/ Tree leaf phenology
333. T_DOY SeaLitFall2Start [Tree]
Day when the second season of leaf starts dropdown
julian days 1 – 365 (400) Tree parameters/ Tree leaf phenology
334. T_DOY_Compl1LfFall [Tree]
Day when the first season of leaf completely dropdown
julian days 1 – 365 (400) Tree parameters/ Tree leaf phenology
335. T_DOY_Compl2LfFall [Tree]
Day when the second season of leaf completely dropdown
julian days 1 – 365 (400) Tree parameters/ Tree leaf phenology
336. T_DOYFlwBeg[Tree] The earliest day in a year when tree start to flowers
julian days 1 - 365 (200) (Tree Library/ Growth stage)
appendix 4-7 R.qxd 9/27/2004 10:36 AM Page 224

225
No Acronym Definition Dimensions Range of value (Default value)
Input Section (Link location in Excel)
337. T_DOYFlwEnd[Tree] The latest day in a year when tree start to flowers
julian days 1 - 365 (250) (Tree Library/ Growth stage)
338. T_FracSeaLitFall1[Tree] Fraction of tree canopy become litterfall dimensionless 0 – 1 (1) (Tree parameter/ Tree leaf phenology)
339. T_FruitAllocMax[Tree] Allocation of biomass to fruit each day kg m-2 day-1 0 – 1 (0) (Tree Library/Fruit)
340. T_FruitAllocStage[Tree] Graphical input parameter as a function of tree stage that determine how much fruit will produce from maximum fruit allocation
dimensionless 0 – 1 (see T_FruitAllocStage graph)
Management/ Fruit Harvesting
341. T_FruitHarvFrac[Tree] Harvest index for fruit. Constant value for every fruiting season
dimensionless 0 – 1 (0) Management/ Fruit Harvesting
342. T_FruitMoistFrac[Tree] Standard moisture content for expressing marketable fruit of each tree
dimensionless 0 – 1 (0) (Tree Library/Fruit)
343. T_GenLitFracMax[Tree] Fraction of fruit will drop dimensionless 0 – 1 (.05) Management/ Fruit Harvesting
344. T_GenLitStage[Tree] Graphical input parameter as a function of tree stage that determine how many fruit will drop
dimensionless 0 – 1 (see T_GenLitStage graph)
Management/ Fruit Harvesting
345. T_GraphPhenol?[Tree] Parameter governing an option to simulate tree phenology using graph. Value 0 means tree phenology using phenology parameters, value 1 means tree phenology using graph
dimensionless 0 or 1 (0) Tree parameter/ Tree leaf phenology
346. T_GroMax[Tree] Maximum growth rate of hedgerows at full canopy closure
kg m-2 day-1 0 – 0.1 (.014) (Tree Library/ Growth)
347. T_GroResFrac[Tree] Fraction of tree carbohydrate reserves converted to biomass during regrowth stage after pruning
day-1 0 – 0.5 (.025) (Tree Library/ Growth)
appendix 4-7 R.qxd 9/27/2004 10:36 AM Page 225
226 No Acronym Definition Dimensions Range of value (Default value)
Input Section (Link location in Excel)
348. T_GroResInit[Tree] Initial amount of tree carbohydrates as reserves of tree potential growth
kg per tree 0 – 1 (0.25) Tree parameters
349. T_HeartWoodAllocAft Pruned?
Parameter governing an option to simulate heartwood. Value 0 means after pruning no sapwood biomass that allocated to heartwood biomass, value 1 means after pruning all sapwood biomass allocated to heartwood biomass.
dimensionless (0) Tree parameter/ Tree stem (sapwood & heartwood)
350. T_InitStage[Tree] Initial stage of tree when it was planted. If tree already growing at the start of simulation, it is the stage at the start of simulation time
dimensionless 0 – 2 (0) (Tree Library/ Growth stage)
351. T_KillDOY[Tree] Schedule date, day of year to kill tree julian days 1 – 365 (1) Management/ Killing Trees
352. T_KillY[Tree] Schedule date, year to kill tree dimensionless any integer value (1000)
Management/ Killing Trees
353. T_KLight[Tree] Tree canopy (leaves component) extinction light coefficient = the efficiency of tree foliage in absorbing light
dimensionless 0 – 1 (.7) (Tree Parameters/ Light Capture)
354. T_LatexMoistFrac[Tree] Standard moisture content for expressing marketable latex of each tree
dimensionless 0 – 1 (0) (Tree Library)
355. T_LAIMax[Tree] Maximum value of LAI in the tree canopy dimensionless 0 – 5 (4) (Tree Library/ Canopy)
356. T_LAIMinMaxRatio[Tree] Parameter describing canopy thickness/dense. Value 1 is maximum thickness
dimensionless 0 – 1 (1) (Tree Library/ Canopy)
357. T_LifallDroughtFrac[Tree] Fraction of tree biomass becomes litterfall due to drought
day-1 0 – 1 (.01) (Tree Library/ Litterfall)
358. T_LifallThreshWStress [Tree]
Threshold value for tree litterfall due to drought
dimensionless 0 – 1 (.7) (Tree Library/ Litterfall)
appendix 4-7 R.qxd 9/27/2004 10:36 AM Page 226

227
No Acronym Definition Dimensions Range of value (Default value)
Input Section (Link location in Excel)
359. T_LifallWeight[Zone] Input weight value governing amount of tree litterfall going into each zone relative to other zones (eg. 1:1:1:1 means equal mulch given in each zones on area basis)
dimensionless 0 – 10 (1,1, 1, 1) Litterfall
360. T_LignLifall[Tree] Lignin concentration of tree litterfall (eg. 20%=0.2)
dimensionless 0 – 1 (.43) (Tree Library/ Litter Quality)
361. T_LignPrun[Tree] Lignin concentration of pruned tree biomass (eg. 20%=0.2)
dimensionless 0 – 1 (.4) (Tree Library/ Litter Quality)
362. T_LignRt[Tree] Lignin concentration of tree root dimensionless 0 – 1 (.4) (Tree Library/ Litter Quality)
363. T_LWR[Tree] Leaf Weight Ratio = leaf dry weight per unit shoot dry weight
dimensionless 0 – 5 (.494) (Tree Library/ Growth)
364. T_MycMaxInf[Tree] Fraction of tree roots infected by mychorrhiza for a soil layer where the Rt_MTInfFrac parameter is 1
dimensionless 0 – 1 (.3) (Tree Library/ Mycorrhiza
365. T_NFixDayFrac[Tree] Fraction of current N deficit derived from atmospheric N2 fixation per day for each tree if T_NFixVariable = 1 ('true')
day-1 0 - 1 (.125) (Tree Library/ N Fixation)
366. T_NFixDWMaxFrac[Tree] Maximum fraction of the T_GroRes[Dw] pool that can be respired for N2 fixation if T_NFixVariable = 0 ('false')
day-1 0 - 0.5 (.05) (Tree Library/ N Fixation)
367. T_NFixDWUnitCost[Tree] Dry weight cost for respiration per unit N2 fixation, if T_NFixVariable = 0 ('false')
kg [dw] g-1 [N] 0 – 1 (0) (Tree Library/ N Fixation)
368. T_NfixResp[Tree] Responsiveness of N2 fixation to N stress (N in biomass divided by N target), if T_NFixVariable = 0 ('false')
dimensionless 0 – 5 (0) (Tree Library/ N Fixation)
369. T_NFixVariable?[Tree] Switch (0 = false, 1 = true) to choose between variable (N-stress dependent) versus constant N2 fixation as fraction of N deficit
dimensionless 0 or 1 (0) (Tree Library/ N Fixation)
appendix 4-7 R.qxd 9/27/2004 10:36 AM Page 227

228 No Acronym Definition Dimensions Range of value (Default value)
Input Section (Link location in Excel)
370. T_NlifallRed [SiNut,Tree]
Reducing factor for nutrient concentration of tree litterfall which depend on type of tree
dimensionless 0 – 2 (.7 for N and P)
(Tree Library/ Litterfall)
371. T_NutMobT[SiNut] Relative rate of transfer, per unit root length density (cm cm-3), from the 'immobile' pool of nutrients to the 'mobile' or sorbed pool, due to Crop root activity
m2 day-1 0 – 0.02 (0) (Tree Library/Root Impacts on Nutrient Mobility)
372. T_PlantDOY[Tree] Schedule for date of planting time. Entered from WaNuLCAS.XLS
julian days 1 – 365 (see table in excel sheet Tree Management)
(Tree Management)
373. T_PlantY[Tree] Schedule for year of planting time. Entered from WaNuLCAS.XLS
dimensionless any integer value (see table in excel sheet Tree Management)
(Tree Management)
374. T_PolypLifall[Tree] Polyphenol concentration of tree litterfall (eg. 3 %=0.03)
dimensionless 0 – 1 (0) (Tree Library/ Litter Quality)
375. T_PolypPrun[Tree] Polyphenol concentration of pruned tree biomass (eg. 3 %=0.03)
dimensionless 0 – 1 (0) (Tree Library/ Litter Quality)
376. T_PolypRt[Tree] Polyphenol concentration of tree root dimensionless 0 – 1 (0) (Tree Library/ Litter Quality)
377. T_PrunDoY[Tree] Schedule for date of pruning. Entered from WaNuLCAS.XLS
julian days 1 – 365 (365) (Tree Management)
378. T_PrunFracC[Tree] Fraction of canopy that gets pruned, for T_PrunType = 0. Constant for every pruning
dimensionless
0 – 1 (0)
Managements/ PruningEvents
379. T_PrunFracC[Tree] Fraction of tree canopy gets pruned, for T_PrunFrac? = 0
dimensionless 0 – 1 (1) Management/ PruningEvents
appendix 4-7 R.qxd 9/27/2004 10:36 AM Page 228

229
No Acronym Definition Dimensions Range of value (Default value)
Input Section (Link location in Excel)
380. T_PrunFracD[Tree] Fraction of tree canopy that gets pruned, for T_PrunFrac? = 1
dimensionless 0 – 1 (1) (Tree Management)
381. T_PrunHarvFracC[Tree] Fraction of pruned canopy that harvested (not return to the system), for T_PrunType? = 0. Constant for every pruning.
dimensionless
0 – 1 (0) Managements/ PruningEvents
382. T_PrunHarvFracD[Tree] Fraction of tree pruned biomass harvested. Value changes overtime
dimensionless 0 or 1 (0) (Tree Management)
383. T_PrunLimit Critical total LAI of all trees shadowing the crop zone, triggering a pruning event
dimensionless 0 – 5 (100) Management/ PruningEvent
384. T_PrunPlant?[Tree] Parameter governing pruning decision. 1 = tree is automatically pruned before crop planting, 0 = tree does not automatically pruned
dimensionless 0 or 1 (1) Management/ PruningEvent
385. T_PrunRecov[Tree] Time needed for tree to recover after pruning
days 0 – 30 (14) Management/ PruningEvent
386. T_PrunStageLimit[Tree] The latest crop stage at which automatic pruning is still performed. Corresponds to T_PrunPlant? = 1
dimensionless 1 – 2 (1.8) Management/ PruningEvent
387. T_PrunType? This parameter govern the type of pruning events. 0 = Pruning determined automatically based on canopy denseness (tree LAI). Associated with T_PrunLimit and Tree_StageLimit. 1 = Pruning determined by calender. Assciated with Pruning section in sheet Tree Management, WaNuLCAS.xls
dimensionless
0 (0 or 1)
Managements/ PruningEvents
388. T_PrunWeight [Zone,Tree]
Input weight value governing amount of tree pruning going into each zone relative to other zones (eg. equal pruned biomass given in each zones on area basis means 1:1:1:1 )
dimensionless 0 – 10 (0, 1, 1, 1)
Management/ PruningEvent
appendix 4-7 R.qxd 9/27/2004 10:36 AM Page 229
230 No Acronym Definition Dimensions Range of value (Default value)
Input Section (Link location in Excel)
389. T_PrunY[Tree] Schedule for year of pruning. Entered from WaNuLCAS.XLS
dimensionless any integer value (100)
(Tree Management)
390. T_RainWStorCap[Tree] Rainfall intercepted by tree stored as thin film at leaf surface
dimensionless (1) (Tree Library/ Rain Interception)
391. T_RelLightMaxGr[Tree] Relative light intensity at which shading starts to affect tree growth
dimensionless 0 - 1 (.5) (Tree Library/ Light Capture)
392. T_RhizEffKaPT Proportional reduction of the apparent adsorption constant for P due to root activity of the crop, expressed as fraction of N_KaPdef per unit tree root length density
m2 day-1 0 – .2 (0) (Tree Library/ Root impacts on P mobility)
393. T_RtDiam[Tree] Tree root diameter. It is used in calculating water and nutrient uptake. For all root type.
cm .05 – 3 (.1) (Tree Library/Roots)
394. T_SLA[Tree] Tree specific leaf area = tree leaf surface area per unit leaf dry weight
m2 kg-1 0 – 30 (7.87) (Tree Library/ Growth)
395. T_SapWoodScaling Rule Power coefficient of conversion of diameter of sapwood to heartwood. Default value 1 means no increasing of diameter heartwood
dimensionless 0 – 1 (1) Tree parameter/ Tree stem (sapwood & heartwood)
396. T_SlashLabour Amount of labour involved in slashing the field per unit simulated filed as a function of biomass slashed
person days (see T_Slash Lab graph)
Management/ Slash and Burn
397. T_SlashSellWoodFrac [Tree]
Indicates the fraction of wood that is removed from the plot at the time of slashing the vegetation
dimensionless 0 – 1 (0) Management/ Slash and Burn
398. T_StageAftPrun[Tree] Tree growth stage after pruning dimensionless 0 – 2 (1) (Tree Library/ Growth stage)
399. T_TimeGenCycle[Tree] Length of generative cycles of tree days any integer value (150)
(Tree Library/ Growth stage)
appendix 4-7 R.qxd 9/27/2004 10:36 AM Page 230

231
No Acronym Definition Dimensions Range of value (Default value)
Input Section (Link location in Excel)
400. T_TimeVeg[Tree] Length of vegetative cycles of tree days any integer value (720)
(Tree Library/ Growth stage)
401. T_TranspRatio[Tree] Amount of water needed per unit dry matter production of tree
l kg-1 0 – 500 (300) (Tree Library/ Growth)
402. T_TranspRatioTime Graphical input parameter as a function of tree stage that determine the dynamic of tree transpiration per unit biomass production
- - Tree Parameter
403. T_TreesperHa[Tree] Tree plant density dimensionless any integer value (400)
Tree Parameters
404. T_WoodBiomInit[Tree] Initial amount of biomass in tree stem kg m-2 0 – 1 (0) Tree Parameters
405. T_WoodDens[Tree] Wood density of each tree species kg m-3 (750) (Tree Library)
406. T_WoodFracHRemain Wood height remain after pruning. If you do not want to harvest wood/timber when pruning makes sure this is a high value, eg. 100.
m 0-100 (100) Management/ Pruning Events/ Other Pruning Parameters
407. T_WoodHarvDOY[Tree] Schedule for date of pruning. Entered from WaNuLCAS.XLS
julian days 1 – 365 (364) (Tree Management)
408. T_WoodHarvFrac[Tree] Fraction Harvested wood dimensionless 0 – 1 (.95) Management/ Timber Harvesting
409. T_WoodHarvY[Tree] Schedule for year of timber harvesting. Entered from WANULCAS.XLS
dimensionless Any integer value (100)
(Tree Management)
410. T_WoodHInit[Tree] Initial value of tree bare stem height (tree height excluded canopy)
m 0 – 15 (0) Tree Parameters
411. T_WoodMoistFrac[Tree] Standard moisture content for expressing marketable wood of each tree
dimensionless 0 – 1 (0) (Tree Library)
appendix 4-7 R.qxd 9/27/2004 10:36 AM Page 231
232 No Acronym Definition Dimensions Range of value (Default value)
Input Section (Link location in Excel)
412. Temp_AType A number governing type of soil temperature data used in the simulation(0= constant value of soil temperature , 1 =read from monthly average data,2=read from daily data which is read from external file)
dimensionless 1, 2 or 3 (1) Soil Temperature
413. Temp_Cons Soil temperature throughout the simulation; corresponds to Temp_AType=0
oC 15 – 40 (28) Soil Temperature
414. Temp_DailyData Actual daily data of soil temperature; corresponds to Temp_AType=2. Read from WaNuLCAS.XLS
oC (see table in excel sheet weather)
(WEATHER)
415. Temp_DailyPotEvap Daily potential evaporation. Entered from WaNuLCAS.XLS
mm day-1 (see table in excel sheet weather)
(WEATHER)
416. Temp_EvapPotConst Amount of water evaporating from top soil in absence of plant cover
mm day-1 0 – 10 (3) Soil Evaporation
417. Temp_MonthAvg Monthly average of soil temperature; corresponds toTemp_AType=1. Entered as graphical function
0C (see Temp_Month Avg graph)
Soil Temperature
418. Temp_PotEvapConst? Parameter governing type of soil evaporation potential data. 1 = constant throughout simulation, 0 = daily data
dimensionless 0 or 1 (1) Soil Evaporation
419. TW_PotSuctAlphMax [Tree]
Plant potential where transpiration is (1-Alpha)*potential transpiration, where Alpha is a small value (e.g. 0.01)
cm -7000 – -3 000 (-5000)
(Tree Library/ Water Uptake)
420. TW_PotSuctAlphMin [Tree]
Plant potential where transpiration is Alpha*potential transpiration, where Alpha is a small value (e.g. 0.01)
cm -30000 – -10000 (-15000)
(Tree Library/ Water Uptake)
appendix 4-7 R.qxd 9/27/2004 10:36 AM Page 232

233
No Acronym Definition Dimensions Range of value (Default value)
Input Section (Link location in Excel)
421. W_FieldCapkCriti[Zone] Field capacity determined by a threshold rate of subsequent drainage (Kcrit) that is set in the pedotransfer worksheet; the actual field capacity used is the maximum of this value and the field capacity derived from the height above a groundwater table. Read and calculation from WaNuLCAS.XLS (pedotransfer). Input needed to run pedotranfer refer to the sheet pedotranfer
m3 water m-3 soil
(see table in excel sheet Soil Hydraulic)
(Soil Hydraulic)
422. W_Hyd? Parameter governing water hydraulic lift application in model. 1 = apply hydraulic lift in overall water balance, 0 = otherwise
dimensionless 0 – 1 (0) Soil Water and Nutrient
423. W_PhiPxi[Zone] Graphs showing relationship between pressure head in i-th soil layer of each zone and matrix flux potential (the index x refers to the plants with the highest (H), lowest (L), medium-high (MH) or medium low (ML) rank of root water potential), but the graphs will be identical. Read and calculation from WaNuLCAS.XLS (pedotransfer). Input needed to run pedotranfer refer to the sheet pedotranfer
cm2 day-1 (see table in excel sheet Soil Hydraulic)
(Soil Hydraulic)
424. W_PhiThetai[Zone] Matrix flux potential at a given theta/soil water content in layer i of each zone. Read and calculation from WaNuLCAS.XLS (pedotransfer). Input needed to run pedotranfer refer to the sheet pedotranfer
cm2 day-1 (see table in excel sheet Soil Hydraulic)
(Soil Hydraulic)
425. W_PThetai[Zone] Graphs showing relationship between volumetric soil water content and pressure head in i-th soil layer of each zone. Read and calculation from WaNuLCAS.XLS (pedotransfer). Input needed to run pedotranfer refer to the sheet pedotranfer
cm (see table in excel sheet Soil Hydraulic)
(Soil Hydraulic)
appendix 4-7 R.qxd 9/27/2004 10:36 AM Page 233
234 No Acronym Definition Dimensions Range of value (Default value)
Input Section (Link location in Excel)
426. W_ThetaInacci[Zone] Amount of volumetric soil water in i-th soil layer of each zone not available for plant. It is value of volumetric soil water at pF= 4.2 or P = -16000. Read and calculation from WaNuLCAS.XLS (pedotransfer). Input needed to run pedotranfer refer to the sheet pedotranfer
l m-2 day-1 (see table in excel sheet Soil Hydraulic)
(Soil Hydraulic)
427. W_Hyd? Parameter governing water hydraulic lift application in model. 1 = apply hydraulic lift in overall water balance, 0 = otherwise
dimensionless 0 – 1 (0) Soil Water and Nutrient
428. W_ThetaIniti[Zone] Initial volumetric soil water content in i –th soil layer of each zone. Current values are 1, 0.9, 0.8, 0.7 for layer 1…4, respectively
ml cm-3 0 – 1 Soil Water and N/ Initial Soil Water
429. W_ThetaPi[Zone] Graphs showing relationship between pressure head in i-th soil layer of each zone and volumetric soil water content. Read and calculation from WaNuLCAS.XLS (pedotransfer). Input needed to run pedotranfer refer to the sheet pedotranfer
cm 0 – 0.5 (see table in excel sheet Soil Hydraulic)
(Soil Hydraulic)
430. W_ThetaPMax[Zone] Volumetric soil water content at a given maximum soil potential at top layer. Read and calculation from WaNuLCAS.XLS (pedotransfer). Input needed to run pedotranfer refer to the sheet pedotranfer
cm (see table in excel sheet Soil Hydraulic)
(Soil Hydraulic)
appendix 4-7 R.qxd 9/27/2004 10:36 AM Page 234

235
Appendix 8. Other Useful parameters and their definition (parameters which can be input or output which arenot yet at users interface layer)
No Acronym Definition Dimensions Default value Model Sector
1. C_GroResMobFrac Fraction of crop growth reserves that is remobiilze into yield and root component
dimensionless 0.95 Crop Growth
2. C_NDemand Amount of Nitrogen or Phosphorus demanded by crop per day; for a crop biomass less than 2 Mg/ha demand is based on 5% N, above that (after canopy closure) on 1% N
kg ha-1 output Crop Growth
3. C_NUptTot Total amount of Nitrogen or Phosphorus in all soil layers potentially available for crop uptake per day
g m-2 output Crop Growth
4. C_Tmin Minimum Air Temperature for Crop 0 Celsius 20 Crop Sequence
5. C_TOpt Optimum Air Temperature for Crop 0 Celsius 21 Crop Sequence
6. CW_DemandAct Actual amount of crop water demand per day. Potential demand reduced by plant water potential.
l m-2 output Crop Water
appendix 4-7 R.qxd 9/27/2004 10:36 AM Page 235
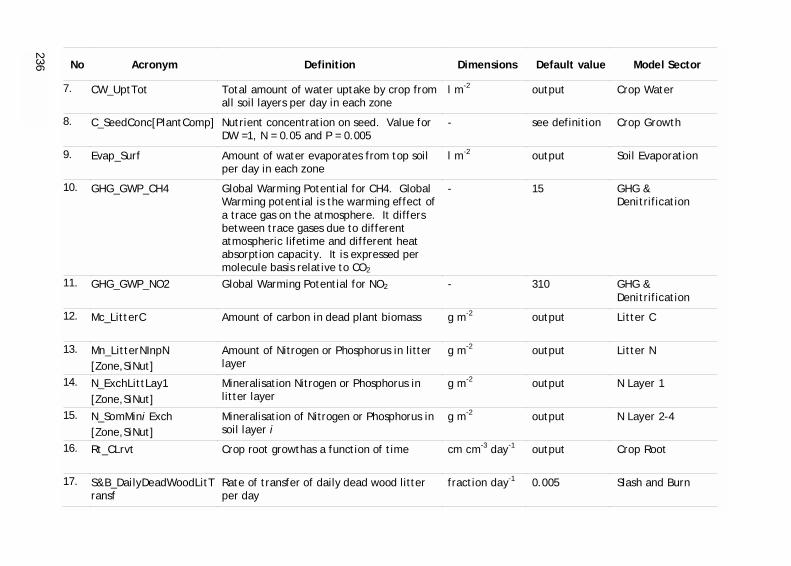
236 No Acronym Definition Dimensions Default value Model Sector
7. CW_UptTot Total amount of water uptake by crop from all soil layers per day in each zone
l m-2 output Crop Water
8. C_SeedConc[PlantComp] Nutrient concentration on seed. Value for DW =1, N = 0.05 and P = 0.005
- see definition Crop Growth
9. Evap_Surf Amount of water evaporates from top soil per day in each zone
l m-2 output Soil Evaporation
10. GHG_GWP_CH4 Global Warming Potential for CH4. Global Warming potential is the warming effect of a trace gas on the atmosphere. It differs between trace gases due to different atmospheric lifetime and different heat absorption capacity. It is expressed per molecule basis relative to CO2
- 15 GHG & Denitrification
11. GHG_GWP_NO2 Global Warming Potential for NO2 - 310 GHG & Denitrification
12. Mc_LitterC Amount of carbon in dead plant biomass g m-2 output Litter C
13. Mn_LitterNInpN [Zone,SiNut]
Amount of Nitrogen or Phosphorus in litter layer
g m-2 output Litter N
14. N_ExchLittLay1 [Zone,SiNut]
Mineralisation Nitrogen or Phosphorus in litter layer
g m-2 output N Layer 1
15. N_SomMini Exch [Zone,SiNut]
Mineralisation of Nitrogen or Phosphorus in soil layer i
g m-2 output N Layer 2-4
16. Rt_CLrvt Crop root growthas a function of time cm cm-3 day-1 output Crop Root
17. S&B_DailyDeadWoodLitTransf
Rate of transfer of daily dead wood litter per day
fraction day-1 0.005 Slash and Burn
appendix 4-7 R.qxd 9/27/2004 10:36 AM Page 236

237
No Acronym Definition Dimensions Default value Model Sector
18. S&B_DailyNecromLitTransf Rate of transfer of necromass litter per day fraction day-1 0.01 Slash and Burn
19. S_BDEqPower Power coefficient (b) of the allometric equation describing the decreasing of bulk density later effect on surface infiltration and saturated hydraulic conductivity
dimensionless 0.5 Soil Structure Dynamic
20. T_BiomAllTrees Total amount of aboveground biomass for all trees
kg m-2 output Tree Growth
21. T_HarvPrunCum[Tree] Total pruned tree biomass harvested kg m-2 output Tree Growth
22. T_LifallCum[Tree] Cumulative amount of tree litterfall kg m-2 output Tree Growth
23. T_PrunCum Cumulative amount of tree pruned biomass kg m-2 output Tree Growth
24. T_WatStressMem A parameter influencing the effect of drought on litterfall.
- 0.75 Tree Water Parameter
25. TF_AbRelSizePow[Tree] Input parameter in oil palm module - 2 Tree Fruit
26. TF_AvgDWpFruit[Tree] Average dry weight of oilpalm fruit kg m-2 - Tree Fruit
27. TF_FemSinkperBunch Graphical input parameter in oil palm module as a function of fruit stage
- - Tree Fruit
28. TF_FirstBudtoFlowerInit [Tree]
Number of phyllochron time units before sex determination during flower development
- 25 Tree Fruit
29. TF_InitFruitpBranch [Tree]
Input parameter in OilPalm module - 500 Tree Fruit
appendix 4-7 R.qxd 9/27/2004 10:36 AM Page 237
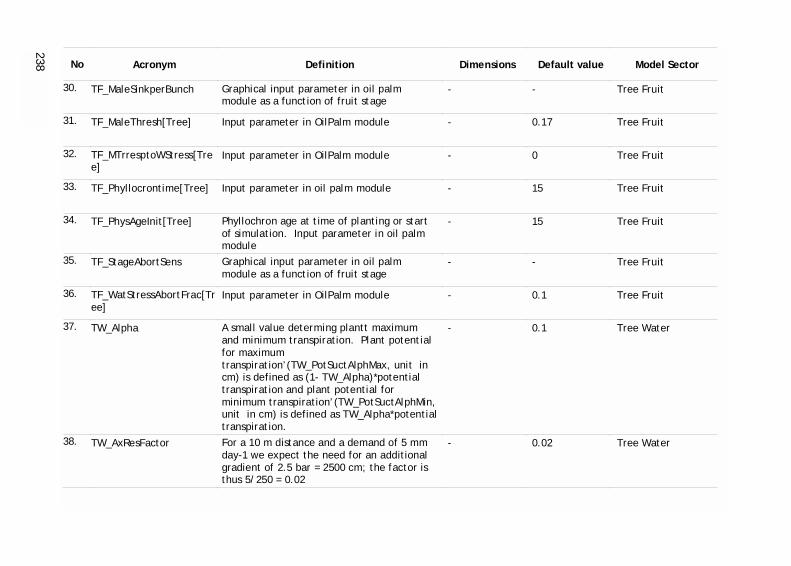
238 No Acronym Definition Dimensions Default value Model Sector
30. TF_MaleSinkperBunch Graphical input parameter in oil palm module as a function of fruit stage
- - Tree Fruit
31. TF_MaleThresh[Tree] Input parameter in OilPalm module - 0.17 Tree Fruit
32. TF_MTrresptoWStress[Tree]
Input parameter in OilPalm module - 0 Tree Fruit
33. TF_Phyllocrontime[Tree] Input parameter in oil palm module - 15 Tree Fruit
34. TF_PhysAgeInit[Tree] Phyllochron age at time of planting or start of simulation. Input parameter in oil palm module
- 15 Tree Fruit
35. TF_StageAbortSens Graphical input parameter in oil palm module as a function of fruit stage
- - Tree Fruit
36. TF_WatStressAbortFrac[Tree]
Input parameter in OilPalm module - 0.1 Tree Fruit
37. TW_Alpha A small value determing plantt maximum and minimum transpiration. Plant potential for maximum transpiration’(TW_PotSuctAlphMax, unit in cm) is defined as (1- TW_Alpha)*potential transpiration and plant potential for minimum transpiration’(TW_PotSuctAlphMin, unit in cm) is defined as TW_Alpha*potential transpiration.
- 0.1 Tree Water
38. TW_AxResFactor For a 10 m distance and a demand of 5 mm day-1 we expect the need for an additional gradient of 2.5 bar = 2500 cm; the factor is thus 5/250 = 0.02
- 0.02 Tree Water
appendix 4-7 R.qxd 9/27/2004 10:36 AM Page 238

239
No Acronym Definition Dimensions Default value Model Sector
39. TW_L Coefficient related to tree root conductivity cm day-1 10^-5 Tree Water
40. TW_PotSuctBuff Hydrostatic gradient to overcome transport resistance in wet soil l
cm 0.05 Tree water parameter
41. W_PMax Maximum value of soil potential in positive value
cm 0 Water layer 1
appendix 4-7 R.qxd 9/27/2004 10:36 AM Page 239

appendix 4-7 R.qxd 9/27/2004 10:36 AM Page 240

References
Akyeampong E, Duguma B, Heineman AM, Kamara CS, Kiepe P, Kwesiga F, Ong CK,Otieno HJ and Rao MR (1995) A synthesis of ICRAF's research on alley cropping.In: Alley Farming Research and Development. AFNETA, Ibadan, Nigeria. pp 40-51.
Arah J and Hodnett M (1997) Approximating soil hydrology in agroforestry models.Agroforestry Forum 8(2): 17-20.
Bayala J, van Noordwijk M, Lusiana B, Ouédraogo S J, Teklehaimanot Z (2004)Separating the tree-soil-crop interactions in agroforestry parkland systems inSapone (Burkina Faso) using WaNuLCAS. ICRAFSEA - INERA. Poster presentedat 1st World Congress of Agroforestry, 27 June - 2 July 2004, Orlando - Florida,USA.
Breman H and Kessler JJ (1997) The potential benefits of agroforestry in the Sahel andother semi arid regions. European Journal of Agronomy 7: 25 33.
Burgess SSO, Adams MA, Turner NC and Ong CK (1998) Redistribution of soil waterby tree root systems. Oecologia 3(115): 306-311.
Cadisch G, Rowe E and van Noordwijk M (1997) Nutrient harvesting - the tree-rootsafety net. Agroforestry Forum 8(2): 31-33.
Caldwell RM, Pachepsky YA and Timlin DJ (1996) Current research status on growthmodeling in intercropping. In: O.Ito et al. (Eds) Dynamics of Roots and Nitrogenin Cropping Systems of the Semi-Arid Tropics. Japan International ResearchCenter for Agricultural Sciences. pp 617-635.
Cannell MGR, Mobbs DC and Lawson GJ (1998) Complementarity of light and wateruse in tropical agroforests. II. Modelled theoretical tree production and potentialcrop yield in arid to humid climates. Forest Ecology and Management 102: 275282.
Cannell MGR, van Noordwijk M and Ong CK (1996) The central agroforestryhypothesis: the trees must acquire resources that the crop would not otherwiseacquire. Agroforestry Systems 33: 1-5.
Dawson TE (1993) Hydraulic lift and water use by plants: implications for waterbalance, performance and plant plant interactions. Oecologia 95: 565 574.
De Willigen P and Van Noordwijk M (1987) Roots for plant production and nutrientuse efficiency, Doctoral thesis Agricultural University Wageningen 282 pp.
De Willigen P and Van Noordwijk M (1989) Rooting depth, synchronization,synlocalization and N use efficiency under humid tropical conditions. In: Van deHeide, J. (eds) Nutrient Management for Food Crop Production in TropicalFarming Systems. Institute for Soil Fertility, Haren, pp. 145 156.
241
appendix 4-7 R.qxd 9/27/2004 10:36 AM Page 241
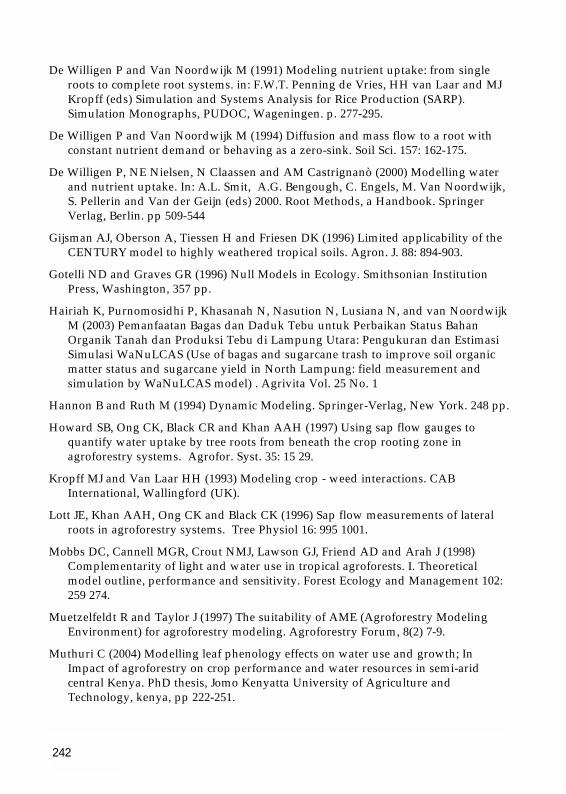
De Willigen P and Van Noordwijk M (1991) Modeling nutrient uptake: from singleroots to complete root systems. in: F.W.T. Penning de Vries, HH van Laar and MJKropff (eds) Simulation and Systems Analysis for Rice Production (SARP).Simulation Monographs, PUDOC, Wageningen. p. 277-295.
De Willigen P and Van Noordwijk M (1994) Diffusion and mass flow to a root withconstant nutrient demand or behaving as a zero-sink. Soil Sci. 157: 162-175.
De Willigen P, NE Nielsen, N Claassen and AM Castrignanò (2000) Modelling waterand nutrient uptake. In: A.L. Smit, A.G. Bengough, C. Engels, M. Van Noordwijk,S. Pellerin and Van der Geijn (eds) 2000. Root Methods, a Handbook. SpringerVerlag, Berlin. pp 509-544
Gijsman AJ, Oberson A, Tiessen H and Friesen DK (1996) Limited applicability of theCENTURY model to highly weathered tropical soils. Agron. J. 88: 894-903.
Gotelli ND and Graves GR (1996) Null Models in Ecology. Smithsonian InstitutionPress, Washington, 357 pp.
Hairiah K, Purnomosidhi P, Khasanah N, Nasution N, Lusiana N, and van NoordwijkM (2003) Pemanfaatan Bagas dan Daduk Tebu untuk Perbaikan Status BahanOrganik Tanah dan Produksi Tebu di Lampung Utara: Pengukuran dan EstimasiSimulasi WaNuLCAS (Use of bagas and sugarcane trash to improve soil organicmatter status and sugarcane yield in North Lampung: field measurement andsimulation by WaNuLCAS model) . Agrivita Vol. 25 No. 1
Hannon B and Ruth M (1994) Dynamic Modeling. Springer-Verlag, New York. 248 pp.
Howard SB, Ong CK, Black CR and Khan AAH (1997) Using sap flow gauges toquantify water uptake by tree roots from beneath the crop rooting zone inagroforestry systems. Agrofor. Syst. 35: 15 29.
Kropff MJ and Van Laar HH (1993) Modeling crop - weed interactions. CABInternational, Wallingford (UK).
Lott JE, Khan AAH, Ong CK and Black CK (1996) Sap flow measurements of lateralroots in agroforestry systems. Tree Physiol 16: 995 1001.
Mobbs DC, Cannell MGR, Crout NMJ, Lawson GJ, Friend AD and Arah J (1998)Complementarity of light and water use in tropical agroforests. I. Theoreticalmodel outline, performance and sensitivity. Forest Ecology and Management 102:259 274.
Muetzelfeldt R and Taylor J (1997) The suitability of AME (Agroforestry ModelingEnvironment) for agroforestry modeling. Agroforestry Forum, 8(2) 7-9.
Muthuri C (2004) Modelling leaf phenology effects on water use and growth; InImpact of agroforestry on crop performance and water resources in semi-aridcentral Kenya. PhD thesis, Jomo Kenyatta University of Agriculture andTechnology, kenya, pp 222-251.
242
appendix 4-7 R.qxd 9/27/2004 10:36 AM Page 242

Myers B, Van Noordwijk, M and Vityakon P (1997). Synchrony of nutrient release andplant demand: plant litter, soil environment and farmer management options. in:G. Cadisch and K.E. Giller (eds) Driven by Nature: Plant Litter Quality andDecomposition. CAB International, Wallingford (UK) pp. 215 - 229.
Myers RJK, Palm CA, Cuevas E, Gunatilleke IUN and Brossard M (1994) Thesynchronisation of nutrient mineralisation and plant nutrient demand. in: P.L.Woomer and M.J. DSwift (Eds.) The Biological Management of Tropical SoilFertility. Johm Wiley, Chichester (UK) pp 81-116.
Ong CK 1995. The 'dark side' of intercropping: manipulation of soil resources. In:Sinoquet H and Cruz P (eds.) Ecophysiology of Tropical Intercropping, 482 pp.Institute National de la Recherche Agronomique, Paris (France).
Ong CK and PA Huxley (Eds.). (1996) Tree-Crop Interactions - a PhysiologicalApproach. CAB International, Wallingford (UK).
Palm, C.A., Alegre, J.C., Arevalo, L., Mutuo, P.K., Mosier, A.R. and Coe, R. (2002)Nitrous oxide and methane fluxes in six different land use systems in the PeruvianAmazon. Global Biogeochemical Cycles 16(4), 1073.
Parton WJ, Ojima DS, Cole CV and Schimel DS (1994) A general model for soilorganic matter dynamics: sensitivity to litter chemistry, texture and management.In: Quantitative Modeling of Soil Forming Processes. Special Publication 39, SoilScience Society of America, Madison WI, USA, pp 147-167.
Radersma S and C Ong (2004) Spatial distribution of root length density and soilwater of linear agroforestry systems in sub-humid Kenya: implications foragroforestry models. Forest Ecology and Management, 188(1-3), 77-89
Rao MR, Nair PK and Ong CK (1997) Biophysical interactions in tropical agroforestrysystems. Agroforestry Systems 38: 3 - 49.
Rowe EC, Hairiah K, Giller KE, Van Noordwijk M and Cadisch G (1999) Testing thesafety-net role of hedgerow tree roots by 15N placement at depths.. AgroforestrySystems 43: 81-93.
Rykiel EJ (1996) Testing ecological models: the meaning of validation. EcologicalModeling 90: 229-244.
Sanchez P (1995) Science in agroforestry. Agroforestry Systems 30: 5-55.
Shepherd KD and Soule MJ (1998) Soil fertility management in West Kenya: dynamicsimulation of productivity, profitability and sustainability at different resourceendowment levels. Agriculture, Ecosystems & Environment (in press).
Sinoquet H, Adam B, Rivet P and Godin C (1997) Interactions between light and plantarchitecture in an agroforestry walnut tree. Agroforestry Forum, 8(2) 37-39.
Smith DM, Jackson NA, Roberts JM and Ong CK (1998) Reverse flow in tree roots anddownward siphoning of water by Grevillea robusta. Functional Ecology 2(13): 256-264.
243
appendix 4-7 R.qxd 9/27/2004 10:36 AM Page 243

Suprayogo D, Widianto, Cadish G, and van Noordwijk M (2003) A Pedotransferresource database (PTFRDB) for tropical soils : test with the water balance ofWaNuLCAS in: D Post (eds) Proceedings of the 2003 MODSIM Conference -Volume 1. Townsville, Australia. p 584-589.
Suprayogo D, Widianto and Lusiana B (2002) Diagnosis Kesehatan Bertani BerbasisPohon: Apakah air dan hara tanah digunakan secara efisien. In: S.M. Sitompuland S.R. Utami (eds) Akar Pertanian Sehat: Konsep dan Pemikiran. BiologicalManagement of Soil Fertility (BMSF), Brawijaya University, Malang (Indonesia). p117-129
Suprayogo, D. (2000) Testing the Safety - Net Hypothesis in Hedgerow Intercropping:water balance and mineral - N leaching in the humid tropics. PhD thesis, ImperialCollege London, Wye Campus, UK, 316 pp.
Tomich TP, Van Noordwijk M, Budidarseno S, Gillison A, Kusumanto T, MurdiyarsoD, Stolle F and Fagi AM (1998b) Alternatives to Slash-and-Burn in Indonesia,Summary report and synthesis of Phase II. ICRAF S.E. Asia, Bogor, Indonesia, 139pp.
Tomich TP, Van Noordwijk M, Vosti S and Whitcover J (1998a) AgriculturalDevelopment with Rainforest Conservation: Methods for Seeking Best BetAlternatives to Slash-and-Burn, with Applications to Brazil and Indonesia.Agricultural Economics 19: 159-174.
Van Noordwijk M, Rahayu S, Williams SE, Hairiah K, Khasanah N, Schroth G (2003)Crop and tree root-system dynamics In M. van Noordwijk, G. Cadisch, C.K. Ong(eds) BelowGround Interaction in tropical Agroecosystems: Concepts and Modelswith multiple plant component, CABI, Wallingford, UK
Van Noordwijk M (1989) Rooting depth in cropping systems in the humid tropics inrelation to nutrient use efficiency. In: J. van der Heide (ed.) Nutrient Managementfor Food Crop Production in Tropical Farming Systems. Institute for Soil Fertility,Haren. p 129-144.
Van Noordwijk M (1996a) A simple model to quantify mulch and shade effects. In:C.K. Ong and P.A. Huxley (Eds.). Tree-Crop Interactions - a PhysiologicalApproach. CAB International, Wallingford (UK). pp 51-72.
Van Noordwijk M (1996b) Models as part of agroforestry research design. AGRIVITA19: 192-197.
Van Noordwijk M and Brouwer G (1997). Roots as sinks and sources of carbon andnutrients in agricultural systems. in: L. Brussaard and R. Ferrera-Cerrato (eds.) SoilEcology in Sustainable Agricultural Systems. CRC Lewis Publ., Boca Raton. pp 71-89.
Van Noordwijk M and Cadisch G (2002) Access and excess problems in plantnutrition. Plant and Soil 247:25-40
244
appendix 4-7 R.qxd 9/27/2004 10:36 AM Page 244

Van Noordwijk M and Lusiana B (1999) WaNuLCAS, a model of water, nutrient andlight capture in agroforestry systems. Agroforestry Systems 43: 217-242.
Van Noordwijk M and Ong CK (1999) Can the ecosystem mimic hypotheses beapplied to farms in African savannahs?.Agroforestry Systems 45: 131-158.
Van Noordwijk M and Purnomosidhi P (1995) Root architecture in relation to tree soilcrop interactions and shoot pruning in agroforestry. Agroforestry Systems 30: 161-173.
Van Noordwijk M and Van de Geijn SC (1996) Root, shoot and soil parametersrequired for process-oriented models of crop growth limited by water or nutrients.Plant and Soil 183: 1-25.
Van Noordwijk M, Hairiah K, Lusiana B and Cadisch G (1998a) Tree - Soil - CropInteractions in Sequential and Simultaneous Agroforestry Systems. in: L.Bergstrom and H. Kirschner (Ed.) Carbon and Nutrient Dynamics in Natural andAgricultural Tropical Ecosystems. CAB International, Wallingford (UK). pp 173-190.
Van Noordwijk M, Lawson G, Groot JJR, Hairiah K, (1996) Root distribution inrelation to nutrients and competition. In: C.K. Ong and P.A. Huxley (Eds.). Tree-Crop Interactions - a Physiological Approach. CAB International, Wallingford(UK). pp 319-364.
Van Noordwijk M, Radersma S and Lusiana B (1999) Modelling root architecture andphosphorus uptake in agroforestry. Agroforestry Forum 9(4) 28-30.
Van Noordwijk M, Van Roode M, McCallie EL and Lusiana B (1998b) Erosion andsedimentation as multiscale, fractal processes: implications for models,experiments and the real world. In: F. Penning de Vries, F. Agus and J. Kerr (Eds.)Managing Soil Erosion. CAB International, Wallingford. 223-253.
Vandermeer JH (1989) The Ecology of Intercropping. Cambridge University Press,Cambridge.
Verchot, L.V., Davidson, E.A., Cattânio, J.H. and Ackerman, I.L. (2000) Land-usechange and biogeochemical controls of methane fluxes in soils of easternAmazonia. Ecosystems 3, 41-56.
Verchot, L.V., Davidson, E.A., Cattânio, J.H., Ackerman, I.L., Erickson, H.E. andKeller, M. (1999) Land use change and biogeochemical controls of nitrogen oxideemissions from soils in eastern Amazonia. Global Biogeochemical Cycles 13, 31-46.
Verchot, L.V., Mosier, A., Baggs, E.M. and Palm, C.A., (2004) Soil-Atmosphere GasExchange in Tropical Agriculture: Contributions to Climate Change. In: M. VanNoordwijk, G. Cadisch and C.K. Ong (Eds.) Belowground Interactions in TropicalAgroecosystems, CAB International, Wallingford (UK), in pressAkyeampong E,Duguma B, Heineman AM, Kamara CS, Kiepe P, Kwesiga F, Ong CK, Otieno HJand Rao MR (1995) A synthesis of ICRAF's research on alley cropping. In: AlleyFarming Research and Development. AFNETA, Ibadan, Nigeria. pp 40-51.
245
appendix 4-7 R.qxd 9/27/2004 10:36 AM Page 245

Wösten JHM, A Lilly, A Nemes and C Le Bas (1998) Using existing soil data to derivehydraulic parameters for simulation models in environmental studies and in landuse planning. Report 156, SC-DLO, Wageningen (the Netherlands), 106 pp.
Wösten JMH, Finke PA and Jansen MJW (1995) Comparison of class and continuouspedotransfer functions to generate soil hydraulic characteristics. Geoderma 66: 27-37.
Young A (1997) Agroforestry for Soil Management. 2nd ed. CAB International,Wallingford (UK). 320 pp.
Young A, Menz K, Muraya P and Smith C (1990) SCUAF Soil changes underagroforestry. Computer program with user's handbook. Version 2. ICRAF, Nairobi(Kenya) 124 pp.
Young A, Menz K, Muraya P and Smith C, (1998) SCUAF Version 4: A model toestimate soil changes under agriculture, agroforestry and forestry. ACIARTechnical Reports Series No. 41, ACIAR, Canberra (Australia). 49 pp.
246
appendix 4-7 R.qxd 9/27/2004 10:36 AM Page 246

appendix 4-7 R.qxd 9/27/2004 10:36 AM Page 240


