203.209.96.242203.209.96.242/backoffice/files/731.pdfPDF file203.209.96.242

1
3QFY2014 Results Preview | | | | | January 3, 2014
Refer to important Disclosures at the end of the report
Note: Stock prices as of December 31, 2013
Table of Contents
StrategyStrategyStrategyStrategyStrategy 2-82-82-82-82-8
3QFY2014 Sectoral Outlook3QFY2014 Sectoral Outlook3QFY2014 Sectoral Outlook3QFY2014 Sectoral Outlook3QFY2014 Sectoral Outlook
Automobile 10
Banking 13
Capital Goods 19
Cement 21
FMCG 23
Infrastructure 25
Information Technology 28
Media 31
Metals 32
Oil & Gas 35
Pharmaceutical 38
Power 41
Telecom 43
Stock WStock WStock WStock WStock Watchatchatchatchatch 4646464646

Refer to important Disclosures at the end of the report 2
3QFY2014 Results Preview | | | | | January 3, 2014
Strategy
Export sectors to aid earnings performance
During 3QFY2014, we expect an improvement in earningsgrowth for Sensex as well as our coverage companies* ascompared to the previous quarter, driven by sectors like IT &Pharma. For the Sensex companies, we expect earnings to growby 13.1% yoy and 4.4% qoq and for our coverage companieswe expect earnings growth to come in at 12.2% yoy and9.7% qoq. Strong numbers by individual large caps like TataMotors in the automobile space and Tata Steel in the metalsspace are also expected to aid earnings.
On the revenue front, we expect Sensex companies to report agrowth of 15.0% yoy and 6.1% qoq. Similarly, our coveragecompanies are expected to post a 13.9% yoy and 5.4% qoqgrowth on the top-line front. We expect the performance ofcompanies in the Oil and Gas and IT space along with TataMotors in the automobile sector to contribute substantially tothe overall revenue performance of our coverage companies.
The persistence of headwinds in cyclical sectors is expected toweigh on their margin performance during 3QFY2014 as well.As a result, we expect margin deterioration for both the Sensexas well as our coverage companies. For the Sensex companies,we expect a margin contraction of 81bp yoy and 48bp qoq
and for our coverage universe we expect margins to contractby 65bp yoy and 28bp qoq.
Outlook and VOutlook and VOutlook and VOutlook and VOutlook and Valuation: aluation: aluation: aluation: aluation: We are anticipating markets to gainpositively on the back of supportive global cues as well as ourimproving domestic economic outlook. Our external sector ismore resilient now as the trade deficit has narrowed owing tothe boost from export performance and moderation in importdemand. We expect a revival in the economy as the investmentcycle is boosted post elections owing to greater policy certainty.With these positives shaping up, we attribute a 16x multiple toour Sensex EPS and arrive at a target of 24,600 for the Sensexover the next one year.
We continue to maintain a positive bias for export-orientedsectors like IT and Pharmaceuticals, supported by the growthrevival in advanced economies and the rupee depreciation ona yoy basis. We also maintain a positive view on select metalstocks, considering recent capacity additions and under-utilizedcapacity getting employed for exports aided by improving globalfundamentals. We continue to prefer large private banks asthese are likely to benefit from an imminent economic revivalsince they continue to remain structurally strong.
SectorSectorSectorSectorSector (%, yoy) (%, yoy) (%, yoy) (%, yoy) (%, yoy) (%, qoq)(%, qoq)(%, qoq)(%, qoq)(%, qoq) (%, yoy)(%, yoy)(%, yoy)(%, yoy)(%, yoy) (%, qoq)(%, qoq)(%, qoq)(%, qoq)(%, qoq) (bps, yoy)(bps, yoy)(bps, yoy)(bps, yoy)(bps, yoy) (bps, qoq)(bps, qoq)(bps, qoq)(bps, qoq)(bps, qoq)
Agriculture (2) 13.7 3.0 28.2 - 52 (47)
Auto (7) 16.5 6.6 40.7 (8.4) 182 (100)
Auto Anc. (6) 10.0 3.0 41.4 3.2 222 22
Banks - New private (4) 15.3 4.5 17.1 11.9 154 15
Banks - Old private (2) 2.0 2.3 (1.5) (5.3) (570) (16)
Banks - Large PSU (7) 7.0 2.7 (9.9) 25.7 (712) 83
Banks - Mid PSU (14) 6.7 1.2 (6.8) 492.2 (427) 94
Banks - Housing finance (2) 12.1 (1.3) 13.4 (1.0) (49) (22)
Capital Goods (7) (2.3) 4.5 (23.9) 16.3 (186) 207
Cement (7) (1.2) 10.1 (30.5) 41.2 (259) 287
FMCG (12) 11.0 6.0 13.8 4.1 83 14
Infrastructure (11) 7.4 16.4 4.6 30.7 69 (3)
IT (12) 27.9 2.2 29.4 3.2 132 (10)
Media (5) 17.3 8.0 9.1 16.4 (124) 277
Metals (8) 14.6 0.9 57.7 9.6 251 34
Mining (1) 0.1 12.5 (15.6) 22.4 (588) 465
Oil & Gas (4) 19.9 9.1 2.1 1.0 (313) (134)
Pharmaceuticals (12) 17.6 (0.1) 41.7 (11.5) 242 (57)
Power (2) 1.7 (1.1) 1.8 7.5 27 53
Telecom (3) 8.7 2.3 148.2 28.5 260 17
Coverage Universe (128) Coverage Universe (128) Coverage Universe (128) Coverage Universe (128) Coverage Universe (128) 13.9 13.9 13.9 13.9 13.9 5.4 5.4 5.4 5.4 5.4 12.2 12.2 12.2 12.2 12.2 9.7 9.7 9.7 9.7 9.7 (65) (65) (65) (65) (65) (28) (28) (28) (28) (28)
Exhibit 1: 3QFY2014 Angel coverage performance estimatesOperating MarginsOperating MarginsOperating MarginsOperating MarginsOperating Margins
Source: Company, Angel Research
Net PNet PNet PNet PNet ProfitrofitrofitrofitrofitNet SalesNet SalesNet SalesNet SalesNet Sales
Note: *Sesa Goa and Cipla estimates have been excluded from analysis as comparable 3QFY2013 numbers are not available

3
3QFY2014 Results Preview | | | | | January 3, 2014
Refer to important Disclosures at the end of the report
Strategy
SectorSectorSectorSectorSector (%, yoy) (%, yoy) (%, yoy) (%, yoy) (%, yoy) (%, qoq)(%, qoq)(%, qoq)(%, qoq)(%, qoq) (%, yoy)(%, yoy)(%, yoy)(%, yoy)(%, yoy) (%, qoq)(%, qoq)(%, qoq)(%, qoq)(%, qoq) (bps, yoy)(bps, yoy)(bps, yoy)(bps, yoy)(bps, yoy) (bps, qoq)(bps, qoq)(bps, qoq)(bps, qoq)(bps, qoq)
Auto (5) 17.7 7.5 41.7 (7.3) 189 (113)
Finance (5) 12.0 4.3 4.0 11.3 (372) 91
Capital Goods (1) (11.0) 1.2 (40.0) 9.5 (519) 408
FMCG (2) 8.9 5.4 12.1 5.6 162 (23)
Infrastructure (1) 8.0 14.9 8.5 14.2 44 34
IT (3) 27.3 2.3 28.3 3.8 99 (5)
Metals (2) 10.6 0.3 331.3 45.2 259 (6)
Mining (1) 0.1 12.5 (15.6) 22.4 (588) 465
Oil & Gas (3) 20.0 9.2 (0.4) (1.4) (318) (138)
Pharma (2) 27.5 (3.5) 43.9 (12.8) 296 76
Power (2) 2.2 1.4 2.2 4.3 23 (37)
Telecom (1) 7.4 2.0 186.8 58.9 196 48
Sensex* (28) Sensex* (28) Sensex* (28) Sensex* (28) Sensex* (28) 15.0 15.0 15.0 15.0 15.0 6.1 6.1 6.1 6.1 6.1 13.1 13.1 13.1 13.1 13.1 4.4 4.4 4.4 4.4 4.4 (81) (81) (81) (81) (81) (48) (48) (48) (48) (48)
Exhibit 2: 3QFY2014 Sensex performance estimatesOperating MarginsOperating MarginsOperating MarginsOperating MarginsOperating Margins
Source: Company, Angel Research, Note: *Sesa Goa and Cipla estimates have been excluded as comparable3QFY2013 numbers are not available
Net PNet PNet PNet PNet ProfitrofitrofitrofitrofitNet SalesNet SalesNet SalesNet SalesNet Sales
CompanyCompanyCompanyCompanyCompany 3QFY2014E3QFY2014E3QFY2014E3QFY2014E3QFY2014E 3QFY20133QFY20133QFY20133QFY20133QFY2013 % chg% chg% chg% chg% chg 3QFY2014E3QFY2014E3QFY2014E3QFY2014E3QFY2014E 3QFY20133QFY20133QFY20133QFY20133QFY2013 % chg % chg % chg % chg % chg 3QFY2014E 3QFY2014E 3QFY2014E 3QFY2014E 3QFY2014E 3QFY20133QFY20133QFY20133QFY20133QFY2013 % chg% chg% chg% chg% chg
Axis Bank 4,725 4,110 14.9 2,769 2,362 17.2 1,568 1,347 16.4
Bajaj Auto 5,321 5,413 (1.7) 1,092 1,012 7.9 861 819 5.2
Bharti Airtel 21,761 20,254 7.4 7,070 6,184 14.3 814 284 186.8
BHEL 9,096 10,220 (11.0) 982 1,634 (39.9) 709 1,182 (40.0)
Coal India 17,336 17,325 0.1 4,379 5,395 (18.8) 3,724 4,413 (15.6)
Dr. Reddy 3,588 2,865 25.2 911 507 79.7 736 363 102.8
HDFC 1,929 1,729 11.6 1,758 1,585 10.9 1,283 1,140 12.6
HDFC Bank 6,823 5,909 15.5 3,826 3,121 22.6 2,349 1,859 26.3
Hero Moto Corp 6,869 6,188 11.0 755 569 32.9 561 488 15.0
Hindalco 6,775 6,790 (0.2) 579 582 (0.5) 224 289 (22.5)
HUL 6,938 6,434 7.8 989 868 14.0 924 879 5.2
ICICI Bank 6,556 5,714 14.7 4,012 3,452 16.2 2,475 2,250 10.0
Infosys 13,101 10,424 25.7 3,453 2,970 16.2 2,650 2,369 11.8
ITC 8,373 7,627 9.8 3,224 2,773 16.3 2,361 2,052 15.1
Gail India 13,734 12,474 10.1 1,968 2,002 (1.7) 1,229 1,285 (4.3)
L&T 16,667 15,429 8.0 1,667 1,475 13.0 1,116 1,029 8.5
M&M 10,415 10,774 (3.3) 1,378 1,211 13.8 902 836 7.8
Maruti Suzuki 10,928 11,200 (2.4) 1,211 891 35.9 620 501 23.7
NTPC 16,090 15,775 2.0 4,135 3,995 3.5 2,668 2,597 2.7
ONGC 21,643 20,987 3.1 11,529 11,342 1.6 5,558 5,563 (0.1)
RIL 117,488 93,886 25.1 7,717 8,373 (7.8) 5,508 5,502 0.1
SBI 16,120 14,803 8.9 6,808 7,791 (12.6) 2,716 3,396 (20.0)
Sun Pharma 3,700 2,852 29.7 1,558 1,261 23.6 1,054 881 19.6
Tata Motors 60,209 46,090 30.6 8,322 5,657 47.1 3,353 1,801 86.2
Tata Power 2,631 2,549 3.2 570 569 0.3 206 216 (4.7)
Tata Steel 36,257 32,107 12.9 3,654 2,239 63.2 826 (743) 211.1
TCS 21,434 16,070 33.4 6,734 4,654 44.7 4,955 3,552 39.5
Wipro 11,452 9,624 19.0 2,617 2,074 26.2 2,022 1,582 27.9
Sensex*Sensex*Sensex*Sensex*Sensex* 473,233 473,233 473,233 473,233 473,233 411,511 411,511 411,511 411,511 411,511 15.015.015.015.015.0 92,899 92,899 92,899 92,899 92,899 84,186 84,186 84,186 84,186 84,186 10.310.310.310.310.3 52,403 52,403 52,403 52,403 52,403 46,384 46,384 46,384 46,384 46,384 13.113.113.113.113.1
Exhibit 3: 3QFY2014 Sensex companies' performance estimatesNet PNet PNet PNet PNet Profit (rofit (rofit (rofit (rofit (`̀̀̀̀ cr) cr) cr) cr) cr)Operating POperating POperating POperating POperating Profit (rofit (rofit (rofit (rofit (`̀̀̀̀ cr) cr) cr) cr) cr)
Source: Company, Angel Research, Note: *Sesa Goa and Cipla estimates have been excluded as comparable 3QFY2013 numbers are not available
Net Sales (Net Sales (Net Sales (Net Sales (Net Sales ( `̀̀̀̀ cr) cr) cr) cr) cr)

Refer to important Disclosures at the end of the report 4
3QFY2014 Results Preview | | | | | January 3, 2014
Strategy
Sectoral Analysis
Automobile - Tata Motors likely to support robust
earnings performance
During 3QFY2014 volumes for our coverage automobile
companies continued to remain sluggish as demand decelerated
post the festival season owing to weak consumer sentiments.
Domestic industry volumes witnessed a growth of about
3.0% yoy YTD in FY2014, driven entirely by the two-wheeler
and the tractor segments, which were aided by rural demand
on the back of good monsoon.
We expect our coverage automobile companies to post a strong
earnings growth of 40.7% yoy, despite the yoy decline in
volumes, led by robust growth at Tata Motors, driven yet again
by an impressive Jaguar and Land Rover (JLR) performance.
We expect our coverage auto universe's top-line to register a
strong growth of 16.5% yoy, primarily aided by INR depreciation
on a yoy basis and price increases. Led by the price increases
and favorable currency movement, we expect our coverage auto
companies' margins to expand by 182bp yoy. Nevertheless,
excluding the performance of Tata Motors, we expect our
coverage automobile universe to register an almost flat revenue
performance while earnings report a growth of about 9.4% yoy
supported by margin expansion.
Banking - New Private banks to deliver better
numbers yet again
Over the last few years, PSU banks have continuously lost profit
market share (both on reported profit as well as on profit
adjusted for increase in net NPAs) to private banks within our
coverage. During 3QFY2014 as well, we expect earnings
divergence amongst our coverage banking stocks to continue,
as we anticipate new private banks to report a healthy earnings
growth of 17.1% yoy, while our coverage PSU banks are
expected to report weak performance with earnings de-growth
of 9.0% yoy.
New private banks are expected to deliver healthy NII growth
of 20.1% yoy, which is expected to aid healthy growth of
18.4% yoy in operating profit and 17.1% yoy in earnings. On
the other hand, PSU banks are expected to register moderate
NII growth of 10.6% yoy and de-growth of 4.8% yoy in
non-interest income. Additionally, growth in operating expenses
for PSU banks is expected to be higher at 21.6% yoy as against
11.1% yoy for new private banks.
Capital goods - Margin pressure and high interest costs
remain a drag on profitability
We expect the companies in our capital goods universe to post
a decline of 2.3% yoy in revenues. However, excluding the
performance of Bharat Heavy Electricals (BHEL), our coverage
capital goods companies are expected to report a moderate
revenue growth of 7.2% yoy. BHEL's top-line is likely to be
impacted due to execution delays on account of delay in
payments by clients as well as delay in obtaining the necessary
clearances.
Overall on the bottom-line front, we expect our capital goods
universe to report a steep contraction of 23.9% yoy as most of
the companies are expected to witness continued margin
pressure due to tough competition in the sector. Furthermore,
interest costs remain at elevated levels for many companies in
our capital goods universe as execution delays (due to delay in
clearances and deferral in payment by clients) and decline in
advances (due to subdued order inflow) have led to deterioration
of working capital, which is being funded by short- term
borrowings.
Cement - Earnings to be impacted by lower realizations
We expect our coverage cement universe to report a sharp
earnings decline, impacted by lower realizations, as the demand
scenario continues to remain sluggish. Volume growth for our
cement universe is expected to be 4.1% yoy on a low base. But
we expect a 1.2% yoy decline on the revenue front, mainly due
to lower realization. Owing to lower realizations we also expect
most of the companies under our coverage to post a decline in
margins on a yoy basis. Overall we expect a 259bp yoy decline
in OPM for our cement universe.
FMCG - Healthy revenue performance to aid earnings
growth
During the quarter, we expect our coverage FMCG universe to
report a 13.8% yoy earnings growth, led by healthy performance
on the top-line front. We expect our FMCG universe (excluding
ITC) to post a top-line growth of 11.4% yoy during the quarter
aided by both higher volumes and better realizations. Overall,
we expect a mixed performance on the operating front as higher
raw material prices are expected to result in a decline in gross
margins for some of our coverage FMCG companies. Also,
advertising and sales promotion expenses continue to remain
at elevated level, which along with higher freight costs are
expected to impact margin performance.
5
3QFY2014 Results Preview | | | | | January 3, 2014
Refer to important Disclosures at the end of the report
Strategy
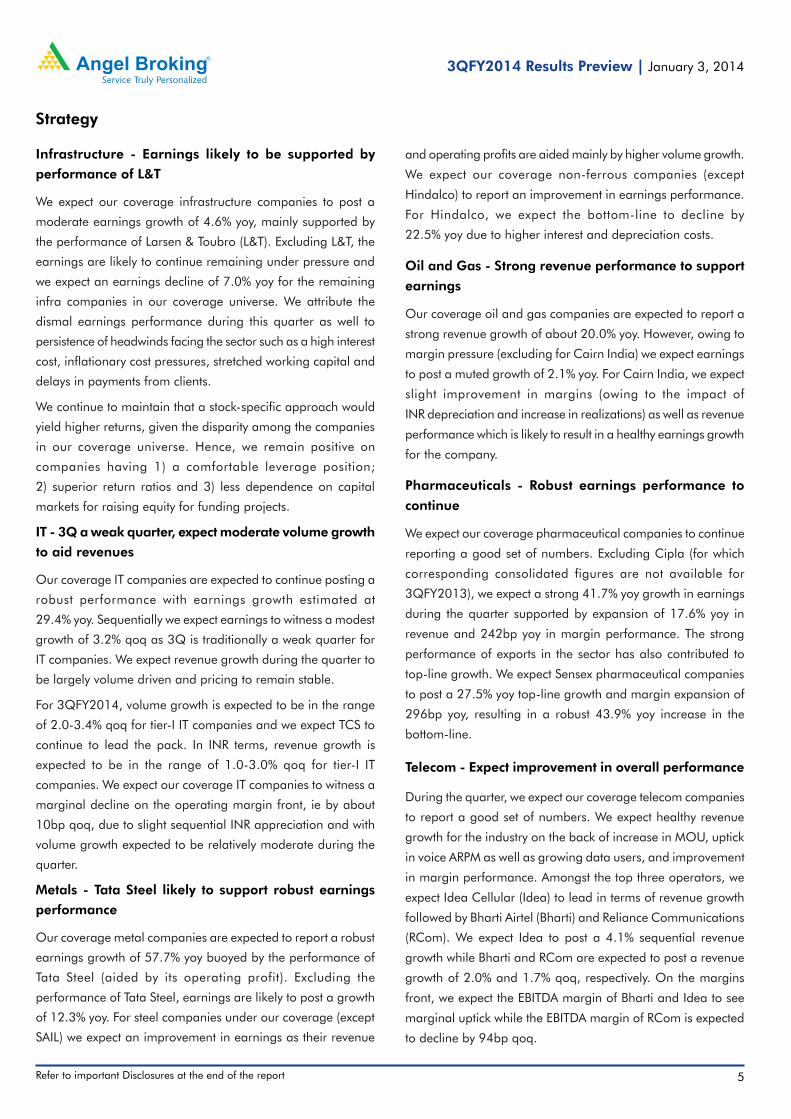
Infrastructure - Earnings likely to be supported by
performance of L&T
We expect our coverage infrastructure companies to post a
moderate earnings growth of 4.6% yoy, mainly supported by
the performance of Larsen & Toubro (L&T). Excluding L&T, the
earnings are likely to continue remaining under pressure and
we expect an earnings decline of 7.0% yoy for the remaining
infra companies in our coverage universe. We attribute the
dismal earnings performance during this quarter as well to
persistence of headwinds facing the sector such as a high interest
cost, inflationary cost pressures, stretched working capital and
delays in payments from clients.
We continue to maintain that a stock-specific approach would
yield higher returns, given the disparity among the companies
in our coverage universe. Hence, we remain positive on
companies having 1) a comfortable leverage position;
2) superior return ratios and 3) less dependence on capital
markets for raising equity for funding projects.
IT - 3Q a weak quarter, expect moderate volume growth
to aid revenues
Our coverage IT companies are expected to continue posting a
robust performance with earnings growth estimated at
29.4% yoy. Sequentially we expect earnings to witness a modest
growth of 3.2% qoq as 3Q is traditionally a weak quarter for
IT companies. We expect revenue growth during the quarter to
be largely volume driven and pricing to remain stable.
For 3QFY2014, volume growth is expected to be in the range
of 2.0-3.4% qoq for tier-I IT companies and we expect TCS to
continue to lead the pack. In INR terms, revenue growth is
expected to be in the range of 1.0-3.0% qoq for tier-I IT
companies. We expect our coverage IT companies to witness a
marginal decline on the operating margin front, ie by about
10bp qoq, due to slight sequential INR appreciation and with
volume growth expected to be relatively moderate during the
quarter.
Metals - Tata Steel likely to support robust earnings
performance
Our coverage metal companies are expected to report a robust
earnings growth of 57.7% yoy buoyed by the performance of
Tata Steel (aided by its operating profit). Excluding the
performance of Tata Steel, earnings are likely to post a growth
of 12.3% yoy. For steel companies under our coverage (except
SAIL) we expect an improvement in earnings as their revenue
and operating profits are aided mainly by higher volume growth.
We expect our coverage non-ferrous companies (except
Hindalco) to report an improvement in earnings performance.
For Hindalco, we expect the bottom-line to decline by
22.5% yoy due to higher interest and depreciation costs.
Oil and Gas - Strong revenue performance to support
earnings
Our coverage oil and gas companies are expected to report a
strong revenue growth of about 20.0% yoy. However, owing to
margin pressure (excluding for Cairn India) we expect earnings
to post a muted growth of 2.1% yoy. For Cairn India, we expect
slight improvement in margins (owing to the impact of
INR depreciation and increase in realizations) as well as revenue
performance which is likely to result in a healthy earnings growth
for the company.
Pharmaceuticals - Robust earnings performance to
continue
We expect our coverage pharmaceutical companies to continue
reporting a good set of numbers. Excluding Cipla (for which
corresponding consolidated figures are not available for
3QFY2013), we expect a strong 41.7% yoy growth in earnings
during the quarter supported by expansion of 17.6% yoy in
revenue and 242bp yoy in margin performance. The strong
performance of exports in the sector has also contributed to
top-line growth. We expect Sensex pharmaceutical companies
to post a 27.5% yoy top-line growth and margin expansion of
296bp yoy, resulting in a robust 43.9% yoy increase in the
bottom-line.
Telecom - Expect improvement in overall performance
During the quarter, we expect our coverage telecom companies
to report a good set of numbers. We expect healthy revenue
growth for the industry on the back of increase in MOU, uptick
in voice ARPM as well as growing data users, and improvement
in margin performance. Amongst the top three operators, we
expect Idea Cellular (Idea) to lead in terms of revenue growth
followed by Bharti Airtel (Bharti) and Reliance Communications
(RCom). We expect Idea to post a 4.1% sequential revenue
growth while Bharti and RCom are expected to post a revenue
growth of 2.0% and 1.7% qoq, respectively. On the margins
front, we expect the EBITDA margin of Bharti and Idea to see
marginal uptick while the EBITDA margin of RCom is expected
to decline by 94bp qoq.

Refer to important Disclosures at the end of the report 6
3QFY2014 Results Preview | | | | | January 3, 2014
Strategy
Fed embarks on tapering of bond purchases;rates to remain low
The Federal Reserve (Fed) in its recent Federal Open Market
Committee meeting decided to moderately taper its quantitative
easing (QE3) program beginning January 2014 by USD10bn
per month. The Fed has decided to reduce its monthly asset
purchases from USD85bn since September 2012 to USD75bn.
It will cut down on the pace of purchase of treasury securities by
USD5bn to USD40bn and mortgage backed securities (MBS)
by USD5bn to USD35bn.
It appears that a further reduction in the stimulus would ensue
at a measured pace through much of next year and in case
improvement in the labor market continues as expected, the
program is likely to be fully shuttered by late-2014. But at the
same time, the Fed's stance continued to be dovish and it
reiterated its commitment to an accommodative monetary policy
stance to support growth. The Fed continued to indicate that
the policy rate (at 0.25%, presently) would be maintained at
exceptionally low levels at least as long as the unemployment
rate reaches above 6.5% and price stability is maintained at or
below its 2% medium-term objective.
Markets have taken the Fed's announcement on gradual
withdrawal of stimulus in their stride since our external
Source: RBI, Angel Research
Exhibit 4: Sharp narrowing in the CAD during 2QFY14
(4.3) (4.4)(4.0)
(5.0)
(6.5)
(3.6)
(4.9)
(1.2)
(8)
(7)
(6)
(5)
(4)
(3)
(2)
(1)
-
(35)
(30)
(25)
(20)
(15)
(10)
(5)
-
3Q12 4Q12 1Q13 2Q13 3Q13 4Q13 1Q14 2Q14
(% of GDP)(USD bn) CAD as % of GDP (RHS)
Source: Ministry of Commerce, Angel Research
Exhibit 5: Positive improvement in the trade balance
(20)
(10)
-
10
20
30
40
(25)
(20)
(15)
(10)
(5)
-
(%)(USD bn)
Trade balance Exports growth (RHS) Imports growth (RHS)
Jan-1
2
Feb
-12
Mar-
12
Apr-
12
May-
12
Jun-1
2
Jul-
12
Aug-1
2
Sep
-12
Oct
-12
Nov-
12
Dec-
12
Jan-1
3
Feb
-13
Mar-
13
Apr-
13
May-
13
Jun-1
3
Jul-
13
Aug-1
3
Sep
-13
Oct
-13
Nov-
13
Source: Bloomberg, Angel Research
Exhibit 6: Stability in the INR despite Fed's QE3 taper
50.0
52.0
54.0
56.0
58.0
60.0
62.0
64.0
66.0
68.0
70.0
Mar-
13
Apr-
13
May-1
3
Jun
-13
Jul-
13
Aug
-13
Sep
-13
Oct
-13
Nov-
13
Dec-1
3
(USDINR)
Source: RBI, Angel Research
Exhibit 7: Rise in forex reserves and import coverImport cover (RHS) Forex reserves
6.0
6.5
7.0
7.5
8.0
8.5
9.0
250
260
270
280
290
300
310
320
Dec-1
2
Jan
-13
Feb
-13
Mar-
13
Apr-
13
May-1
3
Jun
-13
Jul-
13
Aug
-13
Sep
-13
Oct
-13
Nov-
13
(Months)(USD bn)
vulnerability has eased considerably. This positive reaction stands
in contrast with May 2013 when indication of a taper resulted
in immense volatility in the equity and currency markets. We
believe that the strengthening of recovery in the US and other
advanced economies is likely to have a medium-term positive
impact for emerging markets including India since improvement
in external demand would boost export growth and add to GDP
growth in the economy.
Economy on a better footing as external sector becomesresilient
The concerns emanating for the economy from the external
front as global liquidity gets tapered have eased substantially
as our CAD moderated, risks to its financing receded and forex
reserves situation improved. Driven by strong export
performance and also moderation in imports due to a collapse
in domestic demand and curbs on gold imports, the trade deficit
has narrowed to USD33bn in 2QFY2014 from USD48bn in
the corresponding quarter of the previous year. As a result,
during 2QFY2014 the CAD came sharply lower at 1.2% of
GDP as compared to 5.0% of GDP in 2QFY2013. We expect a
sustained improvement in the trade balance to continue going
forward. For FY2014 as a whole, we expect the CAD to come
in at a more manageable level of 2.5-3.0% of GDP as against
a much wider 4.8% of GDP in FY2013.
7
3QFY2014 Results Preview | | | | | January 3, 2014
Refer to important Disclosures at the end of the report
Strategy
The risks surrounding the financing of the CAD have also
receded as the CAD itself has moderated to comfortable levels
and several policy measures have already been taken to garner
capital inflows in the economy. The Reserve Bank of India (RBI)
has attracted about USD34bn under its schemes to attract FCNR
(B) deposits and foreign currency borrowings. Despite reduction
in Fed's stimulus, the INR has remained stable in the 61-63
range as compared to rout in the currency that pushed it to
68-levels against the dollar in August 2013, post which timely
policy measures and improved fundamentals supported the
currency to stage a recovery.
Respite from inflation likely on signs of moderation invegetable prices
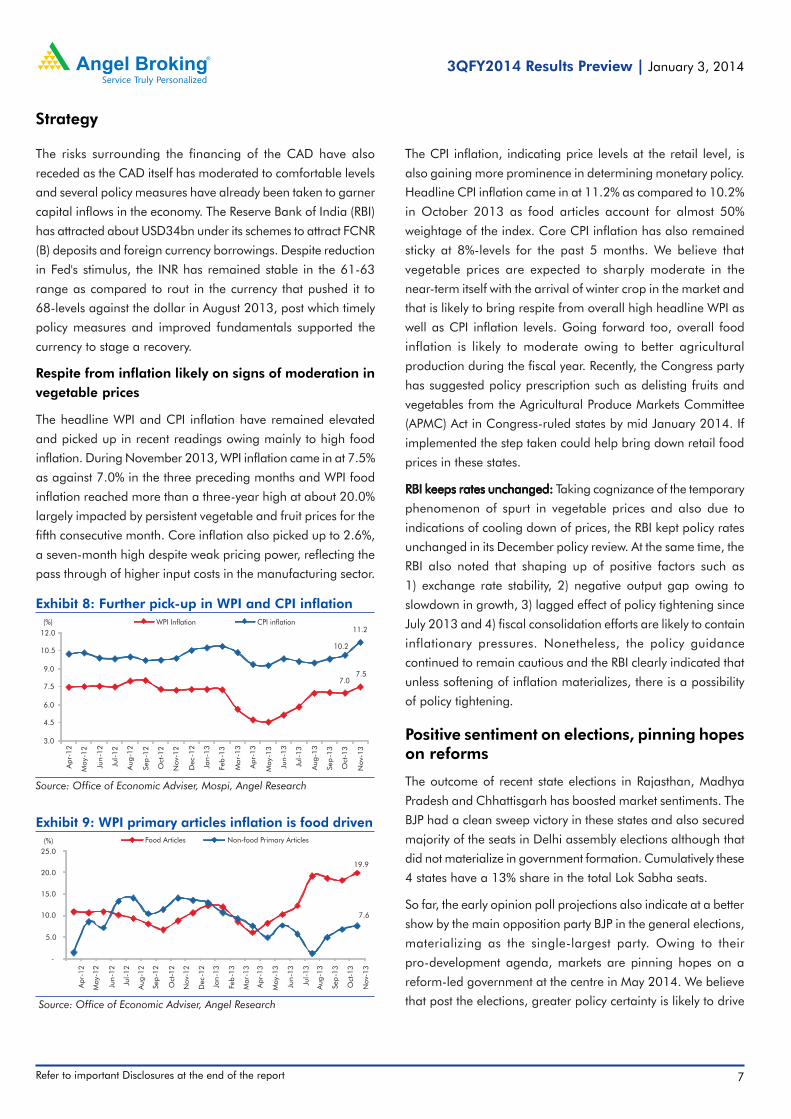
The headline WPI and CPI inflation have remained elevated
and picked up in recent readings owing mainly to high food
inflation. During November 2013, WPI inflation came in at 7.5%
as against 7.0% in the three preceding months and WPI food
inflation reached more than a three-year high at about 20.0%
largely impacted by persistent vegetable and fruit prices for the
fifth consecutive month. Core inflation also picked up to 2.6%,
a seven-month high despite weak pricing power, reflecting the
pass through of higher input costs in the manufacturing sector.
The CPI inflation, indicating price levels at the retail level, is
also gaining more prominence in determining monetary policy.
Headline CPI inflation came in at 11.2% as compared to 10.2%
in October 2013 as food articles account for almost 50%
weightage of the index. Core CPI inflation has also remained
sticky at 8%-levels for the past 5 months. We believe that
vegetable prices are expected to sharply moderate in the
near-term itself with the arrival of winter crop in the market and
that is likely to bring respite from overall high headline WPI as
well as CPI inflation levels. Going forward too, overall food
inflation is likely to moderate owing to better agricultural
production during the fiscal year. Recently, the Congress party
has suggested policy prescription such as delisting fruits and
vegetables from the Agricultural Produce Markets Committee
(APMC) Act in Congress-ruled states by mid January 2014. If
implemented the step taken could help bring down retail food
prices in these states.
RBI keeps rates unchanged:RBI keeps rates unchanged:RBI keeps rates unchanged:RBI keeps rates unchanged:RBI keeps rates unchanged: Taking cognizance of the temporary
phenomenon of spurt in vegetable prices and also due to
indications of cooling down of prices, the RBI kept policy rates
unchanged in its December policy review. At the same time, the
RBI also noted that shaping up of positive factors such as
1) exchange rate stability, 2) negative output gap owing to
slowdown in growth, 3) lagged effect of policy tightening since
July 2013 and 4) fiscal consolidation efforts are likely to contain
inflationary pressures. Nonetheless, the policy guidance
continued to remain cautious and the RBI clearly indicated that
unless softening of inflation materializes, there is a possibility
of policy tightening.
Positive sentiment on elections, pinning hopeson reforms
The outcome of recent state elections in Rajasthan, Madhya
Pradesh and Chhattisgarh has boosted market sentiments. The
BJP had a clean sweep victory in these states and also secured
majority of the seats in Delhi assembly elections although that
did not materialize in government formation. Cumulatively these
4 states have a 13% share in the total Lok Sabha seats.
So far, the early opinion poll projections also indicate at a better
show by the main opposition party BJP in the general elections,
materializing as the single-largest party. Owing to their
pro-development agenda, markets are pinning hopes on a
reform-led government at the centre in May 2014. We believe
that post the elections, greater policy certainty is likely to drive
Source: Office of Economic Adviser, Mospi, Angel Research
Exhibit 8: Further pick-up in WPI and CPI inflationWPI Inflation CPI inflation
7.07.5
10.2
11.2
3.0
4.5
6.0
7.5
9.0
10.5
12.0
Apr-
12
May-1
2
Jun
-12
Jul-
12
Aug
-12
Sep
-12
Oct
-12
Nov-
12
Dec-1
2
Jan
-13
Feb
-13
Mar-
13
Apr-
13
May-1
3
Jun
-13
Jul-
13
Aug
-13
Sep
-13
Oct
-13
Nov-
13
(%)
Source: Office of Economic Adviser, Angel Research
Exhibit 9: WPI primary articles inflation is food driven
Apr-
12
May-
12
Jun
-12
Jul-
12
Aug
-12
Sep
-12
Oct
-12
Nov-
12
Dec-1
2
Jan
-13
Feb
-13
Mar-
13
Apr-
13
May-
13
Jun
-13
Jul-
13
Aug
-13
Sep
-13
Oct
-13
Nov-
13
19.9
7.6
-
5.0
10.0
15.0
20.0
25.0
(%) Food Articles Non-food Primary Articles

Refer to important Disclosures at the end of the report 8
3QFY2014 Results Preview | | | | | January 3, 2014
Strategy
Source: Election Commission of India, Angel Research
Exhibit 10: BJP sweeps majority seats in state elections20082008200820082008 20132013201320132013 Swing inSwing inSwing inSwing inSwing in 2013 seat2013 seat2013 seat2013 seat2013 seat
seatsseatsseatsseatsseats share (%)share (%)share (%)share (%)share (%)
RajasthanRajasthanRajasthanRajasthanRajasthan
BJP 78 162 84 81.4
Congress 96 21 (75) 10.6
Others 26 16 (10) 8.0
ChhattisgarhChhattisgarhChhattisgarhChhattisgarhChhattisgarh
BJP 50 49 (1) 54.4
Congress 38 39 1 43.3
Others 2 2 - 2.2
Madhya PMadhya PMadhya PMadhya PMadhya Pradeshradeshradeshradeshradesh
BJP 143 165 22 71.7
Congress 71 58 (13) 25.2
Others 16 7 (9) 3.0
DelhiDelhiDelhiDelhiDelhi
BJP 23 32 9 45.7
Congress 43 8 (35) 11.4
AAP - 28 28 40.0
Others 4 2 (2) 2.9
new project announcements and stimulating capex. In our view,
the formation of a strong government will firmly bring back the
focus on creating more employment and boosting infrastructure
investment to kick-start growth in the economy.
Outlook and Valuation
We are anticipating markets to gain positively on the back of
supportive global cues as well as our improving domestic
economic outlook. Our external sector is more resilient now as
the trade deficit has narrowed owing to the boost from export
performance and moderation in import demand. We expect a
revival in the economy as the investment cycle is boosted post
elections owing to greater policy certainty and we also expect
monetary policy to support growth in 2HCY2014 as food
inflation cools down. With these positives shaping up, we
attribute a 16x multiple to our Sensex EPS and arrive at a target
of 24,600 for the Sensex over the next one year implying an
upside of nearly 17.0% from the present levels.
We continue to maintain a positive outlook on export-oriented
sectors like IT and pharmaceuticals supported by the growth
revival in advanced economies and the rupee depreciation on
a yoy basis. We also maintain a positive view on select metal
stocks, considering recent capacity additions and under-utilized
capacity getting employed for exports, aided by improving
global fundamentals. Amongst cyclicals we continue to prefer
large private banks, as these are likely to benefit from an
imminent economic revival since they continue to remain
structurally strong.
Source: Angel Research
Exhibit 11: Sensex EPS growth over FY2013-15
1,169
1,305
1,535
500
700
900
1,100
1,300
1,500
1,700
FY2013 FY2014E FY2015E
(`)
11.6% growth17.7% growth
Source: Angel Research
Exhibit 12: Sensex one-year forward P/E
5.0
10.0
15.0
20.0
25.0
30.0
Dec-01 Dec-03 Dec-05 Dec-07 Dec-09 Dec-11 Dec-13
Sensex 1 year forward P/E 15 year Avg 5 year Avg

9
3QFY2014 Results Preview | | | | | January 3, 2014
Refer to important Disclosures at the end of the report
3QFY2014 Sectoral Outlook
Refer to important Disclosures at the end of the report 10
3QFY2014 Results Preview | | | | | January 3, 2014
Automobile
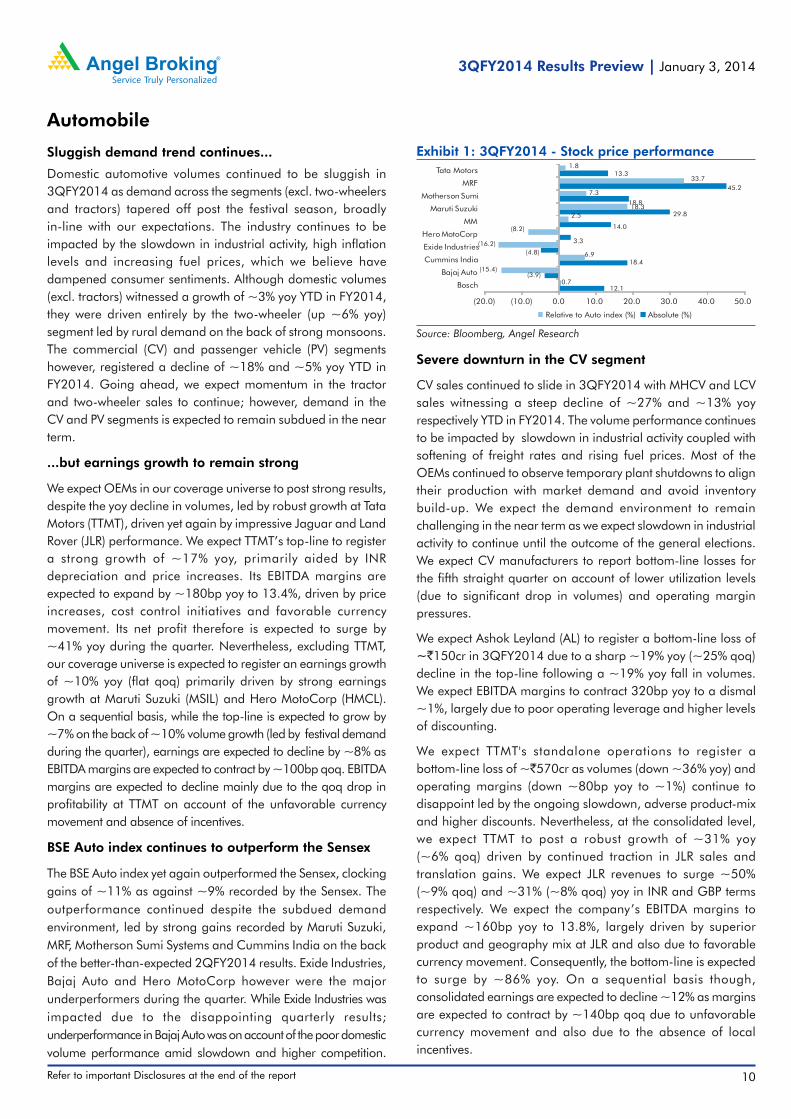
Sluggish demand trend continues...
Domestic automotive volumes continued to be sluggish in3QFY2014 as demand across the segments (excl. two-wheelersand tractors) tapered off post the festival season, broadlyin-line with our expectations. The industry continues to beimpacted by the slowdown in industrial activity, high inflationlevels and increasing fuel prices, which we believe havedampened consumer sentiments. Although domestic volumes(excl. tractors) witnessed a growth of ~3% yoy YTD in FY2014,they were driven entirely by the two-wheeler (up ~6% yoy)segment led by rural demand on the back of strong monsoons.The commercial (CV) and passenger vehicle (PV) segmentshowever, registered a decline of ~18% and ~5% yoy YTD inFY2014. Going ahead, we expect momentum in the tractorand two-wheeler sales to continue; however, demand in theCV and PV segments is expected to remain subdued in the nearterm.
...but earnings growth to remain strong
We expect OEMs in our coverage universe to post strong results,despite the yoy decline in volumes, led by robust growth at TataMotors (TTMT), driven yet again by impressive Jaguar and LandRover (JLR) performance. We expect TTMT’s top-line to registera strong growth of ~17% yoy, primarily aided by INRdepreciation and price increases. Its EBITDA margins areexpected to expand by ~180bp yoy to 13.4%, driven by priceincreases, cost control initiatives and favorable currencymovement. Its net profit therefore is expected to surge by~41% yoy during the quarter. Nevertheless, excluding TTMT,our coverage universe is expected to register an earnings growthof ~10% yoy (flat qoq) primarily driven by strong earningsgrowth at Maruti Suzuki (MSIL) and Hero MotoCorp (HMCL).On a sequential basis, while the top-line is expected to grow by~7% on the back of ~10% volume growth (led by festival demandduring the quarter), earnings are expected to decline by ~8% asEBITDA margins are expected to contract by ~100bp qoq. EBITDAmargins are expected to decline mainly due to the qoq drop inprofitability at TTMT on account of the unfavorable currencymovement and absence of incentives.
BSE Auto index continues to outperform the Sensex
The BSE Auto index yet again outperformed the Sensex, clockinggains of ~11% as against ~9% recorded by the Sensex. Theoutperformance continued despite the subdued demandenvironment, led by strong gains recorded by Maruti Suzuki,MRF, Motherson Sumi Systems and Cummins India on the backof the better-than-expected 2QFY2014 results. Exide Industries,Bajaj Auto and Hero MotoCorp however were the majorunderperformers during the quarter. While Exide Industries wasimpacted due to the disappointing quarterly results;underperformance in Bajaj Auto was on account of the poor domesticvolume performance amid slowdown and higher competition.
Source: Bloomberg, Angel Research
Exhibit 1: 3QFY2014 - Stock price performance
Relative to Auto index (%) Absolute (%)
12.1
(3.9)
18.4
(4.8)
3.3
14.0
29.8
18.8
45.2
13.3
0.7
(15.4)
6.9
(16.2)
(8.2)
2.5
18.3
7.3
33.7
1.8
(20.0) (10.0) 0.0 10.0 20.0 30.0 40.0 50.0
MRF
Tata Motors
Severe downturn in the CV segment
CV sales continued to slide in 3QFY2014 with MHCV and LCVsales witnessing a steep decline of ~27% and ~13% yoyrespectively YTD in FY2014. The volume performance continuesto be impacted by slowdown in industrial activity coupled withsoftening of freight rates and rising fuel prices. Most of theOEMs continued to observe temporary plant shutdowns to aligntheir production with market demand and avoid inventorybuild-up. We expect the demand environment to remainchallenging in the near term as we expect slowdown in industrialactivity to continue until the outcome of the general elections.We expect CV manufacturers to report bottom-line losses forthe fifth straight quarter on account of lower utilization levels(due to significant drop in volumes) and operating marginpressures.
We expect Ashok Leyland (AL) to register a bottom-line loss of~`150cr in 3QFY2014 due to a sharp ~19% yoy (~25% qoq)decline in the top-line following a ~19% yoy fall in volumes.We expect EBITDA margins to contract 320bp yoy to a dismal~1%, largely due to poor operating leverage and higher levelsof discounting.
We expect TTMT's standalone operations to register abottom-line loss of ~`570cr as volumes (down ~36% yoy) andoperating margins (down ~80bp yoy to ~1%) continue todisappoint led by the ongoing slowdown, adverse product-mixand higher discounts. Nevertheless, at the consolidated level,we expect TTMT to post a robust growth of ~31% yoy(~6% qoq) driven by continued traction in JLR sales andtranslation gains. We expect JLR revenues to surge ~50%(~9% qoq) and ~31% (~8% qoq) yoy in INR and GBP termsrespectively. We expect the company’s EBITDA margins toexpand ~160bp yoy to 13.8%, largely driven by superiorproduct and geography mix at JLR and also due to favorablecurrency movement. Consequently, the bottom-line is expectedto surge by ~86% yoy. On a sequential basis though,consolidated earnings are expected to decline ~12% as marginsare expected to contract by ~140bp qoq due to unfavorablecurrency movement and also due to the absence of localincentives.

11
3QFY2014 Results Preview | | | | | January 3, 2014
Refer to important Disclosures at the end of the report
Automobile
Source: Company; Angel Research
Exhibit 2: TTMT and AL – Quarterly volumes
SegmentSegmentSegmentSegmentSegment 3QFY20143QFY20143QFY20143QFY20143QFY2014 3QFY20133QFY20133QFY20133QFY20133QFY2013 yoy (%)yoy (%)yoy (%)yoy (%)yoy (%) 9MFY20149MFY20149MFY20149MFY20149MFY2014 9MFY20139MFY20139MFY20139MFY20139MFY2013 yoy (%)yoy (%)yoy (%)yoy (%)yoy (%)
TTMTTTMTTTMTTTMTTTMT 130,353130,353130,353130,353130,353 203,852203,852203,852203,852203,852 (36.1)(36.1)(36.1)(36.1)(36.1) 434,991434,991434,991434,991434,991 613,716613,716613,716613,716613,716 (29.1)(29.1)(29.1)(29.1)(29.1)
Total CV 95,377 149,402 (36.2) 325,886 424,703 (23.3)
Total PV 34,976 54,450 (35.8) 109,105 189,013 (42.3)
Exports (incl. above) 11,225 11,654 (3.7) 36,260 39,403 (8.0)
ALALALALAL 18,45318,45318,45318,45318,453 22,66122,66122,66122,66122,661 (18.6)(18.6)(18.6)(18.6)(18.6) 63,25463,25463,25463,25463,254 80,08480,08480,08480,08480,084 (21.0)(21.0)(21.0)(21.0)(21.0)
MHCV 10,698 14,576 (26.6) 41,478 55,453 (25.2)
LCV ( incl. Dost) 7,755 8,085 (4.1) 21,776 24,631 (11.6)
Exports (incl. above) 1,713 1,702 0.6 6,146 6,788 (9.5)
Exhibit 4: BJAUT, HMCL and TVSL – Quarterly volumes
SegmentSegmentSegmentSegmentSegment 3QFY20143QFY20143QFY20143QFY20143QFY2014 3QFY20133QFY20133QFY20133QFY20133QFY2013 yoy (%)yoy (%)yoy (%)yoy (%)yoy (%) 9MFY20149MFY20149MFY20149MFY20149MFY2014 9MFY20139MFY20139MFY20139MFY20139MFY2013 yoy (%)yoy (%)yoy (%)yoy (%)yoy (%)
BJABJABJABJABJAUTUTUTUTUT 993,690993,690993,690993,690993,690 1,127,7411,127,7411,127,7411,127,7411,127,741 (11.9)(11.9)(11.9)(11.9)(11.9) 2,934,2952,934,2952,934,2952,934,2952,934,295 3,255,9203,255,9203,255,9203,255,9203,255,920 (9.9)(9.9)(9.9)(9.9)(9.9)
Motorcycles 887,671 986,263 (10.0) 2,597,112 2,897,410 (10.4)
Three-wheelers 106,019 141,478 (25.1) 337,183 358,510 (5.9)
Exports (incl. above) 422,506 376,222 12.3 1,186,099 1,182,152 0.3
HMCLHMCLHMCLHMCLHMCL 1,680,9401,680,9401,680,9401,680,9401,680,940 1,573,1351,573,1351,573,1351,573,1351,573,135 6.96.96.96.96.9 4,656,1544,656,1544,656,1544,656,1544,656,154 4,546,2304,546,2304,546,2304,546,2304,546,230 2.42.42.42.42.4
TVSLTVSLTVSLTVSLTVSL 519,308519,308519,308519,308519,308 518,496518,496518,496518,496518,496 0.20.20.20.20.2 1,520,4191,520,4191,520,4191,520,4191,520,419 1,523,6551,523,6551,523,6551,523,6551,523,655 (0.2)(0.2)(0.2)(0.2)(0.2)
Two-wheelers 498,941 504,894 (1.2) 1,460,889 1,488,761 (1.9)
Three-wheelers 20,367 13,602 49.7 59,530 34,894 70.6
Exports (incl. above) 74,289 58,894 26.1 227,590 179,627 26.7
Source: Company; Angel Research
Exhibit 3: MSIL and MM – Quarterly volumes
SegmentSegmentSegmentSegmentSegment 3QFY20143QFY20143QFY20143QFY20143QFY2014 3QFY20133QFY20133QFY20133QFY20133QFY2013 yoy (%)yoy (%)yoy (%)yoy (%)yoy (%) 9MFY20149MFY20149MFY20149MFY20149MFY2014 9MFY20139MFY20139MFY20139MFY20139MFY2013yoy (%)yoy (%)yoy (%)yoy (%)yoy (%)
MSILMSILMSILMSILMSIL 288,151288,151288,151288,151288,151 301,453301,453301,453301,453301,453 (4.4)(4.4)(4.4)(4.4)(4.4) 830,171830,171830,171830,171830,171 827,725827,725827,725827,725827,725 0.30.30.30.30.3
Domestic 268,185 268,957 (0.3) 755,093 742,175 1.7
Exports 19,966 32,496 (38.6) 75,078 85,550 (12.2)
MMMMMMMMMM 207,843207,843207,843207,843207,843 211,678211,678211,678211,678211,678 (1.8)(1.8)(1.8)(1.8)(1.8) 582,951582,951582,951582,951582,951 588,361588,361588,361588,361588,361 (0.9)(0.9)(0.9)(0.9)(0.9)
Automotive - domestic120,929 140,378 (13.9) 349,366 389,450 (10.3)
Automotive - exports 8,495 6,500 30.7 21,325 24,690 (13.6)
Tractor - domestic 76,132 62,341 22.1 204,758 165,699 23.6
Tractor - exports 2,287 2,459 (7.0) 7,502 8,522 (12.0)
Source: Company; Angel Research
led by capacity expansion at Honda Motors and Scooters India(HMSI) and Hero MotoCorp coupled with the success of theMaestro and Jupiter models. Motorcycle sales too have revivedand grown strongly by ~12% yoy during the quarter, ledby rural demand and the festival cheer. Going ahead, weexpect the momentum in 2W sales to continue driven byrural demand.
HMCL is expected to lead the earnings growth in the 2W segmentfollowing a strong volume growth of ~7% yoy (~19% qoq), ledby rural demand amid the festival season. We expect EBITDAmargins to improve ~180bp yoy to ~11% led by betterproduct-mix, price increases and also on account of the costreduction initiatives. Consequently the net profit is expected tosurge ~15% yoy (~17% qoq) during the quarter.
We expect Bajaj Auto (BJAUT) to register a ~5% earnings growthdespite a ~2% yoy decline in the top-line. The top-lineperformance is expected to be impacted due to weakness inthe domestic segment (down ~24% yoy), even though the exportvolumes registered a strong growth of ~12% yoy. The company’snet average realization though, is expected to grow strongly by~12% yoy (flat qoq), mainly due to the INR depreciation. Ledby favorable exchange rate, the company’s EBITDA marginsare expected to surge ~180bp yoy to 20.5% during the quarter.
PV sales too remain subdued
The PV segment registered a decline of ~5% yoy YTD in FY2014as challenging macro-economic environment continues toimpact demand. The growth has been affected across all thesegments with the passenger car and utility vehicle segmentsregistering a decline of ~5% and ~6% yoy respectively. Theonly bright spot in the segment remain the rural sales, whichcontinue to hold up well, and strong traction in new launcheslike Grand i10, Amaze and EcoSport. Going ahead, we expectthe sluggish sales trend to continue in the near term as consumersentiments remain subdued.
We expect MSIL to register a strong earnings growth of~24% yoy in 3QFY2014 despite decline in the top-line asEBITDA margins are expected to improve ~310bp yoy to 11.1%on a low base and also due to the impact of Suzuki PowertrainIndia (SPIL) merger. Nonetheless, on a sequential basis, weexpect the top-line to register a growth of ~4%, driven by a~5% qoq growth in volumes on the back of the festival demandduring the quarter. EBITDA margins are likely to decline by~150bp qoq due to adverse product-mix, higher discounts andunfavorable forex movement. As a result, earnings are expectedto decline by ~7% sequentially during the quarter.
Strong scooter sales though insulates the 2W segment
The 2W segment, which registered a growth of ~4% yoy in1HFY2014, has picked up pace and is estimated to have grownby ~12% yoy in 3QFY2014 led by strong rural demand on theback of favorable monsoons. Scooters continued with theirstrong sales momentum and surged by ~25% yoy in 3QFY2014,
Auto ancillaries
Auto ancillary companies in our coverage universe are expectedto post a strong performance on a yoy basis, largely due to thebase effect. However, on a sequential basis the performance isexpected to remain muted due to continued slowdown indemand from OEMs. We expect Motherson Sumi Systems (MSS)to witness a strong earnings growth (yoy as well as sequential)led by continued improvement in utilization at the new plantsand also due to the favorable forex movement.
On a consolidated basis, we expect Apollo Tyres (APTY) toregister a top-line growth of ~5% yoy (down ~2% qoq) drivenprimarily by robust revenue growth in Europe aided by afavorable exchange rate. Domestic and South Africa revenuesare however expected to decline by ~7% and ~4% yoy

Refer to important Disclosures at the end of the report 12
3QFY2014 Results Preview | | | | | January 3, 2014
Automobile
Analyst - YAnalyst - YAnalyst - YAnalyst - YAnalyst - Yaresh Karesh Karesh Karesh Karesh Kothariothariothariothariothari
Exhibit 5: Quarterly estimates – Automobile (`̀̀̀̀ cr)
Source: Company, Angel Research; Note: Price as on December 31, 2013; * Consolidated numbers; ^ OPM adjusted for royalty payment; @ P/E not adjusted for the value of subsidiaries
CompanyCompanyCompanyCompanyCompany CMPCMPCMPCMPCMP Net SalesNet SalesNet SalesNet SalesNet Sales OPM (%)OPM (%)OPM (%)OPM (%)OPM (%) Net PNet PNet PNet PNet Profitrofitrofitrofitrofit EPS (EPS (EPS (EPS (EPS (`̀̀̀̀))))) EPS (EPS (EPS (EPS (EPS (`̀̀̀̀))))) P/E (x)P/E (x)P/E (x)P/E (x)P/E (x) T T T T Targetargetargetargetarget Reco.Reco.Reco.Reco.Reco.
(((((`̀̀̀̀))))) 3QFY14E3QFY14E3QFY14E3QFY14E3QFY14E % chg% chg% chg% chg% chg 3QFY14E3QFY14E3QFY14E3QFY14E3QFY14E chg bpchg bpchg bpchg bpchg bp 3QFY14E3QFY14E3QFY14E3QFY14E3QFY14E % chg% chg% chg% chg% chg 3QFY14E3QFY14E3QFY14E3QFY14E3QFY14E % chg% chg% chg% chg% chg FY13FY13FY13FY13FY13 FY14EFY14EFY14EFY14EFY14E FY15EFY15EFY15EFY15EFY15E FY13FY13FY13FY13FY13 FY14EFY14EFY14EFY14EFY14E FY15EFY15EFY15EFY15EFY15E (((((`̀̀̀̀)))))
Ashok Leyland 17 1,953 (18.9) 1.1 (323) (151) 86.0 (0.6) 86.0 0.6 (1.4) 0.7 28.1 - 26.2 - Neutral
Bajaj Auto 1,911 5,321 (1.7) 20.5 183 861 5.2 29.8 5.2 105.2 120.5 142.0 18.2 15.9 13.5 2,272 Buy
Hero MotoCorp^ 2,075 6,869 11.0 11.0 181 561 15.0 28.1 15.0 106.1 107.9 150.8 19.6 19.2 13.8 2,262 Accum.
Maruti Suzuki 1,763 10,928 (2.4) 11.1 312 620 23.7 20.5 23.7 79.2 96.7 111.1 22.3 18.2 15.9 - Neutral
Mah. & Mah.@ 944 10,415 (3.3) 13.2 199 902 7.8 15.3 7.8 54.7 60.4 65.2 17.2 15.6 14.5 1,050 Accum.
Tata Motors* 376 60,209 30.6 13.8 155 3,353 86.2 10.4 84.5 32.9 41.3 48.3 11.4 9.1 7.8 419 Accum.
TVS Motor 76 2,051 14.0 6.1 19 69 30.8 1.4 30.8 4.4 5.2 6.6 17.4 14.7 11.5 - Neutral
Exhibit 6: Quarterly estimates – Auto Ancillary (`̀̀̀̀ cr)
Source: Company, Angel Research; Note: Price as on December 31, 2013, * Consolidated numbers; # December ending; & Full year EPS is consolidated
CompanyCompanyCompanyCompanyCompany CMPCMPCMPCMPCMP Net SalesNet SalesNet SalesNet SalesNet Sales OPM (%)OPM (%)OPM (%)OPM (%)OPM (%) Net PNet PNet PNet PNet Profitrofitrofitrofitrofit EPS (EPS (EPS (EPS (EPS (`̀̀̀̀))))) EPS (EPS (EPS (EPS (EPS (`̀̀̀̀))))) P/E (x)P/E (x)P/E (x)P/E (x)P/E (x) T T T T Targetargetargetargetarget Reco.Reco.Reco.Reco.Reco.
(((((`̀̀̀̀))))) 3QFY14E3QFY14E3QFY14E3QFY14E3QFY14E % chg% chg% chg% chg% chg 3QFY14E3QFY14E3QFY14E3QFY14E3QFY14E chg bpchg bpchg bpchg bpchg bp 3QFY14E3QFY14E3QFY14E3QFY14E3QFY14E % chg% chg% chg% chg% chg 3QFY14E3QFY14E3QFY14E3QFY14E3QFY14E % chg% chg% chg% chg% chg FY13FY13FY13FY13FY13 FY14EFY14EFY14EFY14EFY14E FY15EFY15EFY15EFY15EFY15E FY13FY13FY13FY13FY13 FY14EFY14EFY14EFY14EFY14E FY15EFY15EFY15EFY15EFY15E (((((`̀̀̀̀)))))
Apollo Tyres* 107 3,368 4.7 12.2 32 189 4.8 3.8 4.8 11.8 14.6 15.8 9.1 7.3 6.8 - Neutral
Bharat Forge& 329 858 27.6 25.9 473 93 95.7 4.0 95.7 7.8 16.9 22.2 42.1 19.5 14.8 - Neutral
Bosch# 10,087 2,221 4.2 15.8 336 239 39.0 76.2 39.0 313.2 369.0 448.6 32.2 27.3 22.5 11,215 Accum.
Exide Industries 123 1,500 2.5 14.5 326 134 28.8 1.6 28.8 6.2 6.8 8.1 20.0 18.2 15.2 135 Accum.
FAG Bearings# 1,614 388 11.8 13.9 199 34 14.0 20.4 14.0 73.0 97.8 125.1 22.1 16.5 12.9 1,751 Accum.
Motherson Sumi* 183 7,610 14.2 9.9 226 302 80.7 5.1 80.7 10.3 11.7 13.6 17.7 15.7 13.4 218 Buy
We expect Motherson Sumi Systems (MSS) to post favorableresults on the back of the improving utilization levels at the newfacilities and also due to INR depreciation. On the consolidatedfront, we expect the top-line to post a strong growth of ~14%yoy (~5% qoq), driven primarily by ~20% and ~13% yoy growthin Samvardhana Motherson Reflectec (SMR) and Peguformrevenues respectively. We expect EBITDA margins to improve~230bp yoy (~30bp qoq) to 9.9%, aided by better utilizationlevels and also due to cost control initiatives. The net profittherefore is expected to register a strong growth of ~81% yoy(~18% qoq) during the quarter.
Outlook
While the near term environment continues to remainchallenging for the automotive sector, we believe the long-termstructural growth drivers for the industry such as GDP growth(leading to increasing affluence of rural and urban consumers),favorable demographics, low penetration levels, entry of globalplayers and easy availability of finance will remain intact. Wecontinue to prefer stocks that have strong fundamentals, highexposure to rural and export markets and command superiorpricing power. WWWWWe maintain our positive view on Bajaj Auto,e maintain our positive view on Bajaj Auto,e maintain our positive view on Bajaj Auto,e maintain our positive view on Bajaj Auto,e maintain our positive view on Bajaj Auto,Mahindra & Mahindra and TMahindra & Mahindra and TMahindra & Mahindra and TMahindra & Mahindra and TMahindra & Mahindra and Tata Motors.ata Motors.ata Motors.ata Motors.ata Motors.
respectively due to a weak demand scenario. We expect EBITDAmargins to improve marginally by ~30bp yoy to 12.2%(flat qoq) leading to an ~5% yoy (down ~14% qoq) growth inearnings.
For Bharat Forge (BHFC), we expect the standalone earnings toswell ~96% yoy largely due to the base effect. Its top-line isexpected to jump ~28% yoy led by ~17% and ~10% yoy growthin volumes and net average realization respectively. Thecompany’s EBITDA margins are expected to improve sharplyby ~470bp yoy to 25.9% driven by better product-mix andfavorable exchange rate. Nevertheless, on a sequential basis,we expect the company’s bottom-line to decline by ~4% asEBITDA margins are expected to contract 50bp qoq due to costpressures.
We expect Bosch (BOS) to post a modest top-line growth of~4% yoy (~3% qoq) largely driven by exports. On the operatingfront, margins are expected to expand by ~340bp yoy (~65bpqoq) to 15.8% led by cost control measures. Consequently, itsnet profit is expected to increase by ~39% yoy (~2% qoq) duringthe quarter.
We expect Exide Industries (EXID) to register a modest top-linegrowth of ~3% yoy (~5% qoq) primarily due to slowdown indemand from OEMs. Nonetheless, we expect its EBITDA marginsto improve ~330bp yoy (~50bp qoq) to 14.5% due to thepricing action and easing of lead prices. As a result, we expectthe company’s bottom-line to register a growth of ~29% yoy(~13% qoq) during the quarter.

13
3QFY2014 Results Preview | | | | | January 3, 2014
Refer to important Disclosures at the end of the report
Banking
Banking stocks outperformed broader markets onimproved liquidity, sentiments
Banking stocks outperformed the broader markets during3QFY2014, as more than two-third of our coverage banksregistered a sequential gain of more than 15%. During thequarter, the RBI normalized its exceptional liquidity tighteningmeasures taken in the previous quarter, as its other structuralmeasures (gold import curbs, swap facility for OMCs banksetc) restored stability in the currency markets. The RBI alsoincreased repo rate once during the quarter by 25bp, so as toanchor inflationary expectations, while it eased systemic liquidityby introducing Term Repos (7 and 14 days) to the extent of0.5% of the NDTL or `40,000cr. Recently it injected another`10,000cr via Term Repos to support advance tax related payoutfrom banks.
As the RBI normalized most of its exceptional liquidity tighteningmeasures, short term rates have come off by 100-125bp qoq(though they are still elevated compared to pre-tightening levels).At the longer end of the interest rate curve, most banks have
Source: RBI, Angel Research
Exhibit 2: FCNR (B) deposits aid deposits growthCredit Gr. (%) Deposits Gr. (%)
10.00
11.00
12.00
13.00
14.00
15.00
16.00
17.00
18.00
19.00
20.00
Jun
-12
Jul-
12
Aug
-12
Sep
-12
Oct
-12
Nov-
12
Dec-1
2
Jan
-13
Feb
-13
Mar-
13
Apr-
13
May-
13
Jun
-13
Jul-
13
Aug
-13
Sep
-13
Oct
-13
Nov-
13
Source: RBI, Angel Research
Exhibit 3: Liquidity remains comfortable
(2,500)
(2,000)
(1,500)
(1,000)
(500)
-
500
Nov-
12
Dec-1
2
Jan
-13
Feb
-13
Mar-
13
Apr-
13
May-
13
Jun
-13
Jul-
13
Aug
-13
Sep
-13
Oct
-13
Nov-
13
Dec-1
3
(` bn)Repo Term Repo MSF
kept their peak retail term deposit rates unchanged from theend of last quarter. Higher short-term funding cost is likely toresult in margin pressures for those banks which have not takencorresponding base rate hikes. Moreover, the un-provided MTMlosses as of 2QFY2014 end would also affect profitability forsome PSU banks (no provisioning required for new private bankson that count as they have already provided fully).
Overall, we expect earnings divergence amongst our coveragebanking stocks to continue during 3QFY2014 as well. We expectour coverage new private banks to deliver earnings growth of17.1% yoy, while our coverage PSU and old private banks areexpected to register bottom-line de-growth of 9.0% and1.5% yoy, respectively.
Credit growth remains moderate; strong FCNR (B)deposit mobilization aids healthy deposit growth
Credit growth for the banking system, after witnessing suddenacceleration in 2QFY2014 to 17.7% yoy aided by shift fromCommercial Paper borrowings to loans, has now againmoderated to 15.3% yoy as of December 13, 2013. Achallenging macro environment and policy woes in select sectorshas affected investment sentiments for quite some time now.Hence incremental credit demand from corporates remainsweak, largely comprising of working capital needs. Goingforward, in our view, credit growth for FY2014 is likely to bearound 15%, as credit disbursement pipeline for banks, asindicated by their Managements, remains thin, largelycomprising of sanctions already in place.
Exhibit 1: 3QFY2014 stock performance(%)(%)(%)(%)(%) Returns (qoq)Returns (qoq)Returns (qoq)Returns (qoq)Returns (qoq) Returns (yoy)Returns (yoy)Returns (yoy)Returns (yoy)Returns (yoy)
Indian Bank 72.3 (41.7)
OBC 58.1 (34.6)
Bank of India 50.6 (30.6)
Federal Bank 47.7 (21.9)
Syndicate Bank 39.8 (26.2)
PNB 32.8 (47.0)
Dena Bank 35.8 (28.1)
BOB 30.3 (4.2)
UCO Bank 30.8 (25.5)
Axis Bank 28.8 (20.2)
Yes Bank 28.9 (4.2)
Canara Bank 27.5 (43.2)
J&K Bank 24.3 (3.5)
Allahabad Bank 25.1 (44.1)
ICICI Bank 26.1 10.9
Andhra Bank 21.4 (46.8)
Union Bank 18.6 (9.4)
LIC HF 16.6 (39.8)
IOB 16.7 (24.7)
IDBI Bank 12.3 (1.9)
HDFC Bank 13.7 (40.4)
Vijaya Bank 9.4 (25.9)
SBI 9.2 9.0
Corp Bank 7.1 (43.4)
United Bank 6.6 (60.0)
HDFC 2.5 (25.4)
South Indian Bank (SIB) 4.0 (4.1)
Central Bank 1.7 (39.0)
Bank of Maharashtra (3.9) (40.3)
Source: Bloomberg, Angel Research
Refer to important Disclosures at the end of the report 14
3QFY2014 Results Preview | | | | | January 3, 2014
Banking
Exhibit 5: 2QFY2014 and 3QFY2014 – Lending and deposit rates
Source: Company, Angel Research; Note: * peak retail tern deposit rates in 1-3 year maturity bucket
Avg Avg Avg Avg Avg. Base rates (%). Base rates (%). Base rates (%). Base rates (%). Base rates (%) Avg Avg Avg Avg Avg. BPLR rates (%). BPLR rates (%). BPLR rates (%). BPLR rates (%). BPLR rates (%) FD rates* (%) FD rates* (%) FD rates* (%) FD rates* (%) FD rates* (%)
BankBankBankBankBank 2QFY142QFY142QFY142QFY142QFY14 3QFY143QFY143QFY143QFY143QFY14 bp changebp changebp changebp changebp change 2QFY142QFY142QFY142QFY142QFY14 3QFY143QFY143QFY143QFY143QFY14 bp changebp changebp changebp changebp change 2QFY142QFY142QFY142QFY142QFY14 3QFY143QFY143QFY143QFY143QFY14 bp changebp changebp changebp changebp change
SBI 9.71 9.91 20 14.46 14.66 20 9.00 9.00 -
HDFC Bank 9.73 9.92 20 18.23 18.42 20 9.00 9.00 -
Federal Bank 10.32 10.50 18 17.75 17.75 - 8.75 9.00 25
Bank of India 10.08 10.25 17 14.50 14.50 - 9.00 9.05 5
Union Bank 10.09 10.25 16 14.60 14.75 15 9.00 9.00 -
ICICI Bank 9.86 10.00 14 18.61 18.75 14 9.00 9.00 -
Axis Bank 10.12 10.25 13 17.87 18.00 13 9.00 9.00 -
Bank of Maharashtra 10.14 10.25 11 15.00 15.00 - 9.25 9.10 (15)
Central Bank 10.15 10.25 10 15.00 15.00 - 8.75 8.75 -
Yes Bank 10.67 10.75 8 19.75 19.75 - 9.10 9.10 -
Andhra Bank 10.17 10.25 8 14.42 14.50 8 9.50 9.20 (30)
IOB 10.25 10.25 - 15.50 15.50 - 9.00 9.00 -
J&K Bank 10.25 10.25 - 14.75 14.75 - 8.75 8.75 -
United Bank 10.25 10.25 - 14.60 14.60 0 9.00 9.25 25
Syndicate Bank 10.25 10.25 - 14.50 14.50 - 9.30 9.10 (20)
BOB 10.25 10.25 - 14.50 14.50 - 8.75 9.05 30
PNB 10.25 10.25 - 14.00 14.00 - 9.00 9.00 -
Corp Bank 10.25 10.25 - 15.00 15.00 - 9.00 9.00 -
OBC 10.25 10.25 - 14.75 14.75 - 9.00 9.00 -
Dena Bank 10.25 10.25 - 15.75 15.75 - 9.10 9.00 (10)
IDBI Bank 10.25 10.25 - 14.75 14.75 - 9.00 9.40 40
South Indian Bank 10.50 10.50 - 19.00 19.00 - 9.25 9.25 -
Allahabad Bank 10.20 10.20 (0) 14.45 14.45 (0) 9.00 9.00 -
UCO Bank 10.20 10.20 (0) 14.50 14.50 - 9.00 9.00 -
Indian Bank 10.20 10.20 (0) 14.50 14.50 - 9.00 9.00 -
Vijaya Bank 10.20 10.20 (0) 14.75 14.75 - 9.00 9.30 30
Canara Bank 9.97 9.95 (2) 14.34 14.20 (14) 8.80 9.05 25
Aided by strong accretion in FCNR (B) deposits under the RBI'sconcessional swap scheme, deposits for the banking systemgrew at 17.0% yoy as of December 13, 2013 (influx of FCNR(B) deposits aided deposit growth by around 100bp). Recentinflation readings have increased mainly on account of highfood prices. With sharp correction already in vegetable prices,expectations of healthy Agri harvests this year, softening globalcommodity prices and moderate MSP revisions this year, foodinflation should eventually taper off, leading to moderation inoverall inflation readings as well. Hence, we expect core depositgrowth (deposits excluding FCNR (B) deposits) to improve goingahead, as we expect overall retail inflation to moderate.
Margins to find respite in nearly flat deposit rates andstrong influx of FCNR (B) deposits
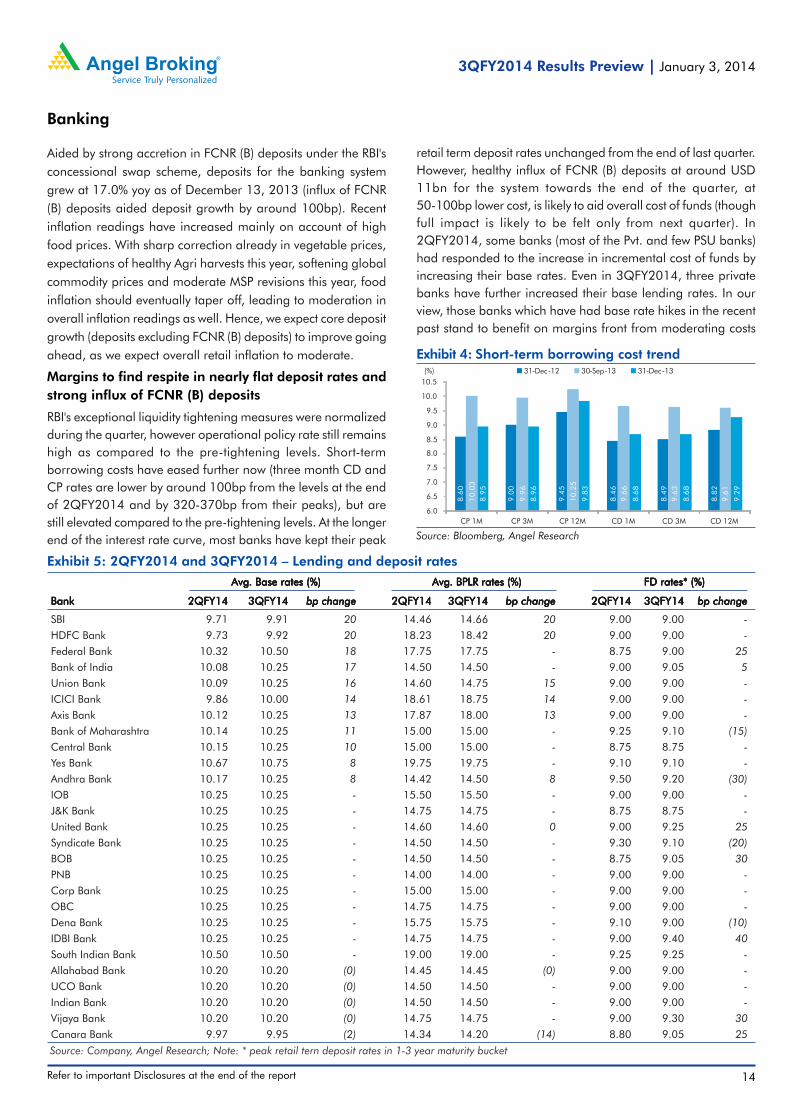
RBI's exceptional liquidity tightening measures were normalizedduring the quarter, however operational policy rate still remainshigh as compared to the pre-tightening levels. Short-termborrowing costs have eased further now (three month CD andCP rates are lower by around 100bp from the levels at the endof 2QFY2014 and by 320-370bp from their peaks), but arestill elevated compared to the pre-tightening levels. At the longerend of the interest rate curve, most banks have kept their peak
retail term deposit rates unchanged from the end of last quarter.However, healthy influx of FCNR (B) deposits at around USD11bn for the system towards the end of the quarter, at50-100bp lower cost, is likely to aid overall cost of funds (thoughfull impact is likely to be felt only from next quarter). In2QFY2014, some banks (most of the Pvt. and few PSU banks)had responded to the increase in incremental cost of funds byincreasing their base rates. Even in 3QFY2014, three privatebanks have further increased their base lending rates. In ourview, those banks which have had base rate hikes in the recentpast stand to benefit on margins front from moderating costs
Source: Bloomberg, Angel Research
Exhibit 4: Short-term borrowing cost trend
8.6
0
9.0
0
9.4
5
8.4
6
8.4
9
8.8
2
10.0
3
9.9
6
10.2
5
9.6
6
9.6
3
9.6
1
8.9
5
8.9
6
9.8
3
8.6
8
8.6
8
9.2
9
6.0
6.5
7.0
7.5
8.0
8.5
9.0
9.5
10.0
10.5
CP 1M CP 3M CP 12M CD 1M CD 3M CD 12M
(%) 31-Dec-12 30-Sep-13 31-Dec-13

15
3QFY2014 Results Preview | | | | | January 3, 2014
Refer to important Disclosures at the end of the report
Banking
of funds, aided by nearly flat deposit rates, lower cost ofborrowings qoq and healthy influx of FCNR (B) deposits.
Aided by strong accretion in FCNR (B) deposits under the RBI'sconcessional swap scheme, deposits for the banking systemgrew at 17.0% yoy. Systemic liquidity has improved aided bycapital flows under RBI swap facility for banking capital andFCNR (B) deposits. On back of improved liquidity amidstmoderate credit demand, most of our coverage banks kepttheir peak retail term deposit rates unchanged during thequarter. Four of our coverage banks reduced their retail termdeposit rates by 10-30bp qoq, drawing comfort from ampleliquidity, while seven of them increased their retail term depositrates. Highest increase in retail term deposit rates was witnessed incase of IDBI Bank (40bp qoq), followed by BOB and Vijaya Bank by30bp qoq and Canara Bank and United Bank by 25bp qoq.
As far as lending rates are concerned, three of our coveragebanks further increased their base rates during the quarter (SBIand HDFC Bank by 20bp and Federal Bank by 10bp), citingelevated incremental costs of funds. Hence, on an average basis,the base lending rate would be higher for those three banksand also for eight others which had raised their lending ratessometime in last quarter. Highest sequential increase in baselending rate would be for SBI and HDFC Bank (by 20bp each),followed by Federal Bank, Bank of India and Union Bank (by16-18bp each) and ICICI Bank and Axis Bank (by 13-14bpeach), while in case of Canara Bank it would be lower marginallyby 2bp.
Asset quality pressures likely to remain elevated
Asset quality stress has remained at elevated levels for Indian
banks for quite some time now, and has severely dented the
sector's performance and outlook. Slippages for the banking
industry have continued to trend northwards over the last few
years. Even in 2QFY2014, Indian banks' fresh NPL formation
remained high at 3.1%, which although was slightly better on a
qoq/yoy basis (3.7% in 1QFY2014 and 3.4% in 2QFY2013).
Recent healthy exports growth has provided a much needed
breather to the economy and more specifically to stressed sectors
like textiles. Expectations of sustained moderation in inflation
going ahead owing to lower food inflation is likely to act as a
single biggest positive catalyst for our economy. Sustained
moderation in inflation, as and when it happens, would
eventually provide room to lower interest rates, thereby leading
to improvement in growth, higher savings and investments
mobilization and improvement in asset quality outlook.
Until then, in the near term, while we expect slippages to
moderate here on, they are likely to remain at elevated levels.
Recoveries/upgrades performance can be expected to be better
than earlier, aided by the recent pick up in sale of assets to
ARCs. Overall, we expect net slippages to trend lower here on.
Private banks have not been spared from asset quality pressures,
however, they have not only been reporting much lower
slippages, but have also performed reasonably on the recoveries
and upgrades front and have managed to keep their asset
quality largely intact until now in a challenging economic
environment. Even going ahead, we expect private banks to
continue outperforming their nationalized peers on the asset
quality front.
During 2QFY2014, few banks like Bank of India, Allahabad
Bank, witnessed a sudden spurt in their recoveries from written
off accounts, largely aided by asset sale to ARCs, which
contributed significantly to their earnings for the quarter. Given
the determined efforts across banks to improve their asset quality
before the end of the fiscal, asset sale to ARCs is likely to pick
up further, with media reports suggesting that few banks taken
together have put up assets worth `4,000cr for sale to ARCs
during the quarter (SBI - ̀ 1,200cr, Dena Bank - ̀ 600cr, OBC -
`640cr, Allahabad Bank - `350cr). Healthy quantum of asset
sale to ARCs is likely to remain a significant contributor to
profitability for many of these banks in 3QFY2014.
On the restructuring front, corporate debt restructuring (CDR)referrals have also risen significantly over the last severalquarters, closely tracking the deteriorating economic growth
New private banks to deliver better numbersyet againDuring 3QFY2014, we expect earnings divergence amongstour coverage banking stocks to continue. We expect ourcoverage new private banks to deliver healthy earnings growthof 17.1% yoy, while our coverage PSU and old private banksare expected to register bottom-line de-growth of 9.0% and1.5% yoy, respectively.
New private banks are expected to deliver healthy NII growthof 20.1% yoy, which is expected to aid healthy growth of 15.3%yoy in operating income, dragged by moderate performanceon non-interest income (at 6.9% yoy). On back of healthyoperating profit growth of 18.4% yoy, our coverage new privatebanks are expected to report healthy earnings growth of17.1% yoy. On the other hand, PSU and old private banks areexpected to register moderate NII growth of 10.6% and9.6% yoy, respectively and muted non-interest incomeperformance with yoy de-growth of 4.8% and 21.9%,respectively. Additionally, operating expenses growth for PSUand old private banks is expected to be higher than new privatebanks at 21.6% and 15.3% yoy, respectively. Overall, we expectour coverage PSU and old private banks to register bottom-linede-growth of 9.0% and 1.5% yoy, respectively.

Refer to important Disclosures at the end of the report 16
3QFY2014 Results Preview | | | | | January 3, 2014
Banking
Referred Referred Referred Referred Referred Approved Approved Approved Approved ApprovedNo. of casesNo. of casesNo. of casesNo. of casesNo. of cases Add. (Add. (Add. (Add. (Add. (`̀̀̀̀ cr) cr) cr) cr) cr) No. of casesNo. of casesNo. of casesNo. of casesNo. of cases Add. (Add. (Add. (Add. (Add. (`̀̀̀̀ cr) cr) cr) cr) cr)
FY10 31 20,175 31 17,763
FY11 49 22,614 27 6,615
1QFY12 18 4,595 10 8,141
2QFY12 18 21,095 7 2,095
3QFY12 23 19,187 17 21,364
4QFY12 28 23,012 16 8,001
FY12 87 67,889 50 39,601
1QFY13 41 20,528 17 17,957
2QFY13 33 18,907 18 18,925
3QFY13 25 20,957 35 24,581
4QFY13 31 31,256 39 17,035
FY13 130 91,648 109 78,498
1QFY14 27 39,370 14 21,266
2QFY14 31 24,859 16 22,007
Outstanding 580 362,370 431 272,286
Exhibit 10: CDR snapshot
Source: CDR Cell, Angel Research
environment. Under CDR mechanism, fresh approvals of around`22,000cr in 2QFY2014 (unless the implementation is delayedfor any reason) and the pending cases of around `44,000cr(only those which are approved and implemented during thequarter), would add to the restructuring book of participatingbanks during the current quarter.
As far as the progress on SEB restructuring under the centre'sFinancial Restructuring Plan (FRP) is concerned, so far six states- Tamil Nadu, Uttar Pradesh, Haryana, Rajasthan, MadhyaPradesh and Punjab have finalized restructuring of their short-term debt upto March 2012 under the FRP. Further, CCEA hasalso allowed Jharkhand, Bihar and Andhra Pradesh torestructure their short-term debt upto March 2013 under theFRP. FRP entails conversion of 50% of the short-term debt ofdiscoms into bonds (which would be eventually taken over bystates over a period of 2-5 years), while the balance 50% wouldbe restructured by the banks. Conversion of short-term debt tobonds (priced at around 9-10%) would result in 200-300bpreduction in yields for banks and would be negative for banksfrom an NIM perspective. At the same time, it would also entailrelease of 300-325bp provisioning on this debt (part of whichis converted to bonds), making the arrangement positive on an
overall basis.
As indicated by their Managements, the restructuring pipeline
appears sizable for banks like Canara Bank (~`6,500cr of which
~`3,000cr would be discoms under FRP), SBI (~`6,000cr over
Source: Company, Angel Research
Exhibit 9: Net NPA trend (%) for the banking industry
1.08 1.071.00 0.99
1.04
1.281.36
1.30
1.49
1.741.80
1.72
2.09
2.25
0.90
1.10
1.30
1.50
1.70
1.90
2.10
2.30
2.50
1Q
FY11
2Q
FY11
3Q
FY11
4Q
FY11
1Q
FY12
2Q
FY12
3Q
FY12
4Q
FY12
1Q
FY13
2Q
FY13
3Q
FY13
4Q
FY13
1Q
FY14
2Q
FY14
Source: Company, Angel Research
Exhibit 8: Gross NPA trend (%) for the banking industry
2.43 2.472.40
2.282.43
2.732.85 2.80
3.09
3.413.49
3.32
3.80
4.02
2.10
2.30
2.50
2.70
2.90
3.10
3.30
3.50
3.70
3.90
4.10
4.30
1Q
FY1
1
2Q
FY1
1
3Q
FY1
1
4Q
FY1
1
1Q
FY1
2
2Q
FY1
2
3Q
FY1
2
4Q
FY1
2
1Q
FY1
3
2Q
FY1
3
3Q
FY1
3
4Q
FY1
3
1Q
FY1
4
2Q
FY1
4
Source: Company, Angel Research
Exhibit 6: Gross NPA trends (%) – Private vs PSU
2.80 2.702.57
2.362.33 2.24 2.17
2.01 2.05 2.06 2.00 1.90 2.00 2.02
2.34 2.42 2.35 2.272.45
2.853.02 2.98
3.34
3.75 3.873.67
4.264.52
1.50
2.00
2.50
3.00
3.50
4.00
4.50
5.00
1Q
FY1
1
2Q
FY1
1
3Q
FY1
1
4Q
FY1
1
1Q
FY1
2
2Q
FY1
2
3Q
FY1
2
4Q
FY1
2
1Q
FY1
3
2Q
FY1
3
3Q
FY1
3
4Q
FY1
3
1Q
FY1
4
2Q
FY1
4
Pvt Banks PSU Banks
Source: Company, Angel Research
Exhibit 7: Net NPA trends (%) – Private vs PSU
0.920.79
0.690.56 0.56 0.54 0.54 0.46 0.49 0.54 0.55 0.53 0.62 0.66
1.121.131.07 1.09 1.16
1.47 1.56 1.501.73
2.04 2.12 2.01
2.472.65
0.00
0.50
1.00
1.50
2.00
2.50
3.00
1Q
FY1
1
2Q
FY1
1
3Q
FY1
1
4Q
FY1
1
1Q
FY1
2
2Q
FY1
2
3Q
FY1
2
4Q
FY1
2
1Q
FY1
3
2Q
FY1
3
3Q
FY1
3
4Q
FY1
3
1Q
FY1
4
2Q
FY1
4
Pvt Banks PSU Banks
the next few quarters), Union Bank (~`3,000cr, majority of which
comprises discom restructuring under FRP), OBC (~`2,300cr),
Syndicate Bank (~`2,100cr, majority of which comprises
discoms under FRP), Andhra Bank (~`3,000cr) and Central
Bank (~`2,000cr).

17
3QFY2014 Results Preview | | | | | January 3, 2014
Refer to important Disclosures at the end of the report
Banking
Source:C-line, Angel Research, Note:* For PSU banks excl. SBI and IDBI
Exhibit 13: PSU banks’ price band (P/ABV)*
0.30
0.60
0.90
1.20
1.50
1.80
2.10
Dec-0
4
Jun
-05
Dec-0
5
Jun
-06
Dec-0
6
Jun
-07
Dec-0
7
Jun
-08
Dec-0
8
Jun
-09
Dec-0
9
Jun
-10
Dec-1
0
Jun
-11
Dec-1
1
Jun
-12
Dec-1
2
Jun
-13
Dec-1
3
Source:C-line, Angel Research, Note:*under our coverage
Exhibit 14: New Private banks’ price band (P/ABV)*
0.50
1.00
1.50
2.00
2.50
3.00
3.50
4.00
Dec-0
4
Jul-
05
Feb
-06
Sep
-06
Apr-
07
Nov-
07
Jun
-08
Jan
-09
Aug
-09
Mar-
10
Oct
-10
May-
11
Dec-1
1
Jul-
12
Feb
-13
Sep
-13
IndustryIndustryIndustryIndustryIndustry No.No.No.No.No. AggAggAggAggAgg. Debt (. Debt (. Debt (. Debt (. Debt (`̀̀̀̀ cr) cr) cr) cr) cr) %%%%%
Iron& Steel 46 41,812 21.3
Infrastructure 20 35,543 18.1
Textiles 47 19,545 10.0
Power 13 17,225 8.8
Telecom 5 9,808 5.0
Ship-Breaking/Ship Building 3 6,732 3.4
Pharmaceuticals 9 6,375 3.3
NBFC 6 6,257 3.2
Paper/Packaging 15 5,280 2.7
Sugar 16 4,955 2.5
Petrochemicals 2 4,852 2.5
Hospitality 10 4,806 2.5
Fertilizers 6 4,193 2.1
Computer hardware 2 3,113 1.6
Cements 7 2,242 1.1
Electronics 1 2,230 1.1
Others 53 21,299 10.8
TTTTTotalotalotalotalotal 261261261261261 196,267196,267196,267196,267196,267 100100100100100
Exhibit 11: Industry-wise live approved cases under CDR
Source: CDR Cell, Angel Research
Source: Bloomberg, Angel Research
Exhibit 12: Corporate and G-Sec bond yields
9.0
6
9.1
0
9.0
6
7.9
3
8.0
3
8.0
5
9.8
4
9.9
4
9.9
6
8.7
0
8.8
5
8.7
6
9.8
5
9.6
3
9.6
2
8.5
6
8.8
9
8.8
3
6.0
7.0
8.0
9.0
10.0
11.0
12.0
AAA 3 Yr AAA 5 Yr AAA 10 Yr Gsec 3Yr Gsec 5Yr Gsec 10Yr
(%) 31-Dec-12 30-Sep-13 31-Dec-13
Un-provided MTM losses to require meaningfulprovisioning for some PSU banks
Given the current state of yields, the un-provided MTM lossesas of 2QFY2014, are likely to require meaningful provisioningfor some PSU banks (no provisioning for new private banks onthis count - as they have already provided fully) in the comingquarter. Within our coverage banks, un-provided MTM lossesas a proportion of operating profits for second half of the fiscalare relatively high for Dena Bank at around 33% followed byIOB at 28%, Vijaya Bank and Canara Bank at 24% and CorpBank at 19%.
Outlook and valuation
From a structural perspective, we recommend cautious stance
on PSU banks as a segment, given the challenges they face in
terms of a) low capital adequacy and core profitability (for many
of them; which increases the risk of book dilutive capital raising),
and b) higher competitive intensity (not only loss of deposits
and credit market share, but also of profitability - as current
credit cycle evidently highlights adverse asset selection on part
of PSUs and superior selection by private banks).
From a cyclical perspective, improvement in the macro
environment (as and when it happens) is likely to benefit all
banks, including our preferred picks amongst large private
banks viz. Axis Bank and ICICI Bank. That said, albeit with a
higher risk profile, some of the PSU banks with relatively higher
capital adequacy and well diversified asset books could be
considered from a cyclical revival point of view; these mainly
comprise some of the larger PSU names like SBI and BOB.
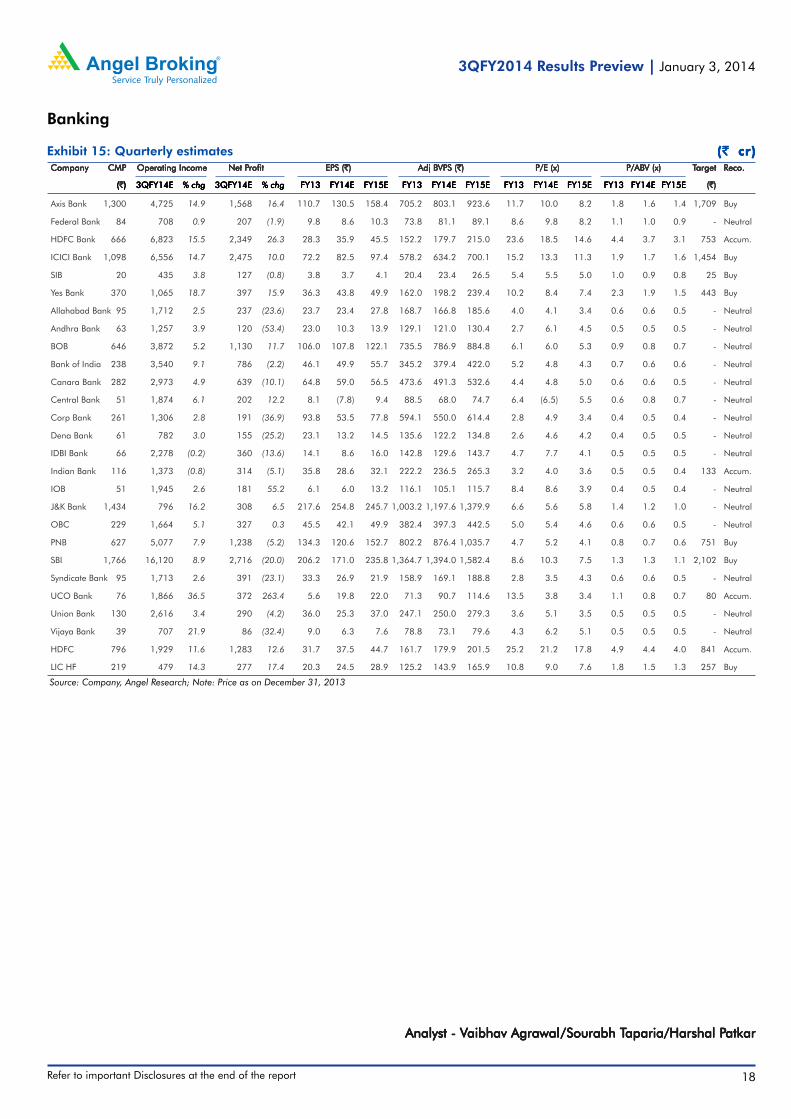
Refer to important Disclosures at the end of the report 18
3QFY2014 Results Preview | | | | | January 3, 2014
Analyst - VAnalyst - VAnalyst - VAnalyst - VAnalyst - Vaibhav Agrawaaibhav Agrawaaibhav Agrawaaibhav Agrawaaibhav Agrawal/l/l/l/l/Sourabh TSourabh TSourabh TSourabh TSourabh Taparia/Harshal Paparia/Harshal Paparia/Harshal Paparia/Harshal Paparia/Harshal Patkaratkaratkaratkaratkar
Source: Company, Angel Research; Note: Price as on December 31, 2013
Exhibit 15: Quarterly estimates ( ( ( ( ( `̀̀̀̀ cr) cr) cr) cr) cr)CompanyCompanyCompanyCompanyCompany CMPCMPCMPCMPCMP Operating Income Net P Operating Income Net P Operating Income Net P Operating Income Net P Operating Income Net Profit EPS (rofit EPS (rofit EPS (rofit EPS (rofit EPS (`̀̀̀̀) Adj B) Adj B) Adj B) Adj B) Adj BVPS (VPS (VPS (VPS (VPS ( `̀̀̀̀))))) P/E (x) P/AB P/E (x) P/AB P/E (x) P/AB P/E (x) P/AB P/E (x) P/ABV (x)V (x)V (x)V (x)V (x) TTTTTargetargetargetargetarget Reco.Reco.Reco.Reco.Reco.
(((((`̀̀̀̀))))) 3QFY14E3QFY14E3QFY14E3QFY14E3QFY14E % chg% chg% chg% chg% chg 3QFY14E3QFY14E3QFY14E3QFY14E3QFY14E % chg% chg% chg% chg% chg FY13FY13FY13FY13FY13 FY14EFY14EFY14EFY14EFY14E FY15EFY15EFY15EFY15EFY15E FY13FY13FY13FY13FY13 FY14EFY14EFY14EFY14EFY14E FY15EFY15EFY15EFY15EFY15E FY13FY13FY13FY13FY13 FY14EFY14EFY14EFY14EFY14E FY15EFY15EFY15EFY15EFY15E FY13FY13FY13FY13FY13 FY14EFY14EFY14EFY14EFY14E FY15EFY15EFY15EFY15EFY15E (((((`̀̀̀̀)))))
Axis Bank 1,300 4,725 14.9 1,568 16.4 110.7 130.5 158.4 705.2 803.1 923.6 11.7 10.0 8.2 1.8 1.6 1.4 1,709 Buy
Federal Bank 84 708 0.9 207 (1.9) 9.8 8.6 10.3 73.8 81.1 89.1 8.6 9.8 8.2 1.1 1.0 0.9 - Neutral
HDFC Bank 666 6,823 15.5 2,349 26.3 28.3 35.9 45.5 152.2 179.7 215.0 23.6 18.5 14.6 4.4 3.7 3.1 753 Accum.
ICICI Bank 1,098 6,556 14.7 2,475 10.0 72.2 82.5 97.4 578.2 634.2 700.1 15.2 13.3 11.3 1.9 1.7 1.6 1,454 Buy
SIB 20 435 3.8 127 (0.8) 3.8 3.7 4.1 20.4 23.4 26.5 5.4 5.5 5.0 1.0 0.9 0.8 25 Buy
Yes Bank 370 1,065 18.7 397 15.9 36.3 43.8 49.9 162.0 198.2 239.4 10.2 8.4 7.4 2.3 1.9 1.5 443 Buy
Allahabad Bank 95 1,712 2.5 237 (23.6) 23.7 23.4 27.8 168.7 166.8 185.6 4.0 4.1 3.4 0.6 0.6 0.5 - Neutral
Andhra Bank 63 1,257 3.9 120 (53.4) 23.0 10.3 13.9 129.1 121.0 130.4 2.7 6.1 4.5 0.5 0.5 0.5 - Neutral
BOB 646 3,872 5.2 1,130 11.7 106.0 107.8 122.1 735.5 786.9 884.8 6.1 6.0 5.3 0.9 0.8 0.7 - Neutral
Bank of India 238 3,540 9.1 786 (2.2) 46.1 49.9 55.7 345.2 379.4 422.0 5.2 4.8 4.3 0.7 0.6 0.6 - Neutral
Canara Bank 282 2,973 4.9 639 (10.1) 64.8 59.0 56.5 473.6 491.3 532.6 4.4 4.8 5.0 0.6 0.6 0.5 - Neutral
Central Bank 51 1,874 6.1 202 12.2 8.1 (7.8) 9.4 88.5 68.0 74.7 6.4 (6.5) 5.5 0.6 0.8 0.7 - Neutral
Corp Bank 261 1,306 2.8 191 (36.9) 93.8 53.5 77.8 594.1 550.0 614.4 2.8 4.9 3.4 0.4 0.5 0.4 - Neutral
Dena Bank 61 782 3.0 155 (25.2) 23.1 13.2 14.5 135.6 122.2 134.8 2.6 4.6 4.2 0.4 0.5 0.5 - Neutral
IDBI Bank 66 2,278 (0.2) 360 (13.6) 14.1 8.6 16.0 142.8 129.6 143.7 4.7 7.7 4.1 0.5 0.5 0.5 - Neutral
Indian Bank 116 1,373 (0.8) 314 (5.1) 35.8 28.6 32.1 222.2 236.5 265.3 3.2 4.0 3.6 0.5 0.5 0.4 133 Accum.
IOB 51 1,945 2.6 181 55.2 6.1 6.0 13.2 116.1 105.1 115.7 8.4 8.6 3.9 0.4 0.5 0.4 - Neutral
J&K Bank 1,434 796 16.2 308 6.5 217.6 254.8 245.7 1,003.2 1,197.6 1,379.9 6.6 5.6 5.8 1.4 1.2 1.0 - Neutral
OBC 229 1,664 5.1 327 0.3 45.5 42.1 49.9 382.4 397.3 442.5 5.0 5.4 4.6 0.6 0.6 0.5 - Neutral
PNB 627 5,077 7.9 1,238 (5.2) 134.3 120.6 152.7 802.2 876.4 1,035.7 4.7 5.2 4.1 0.8 0.7 0.6 751 Buy
SBI 1,766 16,120 8.9 2,716 (20.0) 206.2 171.0 235.8 1,364.7 1,394.0 1,582.4 8.6 10.3 7.5 1.3 1.3 1.1 2,102 Buy
Syndicate Bank 95 1,713 2.6 391 (23.1) 33.3 26.9 21.9 158.9 169.1 188.8 2.8 3.5 4.3 0.6 0.6 0.5 - Neutral
UCO Bank 76 1,866 36.5 372 263.4 5.6 19.8 22.0 71.3 90.7 114.6 13.5 3.8 3.4 1.1 0.8 0.7 80 Accum.
Union Bank 130 2,616 3.4 290 (4.2) 36.0 25.3 37.0 247.1 250.0 279.3 3.6 5.1 3.5 0.5 0.5 0.5 - Neutral
Vijaya Bank 39 707 21.9 86 (32.4) 9.0 6.3 7.6 78.8 73.1 79.6 4.3 6.2 5.1 0.5 0.5 0.5 - Neutral
HDFC 796 1,929 11.6 1,283 12.6 31.7 37.5 44.7 161.7 179.9 201.5 25.2 21.2 17.8 4.9 4.4 4.0 841 Accum.
LIC HF 219 479 14.3 277 17.4 20.3 24.5 28.9 125.2 143.9 165.9 10.8 9.0 7.6 1.8 1.5 1.3 257 Buy
Banking
19
3QFY2014 Results Preview | | | | | January 3, 2014
Refer to important Disclosures at the end of the report
Capital Goods
We expect the companies in our capital goods (CG) universe topost a 2.3% yoy decline in top-line, on an overall basis. However,excluding Bharat Heavy Electricals (BHEL; 11.0% yoy decline),our CG universe is expected to report a moderate growth intop-line of 7.2% yoy. On the bottom-line front, continued marginpressure due to tough competition in the sector, and in somecases higher interest costs due to deteriorating working capitalcycle, are expected to be a drag on profitability of most of thecompanies in our sector universe.
ABB (CMP/TP: `693/`540) (Rating: Sell)
For 4QCY2013, we expect ABB India (ABB)'s top-line to declineby 3.0% yoy to ̀ 2,020cr. At the operating level, ABB's margin isexpected to expand by 250bp yoy to 5.7%, aided by sharpimprovement in margins of power system segment on back ofcost control measures and supply chain optimizations.Consequently, its net profit is expected to grow by an impressive159% yoy to `43cr (albeit on a low base). On account of highvaluations, we assign a Sell rating to the stock with a targetwe assign a Sell rating to the stock with a targetwe assign a Sell rating to the stock with a targetwe assign a Sell rating to the stock with a targetwe assign a Sell rating to the stock with a targetprice of price of price of price of price of `̀̀̀̀540.540.540.540.540.
BHEL (CMP/TP: `176/-) (Rating: Neutral)
We expect BHEL to post an 11% yoy decline in top-line to`9,096cr for 3QFY2014 due to execution delays (on accountof delay in payments by clients as well as delay in obtaining thenecessary clearances). On the EBITDA front, the company'smargin is expected to contract by 519bp yoy to 10.8%.Consequently, we expect PAT to decline sharply by 40% yoy to`709cr. WWWWWe maintain our Neutral recommendation on the stocke maintain our Neutral recommendation on the stocke maintain our Neutral recommendation on the stocke maintain our Neutral recommendation on the stocke maintain our Neutral recommendation on the stockas declining order backlog limits revenue visibility for BHELas declining order backlog limits revenue visibility for BHELas declining order backlog limits revenue visibility for BHELas declining order backlog limits revenue visibility for BHELas declining order backlog limits revenue visibility for BHEL.....
BGR Energy (CMP/TP: `126/`135) (Rating: Accumulate)
We expect BGR Energy (BGR)'s top-line to grow by 19.8% yoyto `964cr on back of good execution of Construction and EPCcontracts. However, its EBITDA margin is expected to contractby 244bp yoy to 11.3% as the company is executing relativelylower margin orders. Consequently, the bottom-line is likely todecline by 3.7% yoy to ̀ 40cr. WWWWWe recommend Accumulate ratinge recommend Accumulate ratinge recommend Accumulate ratinge recommend Accumulate ratinge recommend Accumulate ratingon the stock with a target price of on the stock with a target price of on the stock with a target price of on the stock with a target price of on the stock with a target price of `̀̀̀̀135.135.135.135.135.
Crompton Greaves (CMP/TP: ̀ 129/`150) (Rating: Buy)
For 3QFY2014, we project Crompton Greaves to report adouble digit top-line growth of 11.0% yoy to `3,299cr as thecompany executes its robust order book. On the EBITDA front,the company's margin is expected to expand by an impressive573bp yoy to 5.8% (albeit on a very low base due to productivitylosses in 3QFY2013). Consequently, the company is expectedto post a net profit of `79cr compared to a loss of `68cr in3QFY2013. WWWWWe recommend Buy on the stock with a targete recommend Buy on the stock with a targete recommend Buy on the stock with a targete recommend Buy on the stock with a targete recommend Buy on the stock with a targetprice of price of price of price of price of `̀̀̀̀150.150.150.150.150.
Jyoti Structures (CMP/TP: `31/-) (Rating: Neutral)
For 3QFY2014, we expect Jyoti Structures' top-line to grow by12.6% yoy to ̀ 698cr. However, the operating margin is expectedto contract by 70bp yoy to 9.4% as tough competition in thelast few years has led to more aggressive bidding for projects.In spite of margin pressure, the company's net profit is expectedto grow by 21.6% yoy to `16cr. WWWWWe maintain our Neutrale maintain our Neutrale maintain our Neutrale maintain our Neutrale maintain our Neutralrecommendation on the stock.recommendation on the stock.recommendation on the stock.recommendation on the stock.recommendation on the stock.
KEC International (CMP/TP: ̀ 57/`62) (Rating: Accumulate)
For 3QFY2014, KEC International (KEC) is expected to registera double digit top-line growth of 14.1% yoy to ̀ 2,050cr on theback of strong execution of its robust order book. On the EBITDAfront, the company's margin is expected to expand by64bp yoy to 6.4%. Consequently, we expect PAT to grow by21.5% yoy to `36cr in spite of elevated interest costs. WWWWWeeeeerecommend Accumulate on the stock with a target price of recommend Accumulate on the stock with a target price of recommend Accumulate on the stock with a target price of recommend Accumulate on the stock with a target price of recommend Accumulate on the stock with a target price of `̀̀̀̀62.62.62.62.62.
Thermax (CMP/TP: `712/-) (Rating: Neutral)
For 3QFY2014, we expect Thermax to report a 7.8% yoy declinein its top-line to `965cr, as subdued order backlog in the lastfew quarters (due to weak order inflow) continues to drag downits revenue. The company's EBITDA margin is likely to contractby 97bp yoy to 9.7%. Falling revenue and margin are expectedto result in a yoy fall of 23.4% in the PAT to ̀ 58cr. WWWWWe maintaine maintaine maintaine maintaine maintainour Neutral rating on the stock.our Neutral rating on the stock.our Neutral rating on the stock.our Neutral rating on the stock.our Neutral rating on the stock.
Key DevelopmentsCCI clears stalled projects worth `3.5 lakh cr
The Cabinet Committee of Investments (CCI) has cleared92 projects worth ̀ 3.5 lakh cr stuck across five key infrastructuresectors of power, roads, ports, cement and petroleum till now.Most of the projects that have been cleared by CCI's interventionare power plants that needed coal supplies to kick off electricitygeneration. The government has now tasked the Departmentof Financial Services in the finance ministry to monitor the actualflow of these investments on the ground and report back to thecabinet. It indicates CCI's strong commitment to revive stalledprojects and augurs well for the capital goods sector as a whole.
BSE Capital Goods Index outperforms Sensex: BSE Capital Goods Index outperforms Sensex: BSE Capital Goods Index outperforms Sensex: BSE Capital Goods Index outperforms Sensex: BSE Capital Goods Index outperforms Sensex: After lacklusterperformance in 1HFY2014, the BSE Capital Goods indexbounced back sharply in 3QFY2014, outperforming the Sensexby 24%. The increased optimism on revival of investment cyclepost-elections coupled with relatively cheap valuations led toall the stocks in our capital goods universe to outperform theSensex. Crompton Greaves and KEC International which wereamongst the worst performers in 1HFY2014 recovered the most,gaining by 50% or more on expectation of recovery in margins.

Refer to important Disclosures at the end of the report 20
3QFY2014 Results Preview | | | | | January 3, 2014
Capital Goods
(T&D) companies, order intake is expected to be stable on backof steady ordering from PGCIL and uptick in ordering frominternational markets. Although we firmly believe thatorder inflow has bottomed out, execution delays andslower-than-anticipated revival in industrial capex remaina key risk.
Margin pressure and high interest costs remain a dragon profitability
High competitive intensity, partly due to limited orders on thehorizon, has led to deterioration in margins. Further, interestcosts remain at elevated levels for many companies in our capitalgoods universe as execution delays (due to delay in clearancesand deferral in payment by clients) and decline in advances(due to subdued order inflow) have led to deterioration ofworking capital, which is being funded by short-term borrowings.
Overall, the outlook remains challenging
Amid continued slowdown in economy, we believe the overallpicture remains gloomy for market leaders (read BHEL, ABBand Thermax). Although the government has initiated effortsby fast-tracking many projects through referral to the CCI andframing state electricity board (SEB) restructuring policies toimprove their financial condition, we believe it will take a whilefor the sector to witness any significant and dramatic growth.Given this, we expect the slowdown to continue for the nextcouple of quarters.
VVVVValuations: aluations: aluations: aluations: aluations: We prefer companies operating with diversifiedrevenue streams across different geographies. Hence, CromptonGreaves and KEC International are our preferred picks overthe medium to long term. However, we continue to maintainour negative stance on the BTG space, owing to concernsof heightened competition, execution delays and subduedorder inflows.
Analyst - Amit PAnalyst - Amit PAnalyst - Amit PAnalyst - Amit PAnalyst - Amit Patilatilatilatilatil
Exhibit 2: Quarterly estimates ((((( `̀̀̀̀ cr) cr) cr) cr) cr)
Source: Company; Angel Research; Note: Price as on December 31, 2013; * December year ending
CompanyCompanyCompanyCompanyCompany CMPCMPCMPCMPCMP Net SalesNet SalesNet SalesNet SalesNet Sales OPM (%)OPM (%)OPM (%)OPM (%)OPM (%) Net PNet PNet PNet PNet Profitrofitrofitrofitrofit EPS (EPS (EPS (EPS (EPS (`̀̀̀̀))))) EPS (EPS (EPS (EPS (EPS (`̀̀̀̀))))) P/E (x)P/E (x)P/E (x)P/E (x)P/E (x) TTTTTararararargggggeeeeettttt Reco.Reco.Reco.Reco.Reco.
(((((`̀̀̀̀))))) 3QFY14E3QFY14E3QFY14E3QFY14E3QFY14E % chg% chg% chg% chg% chg 3QFY14E3QFY14E3QFY14E3QFY14E3QFY14E chg bpchg bpchg bpchg bpchg bp 3QFY14E3QFY14E3QFY14E3QFY14E3QFY14E % chg% chg% chg% chg% chg 3QFY14E3QFY14E3QFY14E3QFY14E3QFY14E % chg% chg% chg% chg% chg FY13FY13FY13FY13FY13 FY14EFY14EFY14EFY14EFY14E FY15EFY15EFY15EFY15EFY15E FY13FY13FY13FY13FY13 FY14EFY14EFY14EFY14EFY14E FY15EFY15EFY15EFY15EFY15E (((((`̀̀̀̀)))))
ABB* 693 2,020 (3.0) 5.7 250 43 158.9 2.0 158.9 6.5 7.7 12.9 106.8 90.0 53.9 540 Sell
BHEL 176 9,096 (11.0) 10.8 (519) 709 (40.0) 2.9 (40.0) 27.3 16.2 13.1 6.5 10.9 13.4 - Neutral
BGR 126 964 19.8 11.3 (244) 40 (3.7) 5.5 (3.7) 22.5 23.1 22.6 5.6 5.4 5.6 135 Accum.
CG 129 3,299 11.0 5.8 573 79 - 1.2 - (0.6) 5.0 7.8 - 25.7 16.6 150 Buy
Jyoti Structures 31 698 12.6 9.4 (70) 16 21.6 2.0 21.6 4.7 7.2 8.3 6.7 4.3 3.8 - Neutral
KEC Int. 57 2,050 14.1 6.4 64 36 21.5 1.4 21.5 2.5 4.7 7.3 22.5 12.2 7.9 62 Accum.
Thermax 712 965 (7.8) 9.7 (97) 58 (23.4) 4.9 (23.4) 26.9 26.7 31.7 26.5 26.7 22.4 - Neutral
Outlook and valuationOrder inflow remains subdued
Order inflow for companies in the capital goods sector hasbeen largely subdued in the last few years on account ofsubstantial deceleration in investments across various sectors(due to economic slowdown). Moreover, the headwinds in thepower sector (such as unavailability of domestic fuel and delayin clearances) have delayed finalization of orders from powercompanies. However, CCI's drive to revive stalled projects,especially in the power sector, by fast-tracking various clearanceshas renewed optimism for boiler, turbine and generator (BTG)companies which have been grappling with declining orderbacklog and execution delays. For transmission and distribution
Source: Bloomberg, Angel Research
Exhibit 1: 3QFY2014 - Sensex vs CG stocks
28 29
50
2115
111
58
33
9
-
20
40
60
80
100
120
ABB BHEL CG Thermax BGR KEC Jyoti BSE CGIndex
SENSEX
(%)
Even BTG and BOP players such as BHEL, Thermax and ABB,suffering from declining order inflows due to issues in powersector, have recovered on hopes of capex revival and fasterclearances to power projects through CCI's intervention.However, the government still needs to address structuralproblems plaguing the power sector such as delays inenvironmental clearances and land acquisition issues, to sustainthe rally.

21
3QFY2014 Results Preview | | | | | January 3, 2014
Refer to important Disclosures at the end of the report
Cement
Source: Bloomberg, Angel Research
Exhibit 2: New castle Mccloskey prices
0
1,000
2,000
3,000
4,000
5,000
6,000
7,000
8,000
9,000
0
50
100
150
200
250
Dec-0
6
Jun
-07
Dec-0
7
Jun
-08
Dec-0
8
Jun
-09
Dec-0
9
Jun
-10
Dec-1
0
Jun
-11
Dec-1
1
Jun
-12
Dec-1
2
Jun
-13
Dec-1
3
Price of coal increased qoqin both US$ and INR terms
NCM Coal ($) (LHS) INR (RHS)
Exhibit 1: Region-wise cement pricesRRRRRegionegionegionegionegion PPPPPrevailing cement price (revailing cement price (revailing cement price (revailing cement price (revailing cement price (`̀̀̀̀/50kg/50kg/50kg/50kg/50kg. bag). bag). bag). bag). bag)
South 250-330
North 230-280
Central 250-300
West 250-330
East 290-350
Source: Industry, Angel Research
Demand scenario remains bleakWith economic slowdown continuing to persist, cement demandremains weak across the country. There was no major pick-upin demand post the monsoon as expected by some cementmanufacturers earlier. Demand from both, the housing andinfrastructure segments continued to remain weak. Shortage ofsand too impacted construction in many parts of the countryduring the quarter, thereby impacting cement demand. However,sand availability improved during the later part of the quarter.
Demand for cement in the northern region continued to bepoor during 3QFY2014. Further, cement demand in the regionwas affected by the Rajasthan High Court's ban on mining andtransportation of sand throughout the state for more than amonth (from October 22 to November 26). The court hadpassed this order based on allegations of flouting ofenvironmental norms and illegal sand mining in the state.Shortage of sand resulted in spiraling of sand prices, therebyaffecting construction activities in the region. Demand remainedsluggish in the central and western regions as well. Demandfrom the housing segment remained weak in the western region.The southern region was affected by the sand mining ban inTamil Nadu, which affected construction activities in the stateas well as in the neighboring states of Andhra Pradesh andKarnataka. Further, the continuing political turmoil in the stateof Andhra Pradesh also weighed on cement demand. Demandwas weak in the eastern region as well, impacted by adverseweather conditions in Orissa in the months of October andNovember.
Pricing scenario in 3QFY2014Cement manufacturers hiked prices at the end of 2QFY2014hoping for a pick-up in demand. However, continued weaknessin demand made price hikes unsustainable and resulted in pricecorrection in most parts of the country during the quarter underreview. While prices remained at elevated levels in October,they started to decline in the month of November. There was afurther decline in price in the month of December due to volumepush by companies following calendar year financial accounting.
New Castle Mckloksey 6,000kc coal were up by 6.4% qoq butdown by 2.6% yoy to US$82.0 per tonne. The rise in prices ofimported coal in INR terms stood at 6.6% qoq. The INR/US$exchange rate remained stable during the quarter. However, ona yoy basis though the price of coal reduced by 2.6% in US$terms, a 14.3% yoy depreciation in the INR led to an increase inthe price of imported coal by 11.3% yoy in INR terms.
Key developments
JaypeeJaypeeJaypeeJaypeeJaypee-Ultratech deal gets CCI nod:-Ultratech deal gets CCI nod:-Ultratech deal gets CCI nod:-Ultratech deal gets CCI nod:-Ultratech deal gets CCI nod: During the quarter, theCompetition Commission of India (CCI) approved Ultratech'sdeal with Jaypee Cement Corporation to acquire the latter'sGujarat Cement Plants (GCP). As per the deal entered inSeptember 2013, Ultratech would buy Jaypee CementCorporation's (a wholly owned subsidiary of JaiprakashAssociates) 4.8mtpa cement plant in Gujarat. GCP consist ofan integrated cement plant at Sewagram and a 2.4mtpa cementgrinding unit at Wanakbori. GCP has a 2,500DWT jetty in Kutchwhich is used for clinker and coal movement along with 57.5MWcoal based captive power plant. The enterprise value of thetransaction is `3,800cr (excluding actual net working capital).
Earlier, there were concerns that the CCI might disapprove thedeal as Ultratech and the other big player in the state Ambujawould control a substantial ~60% of the Gujarat market basedon current demand. However, CCI in its order said that theproposed deal will not have an adverse effect on competitionas Ultratech has committed to increase the capacity utilizationof the acquired plants (from ~65% in FY2013) which wouldresult in higher supply in the market. The CCI further addedthat the commissioning of new plants by ABG in Gujarat andLafarge in Rajasthan would result in healthy competition in theGujarat market.
India Cements gets government approval for expandingIndia Cements gets government approval for expandingIndia Cements gets government approval for expandingIndia Cements gets government approval for expandingIndia Cements gets government approval for expandingDalavoi plant: Dalavoi plant: Dalavoi plant: Dalavoi plant: Dalavoi plant: During the quarter, the expert appraisalcommittee under the Ministry of Environment gave its approvalto India Cements to double the capacity of its Dalavoi plant.The current capacity for clinker production in this facility is1.24mtpa and the company plans to add 1.53mtpa, taking thetotal clinker production capacity to 2.77mtpa. The company's
Imported coal prices down yoy (in US$ terms)
Indian cement companies rely heavily on imported coal to meettheir fuel needs as domestic supplies do not meet theirrequirement sufficiently. During 3QFY2014, average prices of

Refer to important Disclosures at the end of the report 22
3QFY2014 Results Preview | | | | | January 3, 2014
Analyst - V SrinivasanAnalyst - V SrinivasanAnalyst - V SrinivasanAnalyst - V SrinivasanAnalyst - V Srinivasan
Exhibit 6: Quarterly estimates (((((`̀̀̀̀ cr)
Source: Company, Angel Research; Note: Price as on December 31, 2013; ^December year ending; *June year ending
CompanyCompanyCompanyCompanyCompany CMPCMPCMPCMPCMP Net SalesNet SalesNet SalesNet SalesNet Sales OPM (%)OPM (%)OPM (%)OPM (%)OPM (%) Net PNet PNet PNet PNet Profitrofitrofitrofitrofit EPS (EPS (EPS (EPS (EPS (`̀̀̀̀))))) EPS ( EPS ( EPS ( EPS ( EPS (`̀̀̀̀))))) P/E (x) P/E (x) P/E (x) P/E (x) P/E (x) TTTTTararararargggggeeeeettttt Reco.Reco.Reco.Reco.Reco.
(((((`̀̀̀̀))))) 3QFY14E3QFY14E3QFY14E3QFY14E3QFY14E % chg% chg% chg% chg% chg 3QFY14E3QFY14E3QFY14E3QFY14E3QFY14E chg bpchg bpchg bpchg bpchg bp 3QFY14E3QFY14E3QFY14E3QFY14E3QFY14E % chg% chg% chg% chg% chg 3QFY14E3QFY14E3QFY14E3QFY14E3QFY14E % chg% chg% chg% chg% chg FY13FY13FY13FY13FY13 FY14EFY14EFY14EFY14EFY14E FY15EFY15EFY15EFY15EFY15E FY13FY13FY13FY13FY13 FY14EFY14EFY14EFY14EFY14E FY15EFY15EFY15EFY15EFY15E (((((`̀̀̀̀)))))
ACC^ 1,108 2,892 (6.7) 15.5 268 174 (27.2) 9.3 (27.2) 74.7 52.8 69.9 14.8 21.0 15.9 1,225 Accum.
Ambuja Cem.^ 183 2,275 (1.7) 17.7 (176) 193 (9.0) 1.2 (9.0) 10.2 7.4 9.2 17.9 24.6 19.9 Neutral
India Cem. 60 1,086 0.3 12.2 (555) (13) - (0.4) - 6.0 0.8 3.9 10.1 75.1 15.2 Neutral
J K Lakshmi 79 471 (4.6) 14.6 (524) 18 (55.7) 1.6 (55.7) 16.3 7.1 9.9 4.8 11.1 8.0 - Neutral
Ramco Cem. 191 866 (0.7) 15.9 (723) 22 (73.6) 0.9 (73.6) 17.0 6.9 12.1 11.3 27.7 15.9 Neutral
Shree Cem.* 4,330 1,378 (3.5) 25.2 (70) 204 (10.3) 58.5 (10.3) 288.4 243.8 276.4 15.0 17.8 15.7 Neutral
UltraTech 1,763 5,015 3.2 16.5 (509) 397 (33.9) 14.5 (33.9) 96.8 74.6 80.2 18.2 23.6 22.0 Neutral
Cement
Source: Angel Research
Exhibit 4: 3QFY2014E top-line performance of companies
(6.7)
(1.7)
3.2
0.3
(0.7)
(4.6)
(3.5)
(8.0)
(6.0)
(4.0)
(2.0)
0.0
2.0
4.0
ACC Ambuja Ultratech IndiaCements
Ramco JK Lakshmi ShreeCement
(%)
Company Company Company Company Company 2QFY2014E2QFY2014E2QFY2014E2QFY2014E2QFY2014E 2QFY20132QFY20132QFY20132QFY20132QFY2013 yoy (bp)yoy (bp)yoy (bp)yoy (bp)yoy (bp) 1QFY20141QFY20141QFY20141QFY20141QFY2014 qoq (bp)qoq (bp)qoq (bp)qoq (bp)qoq (bp)
ACC ^ 15.5 12.8 268 11.4 411
Ambuja ^ 17.7 19.5 (176) 13.4 434
Ultratech 16.5 21.6 (509) 15.1 141
India Cements 12.2 17.8 (555) 11.7 50
Ramco Cements 15.9 23.2 (723) 13.0 290
JK Lakshmi 14.6 19.9 (524) 12.5 210
Shree Cement * 25.2 25.9 (70) 20.0 520
Exhibit 5: OPM (%) performance in 3QFY2014E
Source: Company, Angel Research; Note: ^December year ending; *Juneyear ending
Margins to remain under pressure
Cement companies are confronted with weak cement pricesand increase in operating costs such as of raw material, freightetc. We expect most of the companies under our coverage topost a decline in margins on a yoy basis. Overall we expect a259bp yoy decline in OPM for our cement universe.
Exhibit 3: Sensex vs Cement stocks (3QFY2014)
Source: BSE, Angel Research
Cement majorsCement majorsCement majorsCement majorsCement majors Abs. Return (%)Abs. Return (%)Abs. Return (%)Abs. Return (%)Abs. Return (%) Relative to Sensex (%)Relative to Sensex (%)Relative to Sensex (%)Relative to Sensex (%)Relative to Sensex (%)
Sensex 9.2
ACC (0.3) (9.6)
Ambuja (0.1) (9.4)
India Cements 17.8 8.6
JK Lakshmi Cement 11.5 2.2
The Ramco Cements 7.8 (1.4)
Shree Cements 5.4 (3.9)
Ultratech (2.6) (11.8)
Outlook and valuation
A weak demand scenario has impacted the pricing power ofcement manufacturers in the country. Thus, despite the increasein cost pressures due to higher freight fares and power costs,cement manufacturers are finding it difficult to pass on the samethrough price hikes. Further we also do not expect any respiteon the cost front going ahead. We maintain a Neutral view onthe sector.
cement (OPC/PPC) production capacity is 2.16mtpa and it plansto add 2.55mtpa, taking the total cement production capacityto 4.71mtpa. India Cements also plans to set up a 40MW CPPin the Dalavoi facility. The estimated cost of the project is ̀ 810cr.
Cement stocks - Performance on the bourses
During 3QFY2014, most of the cement stocks in our coverageuniverse underperformed the BSE-Sensex, which gained 9.2%during the quarter. However, JK Lakshmi Cement and IndiaCements outperformed the BSE-Sensex and posted gains of11.5% and 17.8% respectively.
3QFY2014 expectations
Top-line to decline marginally yoy
We expect our cement universe to report a marginal 1.2% yoydecline on the top-line front. While we expect a 4.1% yoy growthin volumes, realizations are expected to be lower on a yoy basis,resulting in a marginal decline on the top-line front.
23
3QFY2014 Results Preview | | | | | January 3, 2014
Refer to important Disclosures at the end of the report
Slowdown persists in FMCG sector3QFY2014 did not witness any major improvement in consumersentiments, which continue to remain weak across the country.While slowdown is evident across the consumer space, it is moreevident on the discretionary side. Volume growth has been weakfor premium products. Further, down-trading was visible incertain categories. Although advertisement and promotionalspends remained at elevated levels during the quarter, theymoderated slightly on a sequential basis.
Slowdown was witnessed in both the urban as well as the ruralmarkets. However, rural demand continues to be better thanurban demand. Further we expect the rural demand to pick upgoing ahead aided by a good harvest due to healthy monsoon.
Raw-material price movements show a varied trend
During the quarter raw material price movement showed avaried trend. While prices of wheat rose by 3.7% on a yoy basis,sugar prices were down by 12.4% on a yoy basis. Copra pricessurged by 38.6% on a sequential basis during the quarter.
FMCG
Exhibit 1: Input cost trend during 3QFY2014 3QFY14 P 3QFY14 P 3QFY14 P 3QFY14 P 3QFY14 Pricesricesricesricesrices yoy (%)yoy (%)yoy (%)yoy (%)yoy (%) qoq (%)qoq (%)qoq (%)qoq (%)qoq (%)
Wheat (`/quintal) 1,637 3.7 3.4
Barley (`/quintal) 1,342 1.6 2.5
Sugar (`/ quintal) 3,124 (12.4) (3.7)
Coffee (US $/10 tonne) 1,624 (17.2) (10.1)
Cocoa (US$/MT) 2,733 13.7 12.9
Milk Liquid (`/ltr) 38 42.5 7.1
PFAD (USD/MT) 709 4.0 10.6
Copra (`/quintal) 7,100 67.6 38.6
Safflower (`/ quintal) 3,775 (9.9) (3.7)
Soyabean Oil (`/10kg) 683 2.1 4.7
Groundnt Oil (`/MT) 85,345 (28.2) (8.2)
Crude (US$/ barrel) 109 (0.8) (0.4)
Caustic Soda (`/kg) 1,854 (9.0) 15.2
Soda Ash (`/kg) 1,160 0.9 (0.1)
Source: Bloomberg, C-Line, Angel Research
other UB group entities (2.22%) and shares obtained throughpreferential allotment (10%).
The High Court order has only cancelled the sale of share byUBHL to Diageo but has not declared the entire deal betweenUB group and Diageo void. As a result of this court orderDiageo's stake in USL would reduce to 19.5%, but it wouldcontinue to be the largest shareholder in the company. Further,we expect the UB group to vote as directed by Diageo till theissue is settled.
Although the UB group and Diageo are expected to appealagainst the order in the Supreme Court, we believe it would actas an overhang on the USL stock.
New product launches during 3QFY2014
Dabur: Dabur: Dabur: Dabur: Dabur: During the quarter Dabur launched the Fem FairnessNaturals range, which is based on the bleach platform with noadded ammonia. The new Fem Fairness Naturals range has4 products under it - Fem Fairness Naturals Saffron CrèmeBleach for fair skin, Fem Fairness Naturals Pearl for darker skin,Fem Fairness Naturals Gold Bleach for special occasions andFem Turmeric Herbal Bleach for a month's fairness benefit.
Dabur also launched during the quarter the Hibiscus range ofshampoo and hair oil under the Vatika brand. The productslaunched are Vatika Enriched Coconut oil with Hibiscus andVatika Premium Naturals Shampoo with hibiscus, reetha andolive conditioning.
Dabur also forayed into the packaged milk shake market withthe launch of RÉAL Fruit Shakes under the RÉAL brand. RÉALFruit Shakes has been test launched with a single variant - MangoShake and will be offered to consumers in two SKUs - 200mlfor `25 and 1litre for `105.
ITITITITITCCCCC::::: During the quarter, ITC launched nicotine chewing gumsunder the brand Kwiknic. Currently the size of the nicotinechewing gum market is insignificant at ̀ 20cr and the distributionis done through pharmacists. ITC is expected to distribute Kwiknicthrough its strong retail distribution network.
TGBLTGBLTGBLTGBLTGBL::::: Tata Starbucks (the 50:50 JV between Tata GlobalBeverages [TGBL] and Starbucks company) opened its firstBengaluru store during the quarter. Post the opening of theBengaluru outlet, Tata Starbucks has a total of 30 outlets inIndia located in Mumbai, New Delhi, NCR, Pune and Benguluru.
FMCG stocks' performance on the bourses
The BSE FMCG index fell by 4% during the quarter andunderperformed the BSE-Sensex which rose by 9.2% duringthe quarter. Among the stocks under our coverage only Britanniaand Tata Global outperformed the BSE-Sensex and posted gainsof 11.7% and 11.3% respectively. Both the Sensex FMCGstocks - ITC and HUL posted negative returns and fell by 5.4%and 8.9% respectively.
Key developments during the quarterUBHL's sale of shares in USL void: Karnataka High court
During the quarter The Karnataka High Court annulled UnitedBreweries Holding's (UBHL) sale of its stake in United Spirits(USL) to Diageo. The High Court order came in response to awinding-up petition filed by creditors against UBHL for dues ofabout `600cr, which is pertaining to Kingfisher Airlines. TheHigh Court order said that the earlier Company Court order,which allowed the share sale by UBHL to Diageo, did not havethe jurisdiction to do so. Diageo's 26.4% stake in USL includesshares it purchased from UBHL (6.9%), shares obtained from

Refer to important Disclosures at the end of the report 24
3QFY2014 Results Preview | | | | | January 3, 2014
FMCG
OPMs to witness a mixed trend
The increase in the prices of raw materials such as copra andPFAD is expected to result in a decline in gross margins of somecompanies although a few of them have initiated price hikes.Advertising and sales promotion expenses continue to remainat elevated levels as companies continue to combat slowdown.Also, increase in the cost of diesel has pushed up freight costs.Thus we expect a mixed performance on the operating front forthe companies under coverage.
Outlook and valuation
Although the slowdown witnessed in the FMCG sector is expectedto persist for the next few quarters, we believe India's long-termconsumption story is intact. Consumption in many categories,with potential for high growth rates, is still very low in urbanIndia. In rural India, the penetration of these products is evenlower. With rising income levels and changing consumerbehavior in the country, consumer spending on branded FMCGproducts is set to rise. However, we have concerns over thehigh valuations at which these stocks are currently trading. Thuswe have a Neutral view on the sector.
Analyst - V SrinivasanAnalyst - V SrinivasanAnalyst - V SrinivasanAnalyst - V SrinivasanAnalyst - V Srinivasan
Source: Angel Research
6.911.7
9.10.1
2.3
2.3
(8.9)
(5.4)
(1.0)
1.9
11.3
2.7
(10) (5) 0 5 10 15
Asian Paints
Britannia
Colgate Palmolive
Dabur India
GCPL
GSK Consumer
HUL
ITC
Marico
Nestle
TGBL
United Spirits
(%)
Exhibit 2: Stock performance in 3QFY2014
Exhibit 4: Quarterly estimates (`̀̀̀̀ cr)
Source: Company, Angel Research; Note: Price as on December 31, 2013; * December year ending; ^Consolidated; #Quaterly numbers pertains to standalone financials
CompanyCompanyCompanyCompanyCompany CMPCMPCMPCMPCMP Net SalesNet SalesNet SalesNet SalesNet Sales OPM (%)OPM (%)OPM (%)OPM (%)OPM (%) Net PNet PNet PNet PNet Profitrofitrofitrofitrofit EPS (EPS (EPS (EPS (EPS (`̀̀̀̀))))) EPS ( EPS ( EPS ( EPS ( EPS (`̀̀̀̀))))) P/E (x) P/E (x) P/E (x) P/E (x) P/E (x) TTTTTararararargggggeeeeettttt Reco.Reco.Reco.Reco.Reco.
(((((`̀̀̀̀))))) 3QFY14E3QFY14E3QFY14E3QFY14E3QFY14E % chg% chg% chg% chg% chg 3QFY14E3QFY14E3QFY14E3QFY14E3QFY14E chg bpchg bpchg bpchg bpchg bp 3QFY14E3QFY14E3QFY14E3QFY14E3QFY14E % chg% chg% chg% chg% chg 3QFY14E3QFY14E3QFY14E3QFY14E3QFY14E % chg% chg% chg% chg% chg FY13FY13FY13FY13FY13 FY14EFY14EFY14EFY14EFY14E FY15EFY15EFY15EFY15EFY15E FY13FY13FY13FY13FY13 FY14EFY14EFY14EFY14EFY14E FY15EFY15EFY15EFY15EFY15E (((((`̀̀̀̀)))))
Asian Paints ^ 491 3,430 12.9 16.9 64 368 9.8 3.8 9.8 11.6 13.2 15.7 42.3 37.2 31.3 - Neutral
Britannia 920 1,682 15.8 8.7 332 104 82.2 8.7 82.2 19.6 33.7 40.1 47.1 27.3 23.0 - Neutral
Colgate 1,353 872 14.3 15.9 (99) 116 4.4 8.5 4.4 36.6 37.2 43.5 37.0 36.3 31.1 - Neutral
Dabur India ^ 170 1,896 16.3 17.5 94 256 21.0 1.2 21.0 4.4 5.5 6.1 38.6 31.1 27.7 - Neutral
GCPL 857 2,052 21.3 15.2 (139) 208 20.8 6.1 20.8 20.6 23.0 28.4 41.7 37.2 30.2 - Neutral
GSK Cons. * 4,433 852 20.2 15.4 (155) 83 18.6 19.6 18.6 100.8 120.3 149.7 44.0 36.9 29.6 - Neutral
HUL 571 6,938 7.8 14.3 76 924 5.2 4.3 5.2 14.8 16.8 17.6 38.7 34.0 32.4 - Neutral
ITC 322 8,373 9.8 38.5 215 2,361 15.1 3.1 15.1 9.4 11.0 12.8 34.3 29.2 25.1 - Neutral
Marico ^ 217 1,252 7.6 14.4 48 114 11.5 1.9 11.5 5.6 7.0 8.6 38.5 31.2 25.1 - Neutral
Nestle * 5,297 2,380 10.6 21.8 (127) 307 10.0 31.8 10.0 114.2 119.1 146.4 46.4 44.5 36.2 - Neutral
TGBL^ 160 2,057 8.1 9.5 (52) 101 25.5 1.6 25.5 6.5 6.8 9.2 24.7 23.7 17.4 - Neutral
USL# 2,607 2,337 7.5 10.6 (70) 115 42.2 7.9 28.0 10.8 20.3 43.0 242.3 128.5 60.6 - Neutral
Source: Angel Research
16.3
21.3
7.6
20.2
10.6
12.9
9.8
15.8
7.8
14.3
8.1
-
5.0
10.0
15.0
20.0
25.0
Dabur
GC
PL
Mari
co
GSKC
H
Nest
le
ITC
Bri
tannia
HU
L
Colg
ate
TG
BL
Asi
an
Pain
ts
Exhibit 3: Top-line growth in 3QFY2014E
3QFY2014 expectations
Top-line growth for universe estimated at 11.4%
We expect our FMCG universe (excluding ITC) to post atop-line growth of 11.4% yoy during the quarter aided by bothhigher volumes and better realizations. Godrej ConsumerProducts (GCPL) is expected to post the highest top-linegrowth of 21.3% driven by international businesses inAfrica and Europe.
Sensex companies ITC and HUL are expected to post a top-linegrowth of 9.8% and 7.8% respectively. ITC's top-line growthwould be led by price hikes taken by it in its cigarettes business.We expect HUL's top-line growth to be driven mostly by highervolume.
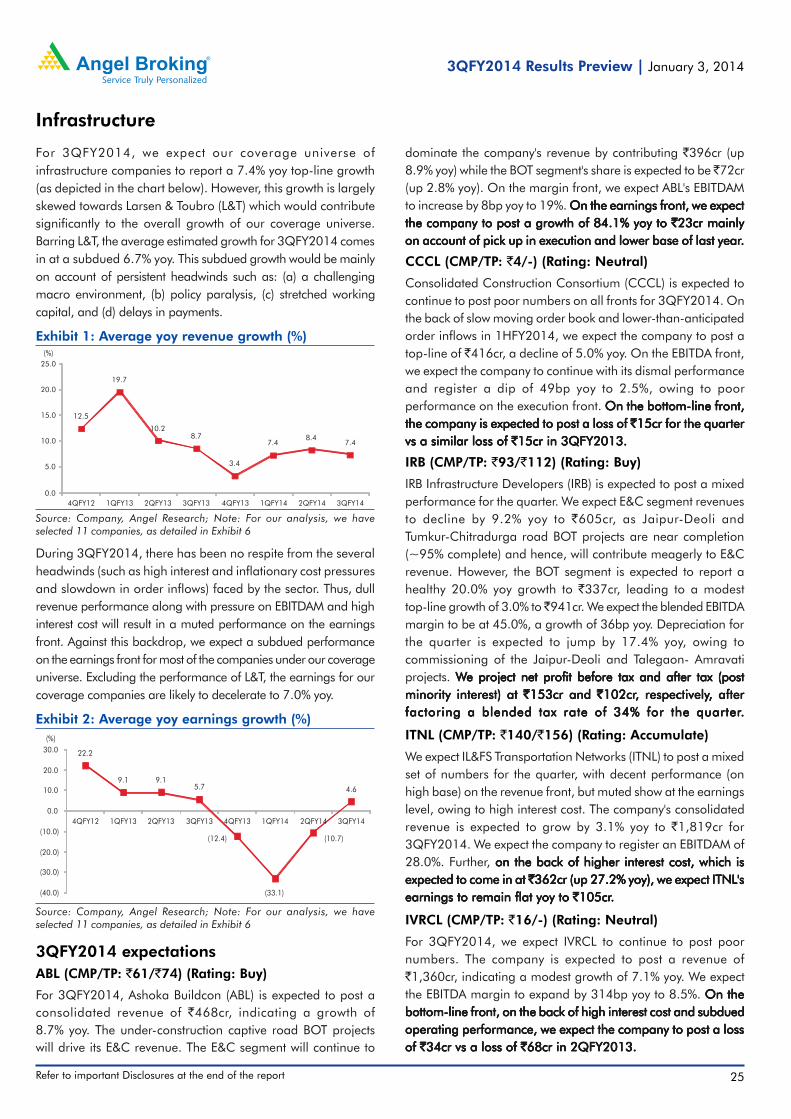
25
3QFY2014 Results Preview | | | | | January 3, 2014
Refer to important Disclosures at the end of the report
Infrastructure
For 3QFY2014, we expect our coverage universe ofinfrastructure companies to report a 7.4% yoy top-line growth(as depicted in the chart below). However, this growth is largelyskewed towards Larsen & Toubro (L&T) which would contributesignificantly to the overall growth of our coverage universe.Barring L&T, the average estimated growth for 3QFY2014 comesin at a subdued 6.7% yoy. This subdued growth would be mainlyon account of persistent headwinds such as: (a) a challengingmacro environment, (b) policy paralysis, (c) stretched workingcapital, and (d) delays in payments.
Source: Company, Angel Research; Note: For our analysis, we haveselected 11 companies, as detailed in Exhibit 6
Exhibit 2: Average yoy earnings growth (%)
22.2
9.1 9.15.7
(12.4)
(33.1)
(10.7)
4.6
(40.0)
(30.0)
(20.0)
(10.0)
0.0
10.0
20.0
30.0
4QFY12 1QFY13 2QFY13 3QFY13 4QFY13 1QFY14 2QFY14 3QFY14
(%)
Source: Company, Angel Research; Note: For our analysis, we haveselected 11 companies, as detailed in Exhibit 6
Exhibit 1: Average yoy revenue growth (%)
12.5
19.7
10.28.7
3.4
7.48.4
7.4
0.0
5.0
10.0
15.0
20.0
25.0
4QFY12 1QFY13 2QFY13 3QFY13 4QFY13 1QFY14 2QFY14 3QFY14
(%)
During 3QFY2014, there has been no respite from the severalheadwinds (such as high interest and inflationary cost pressuresand slowdown in order inflows) faced by the sector. Thus, dullrevenue performance along with pressure on EBITDAM and highinterest cost will result in a muted performance on the earningsfront. Against this backdrop, we expect a subdued performanceon the earnings front for most of the companies under our coverageuniverse. Excluding the performance of L&T, the earnings for ourcoverage companies are likely to decelerate to 7.0% yoy.
3QFY2014 expectationsABL (CMP/TP: `61/`74) (Rating: Buy)
For 3QFY2014, Ashoka Buildcon (ABL) is expected to post aconsolidated revenue of `468cr, indicating a growth of8.7% yoy. The under-construction captive road BOT projectswill drive its E&C revenue. The E&C segment will continue to
dominate the company's revenue by contributing `396cr (up8.9% yoy) while the BOT segment's share is expected to be ̀ 72cr(up 2.8% yoy). On the margin front, we expect ABL's EBITDAMto increase by 8bp yoy to 19%. On the earnings front, we expectOn the earnings front, we expectOn the earnings front, we expectOn the earnings front, we expectOn the earnings front, we expectthe company to post a growth of 84.1% yoy to the company to post a growth of 84.1% yoy to the company to post a growth of 84.1% yoy to the company to post a growth of 84.1% yoy to the company to post a growth of 84.1% yoy to `̀̀̀̀23cr mainly23cr mainly23cr mainly23cr mainly23cr mainlyon account of pick up in execution and lower base of last yearon account of pick up in execution and lower base of last yearon account of pick up in execution and lower base of last yearon account of pick up in execution and lower base of last yearon account of pick up in execution and lower base of last year.....
CCCL (CMP/TP: `4/-) (Rating: Neutral)
Consolidated Construction Consortium (CCCL) is expected tocontinue to post poor numbers on all fronts for 3QFY2014. Onthe back of slow moving order book and lower-than-anticipatedorder inflows in 1HFY2014, we expect the company to post atop-line of ̀ 416cr, a decline of 5.0% yoy. On the EBITDA front,we expect the company to continue with its dismal performanceand register a dip of 49bp yoy to 2.5%, owing to poorperformance on the execution front. On the bottom-line front,On the bottom-line front,On the bottom-line front,On the bottom-line front,On the bottom-line front,the company is expected to post a loss of the company is expected to post a loss of the company is expected to post a loss of the company is expected to post a loss of the company is expected to post a loss of `̀̀̀̀15cr for the quarter15cr for the quarter15cr for the quarter15cr for the quarter15cr for the quartervs a similar loss of vs a similar loss of vs a similar loss of vs a similar loss of vs a similar loss of `̀̀̀̀15cr in 3QFY2013.15cr in 3QFY2013.15cr in 3QFY2013.15cr in 3QFY2013.15cr in 3QFY2013.
IRB (CMP/TP: `93/`112) (Rating: Buy)
IRB Infrastructure Developers (IRB) is expected to post a mixedperformance for the quarter. We expect E&C segment revenuesto decline by 9.2% yoy to `605cr, as Jaipur-Deoli andTumkur-Chitradurga road BOT projects are near completion(~95% complete) and hence, will contribute meagerly to E&Crevenue. However, the BOT segment is expected to report ahealthy 20.0% yoy growth to `337cr, leading to a modesttop-line growth of 3.0% to ̀ 941cr. We expect the blended EBITDAmargin to be at 45.0%, a growth of 36bp yoy. Depreciation forthe quarter is expected to jump by 17.4% yoy, owing tocommissioning of the Jaipur-Deoli and Talegaon- Amravatiprojects. WWWWWe project net profit before tax and after tax (poste project net profit before tax and after tax (poste project net profit before tax and after tax (poste project net profit before tax and after tax (poste project net profit before tax and after tax (postminority interest) at minority interest) at minority interest) at minority interest) at minority interest) at `̀̀̀̀153cr and 153cr and 153cr and 153cr and 153cr and `̀̀̀̀102cr102cr102cr102cr102cr, respectively, respectively, respectively, respectively, respectively, after, after, after, after, afterfactoring a blended tax rate of 34% for the quarterfactoring a blended tax rate of 34% for the quarterfactoring a blended tax rate of 34% for the quarterfactoring a blended tax rate of 34% for the quarterfactoring a blended tax rate of 34% for the quarter.....
ITNL (CMP/TP: `140/`156) (Rating: Accumulate)
We expect IL&FS Transportation Networks (ITNL) to post a mixedset of numbers for the quarter, with decent performance (onhigh base) on the revenue front, but muted show at the earningslevel, owing to high interest cost. The company's consolidatedrevenue is expected to grow by 3.1% yoy to `1,819cr for3QFY2014. We expect the company to register an EBITDAM of28.0%. Further, on the back of higher interest cost, which is on the back of higher interest cost, which is on the back of higher interest cost, which is on the back of higher interest cost, which is on the back of higher interest cost, which isexpected to come in at expected to come in at expected to come in at expected to come in at expected to come in at ̀̀̀̀̀ 362cr (up 27.2% yoy), we expect ITNL's362cr (up 27.2% yoy), we expect ITNL's362cr (up 27.2% yoy), we expect ITNL's362cr (up 27.2% yoy), we expect ITNL's362cr (up 27.2% yoy), we expect ITNL'searnings to remain flat yoy to earnings to remain flat yoy to earnings to remain flat yoy to earnings to remain flat yoy to earnings to remain flat yoy to `̀̀̀̀105cr105cr105cr105cr105cr.....
IVRCL (CMP/TP: `16/-) (Rating: Neutral)
For 3QFY2014, we expect IVRCL to continue to post poornumbers. The company is expected to post a revenue of`1,360cr, indicating a modest growth of 7.1% yoy. We expectthe EBITDA margin to expand by 314bp yoy to 8.5%. On theOn theOn theOn theOn thebottom-line front, on the back of high interest cost and subduedbottom-line front, on the back of high interest cost and subduedbottom-line front, on the back of high interest cost and subduedbottom-line front, on the back of high interest cost and subduedbottom-line front, on the back of high interest cost and subduedoperating performance, we expect the company to post a lossoperating performance, we expect the company to post a lossoperating performance, we expect the company to post a lossoperating performance, we expect the company to post a lossoperating performance, we expect the company to post a lossof of of of of `̀̀̀̀34cr vs a loss of 34cr vs a loss of 34cr vs a loss of 34cr vs a loss of 34cr vs a loss of `̀̀̀̀68cr in 2QFY2013.68cr in 2QFY2013.68cr in 2QFY2013.68cr in 2QFY2013.68cr in 2QFY2013.

Refer to important Disclosures at the end of the report 26
3QFY2014 Results Preview | | | | | January 3, 2014
Infrastructure
Source: Company, Angel Research
Exhibit 3: Interest cost as a % of sales for E&C companies
0.0
5.0
10.0
15.0
20.0
25.0
JAL IVRCL Unity Infra NCC CCCL Simplex In. Sadbhav L&T
(%)
2QFY14 1QFY14 4QFY13
Order inflow remains muted
Order inflows for companies under our coverage have largelybeen disappointing for the past few quarters. Moreover, theroad sector has also seen significant slowdown in awarding ofprojects. However, the infrastructure sector has seen somepositive developments in the form of clearance of various stalledprojects (ticket size of above `1,000cr) in key infrastructuresectors such as power, roads, ports, cement, petroleum, etc. bythe Cabinet Committee on Investment (CCI) and also with someup-tick in order inflows from overseas countries. This wouldhelp in order inflows and execution picking up going forward.
For 2QFY2014, most of the companies under our coveragehave seen a strong growth in order inflows mainly due to lowerbase of last year. L&T, SEL and Simplex Infra are the onlyexceptions which have seen a healthy growth in order inflowsover the last few quarters. However, owing to policy paralysis atthe government's end, delays arising due to constraints in landacquisition, environmental clearance issues and slower-than-anticipated revival in industrial capex, most players faceddifficulties in drawing order inflows during the quarter.
JAL (CMP/TP: `55/-) (Rating: Neutral)
We expect Jaiprakash Associates (JAL) to post a top-line declineof 3.6% yoy to `3,309cr for the quarter. C&EPC revenue isexpected to increase by 13.9% yoy to ̀ 1,453cr. On the cementbusiness front, we expect JAL to post a revenue of `1,506cr ona volume of 3.4mt with realization of `4,303/tonne, for thequarter. We expect the company to post a blended EBITDAmargin of 26.1%, registering a growth of 296bp yoy for thequarter. On the bottom-line front, we expect a POn the bottom-line front, we expect a POn the bottom-line front, we expect a POn the bottom-line front, we expect a POn the bottom-line front, we expect a PAAAAAT of T of T of T of T of `̀̀̀̀72cr72cr72cr72cr72cr,,,,,registering a yoy decline of 34.9% in 3QFY2014. This is mainlyregistering a yoy decline of 34.9% in 3QFY2014. This is mainlyregistering a yoy decline of 34.9% in 3QFY2014. This is mainlyregistering a yoy decline of 34.9% in 3QFY2014. This is mainlyregistering a yoy decline of 34.9% in 3QFY2014. This is mainlyon account of a 13% yoy jump expected in the interest cost toon account of a 13% yoy jump expected in the interest cost toon account of a 13% yoy jump expected in the interest cost toon account of a 13% yoy jump expected in the interest cost toon account of a 13% yoy jump expected in the interest cost to`̀̀̀̀600cr600cr600cr600cr600cr.....
L&T (CMP/TP: `1,070/`1,237) (Rating: Buy)
For 3QFY2014, owing to a large order book (~`1.76 trillion)and robust order inflows in the past couple of quarters, weexpect L&T to record a revenue of ̀ 16,667cr, indicating a growthof 8.0% yoy. On the EBITDA front, we expect the company'smargin to witness an expansion of 44bp yoy to 10.0%. WWWWWeeeeeproject the net profit to come in at project the net profit to come in at project the net profit to come in at project the net profit to come in at project the net profit to come in at `̀̀̀̀1,116cr for 3QFY2014,1,116cr for 3QFY2014,1,116cr for 3QFY2014,1,116cr for 3QFY2014,1,116cr for 3QFY2014,registering a growth of 8.5% yoyregistering a growth of 8.5% yoyregistering a growth of 8.5% yoyregistering a growth of 8.5% yoyregistering a growth of 8.5% yoy. . . . . We estimate the company'sorder inflow to be at ~`25,000cr for the quarter, which is inline with the Management's guidance of 15-20% growth in orderbook for the full year.
NCC (CMP/TP: `33/`39) (Rating: Buy)
We expect a mixed performance from NCC for 3QFY2014.On the top-line front, the company is expected to post a healthygrowth of 22.5% to ̀ 1,451cr. This growth would mainly be dueto lower base of last year. Its EBITDA margin is expected togrow by 76bp yoy to 8.0% for the quarter. On the earningsOn the earningsOn the earningsOn the earningsOn the earningsfront, we expect the net profit to decline by 2.9% yoy to front, we expect the net profit to decline by 2.9% yoy to front, we expect the net profit to decline by 2.9% yoy to front, we expect the net profit to decline by 2.9% yoy to front, we expect the net profit to decline by 2.9% yoy to `̀̀̀̀11cr11cr11cr11cr11cr.....This would be primarily on account of high interest cost of ̀ 108cr(up 9.1% yoy) owing to an elongated working capital cycle.
SEL (CMP/TP: `88/`99) (Rating: Accumulate)
On the back of pick up in execution and a low base of3QFY2013, we expect Sadbhav Engineering (SEL) to post astrong performance for the quarter. The company is expectedto post a revenue of ̀ 641cr, a growth of 81.3% yoy. The EBITDAmargin is expected to witness a jump of 64bp yoy to 10.0%,mainly due to pick-up in execution. On the earnings front, theOn the earnings front, theOn the earnings front, theOn the earnings front, theOn the earnings front, thecompany is expected to post a growth of 419.7% yoy to company is expected to post a growth of 419.7% yoy to company is expected to post a growth of 419.7% yoy to company is expected to post a growth of 419.7% yoy to company is expected to post a growth of 419.7% yoy to `̀̀̀̀19cr19cr19cr19cr19crmainly led by revenue growth and lower base of last yearmainly led by revenue growth and lower base of last yearmainly led by revenue growth and lower base of last yearmainly led by revenue growth and lower base of last yearmainly led by revenue growth and lower base of last year.....
Simplex Infra (CMP/TP: `87/-) (Rating: Neutral)
Simplex Infrastructures (Simplex Infra) is expected to post a decentperformance on the revenue front as we expect its top-line to comein at ̀ 1,497cr, registering a growth of 10.7% yoy for 3QFY2014.We expect the EBITDA margin to increase by 40bp to 10.0%. TheTheTheTheThebottom-line is expected to post a growth of 45.9% yoy to bottom-line is expected to post a growth of 45.9% yoy to bottom-line is expected to post a growth of 45.9% yoy to bottom-line is expected to post a growth of 45.9% yoy to bottom-line is expected to post a growth of 45.9% yoy to `̀̀̀̀18cr18cr18cr18cr18crfor the quarterfor the quarterfor the quarterfor the quarterfor the quarter. This is mainly on account of higher. This is mainly on account of higher. This is mainly on account of higher. This is mainly on account of higher. This is mainly on account of higher-than--than--than--than--than-expectedexpectedexpectedexpectedexpectedoperating performance and low base operating performance and low base operating performance and low base operating performance and low base operating performance and low base ofofofofof 3QFY2013. 3QFY2013. 3QFY2013. 3QFY2013. 3QFY2013.
Unity Infra (CMP/TP: `27/-) (Rating: Neutral)
For Unity Infraprojects (Unity Infra), we project a muted2.8% yoy growth in revenue to `567cr for 3QFY2014, due toslowdown in execution on account of the gloomy macroenvironment. On the EBITDAM front, we expect a dip of38bp to 13.5%. The bottom-line is expected to post a decline The bottom-line is expected to post a decline The bottom-line is expected to post a decline The bottom-line is expected to post a decline The bottom-line is expected to post a declineof 37.2% yoy to of 37.2% yoy to of 37.2% yoy to of 37.2% yoy to of 37.2% yoy to `̀̀̀̀18cr for the quarter18cr for the quarter18cr for the quarter18cr for the quarter18cr for the quarter.....
No respite from high interest cost
The high interest cost, owing to a high interest rate regime andincreasing debt levels, has put most of the infrastructurecompanies under our coverage under pressure, resulting in adecline in the bottom-line. Although the RBI kept ratesunchanged in its December 2013 policy review, it continues tomaintain a cautious stance on inflationary pressures. In casefood inflation moderates as expected, it is likely to give respitefrom high overall inflation. This in turn could give the RBI someroom to ease rates going forward.

27
3QFY2014 Results Preview | | | | | January 3, 2014
Refer to important Disclosures at the end of the report
Infrastructure
Analyst: Viral ShahAnalyst: Viral ShahAnalyst: Viral ShahAnalyst: Viral ShahAnalyst: Viral Shah
Source: Company, Angel Research
Exhibit 4: Order inflow yoy growth trend during 2QFY2014 (%)
240
(99)
27
231
(200) (100) - 100 200 300
IVRCL
Sadbhav
L&T
NCC
Simplex In. IVRCL
Sadbhav
L&T
NCC
Simplex In.
Source: Company, Angel Research
Exhibit 5: Decent order book provides revenue visibility
-5.0
0.0
5.0
10.0
15.0
20.0
0.0
1.0
2.0
3.0
4.0
5.0
6.0
Simplex In. Sadbhav L&T IVRCL NCC
OB/Sales (x), RHS Order book growth yoy (%), LHS
Exhibit 6: Quarterly estimates ( `̀̀̀̀ cr)
Source: Company, Angel Research; Note: Price as on December 31, 2013, Target prices are based on SOTP methodology; ̂ Consolidated numbers; *FY2013 figures are for 9 months
CompanyCompanyCompanyCompanyCompany CMPCMPCMPCMPCMP Net SalesNet SalesNet SalesNet SalesNet Sales OPM (%)OPM (%)OPM (%)OPM (%)OPM (%) Net PNet PNet PNet PNet Profitrofitrofitrofitrofit EPS (EPS (EPS (EPS (EPS (`̀̀̀̀))))) EPS (EPS (EPS (EPS (EPS (`̀̀̀̀))))) P/E (x) P/E (x) P/E (x) P/E (x) P/E (x) TTTTTararararargggggeeeeettttt Reco.Reco.Reco.Reco.Reco.
(((((`̀̀̀̀))))) 3QFY14E3QFY14E3QFY14E3QFY14E3QFY14E % chg% chg% chg% chg% chg 3QFY14E3QFY14E3QFY14E3QFY14E3QFY14E chg bpchg bpchg bpchg bpchg bp 3QFY14E3QFY14E3QFY14E3QFY14E3QFY14E % chg% chg% chg% chg% chg 3QFY14E3QFY14E3QFY14E3QFY14E3QFY14E % chg% chg% chg% chg% chg FY13FY13FY13FY13FY13 FY14EFY14EFY14EFY14EFY14E FY15EFY15EFY15EFY15EFY15E FY13FY13FY13FY13FY13 FY14EFY14EFY14EFY14EFY14E FY15EFY15EFY15EFY15EFY15E (((((`̀̀̀̀)))))
ABL^ 61 468 8.7 19.0 8 23 84.1 1.5 84.1 5.3 6.8 7.6 11.4 9.0 8.0 74 Buy
CCCL 4 416 (5.0) 2.5 (49) (15) - (0.8) - (4.2) (2.9) (0.4) (0.9) (1.4) (11.1) - Neutral
IRB Infra^ 93 941 3.0 45.0 36 102 (28.9) 3.1 (28.9) 16.7 14.6 15.1 5.5 6.3 6.1 112 Buy
ITNL^ 140 1,819 3.1 28.0 251 105 0.5 5.4 0.5 26.8 30.1 32.3 5.2 4.7 4.3 156 Accum.
IVRCL 16 1,360 7.1 8.5 314 (34) - (1.3) - (3.3) (2.5) (2.1) (4.9) (6.5) (7.8) - Neutral
JAL 55 3,309 (3.6) 26.1 296 72 (34.9) 0.3 (34.9) 2.5 1.6 2.5 22.1 34.9 21.8 - Neutral
L&T 1,070 16,667 8.0 10.0 44 1,116 8.5 12.1 8.5 44.1 46.7 52.0 24.3 22.9 20.6 1,237 Buy
NCC 33 1,451 22.5 8.0 76 11 (2.9) 0.4 (2.9) 2.4 2.4 2.6 13.6 13.9 12.7 39 Buy
SEL 88 641 81.3 10.0 64 19 419.7 0.1 419.7 0.9 4.6 5.8 101.5 19.0 15.1 99 Accum.
Simplex In. 87 1,497 10.7 10.0 40 18 45.9 3.5 45.9 10.8 12.4 16.7 8.1 7.0 5.2 - Neutral
Unity Infra 27 567 2.8 13.5 (38) 18 (37.2) 2.4 (37.2) 12.5 9.3 9.5 2.1 2.9 2.8 - Neutral
Outlook and valuation
In the past 12-18 months, there has been no respite forinfrastructure companies from persistent headwinds such asinflationary pressures, slow order inflows, high interest ratesand policy paralysis. This has resulted in execution slowdownand shrinking bottom-lines of most of the infrastructurecompanies under our coverage. Many projects could not takeoff due to delay in approvals and decision making. Along withthis, a lack of investment in the infrastructure sector has resultedin a downward spiral for infrastructure stocks over the last oneyear. However, infrastructure stocks have seen some positivemovement during the past few weeks as the Indian governmenthas unleashed various reforms to help revive the dampenedinvestment sentiment and to bolster the country's economicgrowth. The CCI formed by the government to fast-trackclearances of large investments has been on a roll, clearingvarious stalled projects in the infrastructure sector. However webelieve that it will take time for these measures to yield afavorable stimulus for the sector. Although interest rate cuts andincreasing investment in the sector remain key triggers forinfrastructure stocks, removal of bottlenecks such as delays inenvironmental clearances and land-acquisition issues are alsoof prime importance for the execution pace to pick up.
WWWWWe prefer to remain selective:e prefer to remain selective:e prefer to remain selective:e prefer to remain selective:e prefer to remain selective: We believe that stock-specificapproach would yield higher returns, given the disparity amongthe companies in our coverage universe and changing dynamicsaffecting them, either positively or negatively. Hence, we remainpositive on companies having 1) a comfortable leverageposition; 2) superior return ratios and 3) less dependence oncapital markets for raising equity for funding projects. WWWWWeeeeerecommend L&Trecommend L&Trecommend L&Trecommend L&Trecommend L&T, ITNL and SEL as our top picks in the sector, ITNL and SEL as our top picks in the sector, ITNL and SEL as our top picks in the sector, ITNL and SEL as our top picks in the sector, ITNL and SEL as our top picks in the sector.....
Order backlog remains healthy
The order book for most of the companies in our coverageuniverse has remained decent despite sluggish order inflows,mainly led by slowdown in execution pace due to persistentheadwinds faced by the sector. This order backlog gives comfortfor growth over the next couple of years. For few companiessuch as NCC and SEL, the order book has been boosted bycaptive orders during the last financial year.

Refer to important Disclosures at the end of the report 28
3QFY2014 Results Preview | | | | | January 3, 2014
Information Technology
Improved macroeconomic outlook indicates stableCY2014 IT budgets
The Indian IT services industry is likely to touch ~US$110bn inFY2014 according to Nasscom; of this exports are likely to beabout US$84-87bn, a growth of 12-14%. According to Gartner,IT spending in India is projected to total US$71.3bn in 2014, a5.9% increase from the US$67.4bn forecast for 2013. IT serviceswill record the strongest revenue growth at 12.1%, softwarerevenue will grow by 10%, and the telecommunication servicessegment, is set to grow by 2% in 2014. In addition, according toIDC, a market research firm, the global tech spending is expectedto grow by 4% in 2014 in constant currency, reaching US$2.04tn,on the back of continued momentum in the US and Europe.
During the quarter, Indian IT stocks reacted positively followingsigns of a demand uptick and indications that IT budgetingcycle for CY2014 is expected to begin on a positive note withsigns of improvement in economic activities. RecentManagement commentaries indicate that growth has beenbroad based and has picked up for both large and mediumcompanies, and the problematic segments have either bottomedout or have started accelerating.
Economic indicators:Economic indicators:Economic indicators:Economic indicators:Economic indicators: The US' real GDP grew by 3.6% in3QCY2013, following a 2.8% rise in 2QCY2013, the fastestpace since late 2011. In addition, corporate profits in3QCY2013 increased by an annualized 11.5%, following again of 8.5% in 2QCY2013. For November 2013, data pointsfor the US economy are largely encouraging. For instance,1) the manufacturing index increased to 57.3 against 56.4 inOctober 2013; 2) industrial production growth jumped 1.1%,following a 0.1% rise in October 2013; 3) retail sales grew by0.7% as against 0.6% in October 2013; 4) monthly growth innew non-manufacturing orders remained solid, indicatingstrength in general activity in the months ahead even as thenon-manufacturing index declined to 53.9 from 55.4 in October2013; 5) unemployment rate dipped to 7.0% as against 7.3%in October 2013; and 6) personal income growth rebounded0.2%, following a 0.1% dip in October. These improvedeconomic data points from the US indicate towards an optimisticdemand scenario in the country. Given the current environment,we expect volume growth for tier-I Indian IT companies to be inthe range of 9-14% for FY2014 and expect industry to grow inthe range of 11-14% in FY2015.
TTTTTech numbers: ech numbers: ech numbers: ech numbers: ech numbers: The recent quarterly numbers from Oracle andAccenture gave improved signals for the Indian IT sector goinginto CY2014. Oracle's Cloud revenue registered a robust growthwith overall revenues rising by 2% to US$9.3bn. For Accenture,revenues increased by 3% yoy in constant currency (CC) termsto US$7.4bn; the Outsourcing business expanded by 6% yoy inCC terms whilst the Consulting business was flat yoy inCC terms. Better-than-expected numbers from the two globalIT players is a positive sign for Indian IT companies.
Our take:Our take:Our take:Our take:Our take: We expect IT budgets to remain flat to marginallypositive in CY2014 with IT spend now driven by trends such asincreased off-shoring of work from Europe and vendorconsolidation. Market share gains in the renewal deal pipelinewill be a key differentiator of volume growth across players, inour view. Historically the demand environment has matteredmore to stock price performances in the IT sector; significantINR depreciation does not help stocks if the demand environmentis worsening; conversely appreciation in the INR does not hurtif demand picks up. If INR stabilizes at current levels orstrengthens further, the IT stock prices might witness marginalcorrection, but from a longer term perspective they may stilldeliver a reasonable performance.
Source: Bloomberg, Angel Research
Exhibit 1: Relative performance to Sensex during 3QFY2014
15.5
15.3
10.9
17.8
17.4
38.0
(3.1)
2.1
29.3
56.5
33.3
(8.0) 0.0 8.0 16.0 24.0 32.0 40.0 48.0 56.0 64.0
BSE IT Index
Infosys
TCS
Wipro
HCL Tech
Tech Mahindra
Mphasis
Hexaware
Mindtree
Persistent
KPIT Cummins
(%)
Cyclically a weak quarter with decent volume growth
Traditionally, 3Q (FY) is a weak quarter for IT companies as thenumber of working days are less compared to other quarters,due to the holiday season at client sites. Volume growth in3QFY2014 will be impacted due to following factors - a) lesserworking days due to holidays, b) furloughs across industriesand c) lower spending in verticals such as retail, manufacturingand in services like consulting and enterprise solutions.
We expect revenue growth in 3QFY2014 to be largely volumedriven and pricing to remain stable. For 3QFY2014, volumegrowth is expected to be in the range of 2.0-3.4% qoq for tier-I ITcompanies, with TCS to continue to lead the pack. For tier-IIcompanies, we expect growth to be modest at 1.7-3.5% qoq,with Persistent Systems (Persistent) and Hexaware leading the pack.
USD revenue to grow, albeit at a slower pace
The cross-currency movement this quarter has been positive forIndian IT companies. So we expect a positive impact of~20-40bp qoq on USD revenue of Infosys, TCS, Wipro and HCLTechnologies (HCL Tech) on this account. On the back of pent updemand for discretionary services and abating attrition, we expectutilization to remain tightly held and revenue growth to be enhanced.
For 3QFY2014, on the back of fair volume growth, stable pricingand positive cross-currency movement, we expect USD revenueof tier-I IT companies to grow by 2.3-3.6% qoq, with TCS leadingthe pack.

29
3QFY2014 Results Preview | | | | | January 3, 2014
Refer to important Disclosures at the end of the report
Information Technology
Source: Company, Angel Research; Note: *For the IT services segment
Exhibit 2: Trend in USD revenue growth (qoq) - Tier-I
6.3
1.4
2.7
3.8
2.3
3.33.1
4.1
5.4
3.63.6
3.2 3.1 3.53.3
2.4
0.5 0.2
2.72.5
0
1
2
3
4
5
6
7
3QFY13 4QFY13 1QFY14 2QFY14 3QFY14E
(%)
Infosys TCS HCL Tech Wipro*
Source: Company, Angel Research; Note: *For the IT services segment
Exhibit 4: Trend in INR revenue growth (qoq) - Tier-I
5.7
0.3
7.8
15.1
1.0
2.9 2.2
9.5
16.6
2.23.0
2.4
8.6
14.1
2.22.7
(0.6)
4.5
12.7
3.0
(2)
0
2
4
6
8
10
12
14
16
18
3QFY13 4QFY13 1QFY14 2QFY14 3QFY14E
(%)
Infosys TCS HCL Tech Wipro*
Operating margins to decline marginally
Indian IT companies are expected to witness a marginal declineon the operating margin front due to slight INR appreciation aswell as relatively subdued volume growth expected during thequarter. We expect the EBITDA margin of Infosys to inch up by21bp qoq to 26.4% on account of benefits from cost optimizationdrive going on in the company as well as uptick in utilizationlevel which will overshadow the negative impacts from lowvolume growth and INR appreciation. TCS is expected to post amarginal decline of 23bp qoq in its EBITDA margin to 31.4%due to muted volume growth and sequentially lower INR realizedrate. However, excluding the currency impact, the company’soperating margins are expected to be comparable to that inthe last quarter. Wipro's (IT services) EBITDA margin is expectedto inch up by 22bp qoq to 25.3% on account of increase inutilization level, while HCL Tech is expected to report a 33bp qoqdecline in EBITDA margin to 26.0% due to muted volume growthand slight dip in utilization level as the company was running ona very high utilization level in the last couple of quarters.
For tier-II IT companies under our coverage, we expect slightINR appreciation and low volume growth to negatively impactoperating margin by 20-50bp on a qoq basis. The EBITDAmargins of Tech Mahindra, MindTree, Persistent and Hexawareare expected to show a decline of 20bp, 24bp, 21bp and26bp qoq to 23.1%, 20.5%, 25.7 and 23.5%, respectively. KPITCummins is expected to post a 91bp qoq gain in operatingmargin to 16.4% due to absence of any one-time cost whichwas there in 2QFY2014.
Source: Company, Angel Research
Exhibit 3: Trend in USD revenue growth (qoq) - Tier-II
2.4
1.72.3
2.53.2
2.7
(4)
(2)
0
2
4
6
8
10
12
4QFY13 1QFY14 2QFY14 3QFY14E
(%)
Tech Mahindra Mphasis MindTree Persistent Hexaware KPIT
For tier-II IT companies, USD revenue growth is expectedto be 1.7-3.2% qoq, with Hexaware, Persistent and KPITTechnologies leading the pack.
For tier-II IT companies, INR revenue growth is expected to bein the range of 0.5-2.7% qoq, with MphasiS leading the pack.
Source: Company, Angel Research
Exhibit 5: Trend in INR revenue growth (qoq) - Tier-II
Tech Mahindra KPIT Mphasis MindTree Persistent Hexaware
0.81.7
2.72.2
0.61.7
0
4
8
12
16
20
4QFY13 1QFY14 2QFY14 3QFY14E
(%)
INR revenue growth to be muted
After almost a year of volatile sessions seen in terms of currency,3QFY2014 saw some stability in the currency movement. Onan average basis, the INR appreciated marginally by ~0.2%qoq during 3QFY2014. This will negatively impact the INRrevenue growth and can trim down the operating margins ofIT players by 0-10bp qoq. For 3QFY2014, in INR terms, revenuegrowth is expected to be in the range of 1.0-3.0% qoq fortier-I IT companies.
Source: Company, Angel Research; Note: *For IT services segment
Exhibit 6: EBITDA margin profile - Tier-I
Infosys TCS HCL Tech Wipro*
29.1
28.526.5
26.526.1
26.428.4
29.028.4 28.6
31.6 31.4
22.222.6 22.4
23.1
26.3
26.023.7
23.523.0
22.6
25.1 25.3
19
22
25
28
31
34
2QFY13 3QFY13 4QFY13 1QFY14 2QFY14 3QFY14E
(%)

Refer to important Disclosures at the end of the report 30
3QFY2014 Results Preview | | | | | January 3, 2014
Information Technology
Analyst - Ankita SomaniAnalyst - Ankita SomaniAnalyst - Ankita SomaniAnalyst - Ankita SomaniAnalyst - Ankita Somani
Exhibit 7: Quarterly estimates ( `̀̀̀̀ cr)
Source: Company, Angel Research; Note: Price as on December 31, 2013; *June ending so 2QFY2014 estimates; ^October ending so 1QFY2014 estimates; #December endingso 4QCY2013 estimates; Change is on a qoq basis
CompanyCompanyCompanyCompanyCompany CMPCMPCMPCMPCMP Net SalesNet SalesNet SalesNet SalesNet Sales OPM (%)OPM (%)OPM (%)OPM (%)OPM (%) Net PNet PNet PNet PNet Profitrofitrofitrofitrofit EPS (EPS (EPS (EPS (EPS (`̀̀̀̀))))) EPS (EPS (EPS (EPS (EPS (`̀̀̀̀))))) P/E (x)P/E (x)P/E (x)P/E (x)P/E (x) TTTTTararararargggggeeeeettttt Reco.Reco.Reco.Reco.Reco.
(((((`̀̀̀̀))))) 3QFY14E3QFY14E3QFY14E3QFY14E3QFY14E % chg% chg% chg% chg% chg 3QFY14E3QFY14E3QFY14E3QFY14E3QFY14E chg bpchg bpchg bpchg bpchg bp 3QFY14E3QFY14E3QFY14E3QFY14E3QFY14E % chg% chg% chg% chg% chg 3QFY14E3QFY14E3QFY14E3QFY14E3QFY14E % chg% chg% chg% chg% chg FY13FY13FY13FY13FY13 FY14EFY14EFY14EFY14EFY14E FY15EFY15EFY15EFY15EFY15E FY13FY13FY13FY13FY13 FY14EFY14EFY14EFY14EFY14E FY15EFY15EFY15EFY15EFY15E (((((`̀̀̀̀)))))
TCS 2,171 21,434 2.2 31.4 (23) 4,955 5.4 25.3 5.4 71.2 95.2 115.4 30.5 22.8 18.8 2,500 Buy
Infosys 3,486 13,101 1.0 26.4 21 2,650 0.9 46.4 0.9 164.9 178.2 214.9 21.1 19.6 16.2 - Neutral
Wipro 559 11,452 4.2 22.9 8 2,022 4.1 8.2 4.1 24.8 31.4 36.1 22.5 17.8 15.5 600 Accum.
HCL Tech* 1,263 8,136 2.2 26.0 (33) 1,450 2.4 20.0 2.4 57.1 81.9 91.4 22.1 15.4 13.8 1,350 Accum.
Tech Mah. 1,838 4,811 0.8 23.1 (20) 735 2.3 31.0 2.3 82.6 121.6 132.4 22.3 15.1 13.9 1,935 Accum.
Mphasis^ 438 1,637 2.7 17.2 (34) 193 1.6 9.2 1.6 35.4 39.7 45.3 12.4 11.0 9.7 - Neutral
Hexaware# 132 632 1.7 23.5 (26) 104 5.1 3.4 5.1 10.9 12.6 14.2 12.1 10.4 9.3 142 Accum.
Mindtree 1,531 786 2.2 20.5 (24) 104 (19.4) 24.8 (19.4) 81.7 114.7 132.7 18.7 13.3 11.5 1,650 Accum.
Persistent 980 435 0.6 25.7 (21) 59 (2.8) 14.8 (2.8) 46.9 60.2 76.3 20.9 16.3 12.8 - Neutral
KPIT Tech. 172 715 1.7 16.4 91 67 0.2 7.4 0.2 10.6 13.4 16.5 16.3 12.8 10.4 - Neutral
Infotech Entp. 341 554 0.8 19.4 (41) 72 (1.4) 6.4 (1.4) 20.7 24.2 27.2 16.5 14.0 12.5 - Neutral
Earnings growth to be a mixed bag
On the back of INR appreciation and reasonable volume growth,profitability of tier-I companies such as TCS, Infosys and Wipro isexpected to increase moderately by 5.4%, 0.9% and 4.1%,respectively. TCS expects forex gains of ̀ 150-200cr, given currentexchange rates as against forex losses of `377cr reported in2QFY2014. This will contribute to a sharp improvement in netincome. Amongst mid-tier IT companies under our coverage, theirearnings growth is expected to show a modest increase barringMindTree and Persistent which would be impacted due toconsiderably lower other income sequentially.
Outlook and valuation
For FY2014, Nasscom estimates total revenues(domestic+exports; excludes hardware) of the Indian-IT servicesindustry to grow by about 13-15% to reach US$106-111bn; ofthis, exports are likely to be about US$84-87bn, a growth ofabout 12-14%. With the global macro data being steady, webelieve that the demand environment for the IT sector will remainstable. As per Nasscom, five major technology changes areexpected to open new opportunities for service providers - iesmart computing (expected to drive industry-specific solutions),Software-as-a-Service (SaaS to play a dominant role), socialtechnologies (empower all elements of an industry's value chainincluding suppliers, employees, customers, and businesspartners), mobility (access to anytime, anywhere information)and analytics (real-time intelligence).
We believe FY2014 will again have the trend of divergent growthrates among tier-I companies with TCS and HCL Tech growingat a rate higher than the industry's average (in mid-teens). Webelieve IT services demand is likely to continue to improve inFY2015 led by a better macroeconomic growth outlook.Preliminary discussions with IT companies and clients indicate
that IT budgeting cycle for CY2014 is expected to begin on apositive note with signs of improvement in economic activities.Increasing offshore penetration in Europe and in the relativelyuntapped infrastructure services segment remains a multi-yeargrowth driver. In addition, pick-up in discretionary spend in theUS geography as well as demand for new technologies ie Social,Mobility, Analytics and Cloud is also likely to drive demand.With the INR depreciating sharply against the USD, we expectIT companies to deploy the gains towards sales and marketing,towards mitigating the impact of the Immigration bill andtowards making investments in new service lines.
Sector valuations are in line with the historical average and webelieve they can sustain, given an improving demand outlookand receding risks. We expect TCS to outperform the industryon the revenue growth front due to its superior market reachand excellent execution capabilities. We believe TCS deservesthe premium multiples that it currently commands, given itsconsistency in performance and leadership in growth/profitability. We maintain our Buy rating on the stock with atarget price of `2,500. In addition, HCL Tech is also expectedto perform well going ahead and we recommend an Accumulaterating on the stock with a target price of ̀ 1,350. We recommenda Neutral rating on Infosys, given eight senior Managementresignations this year and the stock is already being rewardedfor its better performance in the last two quarters. Further, werecommend an Accumulate rating on Wipro with a target priceof `600. Among mid-caps, we continue to like Tech Mahindraas the merger of Satyam with Tech Mahindra gives the companyhigher flexibility for investments, reduces client and verticalexposure and also provides superior financial strength;we recommend Accumulate on it with a target price of ̀ 1,935.In addition, we remain positive on MindTree with a targetprice of `1,650.

31
3QFY2014 Results Preview | | | | | January 3, 2014
Refer to important Disclosures at the end of the report
Media
Healthy top-line growth
For 3QFY2014, we expect our Media universe to post a top-linegrowth of 17.2% yoy on an overall basis. Festive season coupledwith the recently held state elections in 4 states will likely drive top-line growth for print media companies. Although Sun TV Network(Sun TV) is expected to benefit from strong growth in subscriptionrevenue, advertising revenue growth is expected to be sluggishdue to imposition of 12 minute ad-limit per hour by TRAI. PVR isexpected to post a healthy revenue growth on like-to-like basis onthe back of robust performance of the Exhibition segment (especiallyon account of the strong performance of Dhoom 3).
Source: Bloomberg, Angel Research
Exhibit 1: Newsprint prices
15,000
20,000
25,000
30,000
35,000
40,000
45,000
400
450
500
550
600
650
700
750
800
Dec-06 Dec-07 Dec-08 Dec-09 Dec-10 Dec-11 Dec-12 Dec-13
(IN
R/t
onne)
(USD
/tonne)
USD/tonne INR/tonne
Newsprint prices up yoy in INR terms(due to INR depreciation)
Outlook and valuation
Due to OPM pressure on account of higher newsprint costs(due to rupee depreciation) and cyclical nature of ad revenuegrowth (sluggish due to slower GDP growth), print media stocksare currently trading at relatively cheaper valuations. However,considering the structural positives of the print business (highbrand loyalty and significant entry barriers), reduction in lossesof emerging editions and expected uptick in advertising aidedby upcoming elections, in our view, print media stocks deservea premium to the Sensex. Hence, we recommend Buy ratingwe recommend Buy ratingwe recommend Buy ratingwe recommend Buy ratingwe recommend Buy ratingon Jagran Pon Jagran Pon Jagran Pon Jagran Pon Jagran Prakshan and HT Media and Accumulate onrakshan and HT Media and Accumulate onrakshan and HT Media and Accumulate onrakshan and HT Media and Accumulate onrakshan and HT Media and Accumulate onDB Corp.DB Corp.DB Corp.DB Corp.DB Corp.
Analyst - Amit PAnalyst - Amit PAnalyst - Amit PAnalyst - Amit PAnalyst - Amit Patilatilatilatilatil
Exhibit 3: Quarterly estimates ( `̀̀̀̀ cr)
Source: Company, Angel Research; Note: Price as on December 31, 2013
CompanyCompanyCompanyCompanyCompany CMPCMPCMPCMPCMP Net SalesNet SalesNet SalesNet SalesNet Sales OPM (%)OPM (%)OPM (%)OPM (%)OPM (%) Net PNet PNet PNet PNet Profitrofitrofitrofitrofit EPS (EPS (EPS (EPS (EPS ( `̀̀̀̀))))) EPS (EPS (EPS (EPS (EPS (`̀̀̀̀))))) P/E (x)P/E (x)P/E (x)P/E (x)P/E (x) TTTTTararararargggggeeeeettttt Reco.Reco.Reco.Reco.Reco.
(((((`̀̀̀̀))))) 3QFY14E3QFY14E3QFY14E3QFY14E3QFY14E % chg% chg% chg% chg% chg 3QFY14E3QFY14E3QFY14E3QFY14E3QFY14E chg bpchg bpchg bpchg bpchg bp 3QFY14E3QFY14E3QFY14E3QFY14E3QFY14E % chg% chg% chg% chg% chg 3QFY14E3QFY14E3QFY14E3QFY14E3QFY14E % chg% chg% chg% chg% chg FY13FY13FY13FY13FY13 FY14EFY14EFY14EFY14EFY14E FY15EFY15EFY15EFY15EFY15E FY13FY13FY13FY13FY13 FY14EFY14EFY14EFY14EFY14E FY15EFY15EFY15EFY15EFY15E (((((`̀̀̀̀)))))
Jagran 91 406 19.0 25.4 84 63 (4.3) 2.0 (4.3) 8.1 6.8 7.7 11.2 13.3 11.7 111 Buy
D B Corp 293 493 12.3 27.6 44 81 14.9 4.4 14.9 11.9 15.5 17.9 24.7 18.9 16.4 330 Accum.
HT Media 78 560 2.3 16.1 11 64 18.7 2.7 18.7 7.1 8.8 9.3 10.9 8.9 8.4 104 Buy
PVR 646 368 82.0 19.1 236 23 157.5 5.8 82.7 11.2 18.8 25.5 57.5 34.4 25.3 - Neutral
Sun TV 382 536 10.4 73.6 (386) 195 2.6 4.9 2.6 18.3 19.5 23.5 20.8 19.6 16.2 - Neutral
Source: Bloomberg, Angel Research
Exhibit 2: Relative performance to Sensex during 3QFY2014
21
(11)
10
32
(3)
9
(15)
(10)
(5)
-
5
10
15
20
25
30
35
DBCORP HTMEDIA JAGRAN PVR SUNTV SENSEX
Although average prices of newsprint declined 5.3% yoy to$587, the depreciation in the INR vs the USD led to an8.5% yoy increase in newsprint prices in INR terms. Print mediacompanies have opted to hike cover prices selectively in theirmature markets to alleviate margin pressure due to increase innewsprint cost.
Key developmentBroadcasters approach Delhi HC after TDSAT dismissesappeal on ad limit imposed by TRAI
After Telecom Disputes Settlement and Appellate Tribunal(TDSAT)'s dismissal of New Broadcasters Association (NBA)'sappeal against TRAI's decision (to impose the 12-minuteadvertising limit for one hour programming), NBA has nowappealed against TRAI's decision in Delhi High Court. According
to Indiantelevision.com, the Delhi HC has granted an interiminjunction, asking TRAI to not take any action againstbroadcasters, if they exceed the ad-cap enforced by theregulator. At the same time, it has also asked the broadcastersto maintain records of the amount of airtime on each channelon a weekly basis.
Imposition of ad-limit will limit broadcaster's ad inventory andhence, is a negative development for broadcasting companies.Many broadcasters including Sun TV have increased advertisingrates in the previous quarter to try and minimize the impact ofTRAI's advertising limit.
Performance on the bourses

Refer to important Disclosures at the end of the report 32
3QFY2014 Results Preview | | | | | January 3, 2014
Metals
Source: Bloomberg, Angel Research
Exhibit 1: Metal stocks’ performance – 3QFY2014
(10.0) 0.0 10.0 20.0 30.0 40.0 50.0 60.0
JSW
BSE Metal Index
MOIL
NMDC
HZL
COAL
(%)
For 3QFY2014 we expect the profitability of steel companiesunder our coverage universe to improve qoq. This is on accountof higher prices aided by INR depreciation and seasonal pick-up. Even on a yoy basis, we expect operating profits of companies(excluding SAIL) to improve, mainly aided by higher volumes.
During 3QFY2014 steel prices rose modestly in the US whilethey were flat in the domestic market. Steel prices in the USgrew by 3.2% while in China and CIS they declined by 3.3%and 1.1% qoq, respectively, during 3QFY2014. Indian steelcompanies had announced price hikes in the range of 3-7%effective September 2013. However, weak domestic demandalongside fragmented domestic industry led to prices comingdown in the form of discounts. Real steel consumption in Indiawas flat yoy during April-September 2013 due to low demandfrom the construction and automotive sectors.
For 4QFY2014, coking coal contract prices are likely to settleat US$150/tonne, compared to US$152/tonne during3QFY2014. Iron ore contract prices for 4QFY2014 are expectedto increase as spot iron ore prices have risen during 3QFY2014.
We expect non-ferrous companies' profitability to improve yoyduring 3QFY2014. National Aluminium (Nalco) and HindustanZinc (HZL) are expected to report improvement in profitabilitywhile Hindalco's net profit is likely to decline due to higher interestand depreciation costs.
Due to the uncertain economic environment, falling demand,and a slump in the capex cycle, metal companies are slowingtheir expansion plans. Although no formal announcements havecome, we foresee some steel companies slowing their expansionschedules. SAIL, Monnet Ispat, Bhushan Steel and Hindalco arelikely to go slow on their capacity expansion schedule.
Metals and mining stocks had declined sharply duringJanuary - July 2013 on the back of gradual (but steady) fall inproduct prices, declining demand, slow down in capex cycleetc. However, since August, the stocks have risen sharply ledby: 1) improvement in sentiment in developed countries, 2) INRweakening against the USD, and 3) cheap valuations. The BSEMetal Index posted a positive return of 19.0% in 3QFY2014;all the stocks under our coverage except for Coal India andHZL gave positive returns. Tata Steel, JSW Steel and SAIL gavepositive returns of 56.0%, 39.4% and 45.1% respectively. Amongthe non-ferrous space Nalco and and Hindalco rose by 15.8% and9.6% respectively. Sesa Sterlite also rose post the merger and gave
Source: Bloomberg, Angel Research
Exhibit 2: US HRC prices rose qoq
0
500
1,000
1,500
2,000
2,500
3,000
3,500
4,000
4,500
500
550
600
650
700
750
800
Jan
-13
Feb
-13
Feb
-13
Mar-
13
Apr-
13
Apr-
13
May-
13
Jun
-13
Jul-
13
Jul-
13
Aug
-13
Sep
-13
Sep
-13
Oct
-13
Nov-
13
Nov-
13
Dec-1
3
(Yuan/t
onne)
(US$/t
onne)
USA HRC/tonne China HRC/tonne (RHS)
11.7% returns. Among the PSU miners NMDC and MOIL rose by18.2% and 18.4% respectively during the quarter.
Key eventsSesa Sterlite commenced mining in KarnatakaDuring December 2013, Sesa Sterlite commenced its iron oremining operations in Karnataka after getting the necessaryapprovals from the Supreme Court's appointed authority CEC.The Supreme Court (in April 2013) had lifted the blanket banon iron ore mining in the state and had ordered that operationsof Category A and B mines can commence after getting allnecessary clearances from CEC and MoEF.
CCI slapped `1,773cr penalty on Coal IndiaDuring 3QFY2014 the Competition Commission of India (CCI)had slapped a penalty of ̀ 1,773cr on Coal India (CIL) for abusingdominant power in the coal exploration business. The penaltyfigure stood at ~10.2% of the company's consolidated PAT forFY2013. CIL is likely to appeal against this order at the tribunal.
NMDC hiked iron ore pricesNMDC hiked its iron ore price during October-November 2013.Lumps contribute ~35% of NMDC's product mix. The companyincreased the price of lumps by `100/tonne in October and`200/tonne in November. Further, it hiked the price of iron orefines by ̀ 200/tonne in November 2013. The prices for Decemberstood at `4,500/tonne for lumps and `2,810/tonne for fines.
Supreme Court allowed Goa to liquidate Iron oreinventory through e-auctionsDuring November 2013, the Supreme Court permitted iron oreminers in Goa to sell their existing iron ore inventory throughe-auctions. The total iron ore inventory in Goa was estimatedto be 11.5mn tonne, of which, ~3.8mn tonne was Sesa Sterlite's.The Supreme Court suggested setting up a six-member expertcommittee to study the cap on production in Goa based oncarrying capacity of roads and other factors. The panel wouldpresent an interim report by February 15, 2014.
Coal Ministry panel cancels award of 11 captive blocksDuring 3QFY2014 a Coal Ministry panel de-allocated 11 captivecoal blocks belonging to Jindal Steel and Power (JSPL), Tata Steeland Monnet Ispat & Energy. Some of the mines de-allocated includetwo blocks Amarkonda Murgadangal and Ramchandi belongingto JSPL and the Urtan North block allocated jointly to JSPL andMonnet Ispat & Energy.
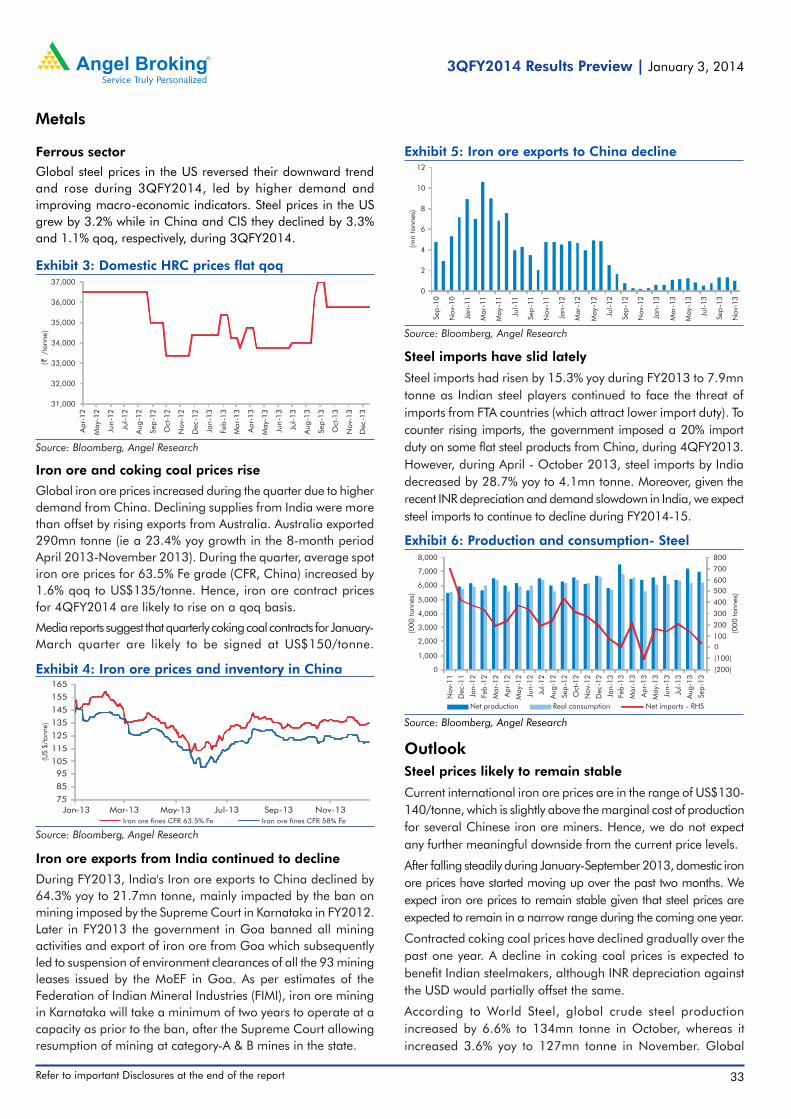
33
3QFY2014 Results Preview | | | | | January 3, 2014
Refer to important Disclosures at the end of the report
Metals
Source: Bloomberg, Angel Research
Exhibit 3: Domestic HRC prices flat qoq
31,000
32,000
33,000
34,000
35,000
36,000
37,000
Apr-
12
May-
12
Jun
-12
Jul-
12
Aug
-12
Sep
-12
Oct
-12
Nov-
12
Dec-1
2
Jan
-13
Feb
-13
Mar-
13
Apr-
13
May-
13
Jun
-13
Jul-
13
Aug
-13
Sep
-13
Oct
-13
Nov-
13
Dec-1
3
(`/t
onne)
Source: Bloomberg, Angel Research
Exhibit 4: Iron ore prices and inventory in China
Iron ore fines CFR 63.5% Fe Iron ore fines CFR 58% Fe
75
85
95
105
115
125
135
145
155
165
Jan-13 Mar-13 May-13 Jul-13 Sep-13 Nov-13
(US
$/t
onne)
Source: Bloomberg, Angel Research
Exhibit 5: Iron ore exports to China decline
0
2
4
6
8
10
12
Sep
-10
Nov-
10
Jan
-11
Mar-
11
May-
11
Jul-
11
Sep
-11
Nov-
11
Jan
-12
Mar-
12
May-
12
Jul-
12
Sep
-12
Nov-
12
Jan
-13
Mar-
13
May-
13
Jul-
13
Sep
-13
Nov-
13
(mn
tonnes)
Source: Bloomberg, Angel Research
Exhibit 6: Production and consumption- Steel
(200)
(100)
0
100
200
300
400
500
600
700
800
0
1,000
2,000
3,000
4,000
5,000
6,000
7,000
8,000
Nov-
11
Dec-1
1
Jan
-12
Feb
-12
Mar-
12
Apr-
12
May-
12
Jun
-12
Jul-
12
Aug
-12
Sep
-12
Oct
-12
Nov-
12
Dec-1
2
Jan
-13
Feb
-13
Mar-
13
Apr-
13
May-
13
Jun
-13
Jul-
13
Aug
-13
Sep
-13
(000
tonnes)
(000
tonnes)
Net production Real consumption Net imports - RHS
Iron ore and coking coal prices rise
Global iron ore prices increased during the quarter due to higherdemand from China. Declining supplies from India were morethan offset by rising exports from Australia. Australia exported290mn tonne (ie a 23.4% yoy growth in the 8-month periodApril 2013-November 2013). During the quarter, average spotiron ore prices for 63.5% Fe grade (CFR, China) increased by1.6% qoq to US$135/tonne. Hence, iron ore contract pricesfor 4QFY2014 are likely to rise on a qoq basis.
Media reports suggest that quarterly coking coal contracts for January-March quarter are likely to be signed at US$150/tonne.
OutlookSteel prices likely to remain stable
Current international iron ore prices are in the range of US$130-140/tonne, which is slightly above the marginal cost of productionfor several Chinese iron ore miners. Hence, we do not expectany further meaningful downside from the current price levels.
After falling steadily during January-September 2013, domestic ironore prices have started moving up over the past two months. Weexpect iron ore prices to remain stable given that steel prices areexpected to remain in a narrow range during the coming one year.
Contracted coking coal prices have declined gradually over thepast one year. A decline in coking coal prices is expected tobenefit Indian steelmakers, although INR depreciation againstthe USD would partially offset the same.
According to World Steel, global crude steel productionincreased by 6.6% to 134mn tonne in October, whereas itincreased 3.6% yoy to 127mn tonne in November. Global
Iron ore exports from India continued to decline
During FY2013, India's Iron ore exports to China declined by64.3% yoy to 21.7mn tonne, mainly impacted by the ban onmining imposed by the Supreme Court in Karnataka in FY2012.Later in FY2013 the government in Goa banned all miningactivities and export of iron ore from Goa which subsequentlyled to suspension of environment clearances of all the 93 miningleases issued by the MoEF in Goa. As per estimates of theFederation of Indian Mineral Industries (FIMI), iron ore miningin Karnataka will take a minimum of two years to operate at acapacity as prior to the ban, after the Supreme Court allowingresumption of mining at category-A & B mines in the state.
Steel imports have slid lately
Steel imports had risen by 15.3% yoy during FY2013 to 7.9mntonne as Indian steel players continued to face the threat ofimports from FTA countries (which attract lower import duty). Tocounter rising imports, the government imposed a 20% importduty on some flat steel products from China, during 4QFY2013.However, during April - October 2013, steel imports by Indiadecreased by 28.7% yoy to 4.1mn tonne. Moreover, given therecent INR depreciation and demand slowdown in India, we expectsteel imports to continue to decline during FY2014-15.
Ferrous sectorGlobal steel prices in the US reversed their downward trendand rose during 3QFY2014, led by higher demand andimproving macro-economic indicators. Steel prices in the USgrew by 3.2% while in China and CIS they declined by 3.3%and 1.1% qoq, respectively, during 3QFY2014.

Refer to important Disclosures at the end of the report 34
3QFY2014 Results Preview | | | | | January 3, 2014
Outlook
Non-ferrous companies are expected to face a double whammyof lower product prices coupled with higher input costs duringFY2014. Base metal prices in USD terms have declined overthe past one year and hence realizations for companies areexpected to decline during FY2014 (partially offset by INRdepreciation against the USD). Further, although severalaluminium companies (globally) have announced productioncuts, we are yet to see any meaningful decline in actualproduction. Thus, lower realizations coupled with higher pricesof key inputs such as imported coal, caustic soda, CP pitch andpetroleum coke are expected to hit margins of non-ferrouscompanies over the coming one year in our view.
3QFY2014 expectations: 3QFY2014 expectations: 3QFY2014 expectations: 3QFY2014 expectations: 3QFY2014 expectations: For 3QFY2014, we expect net profitof non-ferrous companies (except Hindalco) to improve yoy.Although we expect Nalco's net sales to increase by only4.4% yoy, we expect its operating profit to improve by57.9% yoy due to increase in sales of high-margin alumina.We expect Hindustan Zinc's net sales and operating profit toimprove by 9.7% and 22.4%, yoy, respectively, due to increasesin volumes of zinc, lead and silver. For Hindalco, while we expectnet sales to remain flat yoy, we expect its bottom-line to decreaseby 22.5% yoy due to higher interest and depreciation costs. Wehave a positive stance on Hindustan Zinc.
Metals
Exhibit 7: Average base metal prices (US$/tonne)
Source: Bloomberg, Angel Research
3QFY143QFY143QFY143QFY143QFY14 3QFY133QFY133QFY133QFY133QFY13 yoy %yoy %yoy %yoy %yoy % 2QFY142QFY142QFY142QFY142QFY14 qoq %qoq %qoq %qoq %qoq %
Copper 7,166 7,928 (9.6) 7,099 0.9
Aluminium 1,815 2,018 (10.1) 1,828 (0.7)
Zinc 1,905 1,947 (2.2) 1,860 2.4
capacity utilization levels during October and November stoodat 77.5% and 75.8%, respectively.
3QFY2014 expectations: 3QFY2014 expectations: 3QFY2014 expectations: 3QFY2014 expectations: 3QFY2014 expectations: For 3QFY2014, on a yoy basis, weexpect net sales of steel companies to increase due to highervolumes. Also, we expect their operating profits to improve (exceptSAIL) mainly due to higher volume growth. For Tata Steel, weexpect its top-line to increase by 12.9% yoy due to higher volumes;its operating profit is expected to increase by 63.2% yoy. ForSAIL, we expect net sales to increase by 10.2% yoy due to highervolumes; however, its operating profit is expected to decline by13.7% due to lower prices and higher costs. NMDC's net salesand operating profit are expected to grow by 37.8% and36.2% yoy, respectively as we expect 34.4% yoy increase involumes. We remain positive on Tata Steel and NMDC.
Non-ferrous sectorDuring the quarter, base metal prices declined sharply on a yoybasis. Domestic aluminium companies continued to suffer onaccount of low aluminium prices due to subdued demand.
On a sequential basis, average copper and zinc prices increasedby 0.9% and 2.4%, respectively whereas the aluminium pricesdeclined 0.7%. On a yoy basis, average copper, aluminium andzinc prices declined by 9.6%, 10.1% and 2.2% respectively.
On a yoy basis, inventory levels at the LME warehouse for copperand aluminium rose by 94.9% and 5.9% respectively whereasfor zinc it declined by 14.5%. However, on a qoq basis, copperand zinc inventories declined by 19.1% and 3.8%, respectivelywhile aluminium inventory was flat.
Source: Bloomberg, Angel Research
Exhibit 8: Inventory chart
0
20
40
60
80
100
120
140
160
180
Jul-11 Nov-11 Mar-12 Jul-12 Nov-12 Mar-13 Jul-13 Nov-13
Copper Aluminium Zinc
Analyst : Bhavesh Chauhan / Vinay RachhAnalyst : Bhavesh Chauhan / Vinay RachhAnalyst : Bhavesh Chauhan / Vinay RachhAnalyst : Bhavesh Chauhan / Vinay RachhAnalyst : Bhavesh Chauhan / Vinay Rachh
Exhibit 9: Quarterly estimates ((((( `̀̀̀̀ c c c c crrrrr)))))
Source: Company, Angel Research; Note: Price as on December 31, 2013; EPS calculation based on fully diluted equity; © Denotes consolidated numbers
CompanyCompanyCompanyCompanyCompany CMPCMPCMPCMPCMP Net SalesNet SalesNet SalesNet SalesNet Sales OPM (%)OPM (%)OPM (%)OPM (%)OPM (%) Net PNet PNet PNet PNet Profitrofitrofitrofitrofit EPS (EPS (EPS (EPS (EPS (`̀̀̀̀))))) EPS (EPS (EPS (EPS (EPS (`̀̀̀̀))))) P/E (x)P/E (x)P/E (x)P/E (x)P/E (x) TTTTTararararargggggeeeeettttt Reco.Reco.Reco.Reco.Reco.
(((((`̀̀̀̀))))) 3QFY14E3QFY14E3QFY14E3QFY14E3QFY14E % chg% chg% chg% chg% chg 3QFY14E3QFY14E3QFY14E3QFY14E3QFY14E chg bpchg bpchg bpchg bpchg bp 3QFY14E3QFY14E3QFY14E3QFY14E3QFY14E % chg% chg% chg% chg% chg 3QFY14E3QFY14E3QFY14E3QFY14E3QFY14E % chg% chg% chg% chg% chg FY13FY13FY13FY13FY13 FY14EFY14EFY14EFY14EFY14E FY15EFY15EFY15EFY15EFY15E FY13FY13FY13FY13FY13 FY14EFY14EFY14EFY14EFY14E FY15EFY15EFY15EFY15EFY15E (((((`̀̀̀̀)))))
Coal India © 290 17,336 0.1 25.3 (588) 3,724 (15.6) 5.9 (15.6) 27.5 23.8 27.6 10.6 12.2 10.5 - Neutral
Hindalco (S) 123 6,775 (0.2) 8.6 (2) 224 (22.5) 1.2 (22.5) 15.8 11.2 15.5 7.8 11.0 7.9 - Neutral
Hind. Zinc (S) 132 3,446 9.7 53.1 549 1,795 11.3 4.7 11.3 16.3 16.4 17.0 8.1 8.1 7.8 156 Buy
JSW Steel (S) 1,018 11,358 37.3 19.6 372 618 33.1 27.7 33.1 60.3 87.9 95.1 16.9 11.6 10.7 848 Sell
MOIL (S) 240 251 10.2 40.6 (968) 107 (5.9) 6.4 (5.9) 25.7 25.6 27.5 9.3 9.4 8.7 - Neutral
Nalco (S) 38 1,744 4.4 16.5 560 191 60.8 0.7 60.8 2.3 2.7 3.2 16.8 13.9 11.8 - Neutral
NMDC (S) 142 2,821 37.8 67.2 (77) 1,636 27 4.2 26.5 16.0 16.5 17.0 8.9 8.6 8.4 151 Accum.
SAIL (S) 73 11,566 10.2 8.5 (235) 379 (26) 0.9 (26.4) 5.3 4.1 5.0 13.8 17.8 14.6 51 Sell
Tata Steel © 423 36,257 12.9 10.1 310 826 - 8.5 - 3.4 40.4 47.6 123.7 10.5 8.9 461 Accum.

35
3QFY2014 Results Preview | | | | | January 3, 2014
Refer to important Disclosures at the end of the report
Oil & Gas
Source: Industry sources, Angel Research
Exhibit 3: Petchem prices decline qoq in 3QFY2014
3,000
3,500
4,000
4,500
5,000
5,500
600
800
1,000
1,200
1,400
1,600
Jan-10 Jul-10 Feb-11 Aug-11 Mar-12 Sep-12 Apr-13 Nov-13
(US$
/tonne)
PTA MEG POY Prices (RHS)
(US$
/tonne)
Source: Bloomberg, Angel Research
Exhibit 4: World oil supply improved in 3QFY2014
89
90
90
91
91
92
92
93
93
94
94
Dec-12 Feb-13 Apr-13 Jun-13 Aug-13 Oct-13
(mnbpd)
Source: PPAC, Angel Research
Exhibit 1: Indian crude basket trend
80
84
88
92
96
100
104
108
112
Mar-13 Apr-13 May-13 Jun-13 Jul-13 Aug-13 Sep-13 Oct-13 Nov-13
(US$/b
bl)
Brent crude remained flat during 3QFY2014
Brent crude oil ended 3QFY2014 almost flat and was in therange of US$103-116 during 3QFY2014. The reason for this
US gas prices rise; Asian gas prices also remain firm
The average Henry Hub natural gas price rose by 7.0% qoq dueto seasonal variations in demand. Asian spot LNG prices alsocontinued to remain high on account of higher demand in Asia.
Source: Bloomberg, Angel Research
Exhibit 2: Brent crude remained volatile during 3QFY2014
60
70
80
90
100
110
120
130
140
Mar-10 Aug-10 Jan-11 Jun-11 Nov-11 Apr-12 Sep-12 Feb-13 Jul-13 Dec-13
(US
$/
bbl)
was the political tension in South Sudan and conflicts betweenthe rebels and the Libya government which led to closure ofcrude exporting ports in Libya and hence affecting supplies fromthese two countries. This was however offset by poor demandscenario during the quarter.
Petrochemical prices decreased qoq in 3QFY2014
During 3QFY2014, prices of petrochemical products decreasedon a qoq basis. The average prices of PTA and MEG fell by 7.5%and 4.9% respectively. However POY prices were flat qoq.
Source: Bloomberg, Angel Research
Exhibit 5: US gas prices increased in 3QFY14
1.5
2.5
3.5
4.5
5.5
Jan
-13
Feb
-13
Mar-
13
Apr-
13
May-
13
Jun
-13
Jul-
13
Aug
-13
Sep
-13
Oct
-13
Nov-
13
Dec-1
3
(US
$/m
mbtu
)
Brent crude oil remained in the price range ofUS$103-116 during 3QFY2014. Overall, during thequarter, average Brent crude oil price was flat qoq mainlydue to lower demand in the quarter partially offset by supplyissues from Libya and south Sudan.
The average West Texas Intermediate (WTI) crude oil price howeverdecreased 7.8% qoq during the quarter on poor demand.
Average Henry Hub natural gas price increased by7.0% qoq. Also, the price of Asian spot LNG remained firmon account of demand-supply mismatch in the continent.
Prices of petrochemical products decreased on a qoq basisduring 3QFY2014. The average prices of PTA and MEGfell by 7.5% and 4.9% respectively. However POY priceswere flat qoq.
During November 2013, the Indian crude oil basket stood atUS$106.5/bbl. The jump in international crude oil prices anda sharp depreciation in the INR against the USD resulted inhigher under-recoveries for oil marketing companies (OMCs)on account of selling diesel, kerosene and domestic LPG atsubsidized rates. During first half of December 2013, OMCslost `434cr per day on this account. OMCs lost `10.4/liter,`36.2/liter and `542.7/cylinder on diesel, kerosene anddomestic LPG, respectively during the period.

Refer to important Disclosures at the end of the report 36
3QFY2014 Results Preview | | | | | January 3, 2014
Oil & Gas
to all City gas distribution projects at a uniform rate acrossIndia. Before the order there was a huge mismatch in pricesbetween cities; in Ahmedabad, the price was almost 50-60%higher compared to prices in Mumbai and Delhi.
Gujarat High Court ordered ONGC to pay royalty duesworth ~`6,000cr to state government
During the last quarter the Gujarat High Court directed ONGCto pay dues worth ~`6,000cr to the state government towardsdifferences in royalty of crude that the PSU had extracted since2008. According to the Oil Field Act, ONGC was required topay 20% royalty on the market value of crude oil it extractedfrom oil blocks to the state government. ONGC used to paysuch royalty to the Gujarat government but in 2004, when theUnion government asked ONGC to provide crude to IOCL asburden-sharing mechanism at a discounted rate, it startedpaying royalty to the state government at post-discount rate,resulting in drastic reduction in royalty to Gujarat. The GujaratHigh Court asked ONGC to make payment of differences ofroyalty to the state by February 2014 and also asked it to payroyalty, in future, at market rate of crude.
Cairn strikes oil on the east coast
During 3QFY2014, Cairn India struck a significant oil reservein its Krishna-Godavari (KG) Basin onshore fieldKG-ONN-2003/1. It also found more gas prospects in itsalready existing oil and gas producing block Ravva on the EastCoast in the field named LO-110 which had the prospect of368bcf of recoverable gas and 16mn barrels of condensate.
ONGC found rich reserves in KG basin
During 3QFY2014, Oil and Natural Gas Corporation (ONGC)discovered gas reserves in Krishna-Godavari basin which wasestimated to hold reserves four times the previous estimate, at100mn tonne. Earlier, the block KG-DWN-98/2 was estimatedto hold predominantly gas.
Robust 3QFY2014 performance by oil & gas stocks
During 3QFY2014, the BSE Oil and Gas Index increased by7.5%. RIL and ONGC's stock price led the rally in the indexwith 8.8% and 7.8% increase during the quarter as thegovernment announced a key reform of gas price hike acrossthe board for all upstream companies. The Cairn India stockrose by 1.5% due to newer discoveries and firm oil prices. TheGAIL stock also increased by 4.4% during the quarter after theMadras High court allowed the company to lay pipeline throughthe fields and rejected the Tamil Nadu government's order ofrouting the pipeline through the national highway.
Source: Bloomberg, Angel Research
Exhibit 6: Crude inventory increased qoq in 3QFY2014
320
340
360
380
400
420
Jan
-13
Feb
-13
Mar-
13
Apr-
13
May-
13
Jun
-13
Jul-
13
Aug
-13
Sep
-13
Oct
-13
Nov-
13
Dec-1
3
(00
0bbls
)
Key developments
Government imposed US$792mn fine on RIL
During 3QFY2014, the Government had imposed a fine ofUS$792mn on Reliance Industries (RIL) for missing the KG D6gas production targets. Later the CCEA approved gas pricehike for KG D6 fields provided the company furnishes a bankguarantee which will be encashed if RIL loses the arbitrationagainst the government.
Governments ordered RIL to surrender 81% of KGblocks
During 3QFY2014, the Oil Ministry ordered RIL to give up 81%of its KG-D6 gas block as the time allocated for producingfrom those blocks had expired. The area sought by the Ministrywas over 5,367sq km. It included five discoveries for which theDirectorate General of Hydrocarbon had opined that thecompany missed deadlines for submission of investment plans.The five discoveries were estimated to hold 0.81tcf of gasreserves.
Government ordered uniform prices across cities fornatural gas
During 3QFY2014 the government ordered GAIL to ensure thesupply of domestically produced gas on a proportionate basis
Source: Bloomberg, Angel Research
Exhibit 7: Motor gasoline inventory decreased qoq in 3QFY2014
120
160
200
240
280
Jan
-13
Feb
-13
Mar-
13
Apr-
13
May-
13
Jun
-13
Jul-
13
Aug
-13
Sep
-13
Oct
-13
Nov-
13
Dec-1
3
(00
0bbls
)

37
3QFY2014 Results Preview | | | | | January 3, 2014
Refer to important Disclosures at the end of the report
Oil & Gas
Analyst : Bhavesh Chauhan / Vinay RachhAnalyst : Bhavesh Chauhan / Vinay RachhAnalyst : Bhavesh Chauhan / Vinay RachhAnalyst : Bhavesh Chauhan / Vinay RachhAnalyst : Bhavesh Chauhan / Vinay Rachh
Exhibit 9: Quarterly estimates ( `̀̀̀̀ cr)
Source: Company, Angel Research; Note: Price as on December 31, 2013; ^Standalone numbers for the quarter and consolidated numbers for the full year
CompanyCompanyCompanyCompanyCompany CMPCMPCMPCMPCMP Net SalesNet SalesNet SalesNet SalesNet Sales OPM (%)OPM (%)OPM (%)OPM (%)OPM (%) Net PNet PNet PNet PNet Profitrofitrofitrofitrofit EPS (EPS (EPS (EPS (EPS (`̀̀̀̀))))) EPS (EPS (EPS (EPS (EPS (`̀̀̀̀))))) P/E (x)P/E (x)P/E (x)P/E (x)P/E (x) TTTTTararararargggggeeeeettttt Reco.Reco.Reco.Reco.Reco.
(((((`̀̀̀̀))))) 3QFY14E3QFY14E3QFY14E3QFY14E3QFY14E % chg% chg% chg% chg% chg 3QFY14E3QFY14E3QFY14E3QFY14E3QFY14E chg bpchg bpchg bpchg bpchg bp 3QFY14E3QFY14E3QFY14E3QFY14E3QFY14E % chg% chg% chg% chg% chg 3QFY14E3QFY14E3QFY14E3QFY14E3QFY14E % chg% chg% chg% chg% chg FY13FY13FY13FY13FY13 FY14EFY14EFY14EFY14EFY14E FY15EFY15EFY15EFY15EFY15E FY13FY13FY13FY13FY13 FY14EFY14EFY14EFY14EFY14E FY15EFY15EFY15EFY15EFY15E (((((`̀̀̀̀)))))
Cairn India 324 4,952 15.8 77.1 32 3,291 12.7 18.6 12.7 60.0 63.4 61.9 5.4 5.1 5.2 380 Buy
GAIL 342 13,734 10.1 14.3 (172) 1,229 (4.3) 9.7 (4.3) 31.7 32.5 30.7 10.8 10.5 11.1 - Neutral
ONGC ^ 289 21,643 3.1 53.3 (77) 5,558 (0.1) 6.5 (0.1) 28.3 30.0 39.6 10.2 9.6 7.3 318 Accum.
RIL ^ 895 117,488 25.1 6.6 (235) 5,508 0.1 18.5 0.1 70.9 73.0 77.7 12.6 12.3 11.5 1,020 Accum.
Source: Bloomberg, Angel Research
Exhibit 8: 3QFY2014 stock performance
0.0
1.0
2.0
3.0
4.0
5.0
6.0
7.0
8.0
9.0
10.0
RIL ONGC BSE O&G Index GAIL Cairn
(%)
For RIL, we expect its top-line to increase by 25.1% yoy as
INR depreciation against the USD helps it raise petrochemical
prices. However, we expect lower profits from its Refining
segment due to decline in global refining margins on a
yoy basis. Overall, we expect its bottom-line to remain flat yoy.
For ONGC, we expect net sales to increase by 3.1% yoy while
its PAT is expected to remain flat yoy due to yoy slight increase
in subsidy burden.
GAIL is expected to report a top-line growth of 10.1% yoy on
account of increase in volumes. However, its net profit is expected
to decrease by 4.3% yoy.
Cairn India's net sales are expected to increase by 15.8% yoy
due to increases in both, production and realizations.
Its bottom-line is also expected to increase by 12.7% on a
yoy basis.
3QFY2014 expectations
For 3QFY2014, we expect top-line to increase yoy for all the
companies; however, bottom-lines are expected to decline for
most companies.
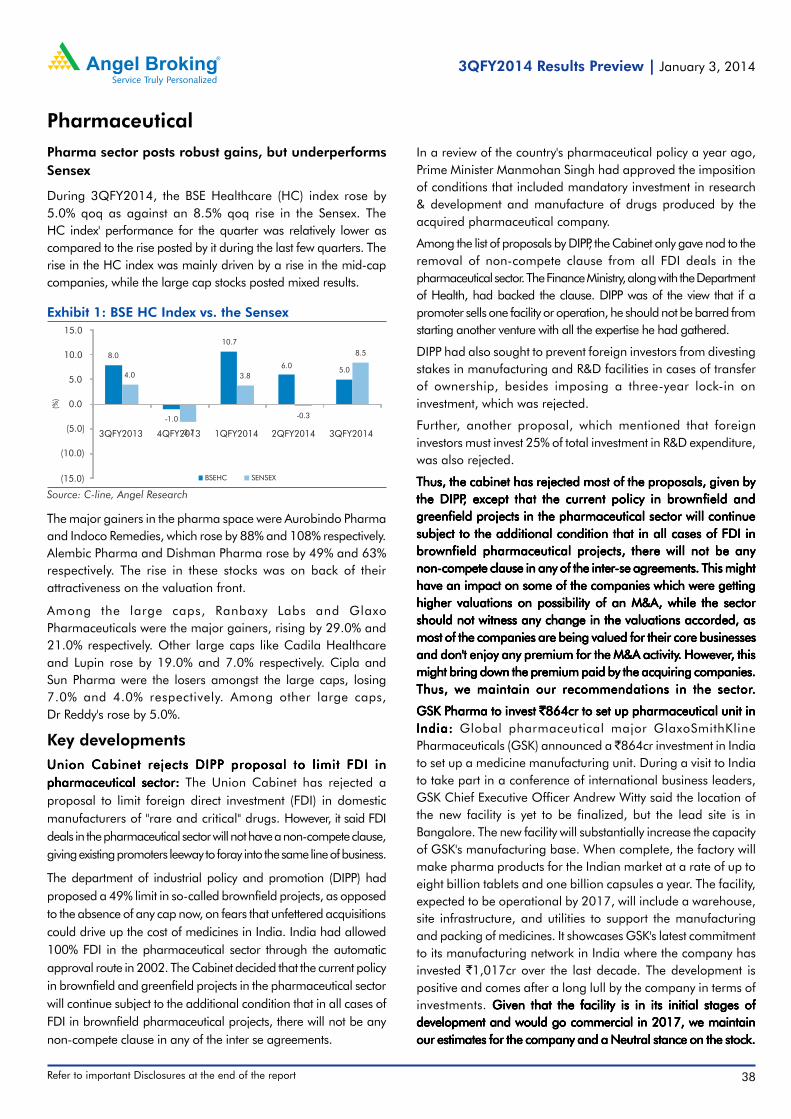
Refer to important Disclosures at the end of the report 38
3QFY2014 Results Preview | | | | | January 3, 2014
Pharmaceutical
The major gainers in the pharma space were Aurobindo Pharmaand Indoco Remedies, which rose by 88% and 108% respectively.Alembic Pharma and Dishman Pharma rose by 49% and 63%respectively. The rise in these stocks was on back of theirattractiveness on the valuation front.
Among the large caps, Ranbaxy Labs and GlaxoPharmaceuticals were the major gainers, rising by 29.0% and21.0% respectively. Other large caps like Cadila Healthcareand Lupin rose by 19.0% and 7.0% respectively. Cipla andSun Pharma were the losers amongst the large caps, losing7.0% and 4.0% respectively. Among other large caps,Dr Reddy's rose by 5.0%.
Key developmentsUnion Cabinet rejects DIPP proposal to limit FDI inUnion Cabinet rejects DIPP proposal to limit FDI inUnion Cabinet rejects DIPP proposal to limit FDI inUnion Cabinet rejects DIPP proposal to limit FDI inUnion Cabinet rejects DIPP proposal to limit FDI inpharmaceutical sector:pharmaceutical sector:pharmaceutical sector:pharmaceutical sector:pharmaceutical sector: The Union Cabinet has rejected aproposal to limit foreign direct investment (FDI) in domesticmanufacturers of "rare and critical" drugs. However, it said FDIdeals in the pharmaceutical sector will not have a non-compete clause,giving existing promoters leeway to foray into the same line of business.
The department of industrial policy and promotion (DIPP) hadproposed a 49% limit in so-called brownfield projects, as opposedto the absence of any cap now, on fears that unfettered acquisitionscould drive up the cost of medicines in India. India had allowed100% FDI in the pharmaceutical sector through the automaticapproval route in 2002. The Cabinet decided that the current policyin brownfield and greenfield projects in the pharmaceutical sectorwill continue subject to the additional condition that in all cases ofFDI in brownfield pharmaceutical projects, there will not be anynon-compete clause in any of the inter se agreements.
Pharma sector posts robust gains, but underperformsSensex
During 3QFY2014, the BSE Healthcare (HC) index rose by5.0% qoq as against an 8.5% qoq rise in the Sensex. TheHC index' performance for the quarter was relatively lower ascompared to the rise posted by it during the last few quarters. Therise in the HC index was mainly driven by a rise in the mid-capcompanies, while the large cap stocks posted mixed results.
In a review of the country's pharmaceutical policy a year ago,Prime Minister Manmohan Singh had approved the impositionof conditions that included mandatory investment in research& development and manufacture of drugs produced by theacquired pharmaceutical company.
Among the list of proposals by DIPP, the Cabinet only gave nod to theremoval of non-compete clause from all FDI deals in thepharmaceutical sector. The Finance Ministry, along with the Departmentof Health, had backed the clause. DIPP was of the view that if apromoter sells one facility or operation, he should not be barred fromstarting another venture with all the expertise he had gathered.
DIPP had also sought to prevent foreign investors from divestingstakes in manufacturing and R&D facilities in cases of transferof ownership, besides imposing a three-year lock-in oninvestment, which was rejected.
Further, another proposal, which mentioned that foreigninvestors must invest 25% of total investment in R&D expenditure,was also rejected.
Thus, the cabinet has rejected most of the proposals, given byThus, the cabinet has rejected most of the proposals, given byThus, the cabinet has rejected most of the proposals, given byThus, the cabinet has rejected most of the proposals, given byThus, the cabinet has rejected most of the proposals, given bythe DIPPthe DIPPthe DIPPthe DIPPthe DIPP, except that the current policy in brownfield and, except that the current policy in brownfield and, except that the current policy in brownfield and, except that the current policy in brownfield and, except that the current policy in brownfield andgreenfield projects in the pharmaceutical sector will continuegreenfield projects in the pharmaceutical sector will continuegreenfield projects in the pharmaceutical sector will continuegreenfield projects in the pharmaceutical sector will continuegreenfield projects in the pharmaceutical sector will continuesubject to the additional condition that in all cases of FDI insubject to the additional condition that in all cases of FDI insubject to the additional condition that in all cases of FDI insubject to the additional condition that in all cases of FDI insubject to the additional condition that in all cases of FDI inbrownfield pharmaceutical projects, there will not be anybrownfield pharmaceutical projects, there will not be anybrownfield pharmaceutical projects, there will not be anybrownfield pharmaceutical projects, there will not be anybrownfield pharmaceutical projects, there will not be anynon-non-non-non-non-compete clause in any of the intercompete clause in any of the intercompete clause in any of the intercompete clause in any of the intercompete clause in any of the inter-----se agreements. This mightse agreements. This mightse agreements. This mightse agreements. This mightse agreements. This mighthave an impact on some of the companies which were gettinghave an impact on some of the companies which were gettinghave an impact on some of the companies which were gettinghave an impact on some of the companies which were gettinghave an impact on some of the companies which were gettinghigher valuations on possibility of an M&Ahigher valuations on possibility of an M&Ahigher valuations on possibility of an M&Ahigher valuations on possibility of an M&Ahigher valuations on possibility of an M&A, while the sector, while the sector, while the sector, while the sector, while the sectorshould not witness any change in the valuations accorded, asshould not witness any change in the valuations accorded, asshould not witness any change in the valuations accorded, asshould not witness any change in the valuations accorded, asshould not witness any change in the valuations accorded, asmost of the companies are being valued for their core businessesmost of the companies are being valued for their core businessesmost of the companies are being valued for their core businessesmost of the companies are being valued for their core businessesmost of the companies are being valued for their core businessesand don't enjoy any premium for the M&A activityand don't enjoy any premium for the M&A activityand don't enjoy any premium for the M&A activityand don't enjoy any premium for the M&A activityand don't enjoy any premium for the M&A activity. However. However. However. However. However, this, this, this, this, thismight bring down the premium paid by the acquiring companies.might bring down the premium paid by the acquiring companies.might bring down the premium paid by the acquiring companies.might bring down the premium paid by the acquiring companies.might bring down the premium paid by the acquiring companies.Thus, we maintain our recommendations in the sectorThus, we maintain our recommendations in the sectorThus, we maintain our recommendations in the sectorThus, we maintain our recommendations in the sectorThus, we maintain our recommendations in the sector.....
GSK Pharma to invest GSK Pharma to invest GSK Pharma to invest GSK Pharma to invest GSK Pharma to invest `̀̀̀̀864cr to set up pharmaceutical unit in864cr to set up pharmaceutical unit in864cr to set up pharmaceutical unit in864cr to set up pharmaceutical unit in864cr to set up pharmaceutical unit inIndia:India:India:India:India: Global pharmaceutical major GlaxoSmithKlinePharmaceuticals (GSK) announced a ̀ 864cr investment in Indiato set up a medicine manufacturing unit. During a visit to Indiato take part in a conference of international business leaders,GSK Chief Executive Officer Andrew Witty said the location ofthe new facility is yet to be finalized, but the lead site is inBangalore. The new facility will substantially increase the capacityof GSK's manufacturing base. When complete, the factory willmake pharma products for the Indian market at a rate of up toeight billion tablets and one billion capsules a year. The facility,expected to be operational by 2017, will include a warehouse,site infrastructure, and utilities to support the manufacturingand packing of medicines. It showcases GSK's latest commitmentto its manufacturing network in India where the company hasinvested `1,017cr over the last decade. The development ispositive and comes after a long lull by the company in terms ofinvestments. Given that the facility is in its initial stages ofGiven that the facility is in its initial stages ofGiven that the facility is in its initial stages ofGiven that the facility is in its initial stages ofGiven that the facility is in its initial stages ofdevelopment and would go commercial in 2017, we maintaindevelopment and would go commercial in 2017, we maintaindevelopment and would go commercial in 2017, we maintaindevelopment and would go commercial in 2017, we maintaindevelopment and would go commercial in 2017, we maintainour estimates for the company and a Neutral stance on the stock.our estimates for the company and a Neutral stance on the stock.our estimates for the company and a Neutral stance on the stock.our estimates for the company and a Neutral stance on the stock.our estimates for the company and a Neutral stance on the stock.
Exhibit 1: BSE HC Index vs. the Sensex
Source: C-line, Angel Research
8.0
-1.0
10.7
6.05.0
4.0
-3.7
3.8
-0.3
8.5
(15.0)
(10.0)
(5.0)
0.0
5.0
10.0
15.0
3QFY2013 4QFY2013 1QFY2014 2QFY2014 3QFY2014
(%)
BSEHC SENSEX

39
3QFY2014 Results Preview | | | | | January 3, 2014
Refer to important Disclosures at the end of the report
Pharmaceutical
GGGGGSK PLC to spend SK PLC to spend SK PLC to spend SK PLC to spend SK PLC to spend `̀̀̀̀6,400cr to enhance its share in GSK6,400cr to enhance its share in GSK6,400cr to enhance its share in GSK6,400cr to enhance its share in GSK6,400cr to enhance its share in GSKPharmaceuticals to 75%:Pharmaceuticals to 75%:Pharmaceuticals to 75%:Pharmaceuticals to 75%:Pharmaceuticals to 75%: London-listed GlaxoSmithKlineannounced that it is going to increase stake in its Indianpharmaceutical subsidiary GlaxoSmithKline Pharmaceuticalsthrough a voluntary open offer. GlaxoSmithKline holds 50.7%stake in its Indian subsidiary and wants to raise it up to 75% ata price of `3,100/share. GlaxoSmithKline intends to keep thecompany publicly-listed. According to SEBI, the Indian companyrequires a minimum public shareholding of 25% for it tomaintain a public listing in the country. GlaxoSmithKline intendsto acquire up to 2,06,09,774 shares, representing 24.3% ofthe total outstanding shares of GlaxoSmithKlinePharmaceuticals. The potential total value of the transaction atthe offer price is approximately `6,400cr.
The open offer of shares is at an attractive price, much abovethe current market price, and is a strong indicator from theManagement towards the performance of its listed Indian entity,especially as it comes after the recent `864cr investment planannounced by the company to further its growth prospects inthe Indian pharmaceutical markets. The said investments areexpected to fructify by 2017. On the valuation front, on anormalized basis (normalized for the impact of the currentDPCO 2013 on its operations), the stock at the open offer pricewould trade at around 34x CY2014E earnings. Thus, the stockThus, the stockThus, the stockThus, the stockThus, the stockwould move up on the open offerwould move up on the open offerwould move up on the open offerwould move up on the open offerwould move up on the open offer. L. L. L. L. Long term shareholders areong term shareholders areong term shareholders areong term shareholders areong term shareholders areadvised to remain put in the stock, as in the long run, whenadvised to remain put in the stock, as in the long run, whenadvised to remain put in the stock, as in the long run, whenadvised to remain put in the stock, as in the long run, whenadvised to remain put in the stock, as in the long run, whenthese facilities become operational (from 2017), they can easilythese facilities become operational (from 2017), they can easilythese facilities become operational (from 2017), they can easilythese facilities become operational (from 2017), they can easilythese facilities become operational (from 2017), they can easilyearn 20% p.a on the stock. Investors looking from a very nearearn 20% p.a on the stock. Investors looking from a very nearearn 20% p.a on the stock. Investors looking from a very nearearn 20% p.a on the stock. Investors looking from a very nearearn 20% p.a on the stock. Investors looking from a very nearterm perspective should exit the stock, as the valuations in theterm perspective should exit the stock, as the valuations in theterm perspective should exit the stock, as the valuations in theterm perspective should exit the stock, as the valuations in theterm perspective should exit the stock, as the valuations in thenear term, at the open offer price, are very expensive.near term, at the open offer price, are very expensive.near term, at the open offer price, are very expensive.near term, at the open offer price, are very expensive.near term, at the open offer price, are very expensive.
Cadila Healthcare - in an outCadila Healthcare - in an outCadila Healthcare - in an outCadila Healthcare - in an outCadila Healthcare - in an out-----of-of-of-of-of-court settlement with Wcourt settlement with Wcourt settlement with Wcourt settlement with Wcourt settlement with WarnerarnerarnerarnerarnerChilcott: Chilcott: Chilcott: Chilcott: Chilcott: Cadila Healthcare and Zydus Pharmaceuticals (USA)Inc. have entered into an agreement in principle with WarnerChilcott Company LLC to settle all outstanding patent litigationrelated to Asacol delayed-release tablets.
Under the terms of the agreement in principle, Warner ChilcottCompany will grant Zydus Pharmaceuticals (Zydus) a royalty-bearing license to market its generic Asacol HD beginning onNovember 15, 2015 or earlier under certain circumstances,following receipt by Zydus of final approval from the USFDA on itsAbbreviated New Drug Application (ANDA) for generic Asacol HD.
Alternatively, if Zydus does not receive USFDA approval for itsgeneric Asacol HD by July 1, 2016, Zydus will be permitted tolaunch an authorized generic version of Actavis' product beginningon July 1, 2016. Other terms of the settlement were not disclosed.Asacol HD had sales of US$122mn during the quarter that endedon June 30, according to Warner Chilcott Company. WWWWWe maintaine maintaine maintaine maintaine maintainananananan AccumulateAccumulateAccumulateAccumulateAccumulate on the stock with a target price of on the stock with a target price of on the stock with a target price of on the stock with a target price of on the stock with a target price of `̀̀̀̀894.894.894.894.894.
Sun Pharma, LSun Pharma, LSun Pharma, LSun Pharma, LSun Pharma, Lupin, Aurobindo, Dr Reddy's announce USFDupin, Aurobindo, Dr Reddy's announce USFDupin, Aurobindo, Dr Reddy's announce USFDupin, Aurobindo, Dr Reddy's announce USFDupin, Aurobindo, Dr Reddy's announce USFDAAAAAapproval for generic Cymbalta: approval for generic Cymbalta: approval for generic Cymbalta: approval for generic Cymbalta: approval for generic Cymbalta: Sun Pharma and Lupin haveannounced that the USFDA has granted final approval to marketa generic version of Cymbalta Duloxetine delayed-releasecapsules USP, 20mg, 30mg and 60mg. Duloxetine delayed-release capsules USP, 20mg, 30mg and 60mg are therapeuticequivalents of Eli Lilly & Company's Cymbalta delayed-releasecapsules. These capsules have annual sales of approximatelyUS$5.5bn in the US. Duloxetine delayed-release capsules USP isindicated for the treatment of major depressive disorder (MDD),generalized anxiety disorder (GAD) and diabetic peripheralneuropathic pain (DPNP).
Sun Pharma subsidiary, being one of the first-to-file ANDAs forgeneric Cymbalta with a para IV certification, is eligible forshared 180-day marketing exclusivity in the US. The producthas lost its exclusivity in December 2013, and has around sixplayers having already got the USFDA nod (the notable Indianplayers amongst them being Sun Pharma, Lupin, Dr Reddy's,Aurobindo Pharma, Torrent Pharma and Teva Pharma) for theproduct. For the fourth quarter of 2013, Eli Lilly estimates thatUS sales of Cymbalta will be approximately US$500mn,reflecting the loss of US patent exclusivity on December 11,2013 from its normal run rate of US$1.1bn as of 3QCY2013.The product has a shared exclusivity and hence on a conservativebasis, the product is expected to contribute around US$80-90mnand US$16-18mn on sales and net profit front respectivelyduring the 180 day exclusivity period for these players. WWWWWeeeeemaintain our Neutral rating on Sun Pharma, Lmaintain our Neutral rating on Sun Pharma, Lmaintain our Neutral rating on Sun Pharma, Lmaintain our Neutral rating on Sun Pharma, Lmaintain our Neutral rating on Sun Pharma, Lupin, Aurobindoupin, Aurobindoupin, Aurobindoupin, Aurobindoupin, AurobindoPharma and Buy on Dr Reddy's with a target price of Pharma and Buy on Dr Reddy's with a target price of Pharma and Buy on Dr Reddy's with a target price of Pharma and Buy on Dr Reddy's with a target price of Pharma and Buy on Dr Reddy's with a target price of `̀̀̀̀3,008.3,008.3,008.3,008.3,008.
3QFY2014 result expectations
The Indian pharma sector is expected to post a double-digitgrowth on the sales and net profit front for 3QFY2014. ExcludingCipla, for which the last corresponding consolidated sales arenot available, we expect our coverage universe to register a17.6% yoy top-line growth. On the operating front, the marginsare expected to expand by 242.4bp. This is expected to lead to thecompanies in our coverage post an earnings growth of 41.7%during the period.
Amongst large caps, Sun Pharma is expected to post a 29.7%yoy sales growth. Other players, namely Lupin and CadilaHealthcare are expected to report 19.8% and 14.1% salesgrowth respectively. Dr Reddy's and Ranbaxy Labs on the otherhand are expected to post a top-line growth of around 25.2%and 3.3% respectively. Amongst small caps, Indoco Remedies isexpected to post a growth of 24.2% yoy. Amongst the MNC pack,Sanofi India is likely to post a 9.8% yoy growth in net sales, whileGlaxo is expected to post a marginal growth of 0.2% yoy in sales.

Refer to important Disclosures at the end of the report 40
3QFY2014 Results Preview | | | | | January 3, 2014
Pharmaceutical
Analyst: Sarabjit KAnalyst: Sarabjit KAnalyst: Sarabjit KAnalyst: Sarabjit KAnalyst: Sarabjit Kour Nangraour Nangraour Nangraour Nangraour Nangra
Exhibit 3: Quarterly estimates (`̀̀̀̀ cr)
Source: Company, Angel Research; Note: Price as on December 31, 2013; Note: Our numbers does not include MTM on Foreign Debt. # 4Q'CY2013, * Last coressponding periodconsolidated numbers not available.
CompanyCompanyCompanyCompanyCompany CMPCMPCMPCMPCMP Net SalesNet SalesNet SalesNet SalesNet Sales OPM (%)OPM (%)OPM (%)OPM (%)OPM (%) Net PNet PNet PNet PNet Profitrofitrofitrofitrofit EPS (EPS (EPS (EPS (EPS (`̀̀̀̀))))) EPS (EPS (EPS (EPS (EPS (`̀̀̀̀))))) P/E (x) P/E (x) P/E (x) P/E (x) P/E (x) TTTTTararararargggggeeeeettttt Reco.Reco.Reco.Reco.Reco.
(((((`̀̀̀̀))))) 3QFY14E3QFY14E3QFY14E3QFY14E3QFY14E % chg% chg% chg% chg% chg 3QFY14E3QFY14E3QFY14E3QFY14E3QFY14E chg bpchg bpchg bpchg bpchg bp 3QFY14E3QFY14E3QFY14E3QFY14E3QFY14E % chg% chg% chg% chg% chg 3QFY14E3QFY14E3QFY14E3QFY14E3QFY14E % chg% chg% chg% chg% chg FY13FY13FY13FY13FY13 FY14EFY14EFY14EFY14EFY14E FY15EFY15EFY15EFY15EFY15E FY13FY13FY13FY13FY13 FY14EFY14EFY14EFY14EFY14E FY15EFY15EFY15EFY15EFY15E (((((`̀̀̀̀)))))
Alembic Pharma 211 420 13.9 16.6 (210) 45 (6.8) 2.4 (6.8) 8.8 10.5 13.8 23.9 20.1 15.3 - Neutral
Aurobindo 393 1,790 15.3 17.4 190 187 36.3 6.4 36.3 14.8 28.0 33.8 26.5 14.0 11.6 - Neutral
Cadila 807 1,781 14.1 16.0 240 167 62.4 8.2 62.4 32.0 37.3 44.7 25.2 21.6 18.1 894 Accum.
Cipla* 401 2,366 - 23.1 - 439 - 5.4 - 19.0 21.0 23.9 21.1 19.1 16.8 504 Buy
Dishman Pharma 100 370 16.5 19.1 130 20 21.3 2.5 21.3 12.2 14.8 16.6 8.2 6.7 6.0 107 Accum.
Dr. Reddys 2533 3,588 25.2 25.4 770 736 102.8 43.7 102.8 103.1 144.4 161.6 24.6 17.5 15.7 3,008 Buy
Glaxo # 2993 658 0.2 20.6 (660) 120 (24.8) 14.1 (24.8) 77.6 58.4 64.4 38.6 51.2 46.5 - Neutral
Indoco Rem. 137 187 24.2 14.6 380 17 135.8 1.9 135.8 4.6 5.9 7.6 29.8 23.2 18.0 - Neutral
Ipca Lab. 721 824 19.0 20.6 (100) 123 39.5 9.8 39.5 26.9 40.4 52.7 26.8 17.8 13.7 791 Accum.
Lupin 909 2,954 19.8 23.4 30 425 26.6 9.5 26.6 29.4 36.6 44.8 30.9 24.8 20.3 - Neutral
Ranbaxy Lab 453 2,758 3.3 6.6 340.0 120 - 2.9 - 59.3 11.4 15.2 7.6 39.7 29.8 - Neutral
Sanofi India # 2763 440 9.8 12.5 (20.0) 46 1.8 19.8 1.8 76.9 94.8 101.7 35.9 29.1 27.2 - Neutral
Sun Pharma 568 3,700 29.7 42.1 (210) 1,054 19.6 5.1 19.6 16.7 25.6 25.8 34.0 22.2 22.0 - Neutral
Source: Angel Research
Exhibit 2: Sales growth and OPM for 3QFY2014
29.7
19.8
3.3
25.2
42.1
23.4
6.6
25.4
0.0
10.0
20.0
30.0
40.0
50.0
Sun Pharma Lupin Ranbaxy DRL
Sales growth OPM
Ranbaxy Labs is expected to post a modest growth of 3.3% withsales at ̀ 2,758cr during 4QFY2014. Its OPM is expected to be at6.6% vs 3.2% in 4QCY2012. Its net profit is likely to come in at`120cr, vs a net loss of ̀ 25cr during the last corresponding period.
Cadila Healthcare is expected to post a sales growth of14.1% to `1,781cr. We expect the company's OPM to expandby 240bp yoy to 16.0%. Net profit is expected to grow by 62.4%yoy to `167cr, on back of lower tax outgo.
Mid caps- Aurobindo to post robust numbers
We estimate Ipca Laboratories' top-line to grow by 19.0% to`824cr for 3QFY2014. The OPM is expected to dip by 100bpyoy to 20.6%. The adjusted net profit is expected to grow by39.5% yoy on back of dip in OPM.
Aurobindo Pharma is expected to post a net sales growth of15.3% yoy. The margins are likely to expand to 17.4% vs 15.5%in the corresponding period of previous year, which will leadthe net profit of `187cr vs a net profit of `137cr in thecorresponding period of previous year.
Indoco Remedies is expected to report a sales growth of 24.2% to`187cr. The OPM is expected to expand by 380bp yoy to 14.6%. Asa result, the net profit is expected to dip by 135.8% yoy to `17.4cr.
Outlook and Valuation
With an expected earnings CAGR of ~20% over FY2013-15Efor our universe of stocks, we remain overweight on the sectormaintaining a positive future outlook and earnings growth. Inthe generic segment, we prefer Cipla, Dr Reddy's and CadilaHealthcare.
In CRAMS, though the segment is currently witnessing somepressure, there have been indications of gradual recovery andramp up from most of the players in the segment. Thus, withthe valuations rendering attractive, we recommend DishmanPharma in this segment.
Among large caps, Dr Reddy's, Sun Pharma and Lupinto outperform
Among the large caps in our coverage universe, for 3QFY2014,Sun Pharma is likely to clock a 29.7% yoy growth on the salesfront, led by both exports and domestic sales. Operating profitmargins would decline by 210bp with margins likely to bearound 42.1%. However, inspite of the same, the net profit isexpected to post a growth of 19.6% yoy.
Lupin, on the other hand, is expected to register a strong revenue growthof 19.8%. Its OPM is expected to expand by 30bp during the period to23.4%. Its net profit is estimated to increase by 26.6% in 3QFY2014.
Dr Reddy's is expected to post a top-line de-growth of 25.2% to`3,588cr on the back of robust exports growth. The companyis expected to see strong traction in its Indian and Russianformulation businesses as well. The company is expected topost an OPM of 25.4%, as against 17.7% in the correspondingperiod of the previous year. The company is expected to post anet profit of `736cr, a growth of 102.8% over the lastcorresponding period.
Cipla is expected to post a net sales growth of `2,366cr. On theoperating front, the OPM (excluding technical know-how fees) is expectedto come in at 23.1%, and net profit is expected to come at `439.3cr.

41
3QFY2014 Results Preview | | | | | January 3, 2014
Refer to important Disclosures at the end of the report
Power
All-India power generation highlights
During 8MFY2014, the overall power generation in India roseby 5.2% yoy to 638.8BU, aided by a 10.1% yoy increase ininstalled capacity to 232,165MW.
During this period, thermal power generation grew by a meager2.9% yoy to 508.8BU while hydro power generation grew by ahealthy 19.3% yoy to 102.7BU. However, nuclear powergeneration remained stagnant on a yoy basis at 22.0BU.
Operational performance (PLF)
The all-India plant load factor (PLF) of thermal power plantsduring 8MFY2014 stood lower at 64.0% vs 68.9% in thecorresponding period of last year, due to fuel availabilityconstraints and lower off-take. Although NTPC reported a sharp307bp yoy decline in PLF from 81.0% to 77.9%, the same wasmuch higher than the all-India PLF during the same period.
Generation for companies under coverage
During 8MFY2014, NTPC's power generation declined by 0.9%yoy to 149.2BU while GIPCL's generation (excluding 145MWBaroda plant) declined by 29.0% yoy to 2.0BU.
Fuel availability position
As on Dec 22, 2013, 33 thermal power stations had coal stocksfor less than 7 days, which includes 18 power stations havingcoal stocks for less than 4 days. The southern region was theworst affected with it having 10 out of the 33 stations havingcoal stocks for less than 7 days. The current fuel availabilityposition has deteriorated as compared to that in Sept 2013, when18 thermal power stations had coal stocks for less than 7 days,including 10 power stations having coal stocks for less than4 days. The main reason for lower coal stocks can be attributedto lower domestic production as well as transportation constraints.
Imported coal prices down yoy (in US$ terms)
During 3QFY2014, average prices of New Castle Mckloksey6,000kc coal were up by 6.4% qoq but down by 2.6% yoy toUS$82.0 per tonne. On a qoq basis, the rise in price of importedcoal in INR terms was 6.6% aided by a stable INR/US$ exchangerate (INR appreciated against the US$ by 0.1% qoq). However,on a yoy basis though the price of coal reduced by 2.6% in US$terms, a 14.3% yoy depreciation in the INR led to an increase inthe price of imported coal by 11.3% yoy in INR terms.
Source: CEA, Angel Research
Exhibit 1: New Castle Mccloskey coal prices
0
1,000
2,000
3,000
4,000
5,000
6,000
7,000
8,000
9,000
0
50
100
150
200
250
Dec-0
6
Jun
-07
Dec-0
7
Jun
-08
Dec-0
8
Jun
-09
Dec-0
9
Jun
-10
Dec-1
0
Jun
-11
Dec-1
1
Jun
-12
Dec-1
2
Jun
-13
Dec-1
3
Price of coal increased qoqin both US$ and INR terms
NCM Coal ($) (LHS) INR (RHS)
Source: CEA, Angel Research
Exhibit 2:Generation capacity addition: Targeted vs achieved
0.0
20.0
40.0
60.0
80.0
100.0
120.0
140.0
160.0
0
5,000
10,000
15,000
20,000
25,000
FY04 FY06 FY08 FY10 FY12 8MFY14
(%)(MW)
Target (Tgt.) LHS Achievement (Ach.) LHS Ach. as % of Tgt. (RHS)
Capacity addition
During 8MFY2014, 6,963MW of capacity was added comparedto targeted capacity of 8,176MW. Private utilities added3,800MW and exceeded the target of 3,244MW capacityaddition, whereas, State utilities fell short of the target capacityof 2,846MW and added only 1,745MW. Central utilities added1,418MW against their target of 2,086MW.
Transmission lines and substations
During Apr-Nov 2013, 7,620 circuit kilometers (ckm) wereadded to the transmission lines, as against the targeted12,833ckm. In the same period, total addition to thetransmission sub-station category was 26,180MVA, as againstthe targeted 16,920MVA.
Power-deficit situation
India's overall and peak power-deficit levels during 8MFY2014stood at 4.5% and 4.2% respectively, as against 8.6% and 9.0%reported in 8MFY2013. The sharp reduction can be attributed tocapacity addition by generation utilities and an extended monsoonwhich delayed the winters and resulted in lower electricity demand.
Source: CEA, Angel Research
Exhibit 3: India - Power-deficit scenario
7.1 7.38.4
9.6 9.911.0
10.18.5 8.5 8.7
4.5
11.2 11.7 12.313.8
16.6
12.012.7
9.810.6
9.0
4.2
0.0
4.0
8.0
12.0
16.0
20.0
FY2004 FY2006 FY2008 FY2010 FY2012 8MFY2014
Overall Peak
(%)
Key developments
CERC Draft Tariff Regulations for 2014-2019
The Central Electricity Regulatory Commission (CERC) has releasedthe Draft Tariff regulations for the central power utilities forFY2015-19E. The ROE level has been maintained at 15.5% with a0.5% incentive for timely completion. The major changes are:-

Refer to important Disclosures at the end of the report 42
3QFY2014 Results Preview | | | | | January 3, 2014
Power
Shift from PShift from PShift from PShift from PShift from PAF based incentives to PLF based incentives forAF based incentives to PLF based incentives forAF based incentives to PLF based incentives forAF based incentives to PLF based incentives forAF based incentives to PLF based incentives forgeneration companies: generation companies: generation companies: generation companies: generation companies: As per current regulations if the PAF(Plant Availability Factor) is maintained above 85% the fixedcharge goes up proportionately even if there has not been anyoff-take and therefore the generation companies can recovertheir fixed costs. However, in the draft regulations, CERCchanged this to PLF (Plant Load Factor) based where thegeneration company will get an incentive of ̀ 0.5/unit of powergenerated if it maintains the PLF greater than 85%. This putsthe generation companies at a disadvantage because they willhave to bear the loss if there is no off-take or fuel is unavailableeven when it is not due to their fault.
TTTTTax arbitrage:ax arbitrage:ax arbitrage:ax arbitrage:ax arbitrage: As per current regulations companies are allowedto retain tax benefits earned from grossing up of ROE on themarginal tax rate which has now been disallowed in the draftregulations and the generation company will get tax benefitonly on the effective tax rate. This will result in companies likeNTPC taking a hit on the effective ROE.
Major changes in operational norms: The normative gross station heat rate (GSHR) for 500MW
sub critical plants has been reduced from 2,425 Kcal/KWhto 2,375 Kcal/KWh in an attempt to improve efficiency
The coal inventory included in calculating the working capitalfor interest calculation has been reduced forpit-head stations from 1.5 months to 0.5 months and for non-pithead stations from 2 months to 1 month. This has beenattempted to make the operational norms more stringent.
Any savings on fuel cost will be shared with the consumersin the ratio of 3:1
With these regulations, CERC aims to improve operationalefficiency and have a positive impact on power prices for endconsumers. Also, we believe tightening of the operating normswill reduce savings from operational efficiencies for generationcompanies. In our view the final regulations (expected to comeout by April 2014) could be different from the current draftregulations; similar to what happened with the past regulationsand thus, it may provide some respite to the generationcompanies like NTPC. We believe that if these regulations areimplemented as it is, they would have an impact of ~`700cr-`800cr on the earnings of NPTC.
Source: BSE, Angel Research
Exhibit 4: Performance on the bourses in 2QFY2014
(7)
1
12
9
(10)
(5)
-
5
10
15
NTPC GIPCL BSE Power SENSEX
Outlook:Outlook:Outlook:Outlook:Outlook:
The power sector has been facing many headwinds such asfuel shortage, delay in land acquisition, and environmentalclearances among others. The government has been trying togive a boost to the sector with reforms such as the financialrestructuring plan for State Electricity Boards (SEBs), the CabinetCommittee on Investment (CCI) clearing several projects stuckdue to various reasons as well as other supportive measures.Keeping in mind the government's continued efforts towardsimproving the health of the power sector we believe it to bepositive in the medium to long term. However, for now werecommend a Neutral rating on GIPCL and NTPC.
Analyst - Akshay NarangAnalyst - Akshay NarangAnalyst - Akshay NarangAnalyst - Akshay NarangAnalyst - Akshay Narang
Exhibit 5: Quarterly estimates ( `̀̀̀̀ cr)
Source: Company, Angel Research; Note: Price as on December 31, 2013.
CompanyCompanyCompanyCompanyCompany CMPCMPCMPCMPCMP Net SalesNet SalesNet SalesNet SalesNet Sales OPM (%)OPM (%)OPM (%)OPM (%)OPM (%) Net P Net P Net P Net P Net Profitrofitrofitrofitrofit EPS (EPS (EPS (EPS (EPS (`̀̀̀̀))))) EPS (EPS (EPS (EPS (EPS (`̀̀̀̀))))) P/E (x)P/E (x)P/E (x)P/E (x)P/E (x) TTTTTararararargggggeeeeettttt Reco.Reco.Reco.Reco.Reco.
(((((`̀̀̀̀))))) 3QFY14E3QFY14E3QFY14E3QFY14E3QFY14E % chg% chg% chg% chg% chg 3QFY14E3QFY14E3QFY14E3QFY14E3QFY14E chg bpchg bpchg bpchg bpchg bp 3QFY14E3QFY14E3QFY14E3QFY14E3QFY14E % chg% chg% chg% chg% chg 3QFY14E3QFY14E3QFY14E3QFY14E3QFY14E % chg% chg% chg% chg% chg FY13FY13FY13FY13FY13 FY14EFY14EFY14EFY14EFY14E FY15EFY15EFY15EFY15EFY15E FY13FY13FY13FY13FY13 FY14EFY14EFY14EFY14EFY14E FY15EFY15EFY15EFY15EFY15E (((((`̀̀̀̀)))))
GIPCL 62 329 (11) 34.6 (319) 46 (34.4) 3.0 (34.4) 14.5 9.9 11.4 4.3 6.3 5.4 - Neutral
NTPC 137 16,090 2.0 25.7 37 2,668 2.7 3.2 2.7 15.3 12.0 12.5 9.0 11.4 11.0 - Neutral
CCEA clears changes to Mega Power Policy
The Cabinet Committee on Economic Affairs (CCEA) approvedamendments in the Mega Power Policy. To avail the benefitsunder the policy, the power generator must tie up at least 65%(earlier 85% was mandatory) of the installed capacity throughcompetitive bidding and the remaining 35% should be throughregulated tariff according to the host state's regulations.Currently, as per the policy thermal power projects of 1,000MWand above and hydro power projects of 500MW and abovecapacity are allowed duty-free equipment imports and taxholiday for 10 years. These benefits can be availed aftersubmission of provisional mega power project status certificatealong with a bank guarantee as a security. The maximum timeperiod for provisional mega projects for furnishing final megacertificates to the tax authorities (after tying up capacity throughcompetitive bids) has been extended to 60 months instead of currentprovision of 36 months from the date of import. This will have apositive impact on power generation companies going forward.
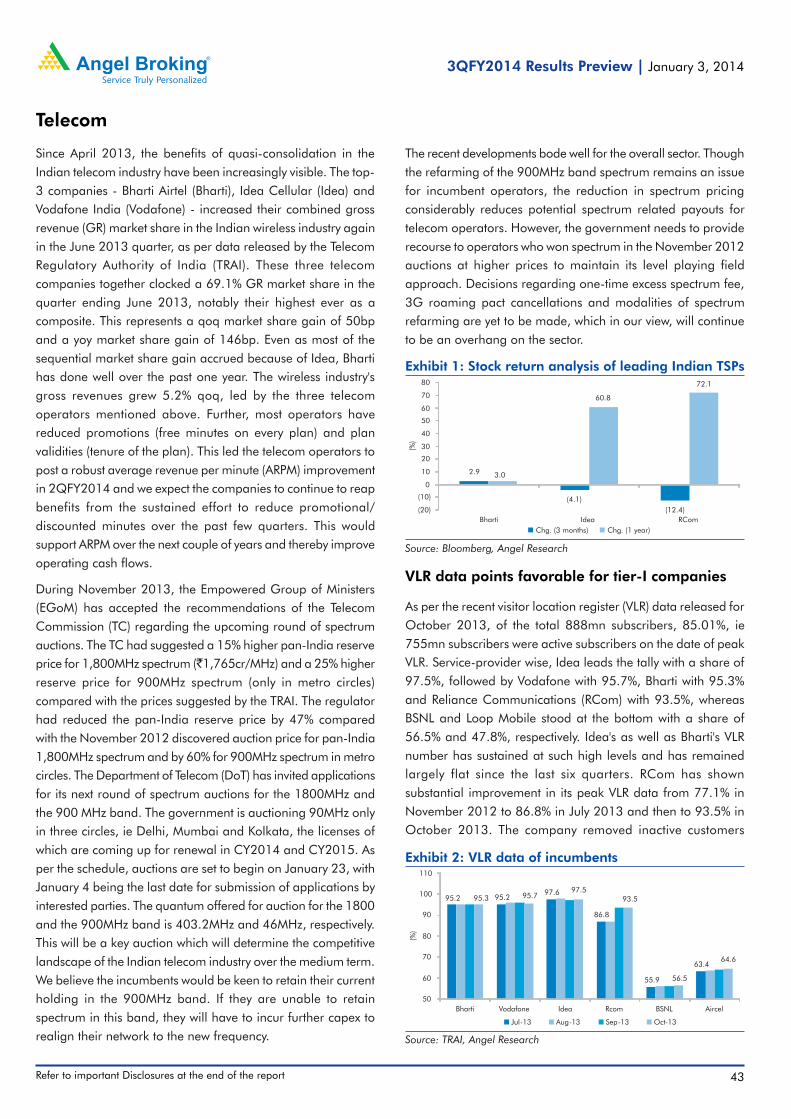
43
3QFY2014 Results Preview | | | | | January 3, 2014
Refer to important Disclosures at the end of the report
Telecom
Source: Bloomberg, Angel Research
Exhibit 1: Stock return analysis of leading Indian TSPs
2.9
(4.1)
(12.4)
3.0
60.8
72.1
(20)
(10)
0
10
20
30
40
50
60
70
80
Bharti Idea RCom
(%)
Chg. (3 months) Chg. (1 year)
Since April 2013, the benefits of quasi-consolidation in theIndian telecom industry have been increasingly visible. The top-3 companies - Bharti Airtel (Bharti), Idea Cellular (Idea) andVodafone India (Vodafone) - increased their combined grossrevenue (GR) market share in the Indian wireless industry againin the June 2013 quarter, as per data released by the TelecomRegulatory Authority of India (TRAI). These three telecomcompanies together clocked a 69.1% GR market share in thequarter ending June 2013, notably their highest ever as acomposite. This represents a qoq market share gain of 50bpand a yoy market share gain of 146bp. Even as most of thesequential market share gain accrued because of Idea, Bhartihas done well over the past one year. The wireless industry'sgross revenues grew 5.2% qoq, led by the three telecomoperators mentioned above. Further, most operators havereduced promotions (free minutes on every plan) and planvalidities (tenure of the plan). This led the telecom operators topost a robust average revenue per minute (ARPM) improvementin 2QFY2014 and we expect the companies to continue to reapbenefits from the sustained effort to reduce promotional/discounted minutes over the past few quarters. This wouldsupport ARPM over the next couple of years and thereby improveoperating cash flows.
During November 2013, the Empowered Group of Ministers(EGoM) has accepted the recommendations of the TelecomCommission (TC) regarding the upcoming round of spectrumauctions. The TC had suggested a 15% higher pan-India reserveprice for 1,800MHz spectrum (`1,765cr/MHz) and a 25% higherreserve price for 900MHz spectrum (only in metro circles)compared with the prices suggested by the TRAI. The regulatorhad reduced the pan-India reserve price by 47% comparedwith the November 2012 discovered auction price for pan-India1,800MHz spectrum and by 60% for 900MHz spectrum in metrocircles. The Department of Telecom (DoT) has invited applicationsfor its next round of spectrum auctions for the 1800MHz andthe 900 MHz band. The government is auctioning 90MHz onlyin three circles, ie Delhi, Mumbai and Kolkata, the licenses ofwhich are coming up for renewal in CY2014 and CY2015. Asper the schedule, auctions are set to begin on January 23, withJanuary 4 being the last date for submission of applications byinterested parties. The quantum offered for auction for the 1800and the 900MHz band is 403.2MHz and 46MHz, respectively.This will be a key auction which will determine the competitivelandscape of the Indian telecom industry over the medium term.We believe the incumbents would be keen to retain their currentholding in the 900MHz band. If they are unable to retainspectrum in this band, they will have to incur further capex torealign their network to the new frequency.
VLR data points favorable for tier-I companies
As per the recent visitor location register (VLR) data released forOctober 2013, of the total 888mn subscribers, 85.01%, ie755mn subscribers were active subscribers on the date of peakVLR. Service-provider wise, Idea leads the tally with a share of97.5%, followed by Vodafone with 95.7%, Bharti with 95.3%and Reliance Communications (RCom) with 93.5%, whereasBSNL and Loop Mobile stood at the bottom with a share of56.5% and 47.8%, respectively. Idea's as well as Bharti's VLRnumber has sustained at such high levels and has remainedlargely flat since the last six quarters. RCom has shownsubstantial improvement in its peak VLR data from 77.1% inNovember 2012 to 86.8% in July 2013 and then to 93.5% inOctober 2013. The company removed inactive customers
The recent developments bode well for the overall sector. Thoughthe refarming of the 900MHz band spectrum remains an issuefor incumbent operators, the reduction in spectrum pricingconsiderably reduces potential spectrum related payouts fortelecom operators. However, the government needs to providerecourse to operators who won spectrum in the November 2012auctions at higher prices to maintain its level playing fieldapproach. Decisions regarding one-time excess spectrum fee,3G roaming pact cancellations and modalities of spectrumrefarming are yet to be made, which in our view, will continueto be an overhang on the sector.
Source: TRAI, Angel Research
Exhibit 2: VLR data of incumbents
95.2 95.297.6
86.8
55.9
63.4
95.3 95.797.5
93.5
56.5
64.6
50
60
70
80
90
100
110
Bharti Vodafone Idea Rcom BSNL Aircel
(%)
Jul-13 Aug-13 Sep-13 Oct-13

Refer to important Disclosures at the end of the report 44
3QFY2014 Results Preview | | | | | January 3, 2014
417435
455 455437
450
359
384
406 398
368377
236
271291
283 280289
200
300
400
500
2QFY13 3QFY13 4QFY13 1QFY14 2QFY14 3QFY14E
(min
)
Bharti (India ops) Idea RCom
Source: Company, Angel Research
Exhibit 5: Trend in MOU per month per subscriber
Telecom
Company (mn)Company (mn)Company (mn)Company (mn)Company (mn) MayMayMayMayMay-13-13-13-13-13 Jun-13Jun-13Jun-13Jun-13Jun-13 Jul-13Jul-13Jul-13Jul-13Jul-13 AugAugAugAugAug-13-13-13-13-13 SeptSeptSeptSeptSept-13-13-13-13-13 OctOctOctOctOct-13-13-13-13-13
Bharti 189.6 190.9 191.4 192.2 193.4 194.9
RCom 124.9 125.7 126.2 126.8 116.3 116.7
Vodafone 154.7 155.0 154.4 154.3 155.5 156.7
BSNL 97.2 97.2 97.2 97.2 97.2 97.2
Idea 123.8 125.0 125.3 126.0 127.2 128.4
TTSL 65.4 79.0 78.7 78.7 76.8 76.9
Aircel 60.4 61.0 61.7 62.6 63.2 63.7
MTNL 4.6 4.3 4.1 3.8 3.6 3.4
Loop Mobile 3.0 3.0 3.0 3.0 3.0 3.0
HFCL 1.4 1.4 1.6 1.6 1.7 1.8
Shyam Telelink 10.1 9.8 9.6 9.6 9.6 9.6
S Tel - - - - - -
Uninor 32.0 32.3 32.8 32.3 32.4 32.3
Videocon 2.3 2.4 2.8 2.9 3.2 3.5
DB Etisalat - - - - - -
TTTTTotalotalotalotalotal 869.5869.5869.5869.5869.5 887.0887.0887.0887.0887.0 888.8888.8888.8888.8888.8 891.1891.1891.1891.1891.1 883.1883.1883.1883.1883.1 888.1888.1888.1888.1888.1Source: COAI, AUSPI, Angel Research
Exhibit 4: Total subscriber base
RMS vs SMS
As per revenue market share (RMS) data for 1QFY2014, Bhartileads at 31.0% with a subscriber market share (SMS) of 21.5%,whereas Idea has its RMS and SMS at 18.4% and 14.1%,respectively. Idea has shown a significant rise in its RMS in thepast one year as it gained ~320bp yoy of RMS to 18.4% andits revenue share now exceeds that of RCom and Tata Teleservicescombined. The RMS for Bharti and Idea is higher than theirSMS, which indicates that the quality of subscribers added bythese companies is good. Conversely, in case of RCom, SMS isat 14.3%, which is much higher than its RMS, which is only7.5%. This is evident from the average revenue per user (ARPU)profile of these companies; also, even though RCom's peak VLRhas improved, but it still stood at 86.9% (in June 2013) which isless as compared to its peers Bharti, Idea and Vodafone - thepeak VLR of these vary from 95-98% (for June 2013). The recentstep by RCom to remove inactive customers from its subscriberbase has led to some improvement in its overall ARPU profile andthe same will reduce the difference between its RMS and SMS.
Modest momentum in net subscriber addition
The country's total wireless subscriber base increased from869.5mn in May 2013 to 888.1mn at the end of October 2013,registering an average monthly growth of 0.5%. The share ofurban wireless subscribers as of October 2013 decreased to 60.3%from 60.4% in September 2013, whereas the share of ruralsubscribers increased from 39.6% in September 2013 to 39.7% inOctober 2013. The overall wireless teledensity in India as of October2013 has reached 73.3% from 73.0% in the previous month.
(subscribers who have not had any usage in the last 60 days)from its subscriber base, focused on the quality of its subscribersand removed free minutes from the network. All the otherincumbent players also reported considerable improvementsin their peak VLR data in the past six months, keeping in noticethe regulatory requirements regarding inactive SIM users (SIMnot recharged since last six months).
Source: TRAI, Angel Research
Exhibit 3: Active subscribers (October 2013)
ActiveActiveActiveActiveActive Active subscribers'Active subscribers'Active subscribers'Active subscribers'Active subscribers' Active subscribers'Active subscribers'Active subscribers'Active subscribers'Active subscribers' ReportedReportedReportedReportedReportedsubscriberssubscriberssubscriberssubscriberssubscribers market sharemarket sharemarket sharemarket sharemarket share market share (%)market share (%)market share (%)market share (%)market share (%) subscribers'subscribers'subscribers'subscribers'subscribers'
(mn)(mn)(mn)(mn)(mn) (%)(%)(%)(%)(%) -----June 2013June 2013June 2013June 2013June 2013 market share (%)market share (%)market share (%)market share (%)market share (%)
Bharti 185.7 24.59 24.38 21.94
Vodafone 149.9 19.86 19.92 17.64
Idea 125.2 16.58 16.47 14.45
RCom 110.3 14.61 14.84 13.28
BSNL 54.9 7.27 7.44 10.94
Aircel 41.2 5.45 5.26 7.18
MTNL 2.0 0.26 0.28 0.39
During August-October 2013, Bharti and Idea added 2.7mnand 2.4mn subscribers, taking their total subscriber base to194.9mn and 128.4mn, respectively. RCom's subscriber basegot reduced by ~10mn subscribers before the aforesaid periodon account of its ongoing exercise of removing inactivesubscribers from its subscriber base. We believe the incumbentswent competitive to acquire subscribers left out by new operatorswho were forced by the Supreme Court to either shut down orscale down their operations in February 2013.
MOUs to improve
In 2QFY2014, Idea as well as RCom posted a decline in theirminutes of usage (MOU) due to seasonal slowdown seen in2Q as well as increased proportion of rural subscribers. For3QFY2014, we expect the overall MOU profile for Bharti (Indiamobile operations), Idea and RCom to increase by more than2.5% qoq to 450min, 377min and 289min, respectively. This isbecause 3Q is a seasonally good quarter in terms of MOU fortelecom players due to the festive season falling in the quarter

45
3QFY2014 Results Preview | | | | | January 3, 2014
Refer to important Disclosures at the end of the report
Telecom
Analyst - Ankita SomaniAnalyst - Ankita SomaniAnalyst - Ankita SomaniAnalyst - Ankita SomaniAnalyst - Ankita Somani
Exhibit 8: Quarterly estimates ( `̀̀̀̀ cr)
Source: Company, Angel Research; Note: Price as on December 31, 2013; Change is on a qoq basis
CompanyCompanyCompanyCompanyCompany CMPCMPCMPCMPCMP Net SalesNet SalesNet SalesNet SalesNet Sales OPM (%)OPM (%)OPM (%)OPM (%)OPM (%) Net PNet PNet PNet PNet Profitrofitrofitrofitrofit EPS (EPS (EPS (EPS (EPS (`̀̀̀̀))))) EPS (EPS (EPS (EPS (EPS (`̀̀̀̀))))) P/E (x)P/E (x)P/E (x)P/E (x)P/E (x) TTTTTaaaaargrgrgrgrgeeeeettttt Reco.Reco.Reco.Reco.Reco.
(((((`̀̀̀̀))))) 3QFY14E3QFY14E3QFY14E3QFY14E3QFY14E % chg% chg% chg% chg% chg 3QFY14E3QFY14E3QFY14E3QFY14E3QFY14E chg bpchg bpchg bpchg bpchg bp 3QFY14E3QFY14E3QFY14E3QFY14E3QFY14E % chg% chg% chg% chg% chg 3QFY14E3QFY14E3QFY14E3QFY14E3QFY14E % chg% chg% chg% chg% chg FY13FY13FY13FY13FY13 FY14EFY14EFY14EFY14EFY14E FY15EFY15EFY15EFY15EFY15E FY13FY13FY13FY13FY13 FY14EFY14EFY14EFY14EFY14E FY15EFY15EFY15EFY15EFY15E (((((`̀̀̀̀)))))
Bharti 330 21,761 2.0 32.5 48 814 58.9 2.0 58.9 6.0 7.7 12.7 55.1 43.0 26.1 360 Accum.
Idea 167 6,582 4.1 31.3 11 463 3.4 1.4 3.4 3.1 5.6 6.9 54.5 29.6 24.2 - Neutral
Rcom 130 5,484 1.7 34.0 (94) 256 9.6 1.2 9.6 3.2 3.6 5.9 40.1 35.9 22.0 - Neutral
Source: Company, Angel Research
Exhibit 6: Trend in ARPM
0.43 0.430.42
0.44
0.44 0.44
0.41 0.41 0.41
0.44
0.450.45
0.43
0.44 0.44
0.46 0.46 0.46
0.40
0.41
0.42
0.43
0.44
0.45
0.46
0.47
2QFY13 3QFY13 4QFY13 1QFY14 2QFY14 3QFY14E
(/̀m
in)
Bharti (India ops) Idea RCom
pull the APRU of Bharti (India operations), Idea as well as RCom
upwards to `200/month, `171/month and `133/month,
respectively.
Outlook and valuation
For 3QFY2014, we expect healthy revenue growth for the
industry on the back of increase in MOU, uptick in voice ARPM
as well growing data users. Amongst the top three operators,
we expect Idea to lead in terms of revenue growth followed by
Bharti and RCom. We expect Idea to post a 4.1% sequential
revenue growth while Bharti and RCom are expected to post a
revenue growth of 2.0% and 1.7% qoq, respectively. On the
margins front, we expect the EBITDA margin of Bharti and Idea
to see marginal uptick of 48bp and 11bp qoq to 32.5% and
31.3%, respectively, while the EBITDA margin of RCom is
expected to decline by 94bp qoq to 34.0%. Indian incumbents
are reporting decent EBITDA and EPS growth as a result of
normalization of margins. However, free cash flow will likely be
constrained in the medium term due to payments for spectrum.
We believe the regulatory environment continues to improve
which bodes well for the sector. In our view, the telecom industry
can substantially improve structurally only after data revenues
start contributing significantly to the overall revenues. As the
competitive intensity is receding and pricing power is coming
back to operators, we expect incumbent players such as Bharti,
Vodafone and Idea to perform well going ahead. We are
currently neutral on the telecom sector as issues like one-time
spectrum charge, and renewal fees still persist. Bharti continues
to be our preferred pick amongst telcos due to its low-cost
integrated model (owned tower infrastructure), potential
opportunity to scale up in Africa, established leadership in
revenue and subscriber market share, relatively better KPIs and
due to potential upside in its stock price on account of listing of
Bharti Infratel.
Source: Company, Angel Research
Exhibit 7: Trend in ARPU per month
177185
193200
192200
148
158167
174
164171
101
119128 130 129
133
80
100
120
140
160
180
200
220
2QFY13 3QFY13 4QFY13 1QFY14 2QFY14 3QFY14E
(`/m
onth
)
Bharti (India ops) Idea RCom
and on account of the low base effect of 2Q (which tends to bea weak quarter).
ARPM to inch up
In 2QFY2014, all the telecom players under our coveragewitnessed marginal increases in their ARPMs on a sequentialbasis led by cut down on discounted tariffs and promotionalvouchers. Also, industry dynamics favored incumbent telecomcompanies with pricing power coming back to them due tovirtual consolidation (new operators are rationalizing operationsto reduce losses as business case is becoming unviable withincreasing costs). During 3QFY2014, we expect the ARPM forBharti and Idea to grow by more than 1% qoq.
ARPUs to increase
For 3QFY2014, we expect the combination of increase in MOUas well as ARPM with a modest increase in subscriber base to

Refer to important Disclosures at the end of the report 46
3QFY2014 Results Preview | | | | | January 3, 2014
Stock Watch

Stock WStock WStock WStock WStock Watch |atch |atch |atch |atch | January 2014
47May 2011 Please refer to important disclosures at the end of this report.
Company Name Reco CMP Target Mkt Cap Sales (` cr) OPM (%) EPS (`) PER (x) P/BV (x) RoE (%) EV/Sales (x) (`) Price (`) (` cr) FY14E FY15E FY14E FY15E FY14E FY15E FY14E FY15E FY14E FY15E FY14E FY15E FY14E FY15E
Agri / Agri ChemicalAgri / Agri ChemicalAgri / Agri ChemicalAgri / Agri ChemicalAgri / Agri Chemical
Rallis Neutral 178 - 3,459 1,696 1,983 14.9 14.9 7.7 8.8 23.1 20.2 4.8 4.1 22.4 21.9 2.2 1.9
United Phosphorus Accumulate 198 225 8,755 10,091 11,302 16.5 16.5 19.2 22.5 10.3 8.8 1.6 1.4 17.0 17.2 1.0 0.9
Auto & Auto AncillaryAuto & Auto AncillaryAuto & Auto AncillaryAuto & Auto AncillaryAuto & Auto Ancillary
Amara Raja Batteries Accumulate 336 362 5,738 3,504 4,130 16.6 16.1 21.4 24.1 15.7 13.9 4.2 3.3 30.0 26.5 1.6 1.4
Apollo Tyres Neutral 107 - 5,401 13,163 14,163 12.2 12.0 14.6 15.8 7.3 6.8 1.3 1.1 19.8 18.1 0.5 0.5
Ashok Leyland Neutral 17 - 4,576 10,689 13,466 2.9 6.9 (1.4) 0.7 - 26.2 1.8 1.8 (8.6) 4.5 0.6 0.5
Automotive Axle# Neutral 238 - 360 739 984 9.4 10.4 15.5 29.8 15.4 8.0 1.3 1.1 8.3 15.0 0.5 0.4
Bajaj Auto Buy 1,911 2,272 55,285 21,173 24,924 20.4 20.3 120.5 142.0 15.9 13.5 5.6 4.4 39.3 36.8 2.2 1.8
Bharat Forge Neutral 329 - 7,647 6,271 7,023 16.2 16.8 16.9 22.2 19.5 14.8 3.0 2.6 16.4 19.1 1.4 1.2
Bosch India* Accumulate 10,087 11,215 31,672 10,074 11,708 17.0 18.0 369.0 448.6 27.3 22.5 4.4 3.7 15.9 16.6 2.8 2.3
CEAT Neutral 321 - 1,153 5,260 5,843 12.0 11.7 76.4 83.3 4.2 3.8 1.1 0.9 30.2 25.5 0.3 0.3
Exide Industries Accumulate 123 135 10,455 6,178 7,016 14.7 15.5 6.8 8.1 18.2 15.2 2.7 2.4 15.8 16.7 1.3 1.1
FAG Bearings* Accumulate 1,614 1,751 2,682 1,646 1,948 15.4 16.4 97.8 125.1 16.5 12.9 2.3 2.0 15.2 16.7 1.4 1.2
Hero Motocorp Accumulate 2,075 2,262 41,431 25,566 28,540 14.3 14.7 107.9 150.8 19.2 13.8 7.2 5.6 40.0 45.9 1.4 1.2
JK Tyre Accumulate 175 187 720 7,530 8,335 11.3 11.1 70.2 75.0 2.5 2.3 0.6 0.5 27.7 23.3 0.4 0.4
Mahindra and Mahindra Accumulate 944 1,050 58,109 39,419 44,609 12.9 12.6 60.4 65.2 15.6 14.5 3.2 2.7 22.2 20.4 1.2 1.0
Maruti Neutral 1,763 - 53,257 45,094 53,058 11.8 11.3 96.7 111.1 18.2 15.9 2.5 2.2 14.7 14.7 1.0 0.8
Motherson Sumi Buy 183 218 16,098 29,673 33,624 9.0 8.8 11.7 13.6 15.7 13.4 4.9 3.8 36.8 31.7 0.6 0.5
Subros Neutral 28 - 167 1,231 1,412 10.0 10.2 1.7 3.6 16.3 7.8 0.6 0.5 3.5 7.2 0.4 0.4
Tata Motors Accumulate 376 419 101,405 229,925 263,898 14.1 14.5 41.4 48.3 9.1 7.8 2.4 1.9 30.3 27.0 0.5 0.5
TVS Motor Neutral 76 - 3,608 7,846 8,917 6.0 6.3 5.2 6.6 14.7 11.5 2.6 2.2 18.7 20.6 0.4 0.3
FFFFFinancialsinancialsinancialsinancialsinancials
Allahabad Bank Neutral 95 - 4,755 7,359 7,508 2.6 2.6 23.4 27.8 4.1 3.4 0.6 0.5 11.4 12.2 - -
Andhra Bank Neutral 63 - 3,500 5,169 5,485 2.6 2.5 10.3 13.9 6.1 4.5 0.5 0.5 6.9 8.7 - -
Axis Bank Buy 1,300 1,709 60,984 19,319 22,715 3.4 3.4 130.5 158.4 10.0 8.2 1.6 1.41 17.2 18.2 - -
Bank of Baroda Neutral 646 - 27,203 15,974 17,895 2.1 2.2 107.8 122.1 6.0 5.3 0.8 0.7 13.6 13.8 - -
Bank of India Neutral 238 - 15,257 14,647 16,054 2.2 2.1 49.9 55.7 4.8 4.3 0.6 0.6 13.1 12.9 - -
Canara Bank Neutral 282 - 12,499 12,293 13,359 2.0 2.0 59.0 56.5 4.8 5.0 0.6 0.5 11.3 9.8 - -
Central Bank Neutral 51 - 6,928 7,918 8,793 2.2 2.3 (7.8) 9.4 - 5.5 0.8 0.7 (8.7) 9.7 - -
Corporation Bank Neutral 261 - 4,369 5,602 6,056 1.9 1.9 53.5 77.8 4.9 3.4 0.5 0.4 8.8 11.6 - -
Dena Bank Neutral 61 - 2,127 3,377 3,570 2.3 2.4 13.2 14.5 4.6 4.2 0.5 0.5 11.2 10.6 - -
Federal Bank Neutral 84 - 7,190 2,873 3,250 3.0 2.9 8.6 10.3 9.8 8.2 1.0 0.9 11.0 12.1 - -
HDFC Accumulate 796 841 124,162 8,679 10,350 3.6 3.6 37.5 44.7 21.2 17.8 4.4 4.0 30.1 30.6 - -
HDFC Bank Accumulate 666 753 159,420 26,674 32,104 4.5 4.6 35.9 45.5 18.5 14.6 3.7 3.1 21.6 23.0 - -
ICICI Bank Buy 1,098 1,454 126,820 25,924 30,178 3.2 3.2 82.5 97.4 13.3 11.3 1.7 1.6 14.7 15.5 - -
IDBI Bank Neutral 66 - 8,856 9,282 10,426 1.9 2.0 8.6 16.0 7.7 4.1 0.5 0.5 6.6 11.0 - -
Indian Bank Accumulate 116 133 4,964 5,919 6,348 2.7 2.7 28.6 32.1 4.0 3.6 0.5 0.4 11.7 11.9 - -

Stock WStock WStock WStock WStock Watch |atch |atch |atch |atch | January 2014
48May 2011 Please refer to important disclosures at the end of this report.
Company Name Reco CMP Target Mkt Cap Sales (` cr) OPM (%) EPS (`) PER (x) P/BV (x) RoE (%) EV/Sales (x) (`) Price (`) (` cr) FY14E FY15E FY14E FY15E FY14E FY15E FY14E FY15E FY14E FY15E FY14E FY15E FY14E FY15E
IOB Neutral 51 - 4,754 7,898 8,559 2.3 2.3 6.0 13.2 8.6 3.9 0.5 0.4 5.3 10.4 - -
J & K Bank Neutral 1,434 - 6,950 3,195 3,571 3.9 4.0 254.8 245.7 5.6 5.8 1.2 1.0 23.2 19.0 - -
LIC Housing Finance Buy 219 257 11,062 2,063 2,507 2.3 2.3 24.5 28.9 9.0 7.6 1.5 1.3 17.7 18.2 - -
Oriental Bank Neutral 229 - 6,861 6,848 7,382 2.6 2.6 42.1 49.9 5.4 4.6 0.6 0.5 10.0 10.8 - -
Punjab Natl.Bank Buy 627 751 22,150 20,600 23,129 3.3 3.3 120.6 152.7 5.2 4.1 0.7 0.6 13.2 14.8 - -
South Ind.Bank Buy 20 25 2,731 1,783 1,966 2.7 2.6 3.7 4.1 5.5 5.0 0.9 0.8 16.2 15.8 - -
St Bk of India Buy 1,766 2,102 120,766 66,539 75,419 3.1 3.1 171.0 235.8 10.3 7.5 1.3 1.1 11.7 14.5 - -
Syndicate Bank Neutral 95 - 5,694 6,852 7,540 2.5 2.4 26.9 21.9 3.5 4.3 0.6 0.5 16.3 11.9 - -
UCO Bank Accumulate 76 80 5,682 7,450 8,366 3.1 3.1 19.8 22.0 3.8 3.4 0.8 0.7 18.8 18.1 - -
Union Bank Neutral 130 - 7,785 10,665 11,985 2.4 2.4 25.3 37.0 5.1 3.5 0.5 0.5 9.6 12.7 - -
Vijaya Bank Neutral 39 - 1,943 2,929 2,997 1.9 1.8 6.3 7.6 6.2 5.1 0.5 0.5 8.1 8.9 - -
Yes Bank Buy 370 443 13,344 4,424 5,261 2.8 2.9 43.8 49.9 8.4 7.4 1.9 1.5 24.3 22.8 - -
Capital GoodsCapital GoodsCapital GoodsCapital GoodsCapital Goods
ABB* Sell 693 540 14,681 7,521 8,107 5.8 6.8 7.7 12.9 90.0 53.9 5.6 5.4 6.3 10.3 1.9 1.8
BGR Energy Accumulate 126 135 907 3,883 3,987 11.5 10.7 23.1 22.6 5.4 5.6 0.7 0.6 23.6 18.9 0.6 0.4
BHEL Neutral 176 - 43,188 41,082 37,867 13.1 12.0 16.2 13.1 10.9 13.4 1.9 1.8 18.8 13.8 0.9 1.0
Blue Star Buy 158 193 1,425 2,941 3,099 3.4 4.2 6.0 9.3 26.5 17.0 3.3 2.9 12.9 18.0 0.6 0.6
Crompton Greaves Buy 129 150 8,259 13,272 14,789 5.5 6.6 5.0 7.8 25.7 16.6 2.2 2.0 8.7 12.5 0.7 0.7
Jyoti Structures Neutral 31 - 257 3,264 3,537 9.5 9.0 7.2 8.3 4.3 3.8 0.3 0.3 8.9 9.4 0.3 0.3
KEC International Accumulate 57 62 1,465 7,709 8,507 6.2 7.0 4.7 7.3 12.2 7.9 1.2 1.1 15.3 15.3 0.4 0.3
Thermax Neutral 712 - 8,481 5,480 6,187 9.1 9.6 26.7 31.7 26.7 22.4 4.1 3.6 16.1 17.0 1.5 1.3
CementCementCementCementCement
ACC Accumulate 1,108 1,225 20,806 11,358 12,649 15.4 17.3 52.8 69.9 21.0 15.9 2.6 2.4 13.0 15.9 1.5 1.3
Ambuja Cements Neutral 183 - 28,244 9,259 10,671 19.0 21.8 7.4 9.2 24.6 19.9 3.0 2.8 12.6 14.5 2.5 2.1
India Cements Neutral 60 - 1,846 4,507 5,129 10.7 11.7 0.8 3.9 75.1 15.3 0.5 0.5 0.7 3.4 0.9 0.8
J K Lakshmi Cement Neutral 79 - 931 1,977 2,313 15.3 17.7 7.0 9.9 11.2 8.0 0.7 0.7 6.4 8.4 0.7 1.2
Ramco Cements Neutral 192 - 4,536 3,722 4,382 17.4 19.0 6.9 12.1 27.7 15.9 1.8 1.6 6.8 10.9 1.9 1.6
Shree Cement^ Neutral 4,330 - 15,086 6,025 6,713 25.0 23.8 243.8 276.4 17.8 15.7 3.3 2.8 20.2 19.3 2.2 1.8
UltraTech Cement Neutral 1,763 - 48,356 20,325 23,548 19.0 18.4 74.6 80.2 23.6 22.0 2.9 2.6 12.7 12.3 2.4 2.3
ConstructionConstructionConstructionConstructionConstruction
Ashoka Buildcon Buy 61 74 964 1,912 2,131 21.0 21.5 6.8 7.6 9.0 8.0 0.9 0.8 8.8 7.6 1.8 1.9
Consolidated Co Neutral 4 - 74 1,715 1,824 2.4 6.2 (2.9) (0.4) - - 0.2 0.2 - - 0.5 0.5
IRB Infra Buy 93 112 3,078 3,772 4,191 45.1 45.3 14.6 15.1 6.3 6.1 0.9 0.8 14.2 13.4 3.1 3.3
ITNL Accumulate 140 156 2,722 7,423 7,970 29.2 30.4 30.1 32.3 4.7 4.3 0.7 0.6 14.9 14.2 2.5 2.5
IVRCL Infra Neutral 16 - 502 5,440 5,931 7.7 7.6 (2.5) (2.1) - - 0.2 0.3 - - 0.6 0.6

Stock WStock WStock WStock WStock Watch |atch |atch |atch |atch | January 2014
49May 2011 Please refer to important disclosures at the end of this report.
Company Name Reco CMP Target Mkt Cap Sales (` cr) OPM (%) EPS (`) PER (x) P/BV (x) RoE (%) EV/Sales (x) (`) Price (`) (` cr) FY14E FY15E FY14E FY15E FY14E FY15E FY14E FY15E FY14E FY15E FY14E FY15E FY14E FY15E
Jaiprakash Asso. Neutral 55 - 12,094 13,238 15,218 26.9 26.9 1.6 2.5 34.9 21.8 0.9 0.9 2.6 4.0 2.8 2.5
Larsen & Toubro Buy 1,070 1,237 99,080 66,667 74,669 10.0 10.0 46.7 52.0 22.9 20.6 3.1 2.8 14.2 14.5 1.6 1.5
Nagarjuna Const. Buy 33 39 853 6,044 6,533 8.0 8.0 2.4 2.6 13.9 12.7 0.3 0.3 2.5 2.6 0.5 0.5
Punj Lloyd Neutral 29 - 953 12,726 14,226 8.2 8.2 0.9 1.0 33.4 28.1 0.3 0.3 1.0 1.2 0.6 0.6
Sadbhav Engg. Accumulate 88 99 1,338 2,458 2,727 10.6 10.6 4.6 5.8 19.1 15.1 1.5 1.4 8.1 8.7 0.8 0.8
Simplex Infra Neutral 87 - 430 6,237 6,908 9.1 9.0 12.4 16.7 7.0 5.2 0.3 0.3 3.7 5.0 0.5 0.5
Unity Infra Neutral 27 - 198 2,179 2,359 12.9 13.0 9.3 9.5 2.9 2.8 0.2 0.2 7.9 7.6 0.7 0.7
FMCGFMCGFMCGFMCGFMCG
Asian Paints Neutral 491 - 47,073 12,473 14,581 15.8 16.0 13.2 15.7 37.2 31.3 11.4 9.1 33.7 32.3 3.7 3.1
Britannia Neutral 920 - 11,038 6,470 7,339 8.9 9.2 33.7 40.1 27.3 23.0 11.9 8.6 51.5 43.4 1.7 1.4
Colgate Neutral 1,353 - 18,398 3,588 4,165 17.5 17.7 37.2 43.5 36.3 31.1 31.9 26.5 94.9 92.9 5.0 4.3
Dabur India Neutral 170 - 29,680 7,074 8,135 17.3 16.7 5.5 6.1 31.1 27.7 11.1 8.9 39.9 35.8 4.2 3.6
GlaxoSmith Con* Neutral 4,433 - 18,645 3,617 4,259 15.5 16.6 120.3 149.7 36.9 29.6 11.4 9.1 33.8 34.3 4.7 3.9
Godrej Consumer Neutral 857 - 29,167 7,801 9,094 15.0 15.5 23.0 28.4 37.2 30.2 7.5 6.3 23.1 23.7 3.9 3.3
HUL Neutral 571 - 123,475 27,315 30,732 14.4 13.7 16.8 17.6 34.0 32.4 32.5 24.2 112.2 85.7 4.4 3.9
ITC Neutral 322 - 255,206 32,945 38,295 36.3 36.9 11.0 12.8 29.2 25.1 9.5 7.7 35.4 34.0 7.5 6.3
Marico Neutral 217 - 13,984 4,816 5,498 14.8 15.5 7.0 8.6 31.2 25.1 5.9 4.8 20.6 21.1 2.9 2.5
Nestle* Neutral 5,297 - 51,074 9,190 10,590 21.9 22.5 119.1 146.4 44.5 36.2 21.5 15.7 55.0 50.2 5.6 4.8
Tata Global Neutral 160 - 9,922 7,761 8,615 9.6 10.5 6.8 9.2 23.7 17.4 2.5 2.4 10.4 10.3 1.2 1.1
ITITITITIT
HCL Tech^ Accumulate 1,263 1,350 88,269 33,071 37,360 25.7 24.8 81.9 91.4 15.4 13.8 4.6 3.6 30.6 26.3 2.4 2.0
Hexaware* Accumulate 132 142 3,951 2,297 2,727 22.7 22.8 12.6 14.2 10.4 9.3 2.6 2.2 25.6 24.5 1.6 1.3
Infosys Neutral 3,486 - 200,150 50,571 57,137 26.3 26.8 178.2 214.9 19.6 16.2 4.0 3.4 20.9 20.7 3.3 2.8
Infotech Enterprises Neutral 341 - 3,812 2,152 2,419 19.0 18.9 24.2 27.2 14.0 12.5 2.4 2.0 17.0 16.2 1.4 1.2
KPIT Tech Neutral 172 - 3,317 2,768 3,147 16.0 16.3 13.4 16.5 12.8 10.4 2.3 1.9 20.0 19.8 1.2 0.9
Mindtree Accumulate 1,531 1,650 6,368 3,009 3,485 20.3 20.9 114.7 132.7 13.3 11.5 3.5 2.7 26.9 23.8 1.8 1.4
Mphasis& Neutral 438 - 9,195 6,666 7,134 18.0 18.4 39.7 45.3 11.0 9.7 1.6 1.4 14.8 14.6 1.0 0.8
NIIT Neutral 28 - 456 984 1,066 7.1 7.0 2.0 4.0 13.6 7.0 0.7 0.7 5.1 9.4 0.2 0.1
Persistent Neutral 980 - 3,920 1,672 1,959 25.1 25.5 60.2 76.3 16.3 12.8 3.1 2.6 19.3 19.9 2.0 1.5
TCS Buy 2,171 2,500 425,230 82,399 95,466 30.9 30.9 95.2 115.4 22.8 18.8 7.7 6.0 33.7 31.7 4.9 4.2
Tech Mahindra Accumulate 1,838 1,935 42,855 18,579 21,284 22.7 22.1 121.6 132.4 15.1 13.9 4.6 3.5 30.2 25.2 2.1 1.7
Wipro Accumulate 559 600 137,835 44,001 49,882 22.5 23.1 31.4 36.1 17.8 15.5 4.0 3.4 22.5 21.4 2.7 2.2
MediaMediaMediaMediaMedia
D B Corp Accumulate 293 330 5,383 1,825 2,037 26.1 26.8 15.5 17.9 18.9 16.4 5.2 4.4 25.3 24.7 2.9 2.5
HT Media Buy 78 104 1,834 2,188 2,360 14.5 15.0 8.8 9.3 8.9 8.4 1.1 1.0 12.2 11.5 0.5 0.3
Jagran Prakashan Buy 91 111 3,012 1,692 1,855 21.9 23.5 6.8 7.7 13.3 11.7 2.8 2.5 22.1 22.7 1.8 1.6
PVR Neutral 646 - 2,576 1,431 1,755 17.9 18.0 18.8 25.5 34.4 25.3 3.7 3.3 11.2 13.9 2.2 1.8
Sun TV Network Neutral 382 - 15,050 2,287 2,580 68.3 69.7 19.5 23.5 19.6 16.2 4.8 4.2 25.8 27.7 6.2 5.4

Stock WStock WStock WStock WStock Watch |atch |atch |atch |atch | January 2014
50May 2011 Please refer to important disclosures at the end of this report.
MetalMetalMetalMetalMetalBhushan Steel Reduce 481 448 10,885 9,407 12,737 32.2 36.9 19.4 48.5 24.7 9.9 1.1 1.0 4.5 10.4 3.8 2.9Coal India Neutral 290 - 183,175 69,854 74,994 26.9 29.7 23.8 27.6 12.2 10.5 2.8 2.4 30.0 32.1 1.7 1.5Electrosteel Castings Neutral 15 - 487 1,976 2,017 11.8 12.7 0.1 1.2 233.4 12.3 0.1 0.1 0.1 1.9 0.7 0.1GMDC Accumulate 119 131 3,775 1,477 1,890 42.2 46.4 13.5 18.7 8.8 6.3 1.4 1.2 16.4 19.9 2.3 1.7Hind. Zinc Buy 132 156 55,964 12,882 13,550 53.6 51.9 16.4 17.0 8.1 7.8 1.5 1.3 19.8 17.7 2.2 1.7Hindalco Neutral 123 - 25,291 90,332 103,186 8.6 9.6 11.2 15.5 11.0 7.9 0.6 0.6 6.0 7.8 0.8 0.7JSW Steel Sell 1,018 848 24,599 43,980 47,710 18.2 17.8 87.9 95.1 11.6 10.7 1.4 1.3 12.4 12.6 1.1 1.0MOIL Neutral 240 - 4,030 1,027 1,069 42.0 46.0 25.6 27.5 9.4 8.7 1.3 1.2 14.7 14.1 1.5 1.5Monnet Ispat Accumulate 151 170 965 2,041 2,475 22.2 18.9 30.5 27.5 5.0 5.5 0.3 0.3 7.2 6.1 2.1 1.7Nalco Neutral 38 - 9,755 6,848 7,454 14.2 15.6 2.7 3.2 14.0 11.8 0.8 0.8 5.8 6.6 0.7 0.6NMDC Accumulate 142 151 56,259 11,334 12,043 67.5 65.5 16.5 16.9 8.6 8.4 1.8 1.6 21.8 20.6 3.0 2.7SAIL Sell 73 51 29,964 46,017 51,344 9.0 9.7 4.1 5.0 17.8 14.6 0.7 0.7 6.2 4.8 1.2 1.2Sesa Sterlite Neutral 202 - 59,872 66,940 72,762 34.6 34.6 26.6 32.3 7.6 6.3 0.6 0.5 10.2 8.9 1.3 1.1Tata Steel Accumulate 423 461 41,126 153,787 167,041 9.8 10.1 40.4 47.6 10.5 8.9 1.1 1.0 11.0 11.8 0.6 0.5Sarda Buy 105 138 377 1,096 1,134 16.8 17.3 21.8 23.5 4.8 4.5 0.4 0.4 8.2 8.2 0.4 0.3Prakash Industries Neutral 42 - 565 2,076 2,060 15.0 16.9 9.5 11.4 4.4 3.7 0.3 0.2 6.5 7.3 0.6 0.6Godawari Power Buy 86 100 283 2,413 2,745 14.9 16.1 29.2 39.1 3.0 2.2 0.3 0.2 9.5 11.5 0.8 0.7Oil & GasOil & GasOil & GasOil & GasOil & GasCairn India Buy 324 380 61,870 19,470 19,621 73.0 63.4 63.4 61.9 5.1 5.2 1.1 0.9 23.1 19.0 2.0 1.6GAIL Neutral 342 - 43,318 56,115 65,425 12.6 10.5 32.5 30.7 10.5 11.1 1.6 1.4 16.0 13.5 0.2 0.2ONGC Accumulate 289 318 246,911 181,003 204,096 30.7 35.8 30.0 39.6 9.6 7.3 1.5 1.3 16.0 18.8 1.2 0.9Reliance Industries Accumulate 895 1,020 289,132 465,082 491,292 7.0 6.9 73.0 77.7 12.3 11.5 1.3 1.2 11.4 11.0 0.6 0.6Gujarat Gas* Neutral 267 - 3,424 3,270 3,467 16.5 14.1 29.0 26.3 9.2 10.2 3.0 2.7 35.2 28.1 0.9 0.8Indraprastha Gas Neutral 268 - 3,745 4,488 5,418 17.6 15.5 25.7 27.4 10.4 9.8 2.1 1.8 22.1 20.3 0.8 0.6Petronet LNG Neutral 122 - 9,158 37,686 44,414 4.4 4.4 11.4 13.2 10.7 9.3 1.8 1.5 17.8 17.9 0.3 0.3Gujarat State Petronet Buy 61 70 3,427 1,119 1,009 91.4 91.5 9.0 7.8 6.7 7.8 1.0 0.9 16.1 12.4 2.5 2.7PharmaceuticalsPharmaceuticalsPharmaceuticalsPharmaceuticalsPharmaceuticalsAlembic Pharma Neutral 211 - 3,970 1,736 2,008 17.1 18.9 10.5 13.8 20.1 15.3 6.1 4.7 34.4 34.7 2.4 2.0Aurobindo Pharma Neutral 393 - 11,442 7,166 8,478 18.5 18.5 28.0 33.8 14.0 11.6 3.4 2.6 27.1 25.3 2.0 1.8Aventis* Neutral 2,763 - 6,362 1,682 1,917 15.6 15.6 94.8 104.7 29.1 26.4 4.2 3.5 16.1 17.6 3.3 2.7Cadila Healthcare Accumulate 807 894 16,525 7,123 8,367 15.5 15.7 37.3 44.7 21.6 18.1 4.5 3.8 22.9 22.9 2.6 2.2Cipla Buy 401 504 32,161 9,274 10,796 23.1 23.1 21.0 23.8 19.1 16.8 3.1 2.6 17.2 16.8 3.2 2.7Dr Reddy's Buy 2,533 3,008 43,069 13,617 15,590 24.8 24.3 144.4 161.6 17.5 15.7 4.5 3.6 29.2 25.7 3.2 2.7Dishman Pharma Accumulate 100 107 804 1,394 1,534 22.5 22.4 14.8 16.6 6.7 6.0 0.7 0.6 10.8 11.0 1.2 1.0GSK Pharma* Neutral 2,993 - 25,348 2,548 2,752 20.0 21.2 58.4 64.4 51.2 46.5 12.6 12.3 24.6 26.8 9.2 8.4Indoco Remedies Neutral 137 - 1,263 747 906 15.3 15.3 5.9 7.6 23.2 18.0 2.8 2.5 12.5 14.4 1.9 1.6Ipca labs Accumulate 721 791 9,097 3,296 4,087 22.3 23.5 40.4 52.7 17.8 13.7 4.5 3.5 28.7 28.8 2.9 2.3Lupin Neutral 909 - 40,726 11,813 14,377 22.0 22.0 36.6 44.8 24.8 20.3 6.2 4.9 27.1 25.8 3.5 2.8Ranbaxy Neutral 453 - 19,200 10,400 11,331 6.6 8.4 11.4 15.2 39.7 29.8 4.2 3.7 11.1 13.1 1.9 1.7Sun Pharma Neutral 568 - 117,587 14,306 16,236 43.0 42.0 25.6 25.8 22.2 22.0 7.4 5.7 35.3 29.0 7.8 6.6
Company Name Reco CMP Target Mkt Cap Sales (` cr) OPM (%) EPS (`) PER (x) P/BV (x) RoE (%) EV/Sales (x) (`) Price (`) (` cr) FY14E FY15E FY14E FY15E FY14E FY15E FY14E FY15E FY14E FY15E FY14E FY15E FY14E FY15E

Stock WStock WStock WStock WStock Watch |atch |atch |atch |atch | January 2014
51May 2011 Please refer to important disclosures at the end of this report.
Source: Company, Angel Research, Note: *December year end; #September year end; &October year end; ^June year end; Price as on December 31, 2013; Sesa Goa's numbers reflect the standalone Sesa Goa business only. We will revise our numbers oncethe consolidated entity Sesa- Sterlite is formed
Company Name Reco CMP Target Mkt Cap Sales (` cr) OPM (%) EPS (`) PER (x) P/BV (x) RoE (%) EV/Sales (x) (`) Price (`) (` cr) FY14E FY15E FY14E FY15E FY14E FY15E FY14E FY15E FY14E FY15E FY14E FY15E FY14E FY15E
PPPPPowerowerowerowerower
GIPCL Neutral 62 - 935 1,298 1,319 31.9 32.5 9.9 11.4 6.3 5.4 0.5 0.5 8.9 9.7 0.9 0.7
NTPC Neutral 137 - 112,798 72,187 76,460 23.5 23.9 12.0 12.5 11.4 11.0 1.3 1.2 11.7 11.5 2.3 2.3
Real EstateReal EstateReal EstateReal EstateReal Estate
DLF Accumulate 167 179 29,734 8,293 9,622 36.5 36.1 5.7 6.7 29.2 24.8 1.0 1.0 3.7 4.1 5.7 4.7
MLIFE Buy 396 483 1,618 888 1,002 27.0 29.9 33.9 42.1 11.7 9.4 1.2 1.1 9.9 11.2 2.4 2.2
TTTTTelecomelecomelecomelecomelecom
Bharti Airtel Accumulate 330 360 132,094 85,396 92,224 32.1 32.4 7.7 12.7 43.0 26.1 2.4 2.2 5.8 8.8 2.2 2.0
Idea Cellular Neutral 167 - 55,364 26,245 28,401 31.4 31.3 5.6 6.9 29.6 24.2 3.4 3.0 11.4 12.3 2.5 2.2
Rcom Neutral 130 - 26,791 21,818 24,183 33.0 33.7 3.6 5.9 35.9 22.0 0.8 0.8 2.2 3.4 3.0 2.6
OthersOthersOthersOthersOthers
Abbott India* Neutral 1,689 - 3,588 1,788 1,996 12.5 12.7 71.7 81.4 23.5 20.7 4.8 4.1 21.7 21.2 1.8 1.6
Bajaj Electricals Neutral 223 - 2,225 3,885 4,472 4.0 5.8 6.8 15.4 33.0 14.5 2.9 2.5 8.8 17.3 0.6 0.5
Cera Sanitaryware Neutral 701 - 888 647 836 13.5 13.4 40.4 51.1 17.3 13.7 4.0 3.2 25.4 25.6 1.4 1.1
Cravatex Neutral 245 - 63 248 284 6.5 7.2 27.1 38.2 9.0 6.4 1.4 1.2 15.7 18.5 0.4 0.4
Finolex Cables Accumulate 83 87 1,263 2,573 2,908 10.2 10.2 10.7 12.4 7.7 6.7 1.2 1.0 15.0 14.8 0.4 0.3
Goodyear India* Neutral 370 - 854 1,581 1,724 8.9 8.7 38.8 41.2 9.5 9.0 2.0 1.7 23.0 20.6 0.4 0.3
Hitachi Neutral 156 - 423 1,080 1,199 8.9 9.1 8.5 14.2 18.4 11.0 1.7 1.5 9.4 14.2 0.5 0.4
Honeywell Automation* Neutral 2,757 - 2,438 1,842 2,131 5.8 6.0 82.5 100.4 33.4 27.5 3.2 2.9 10.1 11.2 1.2 1.1
IFB Agro Buy 178 217 160 475 542 10.2 10.7 30.1 36.1 5.9 4.9 0.9 0.7 15.8 16.2 0.2 0.2
ITD Cementation Buy 140 189 161 1,313 1,444 10.6 11.2 7.9 26.2 17.7 5.3 0.4 0.4 2.2 7.2 0.5 0.5
Jyothy Laboratories Accumulate 190 207 3,440 1,244 1,523 13.6 13.9 5.3 9.0 36.1 21.1 3.2 2.8 10.6 14.1 2.9 2.3
MRF Accumulate 19,372 20,425 8,216 13,240 14,229 13.9 13.8 2,061.1 2,269.5 9.4 8.5 1.8 1.5 21.4 19.3 0.7 0.6
Page Industries Neutral 5,164 - 5,760 1,102 1,348 20.3 20.2 136.0 165.4 38.0 31.2 19.6 14.1 59.8 52.6 5.3 4.3
Relaxo Footwears Neutral 227 - 1,362 1,125 1,373 11.1 12.6 9.5 15.0 23.8 15.1 5.3 4.1 24.2 30.5 1.4 1.1
Siyaram Silk Mills Accumulate 281 319 263 1,216 1,396 10.8 11.0 65.3 79.8 4.3 3.5 0.7 0.6 18.0 18.7 0.4 0.4
Styrolution ABS India* Buy 420 492 738 1,007 1,108 8.3 8.7 30.0 35.1 14.0 12.0 1.5 1.4 11.5 12.2 0.7 0.6
TAJ GVK Buy 65 108 410 300 319 35.8 36.2 7.9 9.1 8.3 7.2 1.1 1.0 13.9 14.4 1.7 1.4
Tata Sponge Iron Buy 309 405 475 735 836 14.7 16.2 50.1 63.5 6.2 4.9 0.7 0.6 11.5 13.2 0.1 0.0
TTK Healthcare Accumulate 542 614 421 416 475 4.8 6.5 16.3 25.2 33.3 21.5 4.1 3.6 12.6 18.0 0.9 0.8
Tree House Buy 240 313 865 154 206 54.1 54.9 12.5 17.4 19.3 13.8 2.3 2.1 12.2 15.0 5.4 3.9
TVS Srichakra Accumulate 274 309 210 1,594 1,723 6.0 6.0 36.9 44.2 7.4 6.2 1.1 0.9 15.5 16.3 0.2 0.2
United Spirits Neutral 2,607 - 37,888 11,446 12,934 12.0 12.0 20.3 43.0 128.5 60.6 4.3 4.1 4.4 6.9 3.7 3.2
Vesuvius India* Neutral 456 - 926 600 638 20.1 19.4 35.7 36.5 12.8 12.5 2.3 2.0 19.4 17.1 1.3 1.2
HSIL Accumulate 105 117 690 2,042 2,363 14.6 14.8 12.3 16.5 8.5 6.3 0.6 0.6 7.5 9.4 0.8 0.7

Refer to important Disclosures at the end of the report 52
3QFY2014 Results Preview | | | | | January 3, 2014
52
Buy (> 15%) Accumulate (5% to 15%) Neutral (-5 to 5%)Reduce (-5% to -15%) Sell (< -15%)
Ratings (Returns) :
Disclaimer
This document is solely for the personal information of the recipient, and must not be singularly used as the basis of any investmentdecision. Nothing in this document should be construed as investment or financial advice. Each recipient of this document should makesuch investigations as they deem necessary to arrive at an independent evaluation of an investment in the securities of the companiesreferred to in this document (including the merits and risks involved), and should consult their own advisors to determine the merits andrisks of such an investment.
Angel Broking Pvt. Limited, its affiliates, directors, its proprietary trading and investment businesses may, from time to time, make investmentdecisions that are inconsistent with or contradictory to the recommendations expressed herein. The views contained in this document arethose of the analyst, and the company may or may not subscribe to all the views expressed within.
Reports based on technical and derivative analysis center on studying charts of a stock's price movement, outstanding positions and tradingvolume, as opposed to focusing on a company's fundamentals and, as such, may not match with a report on a company's fundamentals.
The information in this document has been printed on the basis of publicly available information, internal data and other reliable sourcesbelieved to be true, but we do not represent that it is accurate or complete and it should not be relied on as such, as this document is forgeneral guidance only. Angel Broking Pvt. Limited or any of its affiliates/ group companies shall not be in any way responsible for any lossor damage that may arise to any person from any inadvertent error in the information contained in this report. Angel Broking Pvt. Limitedhas not independently verified all the information contained within this document. Accordingly, we cannot testify, nor make any representationor warranty, express or implied, to the accuracy, contents or data contained within this document. While Angel Broking Pvt. Limitedendeavours to update on a reasonable basis the information discussed in this material, there may be regulatory, compliance, or otherreasons that prevent us from doing so.
This document is being supplied to you solely for your information, and its contents, information or data may not be reproduced, redistributedor passed on, directly or indirectly.
Angel Broking Pvt. Limited and its affiliates may seek to provide or have engaged in providing corporate finance, investment banking orother advisory services in a merger or specific transaction to the companies referred to in this report, as on the date of this report or in thepast.
Neither Angel Broking Pvt. Limited, nor its directors, employees or affiliates shall be liable for any loss or damage that may arise from orin connection with the use of this information.
Note: Please refer to the important ‘Stock Holding Disclosure' report on the Angel website (Research Section). Also, please refer to theNote: Please refer to the important ‘Stock Holding Disclosure' report on the Angel website (Research Section). Also, please refer to theNote: Please refer to the important ‘Stock Holding Disclosure' report on the Angel website (Research Section). Also, please refer to theNote: Please refer to the important ‘Stock Holding Disclosure' report on the Angel website (Research Section). Also, please refer to theNote: Please refer to the important ‘Stock Holding Disclosure' report on the Angel website (Research Section). Also, please refer to thelatest update on respective stocks for the disclosure status in respect of those stocks. Angel Broking Pvt. Limited and its affiliates may havelatest update on respective stocks for the disclosure status in respect of those stocks. Angel Broking Pvt. Limited and its affiliates may havelatest update on respective stocks for the disclosure status in respect of those stocks. Angel Broking Pvt. Limited and its affiliates may havelatest update on respective stocks for the disclosure status in respect of those stocks. Angel Broking Pvt. Limited and its affiliates may havelatest update on respective stocks for the disclosure status in respect of those stocks. Angel Broking Pvt. Limited and its affiliates may haveinvestment positions in the stocks recommended in this report.investment positions in the stocks recommended in this report.investment positions in the stocks recommended in this report.investment positions in the stocks recommended in this report.investment positions in the stocks recommended in this report.

53
3QFY2014 Results Preview | | | | | January 3, 2014
Refer to important Disclosures at the end of the report
6th Floor, Ackruti Star, Central Road, MIDC, Andheri (E), Mumbai - 400 093. Tel: (022) 393578006th Floor, Ackruti Star, Central Road, MIDC, Andheri (E), Mumbai - 400 093. Tel: (022) 39357800
Research Team
Fundamental:
Sarabjit Kour Nangra VP-Research, Pharmaceutical [email protected]
Vaibhav Agrawal VP-Research, Banking [email protected]
Bhavesh Chauhan Sr. Analyst (Metals & Mining) [email protected]
Viral Shah Sr. Analyst (Infrastructure) [email protected]
V Srinivasan Analyst (Cement, FMCG) [email protected]
Yaresh Kothari Analyst (Automobile) [email protected]
Ankita Somani Analyst (IT, Telecom) [email protected]
Sourabh Taparia Analyst (Banking) [email protected]
Bhupali Gursale Economist [email protected]
Vinay Rachh Research Associate [email protected]
Amit Patil Research Associate [email protected]
Twinkle Gosar Research Associate [email protected]
Tejashwini Kumari Research Associate [email protected]
Akshay Narang Research Associate [email protected]
Harshal Patkar Research Associate [email protected]
Nishant Sharma Research Associate [email protected]
Technicals:
Shardul Kulkarni Sr. Technical Analyst [email protected]
Sameet Chavan Technical Analyst [email protected]
Derivatives:
Siddarth Bhamre Head - Derivatives [email protected]
Institutional Sales Team:
Mayuresh Joshi VP - Institutional Sales [email protected]
Meenakshi Chavan Dealer [email protected]
Gaurang Tisani Dealer [email protected]
Production Team:
Tejas Vahalia Research Editor [email protected]
Dilip Patel Production Incharge [email protected]
CSO & Registered Office: G-1, Ackruti Trade Centre, Rd. No. 7, MIDC, Andheri (E), Mumbai - 400 093.Tel.: (022) 3083 7700. Angel Broking Pvt. Ltd: BSE Sebi Regn No: INB010996539 / PMS Regd Code: PM/INP000001546 / CDSL Regn No: IN - DP - CDSL - 234 - 2004 / NSE Sebi Regn Nos: Cash: INB231279838 / NSE F&O:INF231279838/ Currency: INE231279838 / MCX Currency Sebi Regn No: INE261279838 / Member ID: 10500 / Angel Commodities Broking Pvt. Ltd: MCX Member ID: 12685 / FMC Regn No: MCX / TCM / CORP / 0037 NCDEX : Member ID 00220 / FMC Regn No: NCDEX / TCM / CORP / 0302