3Q 20 Financial Results - Bausch Health
78
Financial Results 3Q 20
Transcript of 3Q 20 Financial Results - Bausch Health

Financial Results
3Q 20

1
This presentation contains forward-looking information and statements, within the meaning of applicable securities laws
(collectively, “forward-looking statements”), including, but not limited to, statements regarding Bausch Health's future
prospects and performance (including the Company’s 2020 full-year guidance and targeted three-year CAGR1 of
revenue growth and Adjusted EBITDA (non-GAAP) growth), expectations for cash generated from operations and the
anticipated uses of same, expectations regarding gross margin, the Company’s plan to spin off or separate its eye health
business from the remainder of Bausch Health, including the timing of the internal organizational design/structure and
capitalization structure of such transaction, the anticipated dis-synergies resulting from such transaction (including the
allocation thereof between the separated entity and the remainder of Bausch Health) and the targeted leverage of the
separated entity and the remainder of Bausch Health, the anticipated impact of the COVID-19 pandemic on the
Company and its financial condition, results of operation, revenues, segments, liquidity, products and product pipeline,
operations, facilities, supply chain and employees, planned efforts to address the COVID-19 pandemic, the anticipated
timing, speed and magnitude of the Company’s recovery from the COVID-19 pandemic (including expectations by
geography and business unit), expected durability of certain of our products and brands, the anticipated submission,
approval and launch dates for certain of our pipeline products and R&D programs, the anticipated timing of
commencement and resumption of studies or other development work of our pipeline products and R&D programs, the
anticipated timing of the loss of exclusivity of certain of our products and the expected impact of such loss of exclusivity
on our financial condition, the Company’s core priorities to drive return to growth, the Company’s strategic focus for 2021
and beyond, management’s commitments and expected targets and our ability to achieve the action plan and expected
targets in the periods anticipated, and the Company’s plans and expectations for 2020 and beyond. Forward-looking
statements may generally be identified by the use of the words "anticipates," "expects,“ “predicts,” “goals,” "intends,"
"plans," "should," "could," "would," "may," "will," "believes," "estimates," "potential," "target," “commit,” “forecast,”
“tracking,” or "continue" and variations or similar expressions, and phrases or statements that certain actions, events or
results may, could, should or will be achieved, received or taken or will occur or result, and similar such expressions also
identify forward-looking information. These forward-looking statements, including the Company’s 2020 full-year guidance
and targeted three-year CAGR of revenue growth and Adjusted EBITDA (non-GAAP) growth, are based upon the
current expectations and beliefs of management and are provided for the purpose of providing additional information
about such expectations and beliefs and readers are cautioned that these statements may not be appropriate for other
purposes. These forward-looking statements are subject to certain risks and uncertainties that could cause actual results
and events to differ materially from those described in these forward-looking statements. These risks and uncertainties
include, but are not limited to, the risks and uncertainties discussed in the Company's most recent annual and quarterly
reports and detailed from time to time in the Company's other filings with the Securities and Exchange Commission and
the Canadian Securities Administrators, which risks and uncertainties are incorporated herein by reference. They also
include, but are not limited to, risks and uncertainties caused by or relating to the evolving COVID-19 pandemic, and the
fear of that pandemic and its potential effects, the severity, duration and future impact of which are highly uncertain and
cannot be predicted, and which may have a material adverse impact on the Company, including but not limited to its
supply chain, third-party suppliers, project development timelines, employee base, liquidity, stock price, financial
condition and costs (which may increase) and revenue and margins (both of which may decrease). They also include,
but are not limited to, risks and uncertainties relating to the Company’s proposed plan to spin off or otherwise separate
its eye health business from the remainder of Bausch Health, including the expected benefits and costs of such
transaction, the expected timing of completion of such transaction and its terms, the Company’s ability to complete such
transaction considering the various conditions to the completion of such transaction (some of which are outside the
Company’s control, including conditions related to regulatory matters and a possible shareholder vote, if applicable), that
market or other conditions are no longer favorable to completing the transaction, that any shareholder, stock exchange,
regulatory or other approval (if required) is not obtained on the terms or timelines anticipated or at all, business
disruption during the pendency of or following transaction, diversion of management time on transaction-related issues,
retention of existing management team members, the reaction of customers and other parties to the such transaction,
the qualification of such transaction as a tax-free transaction for Canadian and/or U.S. federal income tax purposes
(including whether or not an advance ruling from either or both of the Canada Revenue Agency and the Internal
Revenue Service will be sought or obtained), potential dissynergy costs between the spun off or separated entity and the
remainder of Bausch Health, the impact of such transaction on relationships with customers, suppliers, employees and
other business counterparties, general economic conditions, conditions in the markets Bausch Health is engaged in,
behavior of customers, suppliers and competitors, technological developments and legal and regulatory rules affecting
Bausch Health’s business. In particular, the Company can offer no assurance that any spinoff or other separation
transaction will occur at all, or that any such transaction will occur on the terms and timelines anticipated by the
Company. In addition, certain material factors and assumptions have been applied in making these forward-looking
statements, including, without limitation, assumptions regarding our 2020 full-year guidance with respect to expectations
regarding base performance and management’s belief regarding the impact of the COVID-19 pandemic and associated
responses on such base performance and the operations and financial results of the Company generally, expected
currency impact, the expected timing and impact of loss of exclusivity for certain of our products, adjusted SG&A
expense (non-GAAP) and the Company’s ability to continue to manage such expense in the manner anticipated, the
anticipated timing and extent of the Company’s R&D expense, and expectations regarding gross margin; assumptions
respecting our targeted three-year CAGR of revenue growth and Adjusted EBITDA (non-GAAP) growth including,
without limitation, management’s belief regarding the impact of the COVID-19 pandemic and associated responses on
the operations and financial results of the Company, constant currency and from mid-point of Feb. 2019 guidance
(adjusted for current exchange rates); and assumptions that the risks and uncertainties outlined above will not cause
actual results or events to differ materially from those described in these forward-looking statements. Additional
information regarding certain of these material factors and assumptions may also be found in the Company’s filings
described above. Management has also made certain assumptions in assessing the anticipated impacts of the COVID-
19 pandemic on the Company and its results of operations and financial conditions, including: that there will be no
material restrictions on access to health care products and services resulting from a possible resurgence of the virus on
a global basis in the fourth quarter of 2020; that strict social restrictions seen earlier this year will not be materially
reenacted in the event of a material resurgence of the virus; that there will be an ongoing gradual global recovery as the
macroeconomic and health care impacts of the COVID-19 pandemic run their course; that the largest impact to the
Company’s businesses were seen in the second quarter of 2020, although we expect additional COVID-19 pandemic
related declines in the year-over-year revenues in the remainder of 2020 in many of our businesses and geographies;
anticipate that our affected businesses could possibly return to pre-pandemic levels as early as late 2020 or in 2021, but
that rates of recovery will vary by geography and business unit, with some regions and business units expected to lag in
recovery possibly beyond 2021 and no major interruptions in the Company’s supply chain and distribution channels. If
any of these assumptions regarding the impacts of the COVID-19 pandemic are incorrect, our actual results could differ
materially from those described in these forward-looking statements. The Company believes that the material factors
and assumptions reflected in these forward-looking statements are reasonable in the circumstances, but readers are
cautioned not to place undue reliance on any of these forward-looking statements. These forward-looking statements
speak only as of the date hereof. Bausch Health undertakes no obligation to update any of these forward-looking
statements to reflect events or circumstances after the date of this presentation or to reflect actual outcomes, unless
required by law.
The guidance in this presentation is only effective as of the date given, November 3, 2020, and will not
be updated or affirmed unless and until the Company publicly announces updated or affirmed guidance.
Distribution or reference of this deck following November 3, 2020 does not constitute the Company re -
affirming guidance.
Forward-Looking Statements
1. Compound Annual Growth Rate.

2
To supplement the financial measures prepared in accordance with U.S. generally accepted accounting principles
(GAAP), the Company uses certain non-GAAP financial measures including (i) Adjusted EBITDA, (ii) Adjusted
EBITA, (iii) EBITA, (iv) EBITA Margin, (v) Adjusted Gross Profit/Adjusted Gross Margin (vi) Adjusted Selling, A&P,
(vii) Adjusted G&A, (viii) Adjusted SG&A, (ix) Total Adjusted Operating Expense, (x) Adjusted Net Income, (xi)
Adjusted Tax Rate, (xii) Organic Revenue, Organic Growth, Organic Change and Organic Revenue Decline and
(xiii) Constant Currency. Management uses some of these non-GAAP measures as key metrics in the evaluation
of Company performance and the consolidated financial results and, in part, in the determination of cash bonuses
for its executive officers. The Company believes these non-GAAP measures are useful to investors in their
assessment of our operating performance and the valuation of the Company. In addition, these non-GAAP
measures address questions the Company routinely receives from analysts and investors and, in order to assure
that all investors have access to similar data, the Company has determined that it is appropriate to make this data
available to all investors.
However, these measures are not prepared in accordance with GAAP nor do they have any standardized
meaning under GAAP. In addition, other companies may use similarly titled non-GAAP financial measures that are
calculated differently from the way we calculate such measures. Accordingly, our non-GAAP financial measures
may not be comparable to such similarly titled non-GAAP measures. We caution investors not to place undue
reliance on such non-GAAP measures, but instead to consider them with the most directly comparable GAAP
measures. Non-GAAP financial measures have limitations as analytical tools and should not be considered in
isolation. They should be considered as a supplement to, not a substitute for, or superior to, the corresponding
measures calculated in accordance with GAAP.
The reconciliations of these historic non-GAAP financial measures to the most directly comparable financial
measures calculated and presented in accordance with GAAP are shown in the appendix hereto. However, for
guidance and expected CAGR1 purposes, the Company does not provide reconciliations of projected Adjusted
EBITDA (non-GAAP) to projected GAAP net income (loss), due to the inherent difficulty in forecasting and
quantifying certain amounts that are necessary for such reconciliations. In periods where significant acquisitions
or divestitures are not expected, the Company believes it might have a basis for forecasting the GAAP equivalent
for certain costs, such as amortization, that would otherwise be treated as a non-GAAP adjustment to calculate
projected GAAP net income (loss). However, because other deductions (e.g., restructuring, gain or loss on
extinguishment of debt and litigation and other matters) used to calculate projected net income (loss) may vary
significantly based on actual events, the Company is not able to forecast on a GAAP basis with reasonable
certainty all deductions needed in order to provide a GAAP calculation of projected net income (loss) at this time.
The amounts of these deductions may be material and, therefore, could result in GAAP net income (loss) being
materially different from (including materially less than) projected Adjusted EBITDA (non-GAAP).
Non-GAAP Information
1. Compound Annual Growth Rate.

3
COVID-19 Perspective &
3Q20 Highlights
3Q20 Financial Results
FY 2020 Guidance
Business Recovery Update
2
3
4
5
Today’sTopics
Spinoff Update
1

4
COVID-19 Perspective and 3Q20 Highlights
5
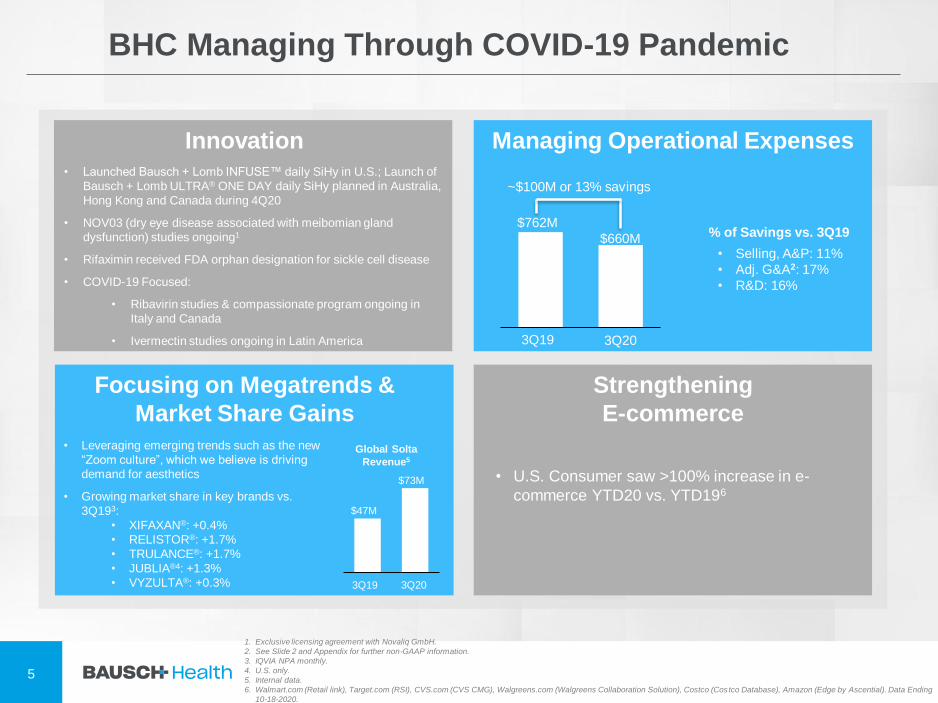
BHC Managing Through COVID-19 Pandemic
Innovation• Launched Bausch + Lomb INFUSE™ daily SiHy in U.S.; Launch of
Bausch + Lomb ULTRA® ONE DAY daily SiHy planned in Australia,
Hong Kong and Canada during 4Q20
• NOV03 (dry eye disease associated with meibomian gland
dysfunction) studies ongoing1
• Rifaximin received FDA orphan designation for sickle cell disease
• COVID-19 Focused:
• Ribavirin studies & compassionate program ongoing in
Italy and Canada
• Ivermectin studies ongoing in Latin America
Managing Operational Expenses
$762M
$660M
~$100M or 13% savings
3Q19 3Q20
Focusing on Megatrends &
Market Share Gains
Strengthening
E-commerce
• U.S. Consumer saw >100% increase in e-
commerce YTD20 vs. YTD196
1. Exclusive licensing agreement with Novaliq GmbH.
2. See Slide 2 and Appendix for further non-GAAP information.
3. IQVIA NPA monthly.
4. U.S. only.
5. Internal data.
6. Walmart.com (Retail link), Target.com (RSI), CVS.com (CVS CMG), Walgreens.com (Walgreens Collaboration Solution), Costco (Costco Database), Amazon (Edge by Ascential). Data Ending
10-18-2020.
• Selling, A&P: 11%
• Adj. G&A2: 17%
• R&D: 16%
% of Savings vs. 3Q19
3Q19 3Q20
$47M
$73M
• Leveraging emerging trends such as the new
“Zoom culture”, which we believe is driving
demand for aesthetics
• Growing market share in key brands vs.
3Q193:
• XIFAXAN®: +0.4%
• RELISTOR®: +1.7%
• TRULANCE®: +1.7%
• JUBLIA®4: +1.3%
• VYZULTA®: +0.3%
Global Solta
Revenue5

6
Bausch Health 3Q20 Update: Recovery In Progress
Organic Revenue Decline1,2 vs. 3Q19 (3%) Reported Revenue Decline vs. 3Q19: (3%)
• Organic revenue1,2 was flat vs. 3Q19; Sequential reported revenue growth of 32% vs. 2Q20
• U.S. Vision Care reported revenue growth of 20% vs. 3Q19, driven by Bausch + Lomb ULTRA®
• International Rx organic revenue growth1,2 of 9% vs. 3Q19, driven by Latin America
• Launched Bausch + Lomb INFUSE™ daily SiHy in U.S.; Launch of Bausch + Lomb ULTRA® ONE DAY daily
SiHy planned in Australia, Hong Kong and Canada during 4Q20
• Reported revenue decline1,2 of 10% vs. 3Q19; Sequential reported revenue growth of 23% vs. 2Q20
• Salix had an LOE3 drag of ~$25M during 3Q20, primarily driven by APRISO®
• XIFAXAN® reported revenue decline of 3% vs. 3Q19; Sequential reported revenue growth of 21% vs. 2Q20
• TRULANCE® reported revenue growth of 57% vs. 3Q19; Sequential reported revenue growth of 29% vs. 2Q20
• Rifaximin received FDA orphan designation for sickle cell disease
• Organic revenue decline1,2 of 3% vs. 3Q19; Sequential reported revenue growth of 24% vs. 2Q20
• Thermage® reported revenue grew 77% vs. 3Q19; Sequential reported revenue growth of 68% vs. 2Q20
Additional Highlights • No debt maturities or mandatory amortization payments until 2023
• Repaid ~$100M of debt in 3Q20 using cash generated from operations for a total of ~$420M YTD
Sequential Reported Revenue Growth vs. 2Q20: 28%
Diversified Products• Organic revenue decline1,2 of 2% vs. 3Q19; Sequential reported revenue growth of 26% vs. 2Q20
• WELLBUTRIN®/APLENZIN® combined reported revenue growth of 24% vs. 3Q19
• Driven by WELLBUTRIN®, which saw 27% reported revenue growth vs. 3Q19
1. See Slide 2 and Appendix for further non-GAAP information.
2. Organic growth/change, a non-GAAP metric, is defined as a change on a period-over-period basis in revenues on a constant currency basis (if applicable) excluding the impact of acquisitions,
divestitures and discontinuations.
3. Loss of exclusivity.

7
3Q20 Financial Results

8
Three Months Ended Favorable (Unfavorable)
9.30.20 9.30.19 ReportedOrganic
Change1,2
Bausch + Lomb/International $1,169M $1,175M (1%) 0%
Global Vision Care Revenue $214M $219M (2%) (2%)
Global Surgical Revenue $151M $161M (6%) (7%)
Global Consumer Revenue $374M $370M 1% 2%
Global Ophtho Rx Revenue $136M $150M (9%) (9%)
International Rx Revenue $294M $275M 7% 9%
Salix $496M $551M (10%) (10%)
Ortho Dermatologics $144M $147M (2%) (3%)
Ortho Dermatologics $71M $100M (29%) (29%)
Global Solta $73M $47M 55% 53%
Diversified Products $329M $336M (2%) (2%)
Neuro & Other Revenue $199M $186M 7% 8%
Generics Revenue $111M $126M (12%) (12%)
Dentistry Revenue $19M $24M (21%) (21%)
Total Company $2,138M $2,209M (3%) (3%)
3Q20 Revenue Results
1. See Slide 2 and Appendix for further non-GAAP information.
2. Organic growth/change, a non-GAAP metric, is defined as a change on a period-over-period basis in revenues on a constant currency basis (if applicable) excluding the impact of acquisitions,
divestitures and discontinuations.

9
Three Months Ended Favorable (Unfavorable)
9.30.20 9.30.19 ReportedConstant
Currency1,2
Organic
Change1,3
Revenues $2,138M $2,209M (3%) (3%) (3%)
GAAP Net Income (Loss) $71M ($49M)
Adj. Net Income (non-GAAP)1
Diluted Shares Outstanding5
$469M
357.8M
$425M
356.8M10% 17%
GAAP EPS $0.20 ($0.14)
GAAP CF from Operations $256M $515M (50%)
Gross Profit4
(excluding amortization and impairments of
intangible assets)
$1,548M $1,625M (5%) (4%)
Gross Margin 72.4% 73.6% (120 bps)
Selling, A&P $423M $477M 11% 11%
Adj. G&A (non-GAAP)1 $134M $162M 17% 17%
R&D $103M $123M 16% 16%
Total Adj. Operating Expense (non-GAAP)1 $660M $762M 13% 13%
Adj. EBITA (non-GAAP)1 $888M $863M 3% 3%
Adj. EBITDA (non-GAAP)1 $948M $942M 1% 4%
3Q 20 Financial Results
1. See Slide 2 and Appendix for further non-GAAP information.
2. See Appendix for further information on the use and calculation of constant currency.
3. Organic growth/change, a non-GAAP metric, is defined as a change on a period-over-period basis in revenues on a constant currency basis (if applicable) excluding the impact of acquisitions,
divestitures and discontinuations.
4. See Appendix for details on amortization and impairments of intangible assets.
5. This figure includes the dilutive impact of options and restricted stock units of approximately 4,453,000 common shares for the three months ended September 30, 2019 which are excluded
when calculating GAAP diluted loss per share because the effect of including the impact in this calculation would have been anti-dilutive.

10
3Q 20 Cash Flow Summary
Three Months
Ended 9.30.20
Three Months
Ended 9.30.19
Nine Months
Ended 9.30.20
Nine Months
Ended 9.30.19
Net income (loss)1 $70M ($48M) ($407M) ($266M)
Net cash provided
by operating
activities
$256M $515M $717M $1,267M
Net cash used in
investing activities($70M) ($73M) ($177M) ($334M)
Net cash used in
financing
activities3($117M) ($474M) ($1,791M)2 ($812M)
Net increase
(decrease) in cash,
cash equivalents
and restricted cash3
$81M ($53M) ($1,256M)2 $104M
Cash, cash
equivalents and
restricted cash at
end of period
$1,988M4 $827M $1,988M4 $827M
$256M of cash generated
from operations during
3Q20; $304M after adjusting
for legacy legal settlements,
primarily due to SEC legal
settlement
Cash from operations
negatively impacted by
COVID-19 vs. prior year
Cash generated from
operations for 2020 is
expected to be ~$1B5
1. Net income (loss) before net loss (income) attributable to noncontrolling interest.
2. Includes $1,240 million redemption of 5.875% May 2023 Notes using proceeds from the December 2019 bond issuance.
3. Includes net impact of activity under our revolving credit facility (if any).
4. Includes remaining net proceeds from Dec. 2019 bond issuance intended to be used to finance the $1,210M pending settlement of the U.S. Securities litigation due in 2020.
5. Excludes legacy legal settlements, separation payments and separation-related payments.

11
3Q 20 Balance Sheet Summary
As of
9.30.20
As of
6.30.20
As of
3.31.20
As of
12.31.19
As of
9.30.19
Cash, cash equivalents and
restricted cash$1,988M1 $1,907M1 $1,923M1 $3,244M2 $827M
Revolving Credit Drawn $0M $0M $0M $0M $0M
Senior Secured Debt3 $8,948M $8,948M $10,541M $10,644M $10,744M
Senior Unsecured Debt3 $15,653M $15,681M $14,160M $15,544M $13,097M
Total Debt3 $24,601M $24,629M $24,701M $26,188M $23,841M
Net Debt4 $23,624M5 $23,733M5 $23,789M5 $22,945M6 $23,016M
TTM7 Adj. EBITDA
(non-GAAP)8$3,281M $3,275M $3,533M $3,571M $3,531M
1. Includes remaining net proceeds from Dec. 2019 bond issuance intended to be used to finance the $1,210M pending settlement of the U.S.
Securities litigation due in 2020.
2. Includes remaining net proceeds from Dec. 2019 bond issuance intended to be used to: ( i) finance the $1,210M pending settlement of the U.S.
Securities litigation expected to be due in 2020 and (ii) replace $1,240M of debt due May 2023 on Jan. 16, 2020.
3. Debt balances shown at principal value. Senior secured debt figure is inclusive of revolving credit drawn (if any).
4. Total Debt net of unrestricted cash and cash equivalents.
5. Restricted cash and cash equivalents as of 9/30/2020, 6/30/20 and 3/31/20 includes $1,010M intended to be used to finance the $1,210M
pending settlement of the U.S. Securities litigation in 2020. This $1,010M does not reduce net debt as of 9/30/2020, 6/30/20 and 3/31/20. Net
Debt as of 9/30/2020, 6/30/20 and 3/31/20 is reduced by the remaining $200M of the $1,210M which is not in restricted cash.
• Repaid ~$100M of debt with cash generated from operations for a total of ~$420M YTD
• No debt maturities or mandatory amortization payments until 2023
6. Net Debt as of 12/31/19 is reduced by the $1,210M, no part of which is in
restricted cash as of 12/31/19, intended to be used to finance the pending
settlement of the U.S. Securities litigation expected to be due in 2020.
7. Trailing Twelve Months.
8. See Slide 2 and Appendix for further non-GAAP information.

Long-Term Debt Maturity Profile as of September 30, 20201
1. Debt values are shown at principal value; EUR debt converted at EURUSD rate of 1.1722 (rate as of 9/30/20).
12
• No debt maturities or mandatory amortization payments until 2023
• As of September 30, 2020, ~80% of debt is fixed rate debt; remaining ~20% is secured floating
• As of September 30, 2020, ~5.94% weighted average cost of debt
• YTD as of November 3, 2020, repaid ~$420M of debt using cash generated from operations
• Subsequent to 3Q20, announced redemption of $150M of 2023 Senior Unsecured Notes on Nov. 30, 2020
with cash generated from operations
No Debt Maturities or Mandatory Amortization Until 2023
2020 2021 2022 2023 2024 2025 2026 2027 2028 2029 2030 Total
Debt
Maturities
(Secured)$0 $0 $0 $0 $2,000M $5,768M $0 $500M $0 $0 $0 $8,268M
Debt
Maturities
(Unsecured)
$0 $0 $0 $2,141M $0 $4,750M $1,500M $1,750M $2,012M $2,250M $1,250M $15,653M
Mandatory
Amortization
(Secured)
$0 $0 $0 $263M $303M $114M $0 $0 $0 $0 $0 $680M
Total $0 $0 $0 $2,404M $2,303M $10,632M $1,500M $2,250M $2,012M $2,250M $1,250M $24,601M

13
FY 2020 Guidance

14
Key AssumptionsPrior Guidance
(February 2020)
Prior Guidance
(May 2020)
Prior Guidance
(August 2020)
Current Guidance
(November 2020)
Adj. SG&A Expense (non-GAAP)1 ~$2.6B ~$2.4B ~$2.3B ~$2.3B
R&D Expense ~$500M ~$475M ~$465M ~$460M
Interest Expense2 ~$1.55B ~$1.55B ~$1.53B ~$1.53B
Adj. Tax Rate (non-GAAP)1 ~8% ~8% ~8% ~8%
Avg. Fully Diluted Share Count 362M 362M 358M 358M
Additional Non-Cash Assumptions
Depreciation ~$185M ~$185M ~$180M ~$180M
Stock-Based Compensation ~$115M ~$110M ~$110M ~$110M
Additional Cash Item Assumptions
Capital Expenditures ~$300M ~$275M ~$275M ~$275M
Contingent Consideration /
Milestones / License Agreements~$100M ~$75M ~$80M ~$100M
Restructuring and Other ~$75M ~$75M ~$75M ~$75M
Prior Guidance
(February 2020)
Prior Guidance
(May 2020)
Prior Guidance
(August 2020)
Current Guidance
(November 2020)
Total Revenues $8.65B - $8.85B $7.80B - $8.20B $7.80B - $8.00B $7.80B - $8.00B
Adjusted EBITDA (non-GAAP)1 $3.50B - $3.65B $3.15B - $3.35B $3.15B - $3.30B $3.15B - $3.30B
1. See Slide 2 and Appendix for further non-GAAP information.
2. Interest expense includes amortization and write-down of deferred financing costs of ~$60M.
3. The guidance in this presentation is only effective as of the date given, Nov. 3, 2020, and will not
be updated or affirmed unless and until the Company publicly announces updated or affirmed
guidance. Distribution or reference of this deck following Nov. 3, 2020 does not constitute the
Company re-affirming guidance.
4. See Slide 1 for further information on forward-looking statements.
Cash generated from
operations for 2020 is
expected to be ~$1B5
Gross margin for 2020 is
expected to be ~72%
3-year CAGRs6,8
(constant currency and from the
mid-point of 2019 guidance7)
• Expect revenue to grow
at a 3%-5% CAGR6
• Expect adj. EBITDA
(non-GAAP)1 to grow at
a 4%-7% CAGR6
Full-Year 2020 Revenue and
Adjusted EBITDA (non-GAAP)1 Guidance3,4
5. Excludes legacy legal settlements, separation payments and separation-
related payments
6. Compound Annual Growth Rate.
7. Based on Guidance issued in Feb. 2019.
8. Excludes the impact of the previously announced separation of the eye
health business, including one-time costs, duplicative costs, and dis-
synergies associated with such separation.

Full-Year 2020 Revenue and Adjusted EBITDA (non-GAAP)1
Guidance Bridge2,3
151. See Slide 2 and Appendix for further non-GAAP information.
2. The guidance in this presentation is only effective as of the date given, Nov. 3, 2020, and will not be updated or affirmed u nless and until the Company publicly announces
updated or affirmed guidance. Distribution or reference of this deck following Nov. 3, 2020 does not constitute the Company re-affirming guidance.
3. See Slide 1 for further information on forward-looking statements.
.
Aug.
Guidance
Currency
ImpactLOE R&D
Base
Performance
Nov.
Guidance
Approx.
($20M)
$8.00B
to
$7.80B
N/A
Revenue Revenue
Adj. EBITDA (non-GAAP)1
Adj. EBITDA (non-GAAP)1
$8.00B
to
$7.80B
Approx.
($20M) Approx.
($25M)
$3.30B
to
$3.15BApprox.
+$5M
Approx.
+$25M
Approx.
+$40M
$3.30B
to
$3.15B
($5M)
Aug.
Guidance
Currency
ImpactLOE R&D
Base
Performance
Nov.
Guidance

16
Business Recovery Update

22%
31%
3%
-47%
-40%
1%
10%4%
11%
-60%
-40%
-20%
0%
20%
40%
Jan-20 Feb-20 Mar-20 Apr-20 May-20 Jun-20 Jul-20 Aug-20 Sep-20
Recovery in Progress
17
1. See Slide 2 and Appendix for further non-GAAP information.
2. Organic growth/change, a non-GAAP metric, is defined as a change on
a period-over-period basis in revenues on a constant currency basis (if
applicable) excluding the impact of acquisitions, divestitures and
discontinuations.
3. Internal field consumption sales data.
- Global Vision Care
• Global Vision Care reported organic revenue decline1,2 of 2% vs. 3Q19;
Sequential reported revenue grew 59% vs. 2Q20
• U.S. Vision Care reported revenue growth of 20% vs. 3Q19,
driven by Bausch + Lomb ULTRA®
• International Vision Care revenue returning to pre-COVID-19
levels
• Bausch + Lomb ULTRA® saw organic revenue growth1,2 of 23% vs.
3Q19; Sequential reported revenue grew >100% vs. 2Q20
• Biotrue® ONEday saw flat organic revenue1,2 vs. 3Q19; Sequential
reported revenue grew >100% vs. 2Q20
• Launched Bausch + Lomb INFUSE™ daily SiHy in U.S.; Launch of
Bausch + Lomb ULTRA® ONE DAY daily SiHy planned in Australia, Hong
Kong and Canada during 4Q20
• Acquired an exclusive license for a myopia control contact lens design
developed by BHVI
Key HighlightsBausch + Lomb U.S. Vision Care Dollar % Change Year-Over-Year
(Field Consumption)3
Launched Aug. 2020 ~77%of fits are from switch-in
and ~23% are from new
wearers4
Exceptional Performance Reported Among
Patients With Contact Lens Dryness
73%agreed Bausch & Lomb
INFUSE™ helped
minimize symptoms of
contact lens dryness5
84%agreed Bausch + Lomb
INFUSE™ reduced
irritation and
discomfort4,5
Source of Volume
4. GfK US Contact Lens FITS Tracking, September 2020. Switch-in is a user who was previously in another brand
of lens while new wearer is a user who is new to contacts (or a lapsed wearer) within the last 12 months.
5. Results from a 36-investigator multi-site study of kalifilcon A contact lenses, on 180 current silicone hydrogel
lens wearers with self-reported contact lens dryness. After 7 days of wear, subjects completed an online survey
that rated performance across a range of attributes. Performance was rated using a 6-point agreed/disagreed
scale.

May-18 Sep-18 Jan-19 May-19 Sep-19 Jan-20 May-20 Sep-20
181. See Slide 2 and Appendix for further non-GAAP information.
2. Organic growth/change, a non-GAAP metric, is defined as a change on a period-over-period basis in revenues on a constant currency basis (if applicable) excluding the impact of acquisitions,
divestitures and discontinuations.
3. MULO (IRI), COS (Costco Database), Amazon (Edge by Ascential), Walgreens.com (Walgreens Collaboration Solution), CVS.com (CVS CMG), Target.com (RSI), Walmart.com (Retail Link).
- Global Consumer
LUMIFY®: Weekly Demand Trend3
• Global Consumer reported organic revenue growth1,2 of 2% vs. 3Q19; Sequential reported revenue grew 17% vs. 2Q20
• Ocuvite® + PreserVision® saw organic revenue growth1,2 of 6% vs. 3Q19; Sequential reported revenue grew 6% vs. 2Q20
• LUMIFY® saw reported $20M in revenue; Sequential reported revenue grew 33% vs. 2Q20
• Nielsen's BASES named LUMIFY® eye drops to 2020 U.S. BASES Top 25 Breakthrough Innovations List
• Soothe® reported $21M in revenue or an organic revenue growth1,2 of >300% vs. 3Q19; driven by one-time customer purchase
• Received approval from the FDA for Alaway® Preservative Free eye drops
Key Highlights
U.S. Bausch + Lomb Consumption % Change Year-Over-Year3
-10%
0%
10%
20%
30%
40%
50%
Jan-20 Apr-20 Jul-20 Oct-20
+19%1Q20 Average
Weekly Change
-1%2Q20 Average
Weekly Change
+3%3Q20 and into 4Q20
Average Weekly Change
Returning to
pre-COVID-19 levels
COVID-19 Pantry
Loading

Jan-20 Feb-20 Mar-20 Apr-20 May-20 Jun-20 Jul-20 Aug-20 Sep-20 Oct-20
19
1. See Slide 2 and Appendix for further non-GAAP information.
2. Organic growth/change, a non-GAAP metric, is defined as a change on a period-over-period basis in revenues on a constant currency
basis (if applicable) excluding the impact of acquisitions, divestitures and discontinuations.
3. Market Scope’s Manufacturer Survey for Q3.
4. % reflects rolling 4 week recovery to pre-COVID-19 average procedures.
5. Internal data.
- Global Surgical
Stellaris Elite® Procedures in U.S. Performed Since Beginning of 2020(data collected via eyeTelligence which accounts for ~30% of the Stellaris Elite® systems within the U.S. market)
>100% pre-COVID-19 levels in U.S.4
• Global Surgical reported organic revenue decline1,2 of 7% vs. 3Q19; Sequential reported revenue grew 68% vs. 2Q20
• Cataract procedures in 3Q20 for U.S. Bausch + Lomb grew 1.4% vs. 3Q19, compared to overall market decline of 2.6%3
• Retina procedures in 3Q20 for U.S. Bausch + Lomb grew 8.8% vs. 3Q19, compared to overall market growth of 0.2%3
Key Highlights
Jan. Feb. March Apr. May June July Aug. Sept.
International Surgical Revenue5
Returning to
pre-COVID-19
levels

-
500
1,000
1,500
2,000
2,500
3,000
3,500
4,000
4,500
Jan-18 Apr-18 Jul-18 Oct-18 Jan-19 Apr-19 Jul-19 Oct-19 Jan-20 Apr-20 Jul-20 Oct-20
• Global Ophtho Rx reported organic revenue decline1,2 of
9% vs. 3Q19; Sequential reported revenue grew 40% vs.
2Q20
• VYZULTA® reported $13M in revenue or reported
revenue growth of 30% vs. 3Q19
• VYZULTA® now has approval in seven countries
• Expanded reach into dry AMD and myopia with business
development deals
20
1. See Slide 2 and Appendix for further non-GAAP information.
2. Organic growth/change, a non-GAAP metric, is defined as a change on a period-over-period basis in revenues on a constant currency basis (if applicable) excluding the impact of
acquisitions, divestitures and discontinuations.
3. Provisional name. Luminate® is a registered trademark of Allegro Ophthalmics.
4. IQVIA NPA weekly.
5. Best corrected visual acuity.
6. Intravitreal.
- Global Ophtho Rx
VYZULTA® TRx Trend4
Key Highlights
Limited negative
impact due to
COVID-19
Entered into an agreement to acquire an option to purchase all ophthalmology assets of Allegro Ophthalmics, LLC, including global rights for
risuteganib (Luminate®)3, which is an investigational treatment expected to help reverse vision loss due to dry AMD
7.1%
48.0%
0
10
20
30
40
50
60
Perc
en
tag
e
BCVA5 Letters Change from Baseline
Sham (n=14)
Luminate 2 IVT(n=25)
U.S. Phase 2 Dry AMD Primary Endpoint
% of subjects with >8 letters improvement in BCVA5
>8
7.1%
0.0%
32.0%
20.0%
0
10
20
30
40
50
60
≥10 ≥15
Perc
en
tag
e
BCVA5 Letters Change from Baseline
Sham (n=14)
Luminate 2 IVT(n=25)
U.S. Phase 2 Dry AMD Secondary Endpoint
% of subjects with >10 and >15 letters improvement in BCVA5
6
6

21
Condition/Disease Bausch + Lomb Projects
• Myopia is among the most common ocular disorders worldwide
and is a leading cause of visual impairment in children1
• In the U.S., myopia is estimated to affect approximately 25M
children, with up to 3M considered to be at risk for high myopia2,3
• Studies have predicted that the global prevalence of myopia will
rise from 28% of the world's population, or 2B people, in 2010 to
50% of the world's population, or 5B people, in 20504
• It is estimated that more than 16M patients in the U.S. are
diagnosed with Dry Eye Disease5
• Contact lens dryness is experienced by approximately
half of the 45M lens wearers in the U.S. 6,7,8
• It is estimated that as many as 16M people in the U.S. have
AMD, and globally, the prevalence of AMD is expected to
reach 196M people worldwide this year and to increase to
288M by 20409,10
• ~90% of people diagnosed with AMD have dry AMD, for which
there are currently no treatments11
• Acquired an option to purchase all ophthalmology assets of Allegro
Ophthalmics, LLC, including global rights for risuteganib (Luminate®)13;
an investigational treatment expected to help reverse vision loss due to dry
AMD
• Licensed exclusive rights from STADA and Xbrane to a biosimilar
candidate for Lucentis (ranibizumab) in the U.S. and Canada
• Licensed Novaliq's NOV03 investigational treatment
for dry eye disease associated with meibomian gland dysfunction
Phase 2 studies showed statistically significant and clinically
meaningful improvements in both signs and symptoms of DED
• Launched Bausch + Lomb INFUSE™ daily SiHy in U.S.; Launch daily
of SiHy planned in Australia, Hong Kong and Canada during 4Q20
Helps protect eyes from contact lens dryness and protects against
irritation and discomfort12
Portfolio Expansion into Areas of Unmet Needs
MYOPIA
1. Mehta N, Wen A. Myopia: A Global Epidemic. Retina Today. September 2019.
2. Theophanous C. Myopia Prevalence and Risk Factors in Children. Clinical Ophthalmology. December 2018.
3. U.S. Census Bureau, Current Population Survey, Annual Social and Economic Supplement, 2019.
4. Holden BA, Fricke TR, Wilson DA, et al. Global Prevalence of Myopia and High Myopia and Temporal Trends from 2000
through 2050. Ophthalmology 2016;123(5):1036–42.
5. Farrand et al. Prevalence of Diagnosed Dry Eye Disease in the United States Among Adults Aged 18 Years and Older. Am J
Ophthalmol 2017; 182:90–98.
6. National Institutes of Health. https://www.ncbi.nlm.nih.gov/pmc/articles/PMC2628947/
7. American Optometric Association. https://www.aoa.org/patients-and-public/caring-for-your-vision/contact-lenses/facts-and-
stats
8. Centers for Disease Control and Prevention.
https://www.cdc.gov/contactlenses/fastfacts.html#:~:text=An%20estimated%2045%20million%20people,is%2031%20years%20old%202.
9. IRi. Raw Buyer Count Comparison Shows the Percent of Households and Individuals with AMD is on the Rise. AMD Buyer Group Analytics. Demographics.
March 2018.
10. Wong et al. "Global prevalence of age-related macular degeneration and disease burden projection for 2020 and 2040: a systematic review and meta-
analysis". The Lancet. Volume 2, No. 2, e106–e116, February 2014.
11. The Discovery Eye Foundation. Dry AMD. 2014.
12. Results from a 36-investigator multi-site study of kalifilcon A contact lenses, on 180 current silicone hydrogel lens wearers with self-reported contact lens
dryness. After 7 days of wear, subjects completed an online survey that rated performance across a range of attributes. Performance was rated using a 6-
point agreed/disagreed scale.
13. Provisional name. Luminate® is a registered trademark of Allegro Ophthalmics.
• Acquired an exclusive license in the U.S. and Canada from Eyenovia for
the development and commercialization of an investigational microdose
formulation of atropine ophthalmic solution, which is being investigated for
the reduction of pediatric myopia progression in children ages 3-12.
• Arise™ Orthokeratology System (Coming Soon): Cloud-based lens
fitting software that uses intelligent technology to guide and streamline the
orthokeratology lens design process, offering eye care professionals ability
to produce highly customized orthokeratology lens to treat patients with
myopia
• Acquired an exclusive license for a myopia control contact lens design
developed by BHVI
DRY EYE
AGE-RELATED MACULAR DEGENERATION

14,500
15,500
16,500
17,500
18,500
Jan-20 Feb-20 Mar-20 Apr-20 May-20 Jun-20 Jul-20 Sep-20 Oct-20
82.9%
83.3%
22
1. See Slide 2 and Appendix for further non-GAAP information.
2. Organic growth/change, a non-GAAP metric, is defined as a change on a
period-over-period basis in revenues on a constant currency basis (if
applicable) excluding the impact of acquisitions, divestitures and
discontinuations.
3. Loss of exclusivity.
• Reported revenue decline1,2 of 10%
vs. 3Q19; Sequential revenue growth
of 23% vs. 2Q20
• Salix had an LOE3 drag of ~$25M
during 3Q20, primarily driven by
APRISO® LOE3
• Rifaximin received FDA orphan
designation for sickle cell disease
• Resolved XIFAXAN® IP litigation with
Sun Pharmaceuticals, in addition to
prior resolutions with Teva and
Sandoz
Key Highlights
XIFAXAN® saw reported revenue decline of 3% vs. 3Q19; Sequential reported revenue growth of 21% vs. 2Q20
• Gastroenterologists:
• Prioritization of the backlog of colonoscopies and endoscopies over regular office visits, where
IBS-D is diagnosed, has negatively affected patient diagnoses
• Elective procedure shutdowns, office closures and increased COVID-19 safety measures continue
to affect practices
• Primary Care Physicians: Patient priority has changed for PCP in a COVID-19 environment, with less
urgent visits being delayed or deferred until conditions normalize
XIFAXAN® Update
3Q19
XIFAXAN® TRx Market Share4
3Q20
Recovery in Progress
• 5% TRx growth in 3Q20 vs. 2Q204
• Specialty TRx vs. 2Q20: PCP growth of 2.4%; GI growth of 7.6%5
• Indication TRx vs. 2Q20: HE remain flat; IBS-D grew 21.4%5
• Continued to gain market share despite COVID-19: XIFAXAN® market share increased to 83.3% in 3Q20
from 82.9% in 3Q194
4. IQVIA NPA monthly.
5. IQVIA Subnational weekly.
6. IQVIA NPA weekly.
XIFAXAN® TRx Trend6

-
1,000
2,000
3,000
4,000
5,000
6,000
7,000
Nov-17 Apr-18 Sep-18 Feb-19 Jul-19 Dec-19 May-20 Oct-20
TRULANCE TRULANCE Same Week Prior Year
23 1. IQVIA NPA monthly.
2. IQVIA SMART Weekly NPA.
3. IQVIA NPA weekly.
12.1%
13.8%
3Q19 3Q20
RELISTOR® TRx Market Share1
• RELISTOR® saw reported revenue decline by 15% vs. 3Q19;
Sequential reported revenue growth of 8% vs. 2Q20
• Outpaced market year-over-year: TRx volume was up 9% vs.
3Q19, compared to the market, which was down 5%1
• RELISTOR® Oral: 14% TRx growth vs. 3Q191
• TRULANCE® saw reported revenue growth of 57% vs. 3Q19;
Sequential reported revenue growth of 29% vs. 2Q20
• TRx growth of 46% vs. 3Q19; TRx growth of 7% vs. 2Q201
• Outpaced market year-over-year: Market grew 4% vs. 3Q191
• GI and PCP TRx growth of 34% and 71%, respectively, compared to
3Q192
Trulance® Update Relistor® Update
TRULANCE® TRx Trend3
® ®

Jan-20 Feb-20 Mar-20 Apr-20 May-20 Jun-20 Jul-20 Aug-20 Sep-20 Oct-20
DUOBRII ENSTILAR OTEZLA
-
5
10
15
20
25
Jul-19 Sep-19 Nov-19 Jan-20 Mar-20 May-20 Jul-20 Sep-20
Reve
nu
e (
$M
)
24
1. See Slide 2 and Appendix for further non-GAAP information.
2. Organic growth/change, a non-GAAP metric, is defined as a change on a period-over-period basis in revenues on a constant currency basis (if applicable) excluding the impact of
acquisitions, divestitures and discontinuations.
3. IQVIA NPA Monthly.
4. Internal data.
5. IQVIA Patient Insights – New To Brand; trademarks are property of respective owners.
• Organic revenue decline1,2 of 3% vs. 3Q19; Sequential
reported revenue growth of 24% vs. 2Q20
• Thermage® saw reported revenue growth of 77% compared to
3Q19; Sequential reported revenue growth of 68% vs. 2Q20
• Earlier market rebound than previously anticipated
resulted in an influx of pent-up demand
• Customer base is focused on a segment of the
population that has not been as significantly impacted
by the pandemic, economically
Key HighlightsThermage® Revenue4
6.3%
7.6%
U.S. JUBLIA® TRx Market Share3
3Q19 3Q20
DUOBRII®: New to Brand (NBRx) Trend – Dermatologist Specialty Only5
® ® ®
Impact due to
COVID-19

Strategic Focus: 2021 & Beyond
Strengthen
E-commerce
Gain Market
Share & Invest
in Key
Promoted
Brands
Optimize
Cost Structure
(Project CORE)
Capitalize on
Megatrends,
Globalization
& New
Products
25

26
Spinoff Update

Spinoff Update1
• Unlock value across our two attractive
businesses as soon as possible
• Create two highly attractive but dissimilar
businesses
Key Objectives
1. The Company remains in the initial phase of planning its proposed spinoff or other separation transaction. As such, there are considerations, approvals and conditions that will determine the
ultimate timing and structure of this transaction, including regulatory approvals, final approval by the Company’s board of d irectors, any shareholder vote requirements that may be applicable,
compliance with U.S. and Canadian securities laws and stock exchange rules, receipt of any applicable opinions and/or rulings with respect to the Canadian and U.S. federal income tax
treatment of such transaction and determination of the pro forma capitalizations of the two separate companies. The failure to satisfy all of the required conditions could delay the completion
of this transaction for a significant period of time or prevent it from occurring at all. As a result, the information in this presentation relating to this proposed spinoff or other separation
transaction is preliminary and may change as the transaction progresses and any such change may be material. Please see Slide 1 – Forward Looking Statements.
Internal Organizational Design / Structure
to be completed by end of 3Q21
Capitalization Structure
timing to be determined
Dis-Synergies
~$150M
~60% allocated to Bausch + Lomb and
~40% allocated to BHC
Bausch + Lomb
Leverage
Targeting ~4x at time
of spin
BHC Leverage
Targeting ~5.5x at
time of spin
Internal Organizational Design / Structureto be completed by end of 3Q21
Finalize product segmentation 4Q20
Carve out Bausch + Lomb and
segmentation reporting 1Q21
Establish legal operating model 1Q21
Announce leadership teams 1Q21
Separation of corporate functions and IT
systems3Q21
Carve out financials/SEC filing
preparation3Q21
Capitalization Structure
Finalize capitalization structures To be determined
Actively pursuing all opportunities to
expedite leverage improvement
27
28
Appendix

29
Three Months EndedFavorable
(Unfavorable)
9.30.20 6.30.20 Reported
Bausch + Lomb/International $1,169M $883M 32%
Global Vision Care Revenue $214M $135M 59%
Global Surgical Revenue $151M $90M 68%
Global Consumer Revenue $374M $321M 17%
Global Ophtho Rx Revenue $136M $97M 40%
International Rx Revenue $294M $240M 23%
Salix $496M $404M 23%
Ortho Dermatologics $144M $116M 24%
Ortho Dermatologics $71M $74M (4%)
Global Solta $73M $42M 74%
Diversified Products $329M $261M 26%
Neuro & Other Revenue $199M $153M 30%
Generics Revenue $111M $100M 11%
Dentistry Revenue $19M $8M 138%
Total Company $2,138M $1,664M 28%
3Q20 Revenue Results: Sequential Recovery Underway
FX was not significant on a sequential basis
30
Three Months EndedFavorable
(Unfavorable)
9.30.20 6.30.20 Reported
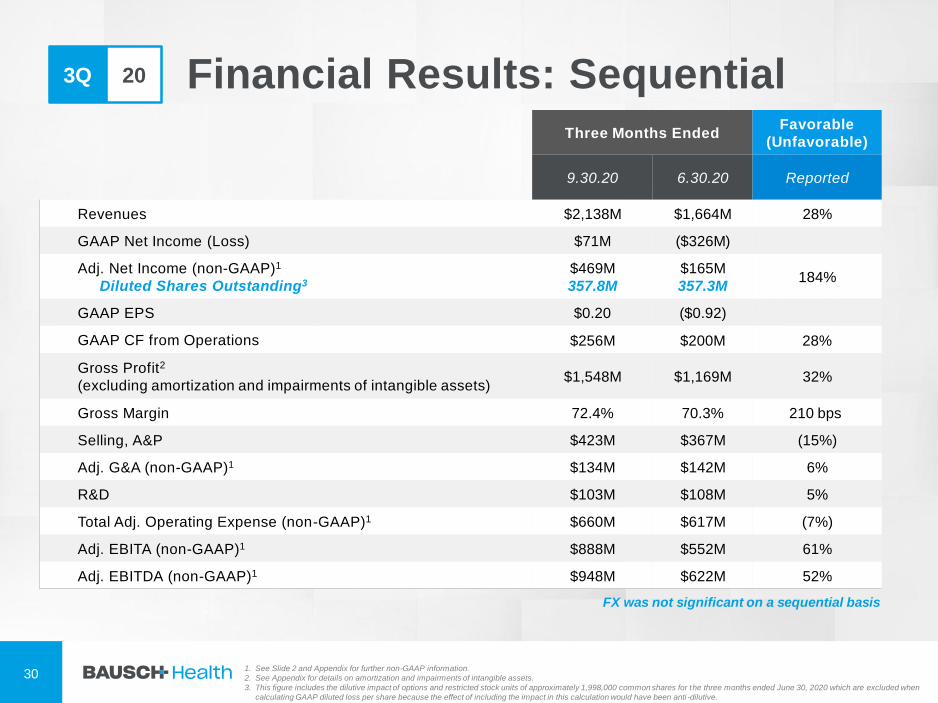
Revenues $2,138M $1,664M 28%
GAAP Net Income (Loss) $71M ($326M)
Adj. Net Income (non-GAAP)1
Diluted Shares Outstanding3
$469M
357.8M
$165M
357.3M184%
GAAP EPS $0.20 ($0.92)
GAAP CF from Operations $256M $200M 28%
Gross Profit2
(excluding amortization and impairments of intangible assets)$1,548M $1,169M 32%
Gross Margin 72.4% 70.3% 210 bps
Selling, A&P $423M $367M (15%)
Adj. G&A (non-GAAP)1 $134M $142M 6%
R&D $103M $108M 5%
Total Adj. Operating Expense (non-GAAP)1 $660M $617M (7%)
Adj. EBITA (non-GAAP)1 $888M $552M 61%
Adj. EBITDA (non-GAAP)1 $948M $622M 52%
3Q 20 Financial Results: Sequential
1. See Slide 2 and Appendix for further non-GAAP information.
2. See Appendix for details on amortization and impairments of intangible assets.
3. This figure includes the dilutive impact of options and restricted stock units of approximately 1,998,000 common shares for the three months ended June 30, 2020 which are excluded when
calculating GAAP diluted loss per share because the effect of including the impact in this calculation would have been anti -dilutive.
FX was not significant on a sequential basis

3-year CAGR1,2 (2019-2022)Constant currency and from the original mid-point of 2019 guidance3
31
Midpoint Original
2019 GuidanceFX Nov. 2020
vs. Feb. 2019At Nov. 2020
FX Rates
$8,400M ($75M) $8,325M
Expect revenue to grow at a 3%-5% CAGR1
1. Compound Annual Growth Rate.
2. Excludes the impact of the previously announced separation of the eye health business, including one-time costs, duplicative costs, and dis-synergies associated with such separation.
3. Based on Guidance issued in Feb. 2019.
4. See Slide 2 and Appendix for further non-GAAP information.
Expect adj. EBITDA (non-GAAP)4 to grow at a 4%-7% CAGR1
$9,095M to $9,635M
2022 Projection Based on
CAGR1 of 3-5%
Midpoint Original
2019 GuidanceFX Nov. 2020
vs. Feb. 2019At Nov. 2020
FX Rates
$3,425M ($60M) $3,365M$3,785M to $4,120M
2022 Projection Based on
CAGR1 of 4-7%

1. See slide 1 for further information on forward-looking statements.
2. Investigational device exemption.
3. Exclusive licensing agreement with Clearside Biomedical, Inc.
4. Exclusive licensing agreement with Novaliq GmbH.
5. Sphingosine 1-phosphate.
6. Exclusive licensing agreement with Mitsubishi Tanabe Pharma.
32
7. Overt hepatic encephalopathy.
8. Small intestinal bacterial overgrowth.
9. Study being run by partner, Alfasigma S.p.A.
10. Exclusive licensing agreement with Eyenovia, Inc.
11.Exclusive licensing agreement with BHVI.
12.Agreement to acquire all ophthalmology assets of Allegro.
13.Provisional name. Luminate® is a registered trademark of Allegro Ophthalmics.
Pipeline and Portfolio Expansion: Late Stage Development1
• SiHy Daily – Launched in Japan and U.S.; Launch in Australia, Hong Kong
and Canada planned during 4Q20
• LUMIFY® Line Extensions – Phase 3 clinical studies expected to start in 1H21
• Next Generation enVista® Optic Design Intraocular Lens - Anticipated
submission in U.S. and Europe in 2021
• enVista® Trifocal (Intraocular Lens) – Initiated IDE2 study in May 2018; Phase 2
initiated in Oct 2019
• Preloaded intraocular lens injector platform for enVista interocular lens –
Launching now in U.S. and Europe
• New Ophthalmic Viscosurgical Device – Filing of premarket approval
application for dispersive OVD completed April 2020
• XIPERE™3 (investigational treatment for macular edema associated with uveitis)
– Working closely with partner to resubmit NDA to FDA
• Alaway® Preservative-Free (EM-100) (OTC preservative-free eye drop for the
treatment of ocular itching associated with allergic conjunctivitis) – Launch
planned in Spring 2021
• NOV034 (dry eye disease associated with meibomian gland dysfunction) –
Expect to initiate additional Phase 3 study in 2H20
• Microdose formulation of atropine ophthalmic solution (reduction of pediatric
myopia progression in children ages 3-1210 – Phase 3 trial ongoing
• Myopia control contact lens design11 licensed from BHVI
• Risuteganib (Luminate®)13 (investigational compound in retina, which is believed
to simultaneously act on the angiogenic, inflammatory and mitochondrial
metabolic pathways implicated in diseases such as intermediate dry AMD) -
Topline results of Phase 2 intermediate dry AMD clinical trial, met its
primary endpoint; Phase 3 testing is in the planning stages12
• Amiselimod S1P5 Modulator6 – Completed the thorough QT study
which evaluated the cardiac safety profile; topline results were
positive and expect to initiate Phase 2 study in 1H21
• Rifaximin (OHE7) – Topline data from our Phase 2 study for the
treatment of OHE with a new formulation of rifaximin showed a
treatment benefit; The topline results of this study will help inform
further research on potential new indications for rifaximin using this
new formulation. The first application is anticipated to be in sickle
cell anemia, with clinical trials expected to commence in 2021.
• Rifaximin (SIBO8) – Phase 2 trial preparations underway
• Rifaximin (Crohn’s) – Phase 2/3 study expected to start in 3Q219
• ENVIVE™ (Probiotic) – Launched with a targeted group of
gastroenterologists; Widely available in 1Q21
• IDP-120 (Acne) – Phase 3 completed and met primary endpoints;
NDA planned for 2021
• ARAZLO® (formerly IDP-123 - Acne) – Launched June 2020
• IDP-124 (Atopic Dermatitis) – Phase 3 clinical studies have been
completed with one of the two studies meeting the primary
endpoint; currently evaluating next steps for this program
• IDP-126 (Acne Combination) – Phase 3 trial ongoing

1. Anticipated date of loss of exclusivity is based on the Company’s current best estimate and actual date of LOE, as the case m ay be, may occur earlier or later. Changes from prior
forecast are noted in red.
33
Key Product LOE Q3 2020 Impact
Business UnitProduct Line with Actual or
Anticipated LOE Date1
LOE Rev/Profit
Q3 2019 Actual
LOE Rev/Profit
Q3 2020 Actual
Change
Q3 2019 vs. Q3 2020
Revenue Profit Revenue Profit Revenue Profit
Ophtho Rx• Lotemax Suspension® 2Q19
• Lotemax Gel® 2021 (not date certain)$19M $19M $8M $8M ($11M) ($11M)
Int’l
• Glumetza® 1Q17
• Tiazac® XC 2H 2021 (not date certain)
• Lodalis 1H 2021 (not date certain)
$12M $10M $15M $12M $3M $2M
BAUSCH + LOMB/INTERNATIONAL $31M $29M $23M $20M ($8M) ($9M)
SALIX
• Zegerid® add’t US Gx 2017
• Uceris® 3Q18
• Apriso® 4Q19
• Moviprep® 3Q20
$50M $39M $25M $19M ($25M) ($20M)
ORTHO
DERMATOLOGICS
• Solodyn® 1Q18/19
• Acanya® 3Q18
• Elidel® 4Q18
• Zovirax® (Cream) 1Q19
$14M $13M ($1M) ($3M) ($15M) ($16M)
DIVERSIFIED
PRODUCTS
• Xenazine® Gx and brand competition 2Q17
• Isuprel® 3Q17
• Syprine® 1Q18
• Mephyton® 2Q18
• Cuprimine® 2Q19
• Migranal Franchise 2Q20
$43M $37M $20M $17M ($23M) ($20M)
OVERALL COMPANY $138M $118M $67M $53M ($71M) ($65M)

1. Anticipated date of loss of exclusivity is based on the Company’s current best estimate and actual date of LOE, as the case m ay be, may occur earlier or later. Changes
from prior forecast are noted in red.
34
Key Product LOE 2020 Impact
Business UnitProduct Line with Actual or
Anticipated LOE Date1
LOE Rev/Profit
Prior Forecast
LOE Rev/Profit
Latest Forecast
Change
Prior vs Latest Forecast
Revenue Profit Revenue Profit Revenue Profit
Ophtho Rx• Lotemax Suspension® 2Q19
• Lotemax Gel® 2021 (not date certain)$26M $25M $26M $25M $0M $0M
Int’l
• Glumetza® 1Q17
• Tiazac® XC 2H 2021 (not date certain)
• Lodalis 1H 2021 (not date certain)
$47M $37M $50M $39M $3M $2M
BAUSCH + LOMB/INTERNATIONAL $73M $62M $76M $64M $3M $2M
SALIX
• Zegerid® add’t US Gx 2017
• Uceris® 3Q18
• Apriso® 4Q19
• Moviprep® 3Q20
$66M $49M $74M $55M $8M $6M
ORTHO
DERMATOLOGICS
• Solodyn® 1Q18/19
• Acanya® 3Q18
• Elidel® 4Q18
• Zovirax® (Cream) 1Q19
$25M $22M $15M $10M ($10M) ($12M)
DIVERSIFIED
PRODUCTS
• Xenazine® Gx and brand competition 2Q17
• Isuprel® 3Q17
• Syprine® 1Q18
• Mephyton® 2Q18
• Cuprimine® 2Q19
• Migranal Franchise 2Q20
$119M $109M $96M $86M ($23M) ($23M)
OVERALL COMPANY $283M $242M $261M $215M ($22M) ($27M)
1. Anticipated date of loss of exclusivity is based on the Company’s current best estimate and actual date of LOE, as the case m ay be, may occur earlier or later. Changes
from prior forecast are noted in red.
35
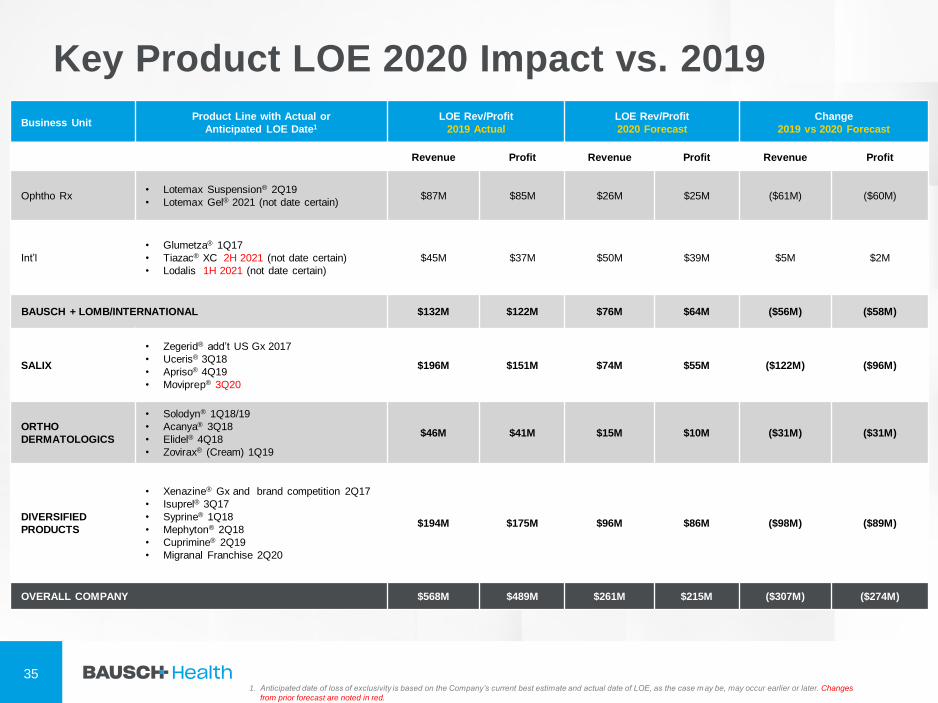
Key Product LOE 2020 Impact vs. 2019
Business UnitProduct Line with Actual or
Anticipated LOE Date1
LOE Rev/Profit
2019 Actual
LOE Rev/Profit
2020 Forecast
Change
2019 vs 2020 Forecast
Revenue Profit Revenue Profit Revenue Profit
Ophtho Rx• Lotemax Suspension® 2Q19
• Lotemax Gel® 2021 (not date certain)$87M $85M $26M $25M ($61M) ($60M)
Int’l
• Glumetza® 1Q17
• Tiazac® XC 2H 2021 (not date certain)
• Lodalis 1H 2021 (not date certain)
$45M $37M $50M $39M $5M $2M
BAUSCH + LOMB/INTERNATIONAL $132M $122M $76M $64M ($56M) ($58M)
SALIX
• Zegerid® add’t US Gx 2017
• Uceris® 3Q18
• Apriso® 4Q19
• Moviprep® 3Q20
$196M $151M $74M $55M ($122M) ($96M)
ORTHO
DERMATOLOGICS
• Solodyn® 1Q18/19
• Acanya® 3Q18
• Elidel® 4Q18
• Zovirax® (Cream) 1Q19
$46M $41M $15M $10M ($31M) ($31M)
DIVERSIFIED
PRODUCTS
• Xenazine® Gx and brand competition 2Q17
• Isuprel® 3Q17
• Syprine® 1Q18
• Mephyton® 2Q18
• Cuprimine® 2Q19
• Migranal Franchise 2Q20
$194M $175M $96M $86M ($98M) ($89M)
OVERALL COMPANY $568M $489M $261M $215M ($307M) ($274M)

36
Selected U.S. Businesses Pipeline Inventory Trending
(3Q20)1
Months on Hand
Business
Units
As of
Jun 30,
2019
As of
Sep 30,
2019
Change
3Q19
As of
Jun 30,
2020
As of
Sep 30,
2020
Change
3Q20
Derm 1.37 1.13 (0.24) 0.82 0.97 0.15
Neuro 1.11 1.01 (0.10) 0.80 1.10 0.30
Ophtho 0.79 0.81 0.02 0.59 0.85 0.26
GI 0.94 0.86 (0.08) 0.81 0.79 (0.02)
1. U.S. wholesale inventory.

37
Selected U.S. Businesses Pipeline Inventory Trending
(Year-to-Date)1
Months on Hand
Business
Units
As of
Dec 31,
2018
As of
Sep 30,
2019
Change
YTD19
As of
Dec 31,
2019
As of
Sep 30,
2020
Change
YTD20
Derm 1.26 1.13 (0.13) 0.88 0.97 0.09
Neuro 1.08 1.01 (0.07) 0.83 1.10 0.27
Ophtho 0.89 0.81 (0.08) 0.71 0.85 0.14
GI 0.99 0.86 (0.13) 0.79 0.79 0.00
1. U.S. wholesale inventory.
38
1. See Slide 2 and Appendix for further non-GAAP information.
2. See Appendix for further information on the use and calculation of constant currency.
3. Organic growth/change, a non-GAAP metric, is defined as a change on a period-over-period basis in revenues on a constant currency basis (if applicable) excluding the impact of
acquisitions, divestitures and discontinuations.
4. See the Appendix for details on amortization and impairments of intangible assets.
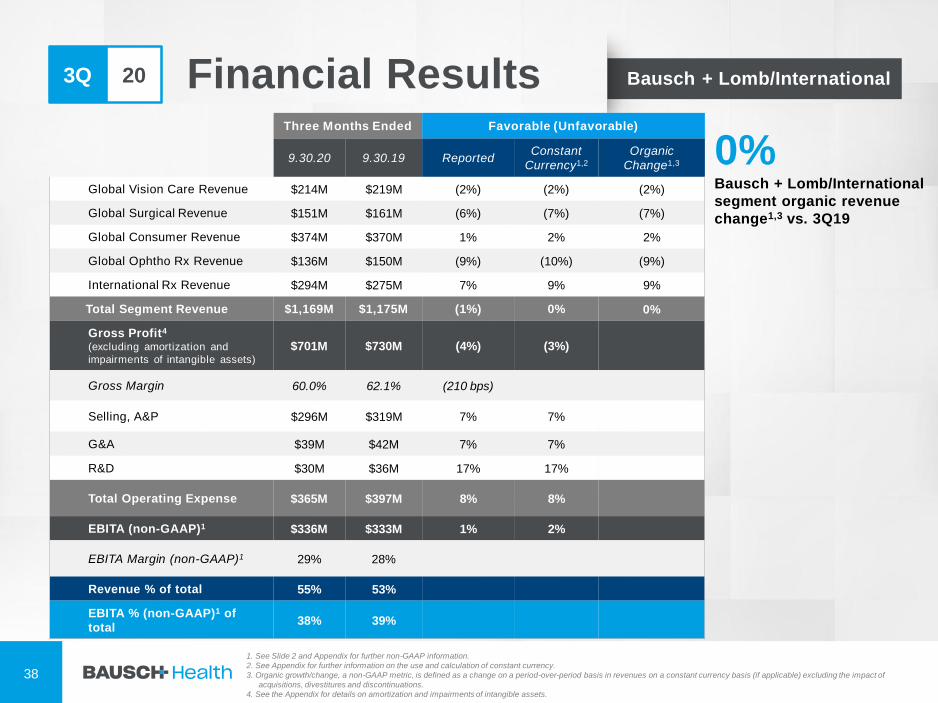
3Q 20 Financial ResultsThree Months Ended Favorable (Unfavorable)
9.30.20 9.30.19 ReportedConstant
Currency1,2
Organic
Change1,3
Global Vision Care Revenue $214M $219M (2%) (2%) (2%)
Global Surgical Revenue $151M $161M (6%) (7%) (7%)
Global Consumer Revenue $374M $370M 1% 2% 2%
Global Ophtho Rx Revenue $136M $150M (9%) (10%) (9%)
International Rx Revenue $294M $275M 7% 9% 9%
Total Segment Revenue $1,169M $1,175M (1%) 0% 0%
Gross Profit4
(excluding amortization and
impairments of intangible assets)
$701M $730M (4%) (3%)
Gross Margin 60.0% 62.1% (210 bps)
Selling, A&P $296M $319M 7% 7%
G&A $39M $42M 7% 7%
R&D $30M $36M 17% 17%
Total Operating Expense $365M $397M 8% 8%
EBITA (non-GAAP)1 $336M $333M 1% 2%
EBITA Margin (non-GAAP)1 29% 28%
Revenue % of total 55% 53%
EBITA % (non-GAAP)1 of
total38% 39%
0%Bausch + Lomb/International
segment organic revenue
change1,3 vs. 3Q19
Bausch + Lomb/International

39
1. See Slide 2 and Appendix for further non-GAAP information.
2. See Appendix for further information on the use and calculation of constant currency.
3. Organic growth/change, a non-GAAP metric, is defined as a change on a period-over-period basis in revenues on a constant currency basis (if applicable) excluding the impact of
acquisitions, divestitures and discontinuations.
4. See the Appendix for details on amortization and impairments of intangible assets.
3Q 20 Financial ResultsThree Months Ended Favorable (Unfavorable)
9.30.20 9.30.19 ReportedConstant
Currency1,2
Organic
Change1,3
Salix Revenue $496M $551M (10%) (10%) (10%)
Total Segment Revenue $496M $551M (10%) (10%) (10%)
Gross Profit4
(excluding amortization and
impairments of intangible assets)
$448M $489M (8%) (8%)
Gross Margin 90.3% 88.7% 160 bps
Selling, A&P $68M $85M 20% 20%
G&A $14M $22M 36% 36%
R&D $6M $7M 14% 14%
Total Operating Expense $88M $114M 23% 23%
EBITA (non-GAAP)1 $360M $375M (4%) (4%)
EBITA Margin (non-GAAP)1 73% 68%
Revenue % of total 23% 25%
EBITA % (non-GAAP)1 of
total41% 43%
(10%)Salix segment organic
revenue decline1,3 vs. 3Q19; in
3Q20, Salix had an LOE
revenue drag of ~$25M,
primarily due to APRISO®
Salix

40
1. See Slide 2 and Appendix for further non-GAAP information.
2. See Appendix for further information on the use and calculation of constant currency.
3. Organic growth/change, a non-GAAP metric, is defined as a change on a period-over-period basis in revenues on a constant currency basis (if applicable) excluding the impact of
acquisitions, divestitures and discontinuations.
4. See the Appendix for details on amortization and impairments of intangible assets.
3Q 20 Financial ResultsThree Months Ended Favorable (Unfavorable)
9.30.20 9.30.19 ReportedConstant
Currency1,2
Organic
Change1,3
Ortho Dermatologics Revenue $71M $100M (29%) (29%) (29%)
Global Solta Revenue $73M $47M 55% 53% 53%
Total Segment Revenue $144M $147M (2%) (3%) (3%)
Gross Profit4
(excluding amortization and
impairments of intangible assets)
$117M $123M (5%) (5%)
Gross Margin 81.3% 83.7% (240 bps)
Selling, A&P $35M $49M 29% 29%
G&A $7M $7M 0% 0%
R&D $5M $9M 44% 44%
Total Operating Expense $47M $65M 28% 28%
EBITA (non-GAAP)1 $70M $58M 21% 19%
EBITA Margin (non-GAAP)1 49% 39%
Revenue % of total 7% 7%
EBITA % (non-GAAP)1 of total 8% 7%
Ortho Dermatologics
53%Global Solta organic revenue
increase1,3 vs. 3Q19

41
1. See Slide 2 and Appendix for further non-GAAP information.
2. See Appendix for further information on the use and calculation of constant currency.
3. Organic growth/change, a non-GAAP metric, is defined as a change on a period-over-period basis in revenues on a constant currency basis (if applicable) excluding the impact of
acquisitions, divestitures and discontinuations.
4. See the Appendix for details on amortization and impairments of intangible assets
5. U.S. sales only.
3Q 20 Financial ResultsThree Months Ended Favorable (Unfavorable)
9.30.20 9.30.19 ReportedConstant
Currency1,2
Organic
Change1,3
Neuro & Other Revenue $199M $186M 7% 7% 8%
Generics Revenue $111M $126M (12%) (12%) (12%)
Dentistry Revenue $19M $24M (21%) (21%) (21%)
Total Segment Revenue $329M $336M (2%) (2%) (2%)
Gross Profit4
(excluding amortization and
impairments of intangible assets)
$283M $284M 0% 0%
Gross Margin 86.0% 84.5% 150 bps
Selling, A&P $24M $26M 8% 8%
G&A $9M $7M (29%) (29%)
R&D $2M $5M 60% 60%
Total Operating Expense $35M $38M 8% 8%
EBITA (non-GAAP)1 $248M $246M 1% 1%
EBITA Margin (non-GAAP)1 75% 73%
Revenue % of total 15% 15%
EBITA % (non-GAAP)1 of
total28% 29%
Diversified Products
+24%WELLBUTRIN®5/APLENZIN®
combined reported revenue
growth vs. 3Q19; driven by
WELLBUTRIN®, which saw
27% reported revenue
growth vs. 3Q19

42
Nine Months Ended Favorable (Unfavorable)
9.30.20 9.30.19 ReportedConstant
Currency1,2
Organic
Change1,3
Revenues $5,814M $6,377M (9%) (8%) (8%)
GAAP Net Loss ($407M) ($272M)
Adj. Net Income (non-GAAP)1
Diluted Shares Outstanding5
$950M
357.9M
$1,155M
356.5M(18%) (13%)
GAAP EPS ($1.15) ($0.77)
GAAP CF from Operations $717M $1,267M (43%)
Adj. Gross Profit (non-GAAP)1,4,6
(excluding amortization and impairments of
intangible assets)
$4,210M $4,667M (10%) (9%)
Adj. Gross Margin (non-GAAP)1,6 72.4% 73.2% (80 bps)
Selling, A&P $1,259M $1,430M 12% 11%
Adj. G&A (non-GAAP)1 $424M $421M (1%) (1%)
R&D $333M $357M 7% 6%
Total Adj. Operating Expense (non-GAAP)1 $2,016M $2,208M 9% 8%
Adj. EBITA (non-GAAP)1 $2,194M $2,459M (11%) (10%)
Adj. EBITDA (non-GAAP)1 $2,383M $2,673M (11%) (9%)
YTD 20 Financial Results
1. See Slide 2 and Appendix for further non-GAAP information.
2. See Appendix for further information on the use and calculation of constant currency.
3. Organic growth/change, a non-GAAP metric, is defined as a change on a period-over-period basis in revenues on a constant currency basis (if applicable) excluding the impact of acquisitions,
divestitures and discontinuations.
4. See Appendix for details on amortization and impairments of intangible assets.
5. This figure includes the dilutive impact of options and restricted stock units of approximately 3,144,000 and 4,589,000 common shares for the nine months ended September 30, 2020 and 2019,
respectively, which are excluded when calculating GAAP diluted loss per share because the effect of including the impact in those calculations would have been anti-dilutive.
6. 2020 numbers are on an as reported basis, no adjustments reflected in 2020.

43
1. See Slide 2 and Appendix for further non-GAAP information.
2. See Appendix for further information on the use and calculation of constant currency.
3. Organic growth/change, a non-GAAP metric, is defined as a change on a period-over-period basis in revenues on a constant currency basis (if applicable) excluding the impact of
acquisitions, divestitures and discontinuations.
4. See the Appendix for details on amortization and impairments of intangible assets.
YTD 20 Financial ResultsNine Months Ended Favorable (Unfavorable)
9.30.20 9.30.19 ReportedConstant
Currency1,2
Organic
Change1,3
Global Vision Care Revenue $542M $638M (15%) (14%) (14%)
Global Surgical Revenue $394M $505M (22%) (21%) (21%)
Global Consumer Revenue $1,048M $1,065M (2%) 0% 1%
Global Ophtho Rx Revenue $365M $483M (24%) (24%) (23%)
International Rx Revenue $817M $810M 1% 3% 4%
Total Segment Revenue $3,166M $3,501M (10%) (8%) (8%)
Gross Profit4
(excluding amortization and
impairments of intangible assets)
$1,906M $2,185M (13%) (11%)
Gross Margin 60.2% 62.4% (220 bps)
Selling, A&P $866M $970M 11% 9%
G&A $122M $129M 5% 4%
R&D $88M $97M 9% 8%
Total Operating Expense $1,076M $1,196M 10% 9%
EBITA (non-GAAP)1 $830M $989M (16%) (14%)
EBITA Margin (non-GAAP)1 26% 28%
Revenue % of total 54% 55%
EBITA % (non-GAAP)1 of
total38% 40%
(8%)Bausch + Lomb/International
segment organic revenue
decline1,3 vs. YTD19
Bausch + Lomb/International

44
1. See Slide 2 and Appendix for further non-GAAP information.
2. See Appendix for further information on the use and calculation of constant currency.
3. Organic growth/change, a non-GAAP metric, is defined as a change on a period-over-period basis in revenues on a constant currency basis (if applicable) excluding the impact of
acquisitions, divestitures and discontinuations.
4. See the Appendix for details on amortization and impairments of intangible assets.
5. 2020 numbers are on an as reported basis, no adjustments reflected in 2020.
YTD 20 Financial ResultsNine Months Ended Favorable (Unfavorable)
9.30.20 9.30.19 ReportedConstant
Currency1,2
Organic
Change1,3
Salix Revenue $1,377M $1,505M (9%) (9%) (9%)
Total Segment Revenue $1,377M $1,505M (9%) (9%) (9%)
Adj. Gross Profit (non-
GAAP)1,4,5
(excluding amortization and
impairments of intangible assets)
$1,236M $1,309M (6%) (6%)
Adj. Gross Margin (non-
GAAP)1,5 89.8% 87.0% 280 bps
Selling, A&P $201M $243M 17% 17%
G&A $43M $46M 7% 7%
R&D $24M $20M (20%) (20%)
Total Operating Expense $268M $309M 13% 13%
Adj. EBITA (non-GAAP)1,5 $968M $1,000M (3%) (3%)
Adj. EBITA Margin (non-
GAAP)1,5 70% 66%
Revenue % of total 24% 24%
Adj. EBITA % (non-GAAP)1,5
of total44% 41%
(9%)Salix segment organic
revenue decline1,3 vs. YTD19,
partially offset by XIFAXAN®
which reported 1% revenue
growth; in YTD20, Salix had
an LOE revenue drag of
~$103M, primarily due to
APRISO®
Salix

45
1. See Slide 2 and Appendix for further non-GAAP information.
2. See Appendix for further information on the use and calculation of constant currency.
3. Organic growth/change, a non-GAAP metric, is defined as a change on a period-over-period basis in revenues on a constant currency basis (if applicable) excluding the impact of
acquisitions, divestitures and discontinuations.
4. See the Appendix for details on amortization and impairments of intangible assets.
YTD 20 Financial ResultsNine Months Ended Favorable (Unfavorable)
9.30.20 9.30.19 ReportedConstant
Currency1,2
Organic
Change1,3
Ortho Dermatologics Revenue $227M $277M (18%) (18%) (18%)
Global Solta Revenue $166M $130M 28% 28% 28%
Total Segment Revenue $393M $407M (3%) (3%) (3%)
Gross Profit4
(excluding amortization and
impairments of intangible assets)
$321M $346M (7%) (7%)
Gross Margin 81.7% 85.0% (330 bps)
Selling, A&P $119M $141M 16% 16%
G&A $24M $20M (20%) (20%)
R&D $22M $29M 24% 24%
Total Operating Expense $165M $190M 13% 13%
EBITA (non-GAAP)1 $156M $156M 0% 0%
EBITA Margin (non-GAAP)1 40% 38%
Revenue % of total 7% 6%
EBITA % (non-GAAP)1 of total 7% 6%
Ortho Dermatologics
+28%Global Solta organic revenue
growth1,3 vs. YTD19, driven
by continued strong demand
of Thermage® FLX
YTD20, Ortho Dermatologics
business unit had an LOE
revenue drag of ~$28M; LOE
was primarily ELIDEL® and
ZOVIRAX®

46
1. See Slide 2 and Appendix for further non-GAAP information.
2. See Appendix for further information on the use and calculation of constant currency.
3. Organic growth/change, a non-GAAP metric, is defined as a change on a period-over-period basis in revenues on a constant currency basis (if applicable) excluding the impact of
acquisitions, divestitures and discontinuations.
4. See the Appendix for details on amortization and impairments of intangible assets
5. U.S. sales only.
YTD 20 Financial ResultsNine Months Ended Favorable (Unfavorable)
9.30.20 9.30.19 ReportedConstant
Currency1,2
Organic
Change1,3
Neuro & Other Revenue $514M $547M (6%) (6%) (6%)
Generics Revenue $316M $342M (8%) (8%) (8%)
Dentistry Revenue $48M $75M (36%) (36%) (36%)
Total Segment Revenue $878M $964M (9%) (9%) (9%)
Gross Profit4
(excluding amortization and
impairments of intangible assets)
$747M $827M (10%) (10%)
Gross Margin 85.1% 85.8% (70 bps)
Selling, A&P $73M $77M 5% 5%
G&A $34M $24M (42%) (42%)
R&D $6M $12M 50% 50%
Total Operating Expense $113M $113M 0% 0%
EBITA (non-GAAP)1 $634M $714M (11%) (11%)
EBITA Margin (non-GAAP)1 72% 74%
Revenue % of total 15% 15%
EBITA % (non-GAAP)1 of
total29% 29%
Diversified Products
+15%WELLBUTRIN®5/APLENZIN®
combined reported revenue
growth vs. YTD19; driven by
APLENZIN®, which saw 27%
reported revenue growth vs.
YTD19

47
Three Months Ended Favorable (Unfavorable)
Sept. 30, 2020 Sept 30, 2019 ReportedConstant
Currency1,2
Cash Interest Expense $361M $392M 8% 8%
Net Interest Expense $372M $404M 8% 8%
Non-cash adjustments
Depreciation $45M $45M 0% 0%
Non-cash share-based Comp $27M $26M (4%) (4%)
Additional cash items
Contingent Consideration $6M $7M
Milestones/License Agreements and
Other Intangibles$13M $1M
Restructuring and Other $59M $6M
Capital Expenditures $81M $83M
Adj. Tax Rate1 7.0% 9.1%
Other Financial Information (Quarter-to-Date)
1. See Slide 2 and this Appendix for further non-GAAP information.
2. See this Appendix for further information on the use and calculation of constant currency.

48
Nine Months Ended Favorable (Unfavorable)
Sept. 30, 2020 Sept. 30, 2019 ReportedConstant
Currency1,2
Cash Interest Expense $1,110M $1,175M 6% 5%
Net Interest Expense $1,144M $1,212M 6% 6%
Non-cash adjustments
Depreciation $134M $131M (2%) (3%)
Non-cash share-based Comp $81M $77M (5%) (5%)
Additional cash items
Contingent Consideration $30M $28M
Milestones/License Agreements and
Other Intangibles$51M $10M
Restructuring and Other $115M $38M
Capital Expenditures $222M $192M
Adj. Tax Rate1 7.25% 7.8%
Other Financial Information (Year-to-Date)
1. See Slide 2 and this Appendix for further non-GAAP information.
2. See this Appendix for further information on the use and calculation of constant currency.

49
3Q 20 Top 10 Products – Total BAUSCH Health1
Top 10 products/franchises revenues and trailing five quarters
Rank Product/Franchises 3Q20 2Q20 1Q20 4Q19 3Q19
1 XIFAXAN® $381M $315M $375M $396M $394M
2 Ocuvite® + PreserVision® $83M $78M $72M $86M $79M
3 WELLBUTRIN®1 $83M $66M $62M $64M $69M
4 SofLens® $63M $47M $58M $70M $72M
5 Thermage® $62M $37M $41M $48M $35M
6 Biotrue® ONEday $51M $25M $47M $40M $50M
7 renu® $45M $37M $42M $62M $54M
8 Bausch + Lomb ULTRA® $44M $21M $40M $35M $35M
9Biotrue® Multi-Purpose
Solution$34M $28M $34M $37M $33M
10 JUBLIA® $33M $25M $30M $30M $34M
1. Global sales.

50
3Q 20 Top 10 Products – B+L/International
Top 10 products/franchises revenues and trailing five quarters
Rank Product/Franchises 3Q20 2Q20 1Q20 4Q19 3Q19
1 Ocuvite® + PreserVision® $83M $78M $72M $86M $79M
2 SofLens® $63M $47M $58M $70M $72M
3 Biotrue® ONEday $51M $25M $47M $40M $50M
4 renu® $45M $37M $42M $62M $54M
5 Bausch + Lomb ULTRA® $44M $21M $40M $35M $35M
6Biotrue® Multi-Purpose
Solution$34M $28M $34M $37M $33M
7 PureVision® $24M $18M $24M $26M $28M
8 ARTELAC® $23M $23M $22M $24M $24M
9 Lotemax® $22M $12M $20M $27M $31M
10 Soothe® $21M $5M $5M $5M $5M

51
3Q 20 Top 10 Products – Salix1
Top 10 products/franchises revenues and trailing five quarters
Rank Product/Franchises 3Q20 2Q20 1Q20 4Q19 3Q19
1 XIFAXAN® $381M $315M $375M $396M $394M
2 RELISTOR® $28M $26M $31M $27M $33M
3 TRULANCE® $22M $17M $19M $18M $14M
4 GLUMETZA® $20M $17M $21M $24M $41M
5 APRISO® $14M $11M $7M $25M $40M
6 UCERIS® $7M $4M $6M $7M $7M
7 ZEGERID® $5M $3M $4M $4M $3M
8 PLENVU® $4M $1M $3M $4M $3M
9 CYCLOSET® $4M $3M $3M $3M $3M
10 AZASAN® $3M $3M $2M $2M $4M
1. U.S. sales only

52
3Q 20 Top 10 Products – Ortho Dermatologics
Top 10 products/franchises revenues and trailing five quarters
Rank Product/Franchises 3Q20 2Q20 1Q20 4Q19 3Q19
1 THERMAGE® $62M $37M $41M $48M $35M
2 JUBLIA®1 $21M $16M $19M $19M $22M
3 SILIQ® $11M $12M $7M $7M $8M
4 TARGRETIN® $8M $7M $7M $15M $11M
5 ONEXTON® $6M $4M $6M $5M $8M
6 VASER® $4M $2M $4M $5M $5M
7 CLEAR & BRILLIANT® $4M $1M $3M $6M $4M
8 RETIN-A MICRO®.06 & .08 $3M $4M $8M $7M $9M
9 CLINDAGEL® $3M $3M $5M $5M $5M
10 FRAXEL® $3M $1M $3M $4M $3M
1. U.S. sales only.

53
3Q 20 Top 10 Products – Diversified Products1
Top 10 products/franchises revenues and trailing five quarters
Rank Product/Franchises 3Q20 2Q20 1Q20 4Q19 3Q19
1 WELLBUTRIN® $81M $65M $58M $61M $64M
2 APLENZIN® $26M $23M $26M $24M $22M
3 ATIVAN® $22M $7M $8M $9M $9M
4 ARESTIN® $17M $6M $19M $23M $22M
5 NEO/POLY/HC OTIC® $15M $7M $9M $5M $5M
6 PEPCID® $11M $5M $3M $1M $0M
7TOBRAMYCIN/
DEXAMETHASONE$8M $11M $8M $8M $7M
8 DIASTAT® $8M $3M $11M $10M $12M
9 MYSOLINE® $8M $5M $5M $5M $4M
10 XENAZINE® $7M $8M $8M $9M $11M
1. U.S. only sales.
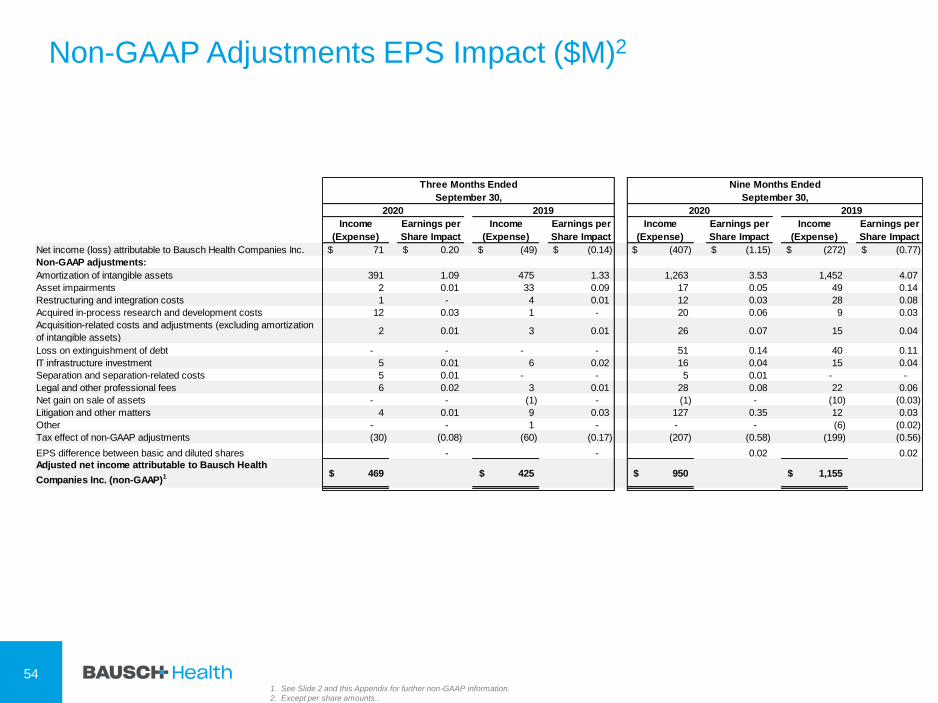
1. See Slide 2 and this Appendix for further non-GAAP information.
2. Except per share amounts..
Non-GAAP Adjustments EPS Impact ($M)2
54
Income
(Expense)
Earnings per
Share Impact
Income
(Expense)
Earnings per
Share Impact
Income
(Expense)
Earnings per
Share Impact
Income
(Expense)
Earnings per
Share Impact
Net income (loss) attributable to Bausch Health Companies Inc. 71$ 0.20$ (49)$ (0.14)$ (407)$ (1.15)$ (272)$ (0.77)$
Non-GAAP adjustments:
Amortization of intangible assets 391 1.09 475 1.33 1,263 3.53 1,452 4.07
Asset impairments 2 0.01 33 0.09 17 0.05 49 0.14
Restructuring and integration costs 1 - 4 0.01 12 0.03 28 0.08
Acquired in-process research and development costs 12 0.03 1 - 20 0.06 9 0.03
Acquisition-related costs and adjustments (excluding amortization
of intangible assets)2 0.01 3 0.01 26 0.07 15 0.04
Loss on extinguishment of debt - - - - 51 0.14 40 0.11
IT infrastructure investment 5 0.01 6 0.02 16 0.04 15 0.04
Separation and separation-related costs 5 0.01 - - 5 0.01 - -
Legal and other professional fees 6 0.02 3 0.01 28 0.08 22 0.06
Net gain on sale of assets - - (1) - (1) - (10) (0.03)
Litigation and other matters 4 0.01 9 0.03 127 0.35 12 0.03
Other - - 1 - - - (6) (0.02)
Tax effect of non-GAAP adjustments (30) (0.08) (60) (0.17) (207) (0.58) (199) (0.56)
EPS difference between basic and diluted shares - - 0.02 0.02
Adjusted net income attributable to Bausch Health
Companies Inc. (non-GAAP)1 469$ 425$ 950$ 1,155$
September 30,
2020 2019
Three Months Ended Nine Months Ended
September 30,
2020 2019

1. See Slide 2 and this Appendix for further non-GAAP information.
2. Except per share amounts.
Non-GAAP Adjustments EPS Impact ($M)2
Income
(Expense)
Earnings per
Share Impact
Net loss attributable to Bausch Health Companies Inc. (326)$ (0.92)$
Non-GAAP adjustments:
Amortization of intangible assets 436 1.22
Asset impairments 1 -
Restructuring and integration costs 7 0.02
Acquired in-process research and development costs 7 0.02
Acquisition-related costs and adjustments (excluding amortization of intangible assets) 11 0.03
Loss on extinguishment of debt 27 0.08
IT infrastructure investment 4 0.01
Legal and other professional fees 13 0.04
Litigation and other matters 100 0.28
Tax effect of non-GAAP adjustments (115) (0.32)
EPS difference between basic and diluted shares -
Adjusted net income attributable to Bausch Health Companies Inc. (non-GAAP)1165$
2020
Three Months Ended
June 30,
55

1. Products with sales outside the United States impacted by F/X changes.
2. See Slide 2 and this Appendix for further non-GAAP information.
3. See this Appendix for details on amortization and impairments of intangible assets.
56
Bausch + Lomb/Int’l Segment Trailing Five Quarters1
Bausch + Lomb/International 3Q20 2Q20 1Q20 4Q19 3Q19
Global Vision Care Revenue $214M $135M $193M $210M $219M
Global Surgical Revenue $151M $90M $153M $193M $161M
Global Consumer Revenue $374M $321M $353M $390M $370M
Global Ophtho Rx Revenue $136M $97M $132M $155M $150M
International Rx Revenue $294M $240M $283M $290M $275M
Segment Revenue $1,169M $883M $1,114M $1,238M $1,175M
Segment Gross Profit3
(excluding amortization and
impairments of intangible assets)
$701M $495M $710M $741M $730M
Segment Gross Margin 60.0% 56.1% 63.7% 59.9% 62.1%
Segment R&D $30M $28M $30M $29M $36M
Segment SG&A $335M $298M $355M $369M $361M
Segment Profit/EBITA (non-
GAAP)2 $336M $169M $325M $343M $333M

57
Salix Segment Trailing Five Quarters
Salix 3Q20 2Q20 1Q20 4Q19 3Q19
Salix Revenue $496M $404M $477M $517M $551M
Segment Revenue $496M $404M $477M $517M $551M
Segment Gross Profit2
(excluding amortization and
impairments of intangible assets)
$448M $364M $424M $458M $489M
Segment Gross Margin 90.3% 90.1% 88.9% 88.6% 88.7%
Segment R&D $6M $6M $12M $16M $7M
Segment SG&A $82M $69M $93M $88M $107M
Segment Profit/EBITA (non-
GAAP)1 $360M $289M $319M $354M $375M
1. See Slide 2 and this Appendix for further non-GAAP information.
2. See this Appendix for details on amortization and impairments of intangible assets

58
Ortho Dermatologics Segment Trailing Five Quarters1
Ortho Dermatologics 3Q20 2Q20 1Q20 4Q19 3Q19
Ortho Dermatologics Revenue $71M $74M $82M $94M $100M
Global Solta Revenue1 $73M $42M $51M $64M $47M
Segment Revenue $144M $116M $133M $158M $147M
Segment Gross Profit3
(excluding amortization and
impairments of intangible assets)
$117M $91M $113M $132M $123M
Segment Gross Margin 81.3% 78.4% 85.0% 83.5% 83.7%
Segment R&D $5M $8M $9M $9M $9M
Segment SG&A $42M $45M $56M $57M $56M
Segment Profit/EBITA (non-
GAAP)2 $70M $38M $48M $66M $58M
1. Products with sales outside the United States impacted by F/X changes.
2. See Slide 2 and this Appendix for further non-GAAP information.
3. See this Appendix for details on amortization and impairments of intangible assets.

59
Diversified Products Segment Trailing Five Quarters
Diversified Products 3Q20 2Q20 1Q20 4Q19 3Q19
Neuro & Other Revenue $199M $153M $162M $168M $186M
Generics Revenue $111M $100M $105M $117M $126M
Dentistry Revenue $19M $8M $21M $26M $24M
Segment Revenue $329M $261M $288M $311M $336M
Segment Gross Profit2
(excluding amortization and
impairments of intangible assets)
$283M $218M $246M $258M $284M
Segment Gross Margin 86.0% 83.5% 85.4% 83.0% 84.5%
Segment R&D $2M $2M $2M $1M $5M
Segment SG&A $33M $32M $42M $39M $33M
Segment Profit/EBITA (non-
GAAP)1 $248M $184M $202M $218M $246M
1. See Slide 2 and this Appendix for further non-GAAP information.
2. See this Appendix for details on amortization and impairments of intangible assets.

Reconciliation of Reported Operating Income to Adjusted EBITA
(non-GAAP)1 ($M) (Quarter-to-Date)
601. See Slide 2 and this Appendix for further non-GAAP information.
2. Excluding amortization impairments of intangible assets.
Gross
Profit2
Gross
Margin2
Selling &
Advertising
G&A and
Other
R&D
Expense
Operating
Expense
Operating
Income
Qtr 3 2020 GAAP $ 1,548 72.4% $ 423 $ 149 $ 103 $ 675 $ 460
Amortization of finite-lived intangibles 0.0% - 391
Asset Impairments 0.0% - 2
Restructuring and integration costs 0.0% - 1
Acquired in-process research and development costs 0.0% - 12
Acquisition-related costs and adjustments (excluding
amortization of intangible assets)0.0% - 2
IT infrastructure investment 0.0% (5) (5) 5
Separation and separation-related costs 0.0% (4) (4) 5
Legal and other professional fees 0.0% (6) (6) 6
Litigation and other matters 0.0% - 4
Qtr 3 2020 Non-GAAP1 1,548$ 72.4% 423$ 134$ 103$ 660$ 888$
Gross
Profit2
Gross
Margin2
Selling &
Advertising
G&A and
Other
R&D
Expense
Operating
Expense
Operating
Income
Qtr 3 2019 GAAP $ 1,625 73.6% $ 477 $ 171 $ 123 $ 771 $ 329
Amortization of finite-lived intangibles 0.0% - 475
Asset Impairments 0.0% - 33
Restructuring and integration costs 0.0% - 4
Acquired in-process research and development costs 0.0% - 1
Acquisition-related costs and adjustments (excluding
amortization of intangible assets)0.0% - 3
IT infrastructure investment 0.0% (6) (6) 6
Legal and other professional fees 0.0% (3) (3) 3
Net gain on sale of assets 0.0% - (1)
Litigation and other matters 0.0% - 9
Other non-GAAP charges 0.0% - 1
Qtr 3 2019 Non-GAAP1 1,625$ 73.6% 477$ 162$ 123$ 762$ 863$
Q3 2020
Q3 2019

Reconciliation of Reported Operating Income to Adjusted EBITA
(non-GAAP)1 ($M) (Year-to-Date)
611. See Slide 2 and this Appendix for further non-GAAP information.
2. Excluding amortization impairments of intangible assets.
Gross Profit2
Gross
Margin2
Selling &
Advertising
G&A and
Other
R&D
Expense
Operating
Expense
Operating
Income
YTD 2020 GAAP $ 4,210 72.4% $ 1,259 $ 472 $ 333 $ 2,064 $ 681
Amortization of finite-lived intangibles 0.0% - 1,263
Asset Impairments 0.0% - 17
Restructuring and integration costs 0.0% - 12
Acquired in-process research and development costs 0.0% - 20
Acquisition-related costs and adjustments (excluding
amortization of intangible assets)0.0% - 26
IT infrastructure investment 0.0% (16) (16) 16
Separation and separation-related costs (4) (4) 5
Legal and other professional fees 0.0% (28) (28) 28
Net gain on sale of assets 0.0% - (1)
Litigation and other matters 0.0% - 127
YTD 2020 Non-GAAP1 4,210$ 72.4% 1,259$ 424$ 333$ 2,016$ 2,194$
Gross Profit2
Gross
Margin2
Selling &
Advertising
G&A and
Other
R&D
Expense
Operating
Expense
Operating
Income
YTD 2019 GAAP $ 4,662 73.1% $ 1,430 $ 456 $ 357 $ 2,243 $ 873
Amortization of finite-lived intangibles 0.0% - 1,452
Asset Impairments 0.0% - 49
Restructuring and integration costs 0.0% - 28
Acquired in-process research and development costs 0.0% - 9
Acquisition-related costs and adjustments (excluding
amortization of intangible assets)5 0.1% - 15
IT infrastructure investment 0.0% (15) (15) 15
Legal and other professional fees 0.0% (22) (22) 22
Net gain on sale of assets 0.0% - (10)
Litigation and other matters 0.0% - 12
Other non-GAAP charges 0.0% 2 2 (6)
YTD 2019 Non-GAAP1 4,667$ 73.2% 1,430$ 421$ 357$ 2,208$ 2,459$
YTD 2019
YTD 2020

Reconciliation of Reported Operating Income to Adjusted EBITA
(non-GAAP)1 ($M) (Quarter-to-Date)
1. See Slide 2 and this Appendix for further non-GAAP information.
2. Excluding amortization impairments of intangible assets.
Gross
Profit2
Gross
Margin2
Selling &
Advertising
G&A and
Other
R&D
Expense
Operating
Expense
Operating
Income
Qtr 2 2020 GAAP $ 1,169 70.3% $ 367 $ 159 $ 108 $ 634 $ (27)
Amortization of finite-lived intangibles 0.0% - 436
Asset Impairments 0.0% - 1
Restructuring and integration costs 0.0% - 7
Acquisition-related costs and adjustments (excluding
amortization of intangible assets)
0.0% - 11
Litigation and other matters 0.0% - 100
Acquired in-process research and development costs 0.0% - 7
IT infrastructure investment 0.0% (4) (4) 4
Legal and other professional fees 0.0% (13) (13) 13
Qtr 2 2020 Non-GAAP1 1,169$ 70.3% 367$ 142$ 108$ 617$ 552$
Q2 2020
62

Reconciliation of Reported Salix Segment Profit to Adjusted
EBITA (non-GAAP)1 ($M)
631. See Slide 2 and this Appendix for further non-GAAP information.
2. Excluding amortization and impairments of intangible assets.
Gross
Profit2
Gross
Margin2
Selling &
Advertising
G&A and
Other
R&D
Expense
Operating
Expense
Operating
Income
YTD 2019 GAAP $ 1,304 86.6% $ 243 $ 46 $ 20 $ 309 $ 995
Acquisition-related costs and adjustments
(excluding amortization of intangible assets) 5 0.4% - 5
YTD 2019 Non-GAAP11,309$ 87.0% 243$ 46$ 20$ 309$ 1,000$
YTD 2019
Salix
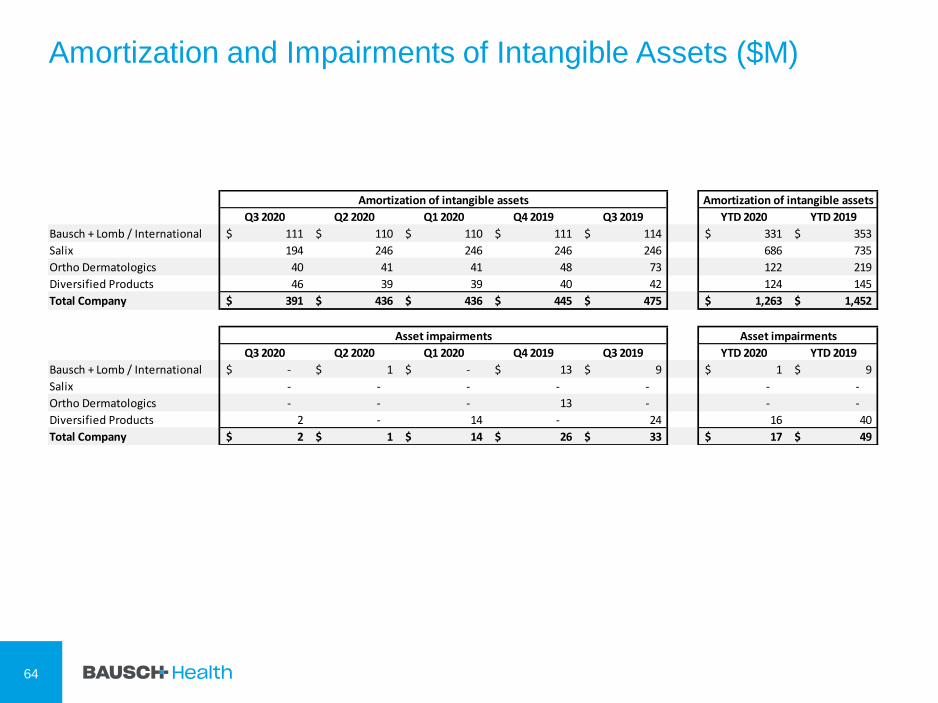
64
Amortization and Impairments of Intangible Assets ($M)
Q3 2020 Q2 2020 Q1 2020 Q4 2019 Q3 2019 YTD 2020 YTD 2019
Bausch + Lomb / International 111$ 110$ 110$ 111$ 114$ 331$ 353$
Salix 194 246 246 246 246 686 735
Ortho Dermatologics 40 41 41 48 73 122 219
Diversified Products 46 39 39 40 42 124 145
Total Company 391$ 436$ 436$ 445$ 475$ 1,263$ 1,452$
Q3 2020 Q2 2020 Q1 2020 Q4 2019 Q3 2019 YTD 2020 YTD 2019
Bausch + Lomb / International -$ 1$ -$ 13$ 9$ 1$ 9$
Salix - - - - - - -
Ortho Dermatologics - - - 13 - - -
Diversified Products 2 - 14 - 24 16 40
Total Company 2$ 1$ 14$ 26$ 33$ 17$ 49$
Asset impairments
Amortization of intangible assets Amortization of intangible assets
Asset impairments

Reconciliation of Reported Net Income (Loss) to EBITDA (non-
GAAP)1 and Adjusted EBITDA (non-GAAP)1 ($M)
65
1. See Slide 2 and this Appendix for further non-GAAP information.
2020 2019 2020 2019
Net income (loss) attributable to Bausch Health Companies Inc. 71$ (49)$ (407)$ (272)$
Interest expense, net 372 404 1,144 1,212
Provision for (benefit from) income taxes 5 (18) (133) (101)
Depreciation and amortization 436 520 1,397 1,583
EBITDA 884 857 2,001 2,422
Adjustments:
Asset impairments 2 33 17 49
Restructuring and integration costs 1 4 12 28
Acquisition-related costs and adjustments (excluding
amortization of intangible assets)2 3 26 15
Loss on extinguishment of debt - - 51 40
Share-based compensation 27 26 81 77
Separation and separation-related costs 5 - 5 -
Other adjustments:
Litigation and other matters 4 9 127 12
IT infrastructure investment 5 6 16 15
Legal and other professional fees 6 3 28 22
Net gain on sale of assets - (1) (1) (10)
Acquired in-process research and development costs 12 1 20 9
Other - 1 - (6)
Adjusted EBITDA (non-GAAP)1948$ 942$ 2,383$ 2,673$
Three Months Ended
September 30, September 30,
Nine Months Ended

Reconciliation of Reported Net Loss to EBITDA (non-GAAP)1
and Adjusted EBITDA (non-GAAP)1 ($M)
1. See Slide 2 and this Appendix for further non-GAAP information.
Three Months Ended
June 30,
2020
Net loss attributable to Bausch Health Companies Inc. (326)$
Interest expense, net 383
Benefit from income taxes (112)
Depreciation and amortization 480
EBITDA 425
Adjustments:
Asset impairments 1
Restructuring and integration costs 7
Acquisition-related costs and adjustments (excluding amortization of intangible assets) 11
Loss on extinguishment of debt 27
Share-based compensation 27
Other adjustments:
Litigation and other matters 100
IT infrastructure investment 4
Legal and other professional fees 13
Acquired in-process research and development costs 7
Adjusted EBITDA (non-GAAP)1622$
66

Reconciliation of Reported Revenue to Organic Revenue1,2 and
Organic Revenue Growth1,2 ($M) (Quarter-to-Date)
67 1. See Slide 2 and this Appendix for further non-GAAP information
2. Organic growth/change, a non-GAAP metric, is defined as a change on a period-over-period basis in revenues on a constant currency basis (if applicable) excluding the impact of
acquisitions, divestitures and discontinuations..
Revenue
as
Reported
Changes in
Exchange
Rates(a) Acquisition
Organic
Revenue
(Non-
GAAP)1,2
Revenue
as
Reported
Divestitures and
Discontinuations
Organic
Revenue
(Non-
GAAP)1,2 Amount Pct.
Bauch +Lomb / International
Global Vision Care 214 - - 214 219 - 219 (5) -2%
Global Surgical 151 (2) - 149 161 (1) 160 (11) -7%
Global Consumer Products 374 4 - 378 370 (1) 369 9 2%
Global Ophtho Rx 136 (1) - 135 150 (1) 149 (14) -9%
International Rx 294 6 - 300 275 - 275 25 9%
Total Bausch + Lomb / International 1,169 7 - 1,176 1,175 (3) 1,172 4 0%
Salix
Salix 496 - - 496 551 - 551 (55) -10%
Ortho Dermatologics
Ortho Dermatologics 71 - - 71 100 - 100 (29) -29%
Global Solta 73 (1) - 72 47 - 47 25 53%
Total Ortho Dermatologics 144 (1) - 143 147 - 147 (4) -3%
Diversified Products
Neurology & Other 199 - - 199 186 (1) 185 14 8%
Generics 111 - - 111 126 - 126 (15) -12%
Dentistry 19 - - 19 24 - 24 (5) -21%
Total Diversified Products 329 - - 329 336 (1) 335 (6) -2%
Total revenues 2,138$ 6$ -$ 2,144$ 2,209$ (4)$ 2,205$ (61)$ -3%
Calculation of Organic Revenue
Three Months Ended Three Months Ended Change in
September 30, 2020 September 30, 2019 Organic Revenue
(a) The impact for changes in foreign currency exchange rates is determined as the difference in the current period reported revenues at their current period currency exchange rates and the current period reported revenues revalued using the monthly ave rage currency exchange rates during the comparable prior
period.

Reconciliation of Reported Revenue to Organic Revenue1,2 and
Organic Revenue Growth1,2 ($M) (Year-to-Date)
68 1. See Slide 2 and this Appendix for further non-GAAP information
2. Organic growth/change, a non-GAAP metric, is defined as a change on a period-over-period basis in revenues on a constant currency basis (if applicable) excluding the impact of
acquisitions, divestitures and discontinuations..
(a) The impact for changes in foreign currency exchange rates is determined as the difference in the current period reported revenues at their current period currency exchange rates and the current period reported revenues revalued using the monthly ave rage currency exchange rates during the comparable prior
period.
Revenue
as
Reported
Changes in
Exchange
Rates(a) Acquisition
Organic
Revenue
(Non-
GAAP)1,2
Revenue
as
Reported
Divestitures and
Discontinuations
Organic
Revenue
(Non-
GAAP)1,2 Amount Pct.
Bauch +Lomb / International
Global Vision Care 542 4 - 546 638 (1) 637 (91) -14%
Global Surgical 394 3 - 397 505 (3) 502 (105) -21%
Global Consumer Products 1,048 22 - 1,070 1,065 (2) 1,063 7 1%
Global Ophtho Rx 365 3 - 368 483 (5) 478 (110) -23%
International Rx 817 19 - 836 810 (3) 807 29 4%
Total Bausch + Lomb / International 3,166 51 - 3,217 3,501 (14) 3,487 (270) -8%
Salix
Salix 1,377 - (13) 1,364 1,505 - 1,505 (141) -9%
Ortho Dermatologics
Ortho Dermatologics 227 - - 227 277 - 277 (50) -18%
Global Solta 166 - - 166 130 - 130 36 28%
Total Ortho Dermatologics 393 - - 393 407 - 407 (14) -3%
Diversified Products
Neurology & Other 514 - - 514 547 (1) 546 (32) -6%
Generics 316 - - 316 342 - 342 (26) -8%
Dentistry 48 - - 48 75 - 75 (27) -36%
Total Diversified Products 878 - - 878 964 (1) 963 (85) -9%
Total revenues 5,814$ 51$ (13)$ 5,852$ 6,377$ (15)$ 6,362$ (510)$ -8%
September 30, 2020
Nine Months Ended
September 30, 2019 Organic Revenue
Change in
Calculation of Organic Revenue
Nine Months Ended
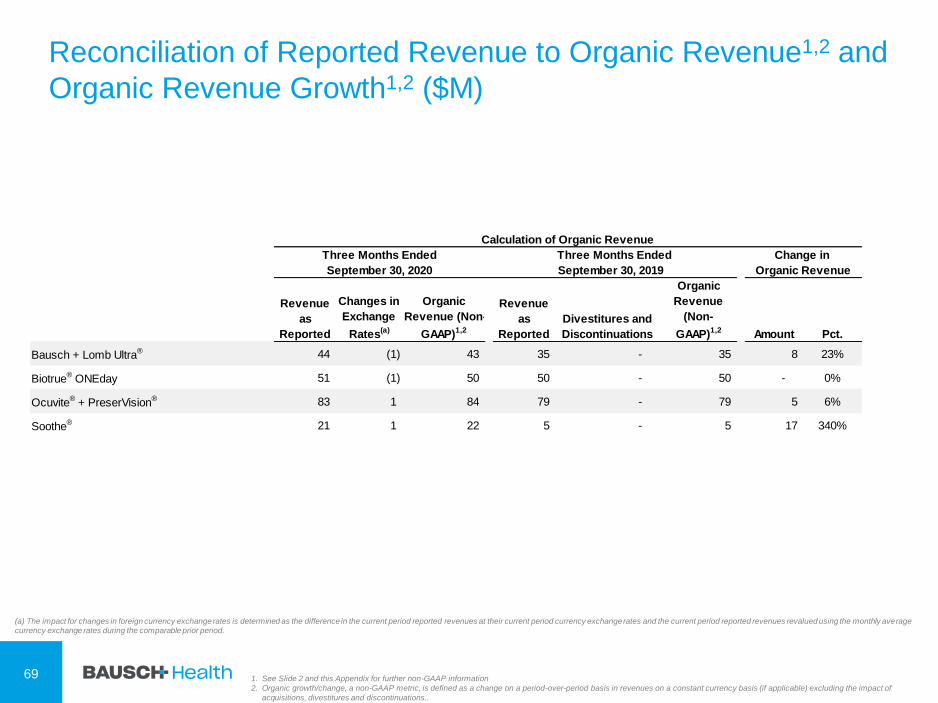
Reconciliation of Reported Revenue to Organic Revenue1,2 and
Organic Revenue Growth1,2 ($M)
69 1. See Slide 2 and this Appendix for further non-GAAP information
2. Organic growth/change, a non-GAAP metric, is defined as a change on a period-over-period basis in revenues on a constant currency basis (if applicable) excluding the impact of
acquisitions, divestitures and discontinuations..
(a) The impact for changes in foreign currency exchange rates is determined as the difference in the current period reported revenues at their current period currency exchange rates and the current period reported revenues revalued using the monthly average currency exchange rates during the comparable prior period.
Revenue
as
Reported
Changes in
Exchange
Rates(a)
Organic
Revenue (Non-
GAAP)1,2
Revenue
as
Reported
Divestitures and
Discontinuations
Organic
Revenue
(Non-
GAAP)1,2 Amount Pct.
Bausch + Lomb Ultra® 44 (1) 43 35 - 35 8 23%
Biotrue® ONEday 51 (1) 50 50 - 50 - 0%
Ocuvite® + PreserVision® 83 1 84 79 - 79 5 6%
Soothe® 21 1 22 5 - 5 17 340%
Calculation of Organic Revenue
Three Months Ended Change in
Organic RevenueSeptember 30, 2020 September 30, 2019
Three Months Ended

Reconciliation of TTM1 Adjusted EBITDA2 ($M)
1. Trailing twelve months.
2. See Slide 2 and this Appendix for further non-GAAP information..
70
Sep-20 Jun-20 Mar-20 Dec-19 Sep-19
Net loss attributable to Bausch Health Companies Inc. (1,923)$ (2,043)$ (1,888)$ (1,788)$ (616)$
Interest expense, net 1,532 1,564 1,587 1,600 1,624
Benefit from income taxes (86) (109) (6) (54) (185)
Depreciation and amortization 1,889 1,973 2,024 2,075 2,129
EBITDA 1,412 1,385 1,717 1,833 2,952
Adjustments:
Asset impairments 43 74 86 75 183
Goodwill impairments - - - - 109
Restructuring and integration costs 15 18 15 31 34
Acquisition-related costs and adjustments (excluding
amortization of intangible assets)36 37 50 25 29
Loss on extinguishment of debt 53 53 59 42 84
Share-based compensation 106 105 105 102 99
Separation and separation-related costs 5 - - - -
Other adjustments:
Litigation and other matters 1,516 1,521 1,422 1,401 15
IT infrastructure investment 25 26 27 24 15
Legal and other professional fees 41 38 36 35 39
Net gain on sale of assets (22) (23) (22) (31) (30)
Acquired in-process research and development costs 52 41 41 41 9
Other (1) - (3) (7) (7)
Adjusted EBITDA (non-GAAP) 23,281$ 3,275$ 3,533$ 3,571$ 3,531$

Non-GAAP AppendixDescription of Non-GAAP Financial Measures
To supplement the financial measures prepared in accordance
with U.S. generally accepted accounting principles (GAAP), the
Company uses certain non-GAAP financial measures. These
measures do not have any standardized meaning under GAAP and
other companies may use similarly titled non-GAAP financial
measures that are calculated differently from the way we calculate
such measures. Accordingly, our non-GAAP financial measures
may not be comparable to similar non-GAAP measures. We
caution investors not to place undue reliance on such non-GAAP
measures, but instead to consider them with the most directly
comparable GAAP measures. Non-GAAP financial measures have
limitations as analytical tools and should not be considered in
isolation. They should be considered as a supplement to, not a
substitute for, or superior to, the corresponding measures
calculated in accordance with GAAP.
Adjusted EBITDA (non-GAAP)
Adjusted EBITDA (non-GAAP) is GAAP net income (loss)
attributable to Bausch Health Companies Inc. (its most directly
comparable GAAP financial measure) adjusted for interest
expense, net, income taxes, depreciation and amortization and
certain other items, as further described below. Management
believes that Adjusted EBITDA (non-GAAP), along with the GAAP
measures used by management, most appropriately reflect how
the Company measures the business internally and sets
operational goals and incentives. In particular, the Company
believes that Adjusted EBITDA (non-GAAP) focuses management
on the Company’s underlying operational results and business
performance. As a result, the Company uses Adjusted EBITDA
(non-GAAP) both to assess the actual financial performance of the
Company and to forecast future results as part of its guidance.
Management believes Adjusted EBITDA (non-GAAP) is a useful
measure to evaluate current performance. Adjusted EBITDA (non-
GAAP) is intended to show our unleveraged, pre-tax operating
results and therefore reflects our financial performance based on
operational factors. In addition, cash bonuses for the Company’s
executive officers and other key employees are based, in part, on
the achievement of certain Adjusted EBITDA (non-GAAP) targets.
Description of Non-GAAP
Financial Measures
Adjusted EBITDA (non-GAAP)
Adjusted EBITDA (non-GAAP)
Adjustments
Adjusted EBITA
EBITA/EBITA Margin
Adjusted Gross Profit/Adjusted
Gross Margin
Adjusted Selling, A&P/Adjusted
SG&A
Total Adjusted Operating
Expense
Adjusted Net Income
(non-GAAP)
Adjusted Net Income (non-
GAAP) Adjustments
Organic Revenue / Organic
Growth / Organic Change
Constant Currency
71

Non-GAAP AppendixAdjusted EBITDA (non-GAAP) is net income
(loss) attributable to the Company (its most
directly comparable GAAP financial measure)
adjusted for interest expense, net, provision for
(benefit from) income taxes, depreciation and
amortization and the following items:
Restructuring and integration costs: The Company has incurred
restructuring costs as it implemented certain strategies, which
involved, among other things, improvements to its infrastructure
and operations, internal reorganizations and impacts from the
divestiture of assets and businesses. In addition, in connection
with its acquisition of certain assets of Synergy Pharmaceuticals
Inc. (“Synergy”), the Company has incurred certain severance and
integration costs. With regard to infrastructure and operational
improvements which the Company has taken to improve
efficiencies in the businesses and facilities, these tend to be costs
intended to right size the business or organization that fluctuate
significantly between periods in amount, size and timing,
depending on the improvement project, reorganization or
transaction. With regard to the severance and integration costs
associated with the acquisition of certain assets of Synergy, these
costs are specific to the acquisition itself and provided no benefit
to the ongoing operations of the Company. As a result, the
Company does not believe that such costs (and their impact) are
truly representative of its underlying business. The Company
believes that the adjustments of these items provide supplemental
information with regard to the sustainability of the Company's
operating performance, allow for a comparison of the financial
results to historical operations and forward-looking guidance and,
as a result, provide useful supplemental information to investors.
Asset Impairments: The Company has excluded the impact of
impairments of finite-lived and indefinite-lived intangible assets, as
well as impairments of assets held for sale, as such amounts are
inconsistent in amount and frequency and are significantly
impacted by the timing and/or size of acquisitions and divestitures.
The Company believes that the adjustments of these items
correlate with the sustainability of the Company’s operating
performance. Although the Company excludes impairments, of
intangible assets from measuring the performance of the Company
and the business, the Company believes that it is important for
investors to understand that intangible assets contribute to
revenue generation.
Goodwill Impairments: The Company excludes the impact of
goodwill impairments. When the Company has made acquisitions
where the consideration paid was in excess of the fair value of the
net assets acquired, the remaining purchase price is recorded as
goodwill. For assets that we developed ourselves, no goodwill is
recorded. Goodwill is not amortized but is tested for impairment.
The amount of goodwill impairment is measured as the excess of a
reporting unit’s carrying value over its fair value. Management
excludes these charges in measuring the performance of the
Company and the business.
Description of Non-GAAP
Financial Measures
Adjusted EBITDA (non-GAAP)
Adjusted EBITDA (non-GAAP)
Adjustments
Adjusted EBITA
EBITA/EBITA Margin
Adjusted Gross Profit/Adjusted
Gross Margin
Adjusted Selling, A&P/Adjusted
SG&A
Total Adjusted Operating
Expense
Adjusted Net Income
(non-GAAP)
Adjusted Net Income (non-
GAAP) Adjustments
Organic Revenue / Organic
Growth / Organic Change
Constant Currency
72

Non-GAAP AppendixShare-based Compensation: The Company has excluded
recorded costs relating to share-based compensation. The
Company believes that the exclusion of share-based
compensation expense assists investors in the comparisons of
operating results to peer companies. Share-based compensation
expense can vary significantly based on the timing, size and
nature of awards granted.
Acquisition-related costs and adjustments excluding
amortization of intangible assets: The Company has excluded
the impact of acquisition-related costs and fair value inventory
step-up resulting from acquisitions as the amounts and frequency
of such costs and adjustments are not consistent and are
impacted by the timing and size of its acquisitions. In addition, the
Company has excluded the impact of acquisition-related
contingent consideration non-cash adjustments due to the inherent
uncertainty and volatility associated with such amounts based on
changes in assumptions with respect to fair value estimates, and
the amount and frequency of such adjustments is not consistent
and is significantly impacted by the timing and size of the
Company's acquisitions, as well as the nature of the agreed-upon
consideration.
Loss on extinguishment of debt: The Company has excluded
loss on extinguishment of debt as this represents a cost of
refinancing our existing debt and is not a reflection of our
operations for the period. Further, the amount and frequency of
such charges are not consistent and are significantly impacted by
the timing and size of debt financing transactions and other factors
in the debt market out of management’s control.
Separation costs and separation-related costs: The Company
has excluded certain costs incurred in connection with activities
taken to: (i) separate the eye-health business from the remainder
of the Company and (ii) register the eye-health business as an
independent publicly traded entity. Separation costs are
incremental costs directly related to effectuating the separation of
the eye-health business and include, but are not limited to; legal,
audit and advisory fees, employee hiring, relocation and travel
costs and costs associated with establishing a new board of
directors and audit committee. Separation-related costs are
incremental costs indirectly related to the separation of the eye-
health business and include but are not limited to; IT infrastructure
and software licensing costs, rebranding costs and costs
associated with facility relocation and/or modification. As these
costs arise from events outside of the ordinary course of
continuing operations, the Company believes that the adjustments
of these items provide supplemental information with regard to the
sustainability of the Company's operating performance, allow for a
comparison of the financial results to historical operations and
forward-looking guidance and, as a result, provide useful
supplemental information to investors.
Description of Non-GAAP
Financial Measures
Adjusted EBITDA (non-GAAP)
Adjusted EBITDA (non-GAAP)
Adjustments
Adjusted EBITA
EBITA/EBITA Margin
Adjusted Gross
Profit/Adjusted Gross Margin
Adjusted Selling,
A&P/Adjusted SG&A
Total Adjusted Operating
Expense
Adjusted Net Income
(non-GAAP)
Adjusted Net Income (non-
GAAP) Adjustments
Organic Revenue / Organic
Growth / Organic Change
Constant Currency
73

Non-GAAP AppendixOther Non-GAAP Charges: The Company has excluded certain
other amounts, including legal and other professional fees incurred
in connection with recent legal and governmental proceedings,
investigations and information requests regarding certain of our
legacy distribution, marketing, pricing, disclosure and accounting
practices, litigation and other matters, and net gain on sales of
assets. The Company has also excluded expenses associated with
in-process research and development, as these amounts are
inconsistent in amount and frequency and are significantly
impacted by the timing, size and nature of acquisitions.
Furthermore, as these amounts are associated with research and
development acquired, the Company does not believe that they
are a representation of the Company's research and development
efforts during any given period. The Company has also excluded
IT infrastructure investment, that are the result of other, non-
comparable events to measure operating performance. These
events arise outside of the ordinary course of continuing
operations. Given the unique nature of the matters relating to
these costs, the Company believes these items are not normal
operating expenses. For example, legal settlements and
judgments vary significantly, in their nature, size and frequency,
and, due to this volatility, the Company believes the costs
associated with legal settlements and judgments are not normal
operating expenses. In addition, as opposed to more ordinary
course matters, the Company considers that each of the recent
proceedings, investigations and information requests, given their
nature and frequency, are outside of the ordinary course and
relate to unique circumstances. The Company believes that the
exclusion of such out-of-the-ordinary-course amounts provides
supplemental information to assist in the comparison of the
financial results of the Company from period to period and,
therefore, provides useful supplemental information to investors.
However, investors should understand that many of these costs
could recur and that companies in our industry often face litigation.
Please also see the reconciliation tables in this appendix for
further information as to how these non-GAAP measures are
calculated for the periods presented.
Description of Non-GAAP
Financial Measures
Adjusted EBITDA (non-GAAP)
Adjusted EBITDA (non-GAAP)
Adjustments
Adjusted EBITA
EBITA/EBITA Margin
Adjusted Gross
Profit/Adjusted Gross Margin
Adjusted Selling,
A&P/Adjusted SG&A
Total Adjusted Operating
Expense
Adjusted Net Income
(non-GAAP)
Adjusted Net Income (non-
GAAP) Adjustments
Organic Revenue / Organic
Growth / Organic Change
Constant Currency
74
Non-GAAP AppendixAdjusted EBITA
Management uses this non-GAAP measure (the most directly
comparable GAAP financial measure for which is Total GAAP Revenue
less total operating expenses (GAAP)) to assess performance of its
business units and operating and reportable segments, and the
Company, in total, without the impact of foreign currency exchange
fluctuations, fair value adjustments to inventory in connection with
business combinations and integration related inventory charges and
technology transfer costs. In addition, it excludes certain acquisition
related contingent consideration, acquired in-process research and
development, asset impairments, restructuring, integration and
acquisition-related costs, amortization of finite-lived intangible assets,
other non-GAAP charges for wind down operating costs, and legal and
other professional fees relating to legal and governmental proceedings,
investigations and information requests respecting certain of our
distribution, marketing, pricing, disclosure and accounting practices.
The Company believes the exclusion of such amounts provides
supplemental information to management and the users of the financial
statements to assist in the understanding of the financial results of the
Company from period to period and, therefore, provides useful
supplemental information to investors. Please also see the
reconciliation tables in this appendix for further information as to how
these non-GAAP measures are calculated for the periods presented.
EBITA/EBITA Margin
EBITA represents earnings before interest, taxes and amortizations.
Adjusted Gross Profit/Adjusted Gross Margin
Management uses these non-GAAP measures (the most directly
comparable GAAP financial measures for which are gross profit and gross
margin) to assess performance of its business units and operating and
reportable segments, and the Company in total, without the impact of
foreign currency exchange fluctuations, and fair value adjustments to
inventory in connection with business combinations. Such measures are
useful to investors as it provides a supplemental period-to-period
comparison. Please also see the reconciliation tables in this appendix for
further information as to how these non-GAAP measures are calculated for
the periods presented.
Adjusted Selling, A&P/Adjusted G&A/Adjusted
SG&A
Management uses these non-GAAP measures (the most directly
comparable GAAP financial measure for which is selling, general and
administrative) as a supplemental measure for period-to-period
comparison. Adjusted Selling, General and Administrative excludes, as
applicable, separation-related costs, certain costs primarily related to
legal and other professional fees relating to legal and governmental
proceedings, investigations and information requests respecting
certain of our distribution, marketing, pricing, disclosure and
accounting practices. See the discussion under “Other Non-GAAP
charges” above. Please also see the reconciliation tables in this
appendix for further information as to how this non-GAAP measure is
calculated for the periods presented.
Total Adjusted Operating Expense
Management uses this non-GAAP measure (the most directly
comparable GAAP financial measure for which is total operating
expenses (GAAP)) as a supplemental measure for period-to-period
comparison. This non-GAAP measure allows investors to supplement
the evaluation of operational efficiencies of the underlying business
without the variability of items that the Company believes are not
normal course of business. Please see the reconciliation tables in this
appendix for further information as to how this non-GAAP measure is
calculated for the period presented
.
Description of Non-GAAP
Financial Measures
Adjusted EBITDA (non-GAAP)
Adjusted EBITDA (non-GAAP)
Adjustments
Adjusted EBITA
EBITA/EBITA Margin
Adjusted Gross Profit/Adjusted
Gross Margin
Adjusted Selling, A&P/Adjusted
SG&A
Total Adjusted Operating Expense
Adjusted Net Income
(non-GAAP)
Adjusted Net Income (non-GAAP)
Adjustments
Organic Revenue / Organic
Growth / Organic Change
Constant Currency
75

Non-GAAP AppendixAdjusted Net Income (non-GAAP)
Historically, management has used Adjusted net income (non-GAAP)
(the most directly comparable GAAP financial measure for which is
GAAP Net Income (Loss)) for strategic decision making, forecasting
future results and evaluating current performance. This non-GAAP
measure excludes the impact of certain items (as described below)
that may obscure trends in the Company’s underlying performance. By
disclosing this non-GAAP measure, it is management’s intention to
provide investors with a meaningful, supplemental comparison of the
Company’s operating results and trends for the periods presented. It is
management’s belief that this measure is also useful to investors as
such measure allowed investors to evaluate the Company’s
performance using the same tools that management uses to evaluate
past performance and prospects for future performance. Accordingly, it
is the Company’s belief that Adjusted net income (non-GAAP) is useful
to investors in their assessment of the Company’s operating
performance and the valuation of the Company. It is also noted that, in
recent periods, our GAAP net income (loss) was significantly lower
than our Adjusted net income (non-GAAP). Commencing in 2017,
management of the Company identified and began using certain new
primary financial performance measures to assess the Company’s
financial performance. However, management still believes that
Adjusted net income (non-GAAP) may be useful to investors in their
assessment of the Company and its performance.
Adjusted Net Income (non-GAAP) Adjustments
Adjusted net income (non-GAAP) is net income (loss) attributable to
Bausch Health Companies Inc. (its most directly comparable GAAP
financial measure) adjusted for restructuring and integration costs,
acquired in-process research and development costs, loss on
extinguishment of debt, asset impairments, acquisition-related
adjustments, excluding amortization, separation and separation-related
costs and other non-GAAP charges), as these adjustments are
described above, and amortization of intangible assets as described
below:
Amortization of intangible assets: The Company has excluded the
impact of amortization of intangible assets, as such amounts are
inconsistent in amount and frequency and are significantly impacted by
the timing and/or size of acquisitions. The Company believes that the
adjustments of these items correlate with the sustainability of the
Company’s operating performance. Although the Company excludes
amortization of intangible assets from its non-GAAP expenses, the
Company believes that it is important for investors to understand that
such intangible assets contribute to revenue generation. Amortization
of intangible assets that relate to past acquisitions will recur in future
periods until such intangible assets have been fully amortized. Any
future acquisitions may result in the amortization of additional
intangible assets.
Please see the reconciliation tables in this appendix for further
information as to how this non-GAAP measure is calculated for the
periods presented.
Description of Non-GAAP
Financial Measures
Adjusted EBITDA (non-GAAP)
Adjusted EBITDA (non-GAAP)
Adjustments
Adjusted EBITA
EBITA/EBITA Margin
Adjusted Gross Profit/Adjusted
Gross Margin
Adjusted Selling, A&P/Adjusted
SG&A
Total Adjusted Operating
Expense
Adjusted Net Income
(non-GAAP)
Adjusted Net Income (non-
GAAP) Adjustments
Organic Revenue / Organic
Growth / Organic Change
Constant Currency
76

Non-GAAP AppendixOrganic Revenue, Organic Growth, Organic Revenue
Decline and Organic Change
Organic growth/change, a non-GAAP metric, is defined as a change on a
period-over-period basis in revenues on a constant currency basis (if
applicable) excluding the impact of recent acquisitions, divestitures and
discontinuations (if applicable). Organic growth/change is change in
GAAP Revenue (its most directly comparable GAAP financial measure)
adjusted for certain items, as further described below, of businesses that
have been owned for one or more years. Organic revenue is impacted by
changes in product volumes and price. The price component is made up
of two key drivers: (i) changes in product gross selling price and (ii)
changes in sales deductions. The Company uses organic revenue and
organic growth/change to assess performance of its business units and
operating and reportable segments, and the Company in total, without
the impact of foreign currency exchange fluctuations and recent
acquisitions, divestitures and product discontinuations. The Company
believes that such measures are useful to investors as they provide a
supplemental period-to-period comparison.
Organic growth/organic change reflects adjustments for: ( i) the impact of
period-over-period changes in foreign currency exchange rates on
revenues and (ii) the revenues associated with acquisitions, divestitures
and discontinuations of businesses divested and/ or discontinued. These
adjustments are determined as follows:
• Foreign currency exchange rates: Although changes in foreign
currency exchange rates are part of our business, they are not within
management’s control. Changes in foreign currency exchange rates,
however, can mask positive or negative trends in the business. The
impact for changes in foreign currency exchange rates is determined
as the difference in the current period reported revenues at their
current period currency exchange rates and the current period
reported revenues revalued using the monthly average currency
exchange rates during the comparable prior period.
• Acquisitions, divestitures and discontinuations: In order to present
period-over-period organic revenues (non-GAAP) on a comparable
basis, revenues associated with acquisitions, divestitures and
discontinuations are adjusted to include only revenues from those
businesses and assets owned during both periods. Accordingly,
organic revenue (non-GAAP) growth/change excludes from the
current period, revenues attributable to each acquisition for twelve
months subsequent to the day of acquisition, as there are no
revenues from those businesses and assets included in the
comparable prior period. Organic revenue (non-GAAP)
growth/change excludes from the prior period, all revenues
attributable to each divestiture and discontinuance during the twelve
months prior to the day of divestiture or discontinuance, as there are
no revenues from those businesses and assets included in the
comparable current period.
Please also see the reconciliation in this Appendix for further information
as to how this non-GAAP measure is calculated for the periods
presented.
Constant Currency
Changes in the relative values of non-U.S. currencies to the U.S. dollar
may affect the Company’s financial results and financial position. To
assist investors in evaluating the Company’s performance, we have
adjusted for foreign currency effects.
Constant currency impact is determined by comparing 2020 reported
amounts adjusted to exclude currency impact, calculated using 2019
monthly average exchange rates, to the actual 2019 reported amounts.
Description of Non-GAAP
Financial Measures
Adjusted EBITDA (non-GAAP)
Adjusted EBITDA (non-GAAP)
Adjustments
Adjusted EBITA
EBITA/EBITA Margin
Adjusted Gross Profit/Adjusted
Gross Margin
Adjusted Selling,
A&P/Adjusted SG&A
Total Adjusted Operating
Expense
Adjusted Net Income
(non-GAAP)
Adjusted Net Income (non-
GAAP) Adjustments
Organic Revenue / Organic
Growth / Organic Change
Constant Currency
77