3M Reports Second-Quarter 2021 Results Operating cash flow ...
17
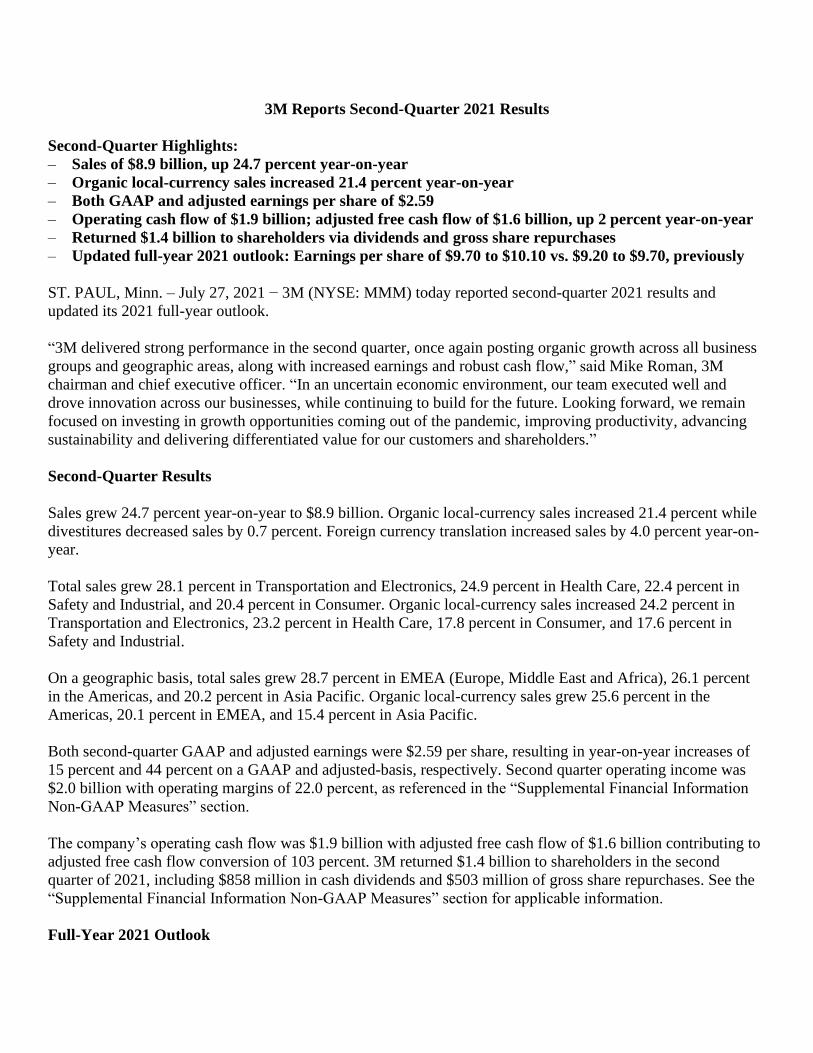
3M Reports Second-Quarter 2021 Results Second-Quarter Highlights: – Sales of $8.9 billion, up 24.7 percent year-on-year – Organic local-currency sales increased 21.4 percent year-on-year – Both GAAP and adjusted earnings per share of $2.59 – Operating cash flow of $1.9 billion; adjusted free cash flow of $1.6 billion, up 2 percent year-on-year – Returned $1.4 billion to shareholders via dividends and gross share repurchases – Updated full-year 2021 outlook: Earnings per share of $9.70 to $10.10 vs. $9.20 to $9.70, previously ST. PAUL, Minn. – July 27, 2021 − 3M (NYSE: MMM) today reported second-quarter 2021 results and updated its 2021 full-year outlook. “3M delivered strong performance in the second quarter, once again posting organic growth across all business groups and geographic areas, along with increased earnings and robust cash flow,” said Mike Roman, 3M chairman and chief executive officer. “In an uncertain economic environment, our team executed well and drove innovation across our businesses, while continuing to build for the future. Looking forward, we remain focused on investing in growth opportunities coming out of the pandemic, improving productivity, advancing sustainability and delivering differentiated value for our customers and shareholders.” Second-Quarter Results Sales grew 24.7 percent year-on-year to $8.9 billion. Organic local-currency sales increased 21.4 percent while divestitures decreased sales by 0.7 percent. Foreign currency translation increased sales by 4.0 percent year-on- year. Total sales grew 28.1 percent in Transportation and Electronics, 24.9 percent in Health Care, 22.4 percent in Safety and Industrial, and 20.4 percent in Consumer. Organic local-currency sales increased 24.2 percent in Transportation and Electronics, 23.2 percent in Health Care, 17.8 percent in Consumer, and 17.6 percent in Safety and Industrial. On a geographic basis, total sales grew 28.7 percent in EMEA (Europe, Middle East and Africa), 26.1 percent in the Americas, and 20.2 percent in Asia Pacific. Organic local-currency sales grew 25.6 percent in the Americas, 20.1 percent in EMEA, and 15.4 percent in Asia Pacific. Both second-quarter GAAP and adjusted earnings were $2.59 per share, resulting in year-on-year increases of 15 percent and 44 percent on a GAAP and adjusted-basis, respectively. Second quarter operating income was $2.0 billion with operating margins of 22.0 percent, as referenced in the “Supplemental Financial Information Non-GAAP Measures” section. The company’s operating cash flow was $1.9 billion with adjusted free cash flow of $1.6 billion contributing to adjusted free cash flow conversion of 103 percent. 3M returned $1.4 billion to shareholders in the second quarter of 2021, including $858 million in cash dividends and $503 million of gross share repurchases. See the “Supplemental Financial Information Non-GAAP Measures” section for applicable information. Full-Year 2021 Outlook
Transcript of 3M Reports Second-Quarter 2021 Results Operating cash flow ...
3M Reports Second-Quarter 2021 Results
Second-Quarter Highlights:
– Sales of $8.9 billion, up 24.7 percent year-on-year
– Organic local-currency sales increased 21.4 percent year-on-year
– Both GAAP and adjusted earnings per share of $2.59
– Operating cash flow of $1.9 billion; adjusted free cash flow of $1.6 billion, up 2 percent year-on-year
– Returned $1.4 billion to shareholders via dividends and gross share repurchases
– Updated full-year 2021 outlook: Earnings per share of $9.70 to $10.10 vs. $9.20 to $9.70, previously
ST. PAUL, Minn. – July 27, 2021 − 3M (NYSE: MMM) today reported second-quarter 2021 results and
updated its 2021 full-year outlook.
“3M delivered strong performance in the second quarter, once again posting organic growth across all business
groups and geographic areas, along with increased earnings and robust cash flow,” said Mike Roman, 3M
chairman and chief executive officer. “In an uncertain economic environment, our team executed well and
drove innovation across our businesses, while continuing to build for the future. Looking forward, we remain
focused on investing in growth opportunities coming out of the pandemic, improving productivity, advancing
sustainability and delivering differentiated value for our customers and shareholders.”
Second-Quarter Results
Sales grew 24.7 percent year-on-year to $8.9 billion. Organic local-currency sales increased 21.4 percent while
divestitures decreased sales by 0.7 percent. Foreign currency translation increased sales by 4.0 percent year-on-
year.
Total sales grew 28.1 percent in Transportation and Electronics, 24.9 percent in Health Care, 22.4 percent in
Safety and Industrial, and 20.4 percent in Consumer. Organic local-currency sales increased 24.2 percent in
Transportation and Electronics, 23.2 percent in Health Care, 17.8 percent in Consumer, and 17.6 percent in
Safety and Industrial.
On a geographic basis, total sales grew 28.7 percent in EMEA (Europe, Middle East and Africa), 26.1 percent
in the Americas, and 20.2 percent in Asia Pacific. Organic local-currency sales grew 25.6 percent in the
Americas, 20.1 percent in EMEA, and 15.4 percent in Asia Pacific.
Both second-quarter GAAP and adjusted earnings were $2.59 per share, resulting in year-on-year increases of
15 percent and 44 percent on a GAAP and adjusted-basis, respectively. Second quarter operating income was
$2.0 billion with operating margins of 22.0 percent, as referenced in the “Supplemental Financial Information
Non-GAAP Measures” section.
The company’s operating cash flow was $1.9 billion with adjusted free cash flow of $1.6 billion contributing to
adjusted free cash flow conversion of 103 percent. 3M returned $1.4 billion to shareholders in the second
quarter of 2021, including $858 million in cash dividends and $503 million of gross share repurchases. See the
“Supplemental Financial Information Non-GAAP Measures” section for applicable information.
Full-Year 2021 Outlook
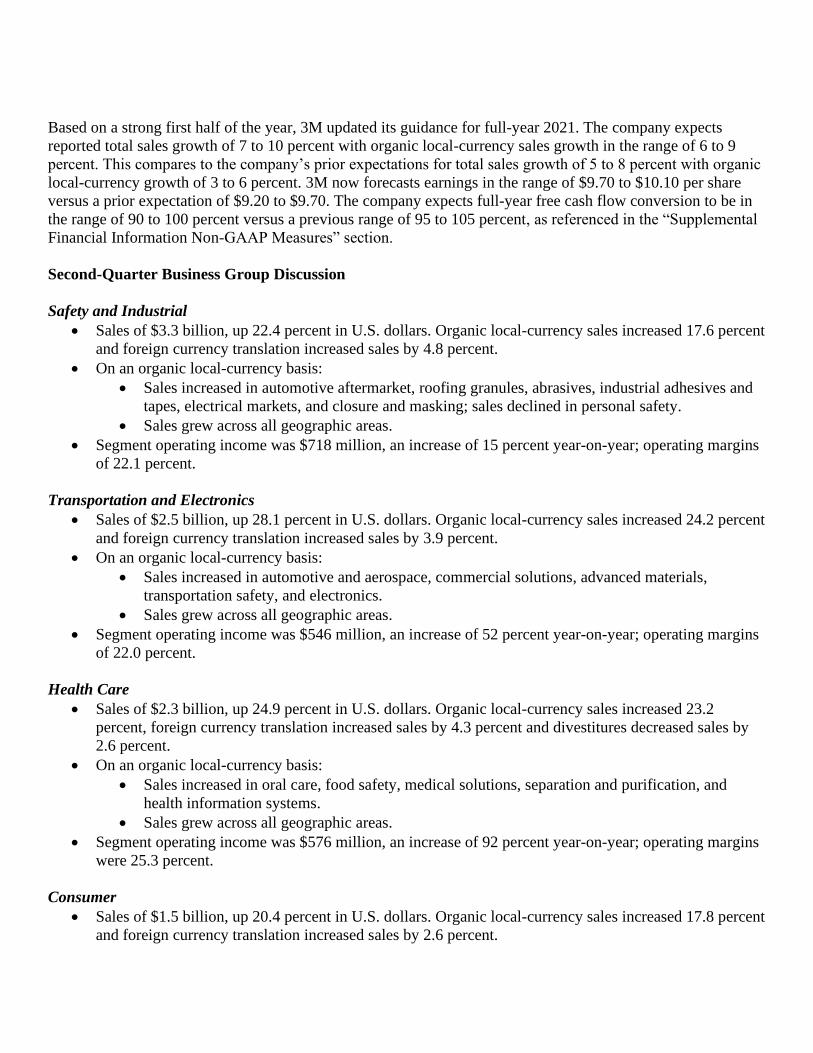
Based on a strong first half of the year, 3M updated its guidance for full-year 2021. The company expects
reported total sales growth of 7 to 10 percent with organic local-currency sales growth in the range of 6 to 9
percent. This compares to the company’s prior expectations for total sales growth of 5 to 8 percent with organic
local-currency growth of 3 to 6 percent. 3M now forecasts earnings in the range of $9.70 to $10.10 per share
versus a prior expectation of $9.20 to $9.70. The company expects full-year free cash flow conversion to be in
the range of 90 to 100 percent versus a previous range of 95 to 105 percent, as referenced in the “Supplemental
Financial Information Non-GAAP Measures” section.
Second-Quarter Business Group Discussion
Safety and Industrial
• Sales of $3.3 billion, up 22.4 percent in U.S. dollars. Organic local-currency sales increased 17.6 percent
and foreign currency translation increased sales by 4.8 percent.
• On an organic local-currency basis:
• Sales increased in automotive aftermarket, roofing granules, abrasives, industrial adhesives and
tapes, electrical markets, and closure and masking; sales declined in personal safety.
• Sales grew across all geographic areas.
• Segment operating income was $718 million, an increase of 15 percent year-on-year; operating margins
of 22.1 percent.
Transportation and Electronics
• Sales of $2.5 billion, up 28.1 percent in U.S. dollars. Organic local-currency sales increased 24.2 percent
and foreign currency translation increased sales by 3.9 percent.
• On an organic local-currency basis:
• Sales increased in automotive and aerospace, commercial solutions, advanced materials,
transportation safety, and electronics.
• Sales grew across all geographic areas.
• Segment operating income was $546 million, an increase of 52 percent year-on-year; operating margins
of 22.0 percent.
Health Care
• Sales of $2.3 billion, up 24.9 percent in U.S. dollars. Organic local-currency sales increased 23.2
percent, foreign currency translation increased sales by 4.3 percent and divestitures decreased sales by
2.6 percent.
• On an organic local-currency basis:
• Sales increased in oral care, food safety, medical solutions, separation and purification, and
health information systems.
• Sales grew across all geographic areas.
• Segment operating income was $576 million, an increase of 92 percent year-on-year; operating margins
were 25.3 percent.
Consumer
• Sales of $1.5 billion, up 20.4 percent in U.S. dollars. Organic local-currency sales increased 17.8 percent
and foreign currency translation increased sales by 2.6 percent.
• On an organic local-currency basis:
• Sales increased in stationery and office supplies, consumer health and safety, home
improvement, and home care.
• Sales grew across all geographic areas.
• Segment operating income was $311 million, up 12 percent year-on-year; operating margins were 21.0
percent.
3M will conduct an investor teleconference at 9:00 a.m. EDT (8:00 a.m. CDT) today. Investors can access this
conference via the following:
• Live webcast at http://investors.3M.com.
• Live telephone:
Call 800-762-2596 within the U.S. or +1 212-231-2916 outside the U.S. Please join the call at least 10
minutes before the start time.
• Webcast replay:
Go to 3M’s Investor Relations website at http://investors.3M.com and click on “Quarterly Earnings.”
• Telephone replay:
Call 800-633-8284 within the U.S. or +1 402-977-9140 outside the U.S. (for both U.S. and outside the
U.S., the access code is 21972036). The telephone replay will be available until 11:30 a.m. EDT (10:30
a.m. CDT) on August 3, 2021.
Forward-Looking Statements
This news release contains forward-looking information about 3M's financial results and estimates and business
prospects that involve substantial risks and uncertainties. You can identify these statements by the use of words
such as "anticipate," "estimate," "expect," "aim," "project," "intend," "plan," "believe," "will," "should,"
"could," "target," "forecast" and other words and terms of similar meaning in connection with any discussion of
future operating or financial performance or business plans or prospects. Among the factors that could cause
actual results to differ materially are the following: (1) worldwide economic, political, regulatory, capital
markets and other external conditions and other factors beyond the Company's control, including natural and
other disasters or climate change affecting the operations of the Company or its customers and suppliers; (2)
risks related to public health crises such as the global pandemic associated with the coronavirus (COVID-19);
(3) foreign currency exchange rates and fluctuations in those rates; (4) liabilities related to certain
fluorochemicals, including lawsuits concerning various PFAS-related products and chemistries, and claims and
governmental regulatory proceedings and inquiries related to PFAS in a variety of jurisdictions; (5) legal
proceedings, including significant developments that could occur in the legal and regulatory proceedings
described in the Company's Annual Report on Form 10-K for the year ended Dec. 31, 2020, and any subsequent
quarterly reports on Form 10-Q (the “Reports”); (6) competitive conditions and customer preferences; (7) the
timing and market acceptance of new product offerings; (8) the availability and cost of purchased components,
compounds, raw materials and energy (including oil and natural gas and their derivatives) due to shortages,
increased demand or supply interruptions (including those caused by natural and other disasters and other
events); (9) unanticipated problems or delays with the phased implementation of a global enterprise resource
planning (ERP) system, or security breaches and other disruptions to the Company's information technology
infrastructure; (10) the impact of acquisitions, strategic alliances, divestitures and other unusual events resulting
from portfolio management actions and other evolving business strategies, and possible organizational
restructuring; (11) operational execution, including scenarios where the Company generates fewer productivity
improvements than estimated; (12) financial market risks that may affect the Company’s funding obligations
under defined benefit pension and postretirement plans; (13) the Company's credit ratings and its cost of capital;
and (14) tax-related external conditions, including changes in tax rates, laws or regulations. Changes in such
assumptions or factors could produce significantly different results. A further description of these factors is
located in the Reports under "Cautionary Note Concerning Factors That May Affect Future Results" and "Risk
Factors" in Part I, Items 1 and 1A (Annual Report) and in Part I, Item 2 and Part II, Item 1A (Quarterly
Reports), as updated by applicable Current Reports on Form 8-K. The information contained in this news
release is as of the date indicated. The Company assumes no obligation to update any forward-looking
statements contained in this news release as a result of new information or future events or developments.
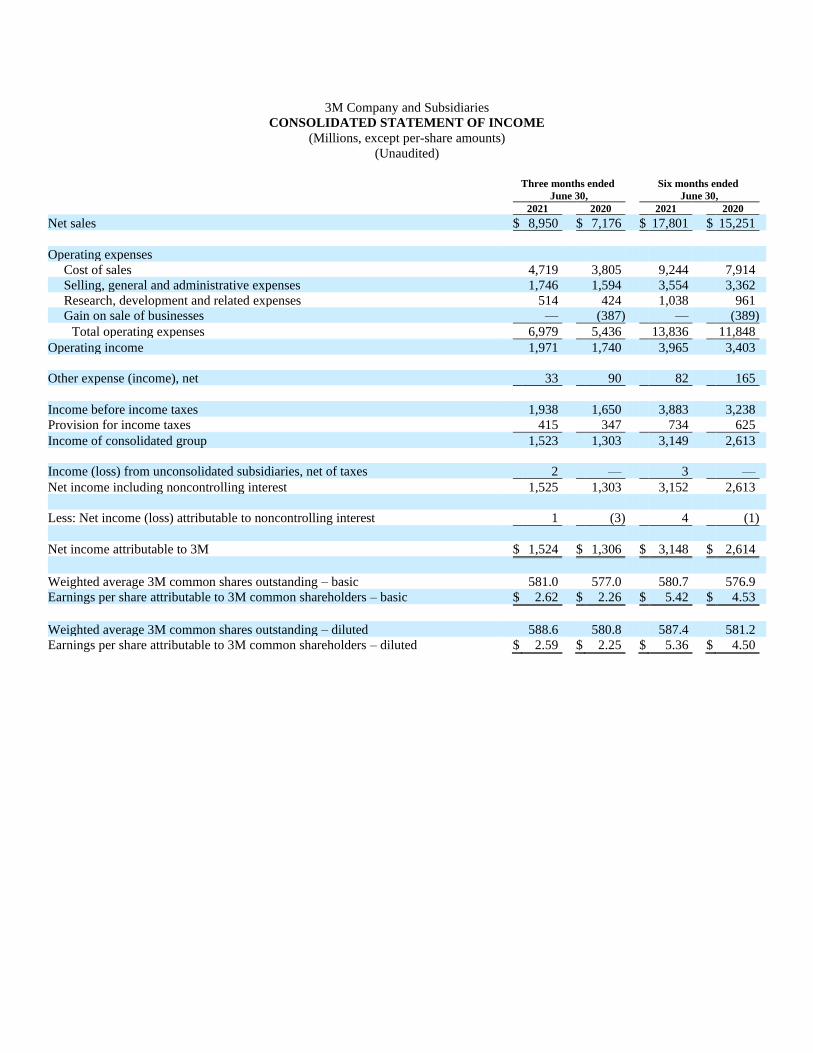
3M Company and Subsidiaries
CONSOLIDATED STATEMENT OF INCOME
(Millions, except per-share amounts)
(Unaudited)
Three months ended Six months ended
June 30, June 30,
2021 2020 2021 2020
Net sales $ 8,950 $ 7,176 $ 17,801 $ 15,251
Operating expenses
Cost of sales 4,719 3,805 9,244 7,914
Selling, general and administrative expenses 1,746 1,594 3,554 3,362
Research, development and related expenses 514 424 1,038 961
Gain on sale of businesses — (387) — (389)
Total operating expenses 6,979 5,436 13,836 11,848
Operating income 1,971 1,740 3,965 3,403
Other expense (income), net 33 90 82 165
Income before income taxes 1,938 1,650 3,883 3,238
Provision for income taxes 415 347 734 625
Income of consolidated group 1,523 1,303 3,149 2,613
Income (loss) from unconsolidated subsidiaries, net of taxes 2 — 3 —
Net income including noncontrolling interest 1,525 1,303 3,152 2,613
Less: Net income (loss) attributable to noncontrolling interest 1 (3) 4 (1)
Net income attributable to 3M $ 1,524 $ 1,306 $ 3,148 $ 2,614
Weighted average 3M common shares outstanding – basic 581.0 577.0 580.7 576.9
Earnings per share attributable to 3M common shareholders – basic $ 2.62 $ 2.26 $ 5.42 $ 4.53
Weighted average 3M common shares outstanding – diluted 588.6 580.8 587.4 581.2
Earnings per share attributable to 3M common shareholders – diluted $ 2.59 $ 2.25 $ 5.36 $ 4.50
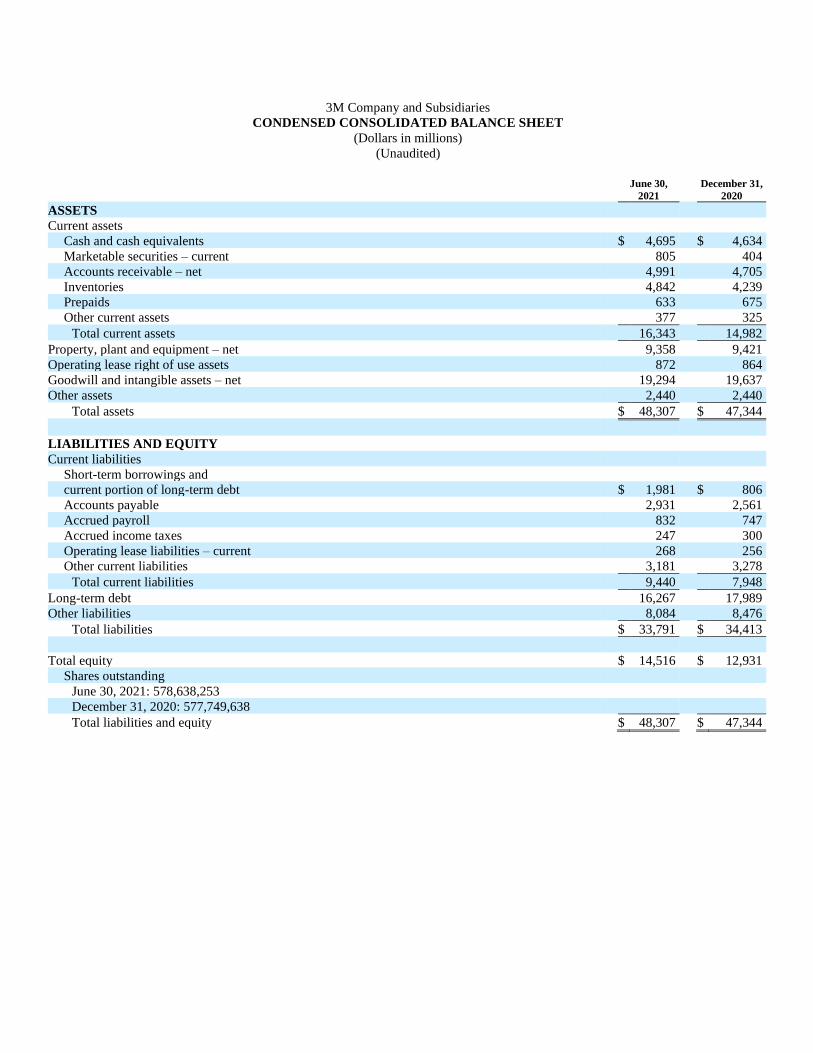
3M Company and Subsidiaries
CONDENSED CONSOLIDATED BALANCE SHEET
(Dollars in millions)
(Unaudited)
June 30, December 31,
2021 2020
ASSETS
Current assets
Cash and cash equivalents $ 4,695 $ 4,634
Marketable securities – current 805 404
Accounts receivable – net 4,991 4,705
Inventories 4,842 4,239
Prepaids 633 675
Other current assets 377 325
Total current assets 16,343 14,982
Property, plant and equipment – net 9,358 9,421
Operating lease right of use assets 872 864
Goodwill and intangible assets – net 19,294 19,637
Other assets 2,440 2,440
Total assets $ 48,307 $ 47,344
LIABILITIES AND EQUITY
Current liabilities
Short-term borrowings and
current portion of long-term debt $ 1,981 $ 806
Accounts payable 2,931 2,561
Accrued payroll 832 747
Accrued income taxes 247 300
Operating lease liabilities – current 268 256
Other current liabilities 3,181 3,278
Total current liabilities 9,440 7,948
Long-term debt 16,267 17,989
Other liabilities 8,084 8,476
Total liabilities $ 33,791 $ 34,413
Total equity $ 14,516 $ 12,931
Shares outstanding
June 30, 2021: 578,638,253
December 31, 2020: 577,749,638
Total liabilities and equity $ 48,307 $ 47,344
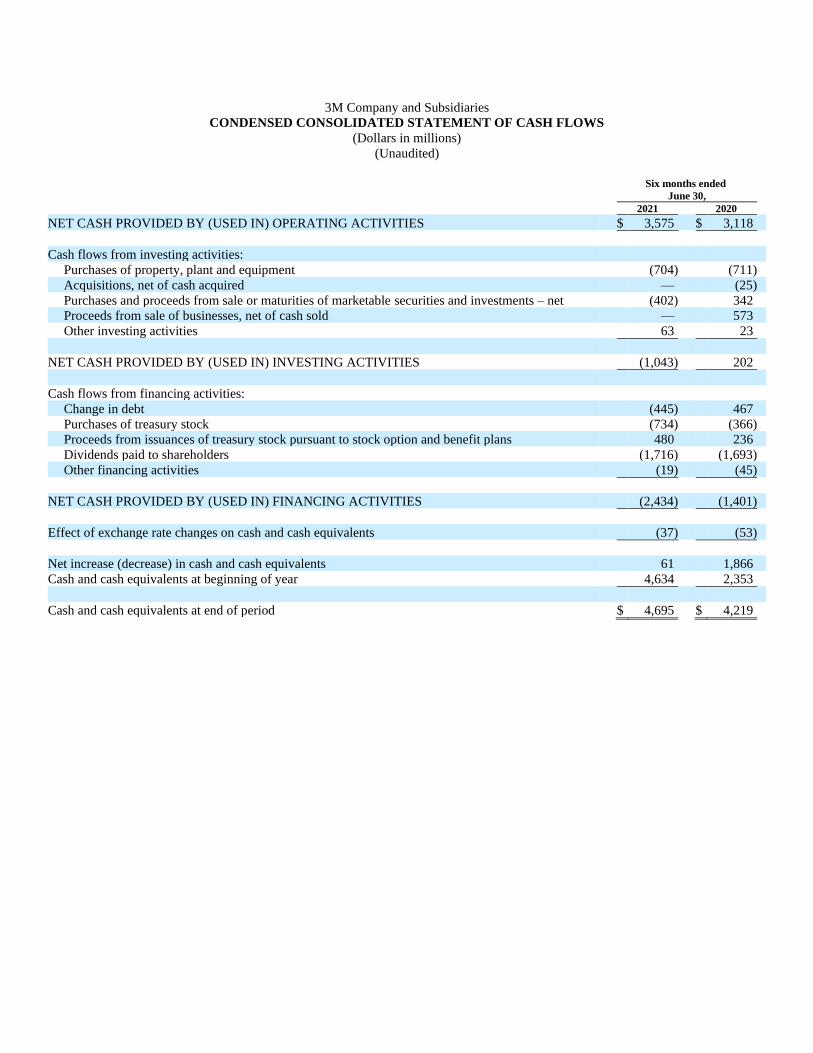
3M Company and Subsidiaries
CONDENSED CONSOLIDATED STATEMENT OF CASH FLOWS
(Dollars in millions)
(Unaudited)
Six months ended
June 30,
2021 2020
NET CASH PROVIDED BY (USED IN) OPERATING ACTIVITIES $ 3,575 $ 3,118
Cash flows from investing activities:
Purchases of property, plant and equipment (704) (711)
Acquisitions, net of cash acquired — (25)
Purchases and proceeds from sale or maturities of marketable securities and investments – net (402) 342
Proceeds from sale of businesses, net of cash sold — 573
Other investing activities 63 23
NET CASH PROVIDED BY (USED IN) INVESTING ACTIVITIES (1,043) 202
Cash flows from financing activities:
Change in debt (445) 467
Purchases of treasury stock (734) (366)
Proceeds from issuances of treasury stock pursuant to stock option and benefit plans 480 236
Dividends paid to shareholders (1,716) (1,693)
Other financing activities (19) (45)
NET CASH PROVIDED BY (USED IN) FINANCING ACTIVITIES (2,434) (1,401)
Effect of exchange rate changes on cash and cash equivalents (37) (53)
Net increase (decrease) in cash and cash equivalents 61 1,866
Cash and cash equivalents at beginning of year 4,634 2,353
Cash and cash equivalents at end of period $ 4,695 $ 4,219
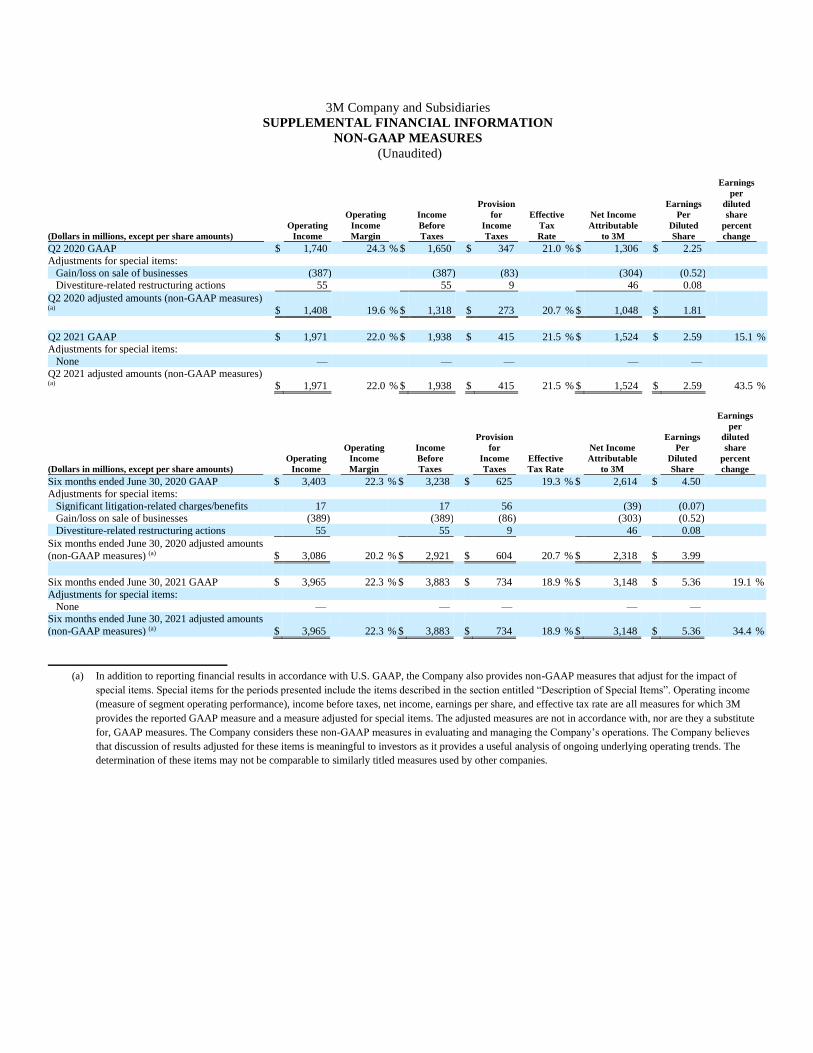
3M Company and Subsidiaries
SUPPLEMENTAL FINANCIAL INFORMATION
NON-GAAP MEASURES
(Unaudited)
(Dollars in millions, except per share amounts)
Operating
Income
Operating
Income
Margin
Income
Before
Taxes
Provision
for
Income
Taxes
Effective
Tax
Rate
Net Income
Attributable
to 3M
Earnings
Per
Diluted
Share
Earnings
per
diluted
share
percent
change
Q2 2020 GAAP $ 1,740 24.3 % $ 1,650 $ 347 21.0 % $ 1,306 $ 2.25
Adjustments for special items:
Gain/loss on sale of businesses (387) (387) (83) (304) (0.52) Divestiture-related restructuring actions 55 55 9 46 0.08
Q2 2020 adjusted amounts (non-GAAP measures) (a) $ 1,408 19.6 % $ 1,318 $ 273 20.7 % $ 1,048 $ 1.81
Q2 2021 GAAP $ 1,971 22.0 % $ 1,938 $ 415 21.5 % $ 1,524 $ 2.59 15.1 %
Adjustments for special items:
None — — — — —
Q2 2021 adjusted amounts (non-GAAP measures) (a) $ 1,971 22.0 % $ 1,938 $ 415 21.5 % $ 1,524 $ 2.59 43.5 %
(Dollars in millions, except per share amounts)
Operating
Income
Operating
Income
Margin
Income
Before
Taxes
Provision
for
Income
Taxes
Effective
Tax Rate
Net Income
Attributable
to 3M
Earnings
Per
Diluted
Share
Earnings
per
diluted
share
percent
change
Six months ended June 30, 2020 GAAP $ 3,403 22.3 % $ 3,238 $ 625 19.3 % $ 2,614 $ 4.50
Adjustments for special items:
Significant litigation-related charges/benefits 17 17 56 (39) (0.07) Gain/loss on sale of businesses (389) (389) (86) (303) (0.52)
Divestiture-related restructuring actions 55 55 9 46 0.08
Six months ended June 30, 2020 adjusted amounts
(non-GAAP measures) (a) $ 3,086 20.2 % $ 2,921 $ 604 20.7 % $ 2,318 $ 3.99
Six months ended June 30, 2021 GAAP $ 3,965 22.3 % $ 3,883 $ 734 18.9 % $ 3,148 $ 5.36 19.1 %
Adjustments for special items:
None — — — — — Six months ended June 30, 2021 adjusted amounts
(non-GAAP measures) (a) $ 3,965 22.3 % $ 3,883 $ 734 18.9 % $ 3,148 $ 5.36 34.4 %
(a) In addition to reporting financial results in accordance with U.S. GAAP, the Company also provides non-GAAP measures that adjust for the impact of
special items. Special items for the periods presented include the items described in the section entitled “Description of Special Items”. Operating income
(measure of segment operating performance), income before taxes, net income, earnings per share, and effective tax rate are all measures for which 3M
provides the reported GAAP measure and a measure adjusted for special items. The adjusted measures are not in accordance with, nor are they a substitute
for, GAAP measures. The Company considers these non-GAAP measures in evaluating and managing the Company’s operations. The Company believes
that discussion of results adjusted for these items is meaningful to investors as it provides a useful analysis of ongoing underlying operating trends. The
determination of these items may not be comparable to similarly titled measures used by other companies.
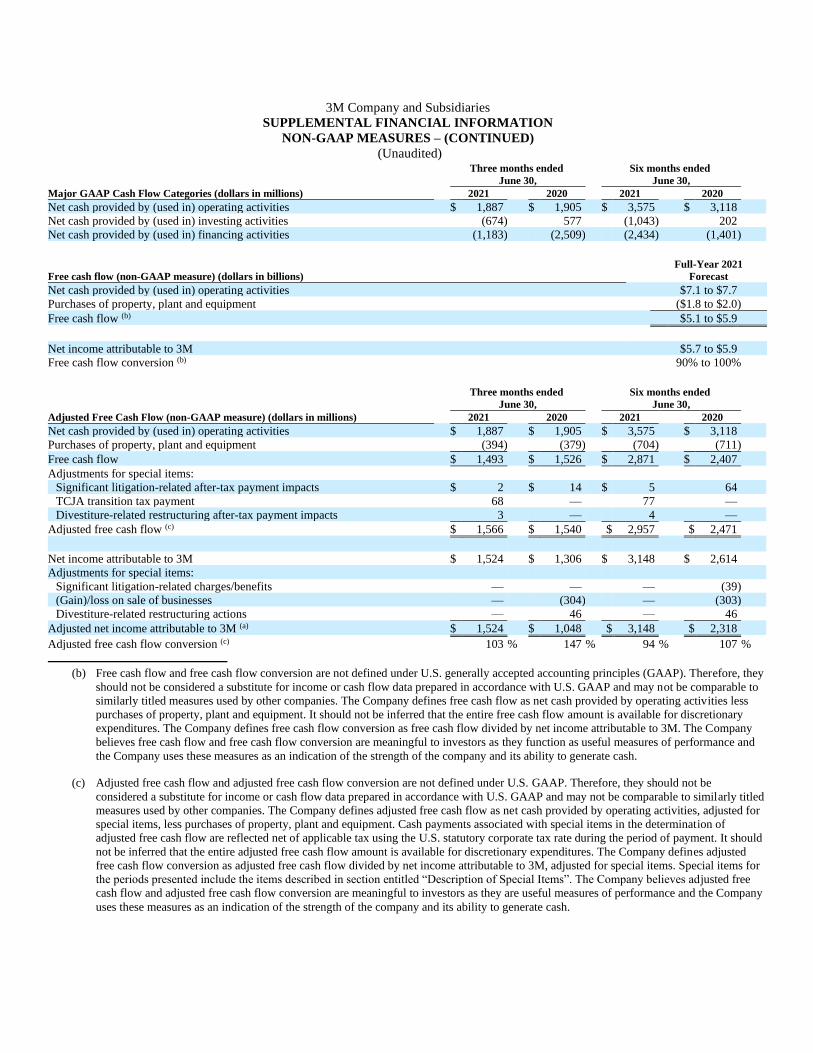
3M Company and Subsidiaries
SUPPLEMENTAL FINANCIAL INFORMATION
NON-GAAP MEASURES – (CONTINUED)
(Unaudited)
Three months ended Six months ended
June 30, June 30,
Major GAAP Cash Flow Categories (dollars in millions) 2021 2020 2021 2020
Net cash provided by (used in) operating activities $ 1,887 $ 1,905 $ 3,575 $ 3,118
Net cash provided by (used in) investing activities (674) 577 (1,043) 202
Net cash provided by (used in) financing activities (1,183) (2,509) (2,434) (1,401)
Full-Year 2021
Free cash flow (non-GAAP measure) (dollars in billions) Forecast
Net cash provided by (used in) operating activities $7.1 to $7.7
Purchases of property, plant and equipment ($1.8 to $2.0)
Free cash flow (b) $5.1 to $5.9
Net income attributable to 3M $5.7 to $5.9
Free cash flow conversion (b) 90% to 100%
Three months ended Six months ended
June 30, June 30,
Adjusted Free Cash Flow (non-GAAP measure) (dollars in millions) 2021 2020 2021 2020
Net cash provided by (used in) operating activities $ 1,887 $ 1,905 $ 3,575 $ 3,118
Purchases of property, plant and equipment (394) (379) (704) (711)
Free cash flow $ 1,493 $ 1,526 $ 2,871 $ 2,407
Adjustments for special items:
Significant litigation-related after-tax payment impacts $ 2 $ 14 $ 5 64
TCJA transition tax payment 68 — 77 —
Divestiture-related restructuring after-tax payment impacts 3 — 4 —
Adjusted free cash flow (c) $ 1,566 $ 1,540 $ 2,957 $ 2,471
Net income attributable to 3M $ 1,524 $ 1,306 $ 3,148 $ 2,614
Adjustments for special items:
Significant litigation-related charges/benefits — — — (39)
(Gain)/loss on sale of businesses — (304) — (303)
Divestiture-related restructuring actions — 46 — 46
Adjusted net income attributable to 3M (a) $ 1,524 $ 1,048 $ 3,148 $ 2,318
Adjusted free cash flow conversion (c) 103 % 147 % 94 % 107 %
(b) Free cash flow and free cash flow conversion are not defined under U.S. generally accepted accounting principles (GAAP). Therefore, they
should not be considered a substitute for income or cash flow data prepared in accordance with U.S. GAAP and may not be comparable to
similarly titled measures used by other companies. The Company defines free cash flow as net cash provided by operating activities less
purchases of property, plant and equipment. It should not be inferred that the entire free cash flow amount is available for discretionary
expenditures. The Company defines free cash flow conversion as free cash flow divided by net income attributable to 3M. The Company
believes free cash flow and free cash flow conversion are meaningful to investors as they function as useful measures of performance and
the Company uses these measures as an indication of the strength of the company and its ability to generate cash.
(c) Adjusted free cash flow and adjusted free cash flow conversion are not defined under U.S. GAAP. Therefore, they should not be
considered a substitute for income or cash flow data prepared in accordance with U.S. GAAP and may not be comparable to similarly titled
measures used by other companies. The Company defines adjusted free cash flow as net cash provided by operating activities, adjusted for
special items, less purchases of property, plant and equipment. Cash payments associated with special items in the determination of
adjusted free cash flow are reflected net of applicable tax using the U.S. statutory corporate tax rate during the period of payment. It should
not be inferred that the entire adjusted free cash flow amount is available for discretionary expenditures. The Company defines adjusted
free cash flow conversion as adjusted free cash flow divided by net income attributable to 3M, adjusted for special items. Special items for
the periods presented include the items described in section entitled “Description of Special Items”. The Company believes adjusted free
cash flow and adjusted free cash flow conversion are meaningful to investors as they are useful measures of performance and the Company
uses these measures as an indication of the strength of the company and its ability to generate cash.
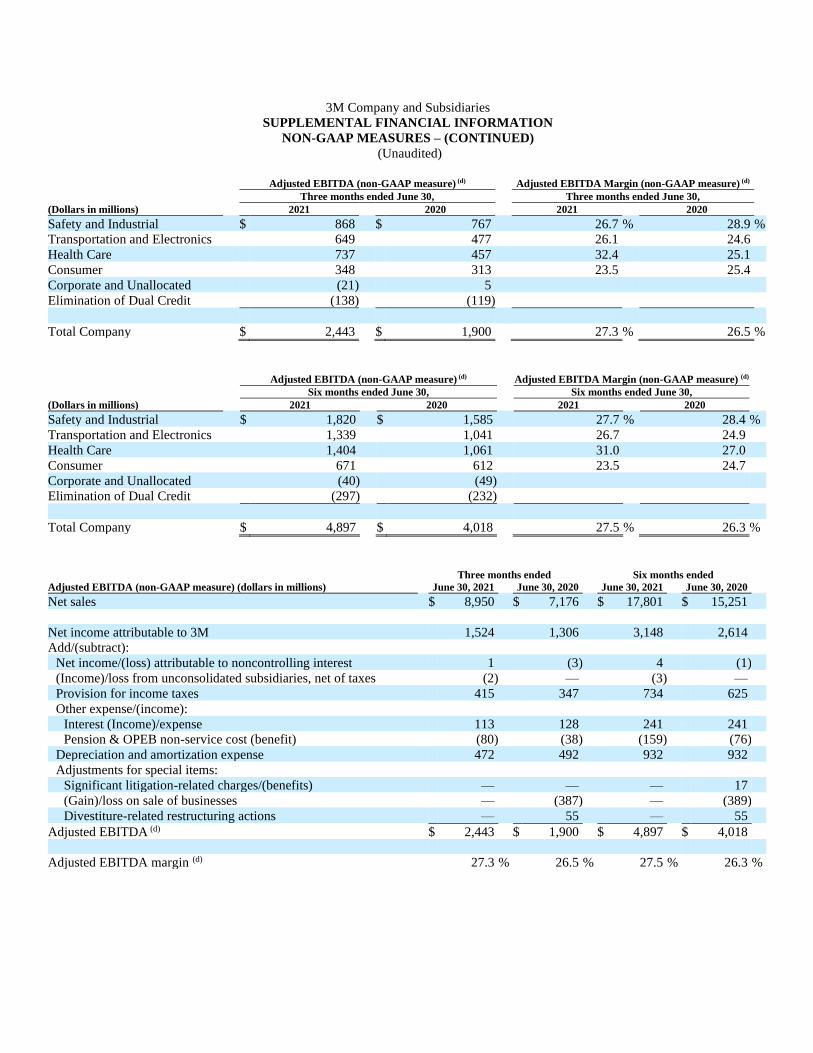
3M Company and Subsidiaries
SUPPLEMENTAL FINANCIAL INFORMATION
NON-GAAP MEASURES – (CONTINUED)
(Unaudited)
Adjusted EBITDA (non-GAAP measure) (d) Adjusted EBITDA Margin (non-GAAP measure) (d)
Three months ended June 30, Three months ended June 30,
(Dollars in millions) 2021 2020 2021 2020
Safety and Industrial $ 868 $ 767 26.7 % 28.9 %
Transportation and Electronics 649 477 26.1 24.6
Health Care 737 457 32.4 25.1
Consumer 348 313 23.5 25.4
Corporate and Unallocated (21) 5
Elimination of Dual Credit (138) (119)
Total Company $ 2,443 $ 1,900 27.3 % 26.5 %
Adjusted EBITDA (non-GAAP measure) (d) Adjusted EBITDA Margin (non-GAAP measure) (d)
Six months ended June 30, Six months ended June 30,
(Dollars in millions) 2021 2020 2021 2020
Safety and Industrial $ 1,820 $ 1,585 27.7 % 28.4 %
Transportation and Electronics 1,339 1,041 26.7 24.9
Health Care 1,404 1,061 31.0 27.0
Consumer 671 612 23.5 24.7
Corporate and Unallocated (40) (49)
Elimination of Dual Credit (297) (232)
Total Company $ 4,897 $ 4,018 27.5 % 26.3 %
Three months ended Six months ended
Adjusted EBITDA (non-GAAP measure) (dollars in millions) June 30, 2021 June 30, 2020 June 30, 2021 June 30, 2020
Net sales $ 8,950 $ 7,176 $ 17,801 $ 15,251
Net income attributable to 3M 1,524 1,306 3,148 2,614
Add/(subtract):
Net income/(loss) attributable to noncontrolling interest 1 (3) 4 (1)
(Income)/loss from unconsolidated subsidiaries, net of taxes (2) — (3) —
Provision for income taxes 415 347 734 625
Other expense/(income):
Interest (Income)/expense 113 128 241 241
Pension & OPEB non-service cost (benefit) (80) (38) (159) (76)
Depreciation and amortization expense 472 492 932 932
Adjustments for special items:
Significant litigation-related charges/(benefits) — — — 17
(Gain)/loss on sale of businesses — (387) — (389)
Divestiture-related restructuring actions — 55 — 55
Adjusted EBITDA (d) $ 2,443 $ 1,900 $ 4,897 $ 4,018
Adjusted EBITDA margin (d) 27.3 % 26.5 % 27.5 % 26.3 %
3M Company and Subsidiaries
SUPPLEMENTAL FINANCIAL INFORMATION
NON-GAAP MEASURES – (CONTINUED)
(Unaudited)
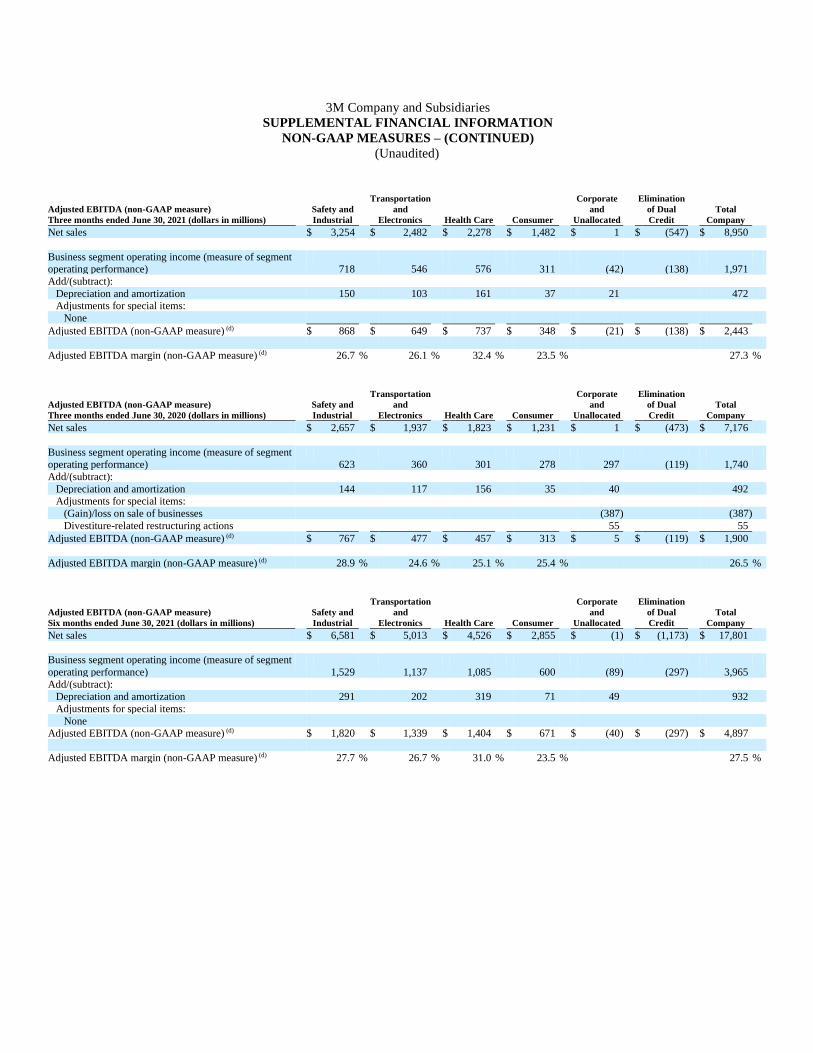
Adjusted EBITDA (non-GAAP measure)
Three months ended June 30, 2021 (dollars in millions)
Safety and
Industrial
Transportation
and
Electronics Health Care Consumer
Corporate
and
Unallocated
Elimination
of Dual
Credit
Total
Company
Net sales $ 3,254 $ 2,482 $ 2,278 $ 1,482 $ 1 $ (547) $ 8,950
Business segment operating income (measure of segment operating performance) 718 546 576 311 (42) (138) 1,971
Add/(subtract):
Depreciation and amortization 150 103 161 37 21 472 Adjustments for special items:
None
Adjusted EBITDA (non-GAAP measure) (d) $ 868 $ 649 $ 737 $ 348 $ (21) $ (138) $ 2,443
Adjusted EBITDA margin (non-GAAP measure) (d) 26.7 % 26.1 % 32.4 % 23.5 % 27.3 %
Adjusted EBITDA (non-GAAP measure)
Three months ended June 30, 2020 (dollars in millions)
Safety and
Industrial
Transportation
and
Electronics Health Care Consumer
Corporate
and
Unallocated
Elimination
of Dual
Credit
Total
Company
Net sales $ 2,657 $ 1,937 $ 1,823 $ 1,231 $ 1 $ (473) $ 7,176
Business segment operating income (measure of segment operating performance) 623 360 301 278 297 (119) 1,740
Add/(subtract):
Depreciation and amortization 144 117 156 35 40 492 Adjustments for special items:
(Gain)/loss on sale of businesses (387) (387)
Divestiture-related restructuring actions 55 55
Adjusted EBITDA (non-GAAP measure) (d) $ 767 $ 477 $ 457 $ 313 $ 5 $ (119) $ 1,900
Adjusted EBITDA margin (non-GAAP measure) (d) 28.9 % 24.6 % 25.1 % 25.4 % 26.5 %
Adjusted EBITDA (non-GAAP measure)
Six months ended June 30, 2021 (dollars in millions)
Safety and
Industrial
Transportation
and
Electronics Health Care Consumer
Corporate
and
Unallocated
Elimination
of Dual
Credit
Total
Company
Net sales $ 6,581 $ 5,013 $ 4,526 $ 2,855 $ (1) $ (1,173) $ 17,801
Business segment operating income (measure of segment
operating performance) 1,529 1,137 1,085 600 (89) (297) 3,965
Add/(subtract): Depreciation and amortization 291 202 319 71 49 932
Adjustments for special items:
None Adjusted EBITDA (non-GAAP measure) (d) $ 1,820 $ 1,339 $ 1,404 $ 671 $ (40) $ (297) $ 4,897
Adjusted EBITDA margin (non-GAAP measure) (d) 27.7 % 26.7 % 31.0 % 23.5 % 27.5 %
3M Company and Subsidiaries
SUPPLEMENTAL FINANCIAL INFORMATION
NON-GAAP MEASURES – (CONTINUED)
(Unaudited)
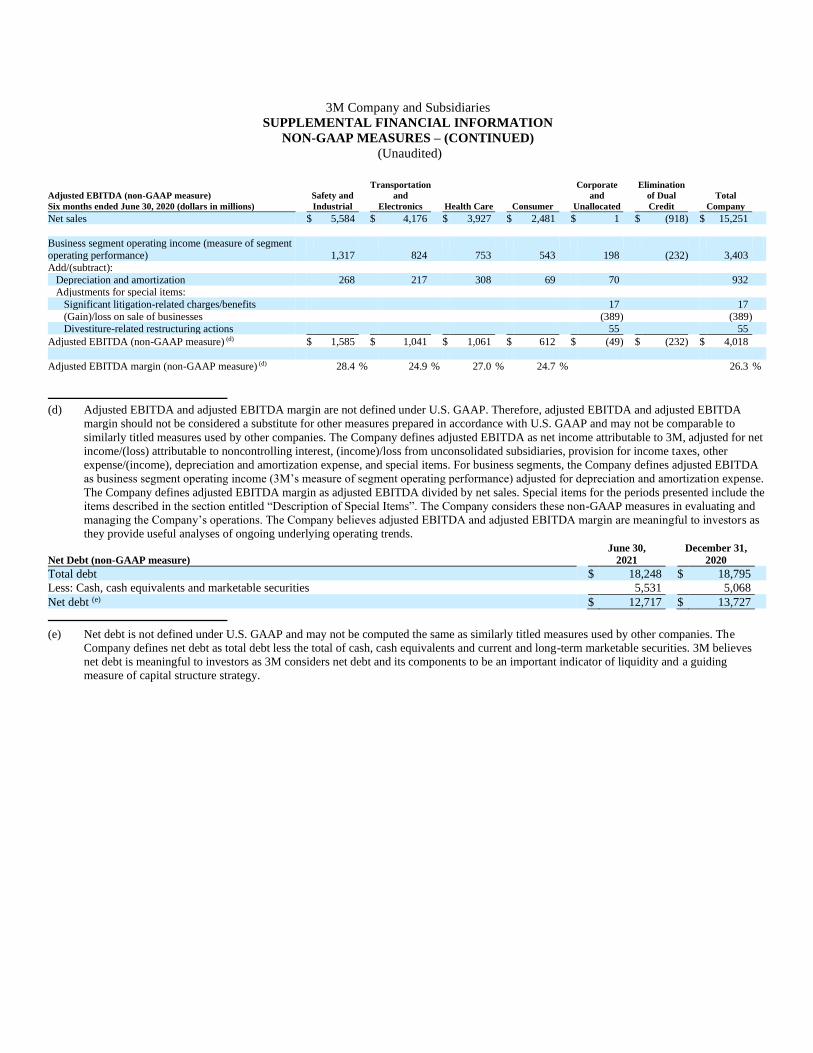
(d) Adjusted EBITDA and adjusted EBITDA margin are not defined under U.S. GAAP. Therefore, adjusted EBITDA and adjusted EBITDA
margin should not be considered a substitute for other measures prepared in accordance with U.S. GAAP and may not be comparable to
similarly titled measures used by other companies. The Company defines adjusted EBITDA as net income attributable to 3M, adjusted for net
income/(loss) attributable to noncontrolling interest, (income)/loss from unconsolidated subsidiaries, provision for income taxes, other
expense/(income), depreciation and amortization expense, and special items. For business segments, the Company defines adjusted EBITDA
as business segment operating income (3M’s measure of segment operating performance) adjusted for depreciation and amortization expense.
The Company defines adjusted EBITDA margin as adjusted EBITDA divided by net sales. Special items for the periods presented include the
items described in the section entitled “Description of Special Items”. The Company considers these non-GAAP measures in evaluating and
managing the Company’s operations. The Company believes adjusted EBITDA and adjusted EBITDA margin are meaningful to investors as
they provide useful analyses of ongoing underlying operating trends.
June 30, December 31,
Net Debt (non-GAAP measure) 2021 2020
Total debt $ 18,248 $ 18,795
Less: Cash, cash equivalents and marketable securities 5,531 5,068
Net debt (e) $ 12,717 $ 13,727
(e) Net debt is not defined under U.S. GAAP and may not be computed the same as similarly titled measures used by other companies. The
Company defines net debt as total debt less the total of cash, cash equivalents and current and long-term marketable securities. 3M believes
net debt is meaningful to investors as 3M considers net debt and its components to be an important indicator of liquidity and a guiding
measure of capital structure strategy.
Adjusted EBITDA (non-GAAP measure)
Six months ended June 30, 2020 (dollars in millions)
Safety and
Industrial
Transportation
and
Electronics Health Care Consumer
Corporate
and
Unallocated
Elimination
of Dual
Credit
Total
Company
Net sales $ 5,584 $ 4,176 $ 3,927 $ 2,481 $ 1 $ (918) $ 15,251
Business segment operating income (measure of segment operating performance) 1,317 824 753 543 198 (232) 3,403
Add/(subtract):
Depreciation and amortization 268 217 308 69 70 932 Adjustments for special items:
Significant litigation-related charges/benefits 17 17
(Gain)/loss on sale of businesses (389) (389) Divestiture-related restructuring actions 55 55
Adjusted EBITDA (non-GAAP measure) (d) $ 1,585 $ 1,041 $ 1,061 $ 612 $ (49) $ (232) $ 4,018
Adjusted EBITDA margin (non-GAAP measure) (d) 28.4 % 24.9 % 27.0 % 24.7 % 26.3 %
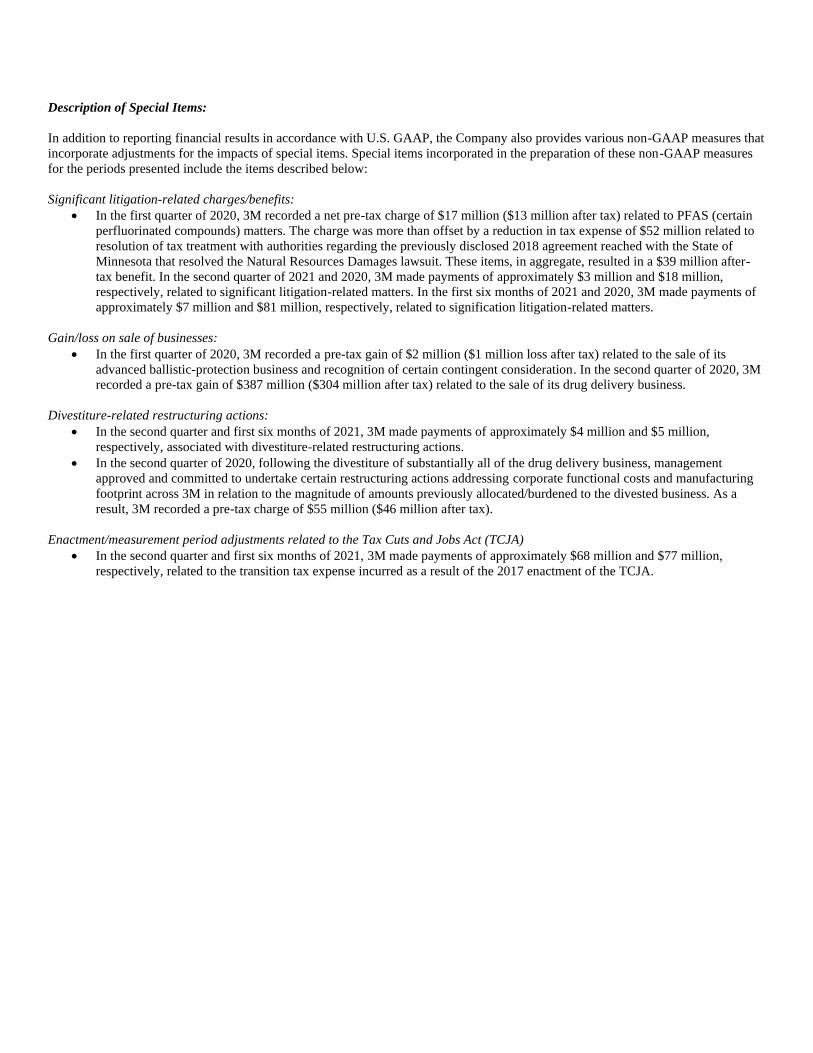
Description of Special Items:
In addition to reporting financial results in accordance with U.S. GAAP, the Company also provides various non-GAAP measures that
incorporate adjustments for the impacts of special items. Special items incorporated in the preparation of these non-GAAP measures
for the periods presented include the items described below:
Significant litigation-related charges/benefits:
• In the first quarter of 2020, 3M recorded a net pre-tax charge of $17 million ($13 million after tax) related to PFAS (certain
perfluorinated compounds) matters. The charge was more than offset by a reduction in tax expense of $52 million related to
resolution of tax treatment with authorities regarding the previously disclosed 2018 agreement reached with the State of
Minnesota that resolved the Natural Resources Damages lawsuit. These items, in aggregate, resulted in a $39 million after-
tax benefit. In the second quarter of 2021 and 2020, 3M made payments of approximately $3 million and $18 million,
respectively, related to significant litigation-related matters. In the first six months of 2021 and 2020, 3M made payments of
approximately $7 million and $81 million, respectively, related to signification litigation-related matters.
Gain/loss on sale of businesses:
• In the first quarter of 2020, 3M recorded a pre-tax gain of $2 million ($1 million loss after tax) related to the sale of its
advanced ballistic-protection business and recognition of certain contingent consideration. In the second quarter of 2020, 3M
recorded a pre-tax gain of $387 million ($304 million after tax) related to the sale of its drug delivery business.
Divestiture-related restructuring actions:
• In the second quarter and first six months of 2021, 3M made payments of approximately $4 million and $5 million,
respectively, associated with divestiture-related restructuring actions.
• In the second quarter of 2020, following the divestiture of substantially all of the drug delivery business, management
approved and committed to undertake certain restructuring actions addressing corporate functional costs and manufacturing
footprint across 3M in relation to the magnitude of amounts previously allocated/burdened to the divested business. As a
result, 3M recorded a pre-tax charge of $55 million ($46 million after tax).
Enactment/measurement period adjustments related to the Tax Cuts and Jobs Act (TCJA)
• In the second quarter and first six months of 2021, 3M made payments of approximately $68 million and $77 million,
respectively, related to the transition tax expense incurred as a result of the 2017 enactment of the TCJA.
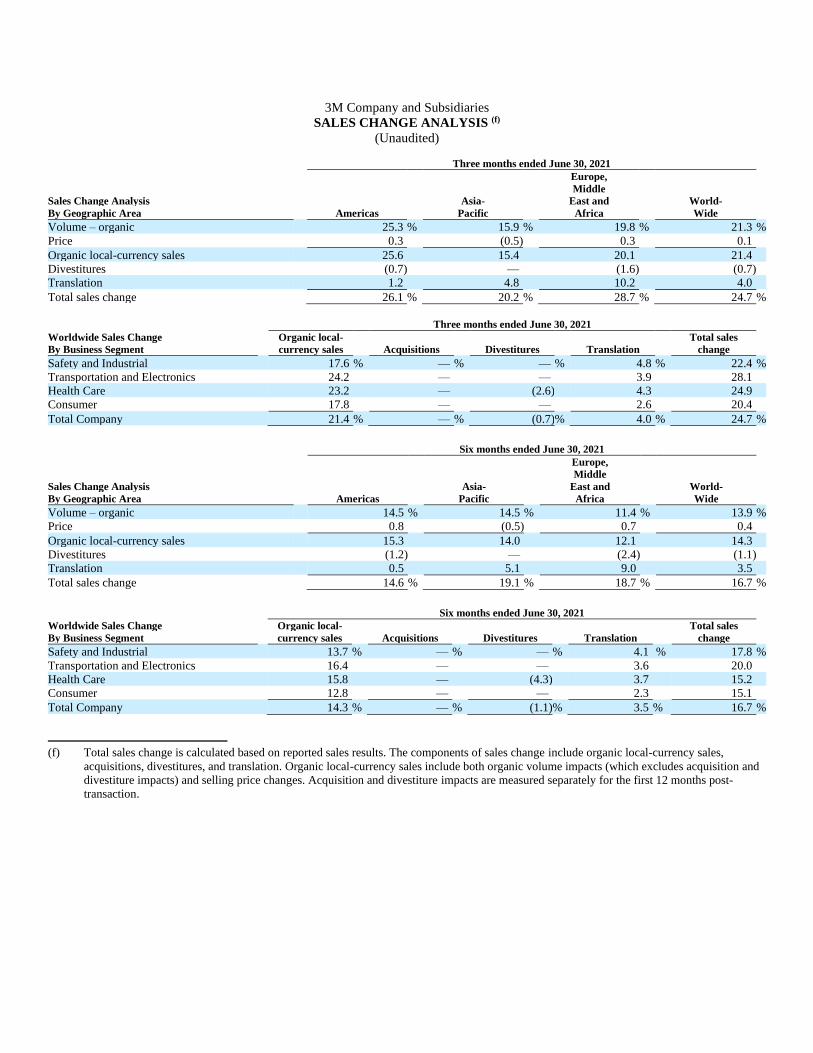
3M Company and Subsidiaries
SALES CHANGE ANALYSIS (f)
(Unaudited)
Three months ended June 30, 2021
Europe,
Middle
Sales Change Analysis Asia- East and World-
By Geographic Area Americas Pacific Africa Wide
Volume – organic 25.3 % 15.9 % 19.8 % 21.3 %
Price 0.3 (0.5) 0.3 0.1
Organic local-currency sales 25.6 15.4 20.1 21.4
Divestitures (0.7) — (1.6) (0.7)
Translation 1.2 4.8 10.2 4.0
Total sales change 26.1 % 20.2 % 28.7 % 24.7 %
Three months ended June 30, 2021
Worldwide Sales Change Organic local- Total sales
By Business Segment currency sales Acquisitions Divestitures Translation change
Safety and Industrial 17.6 % — % — % 4.8 % 22.4 %
Transportation and Electronics 24.2 — — 3.9 28.1
Health Care 23.2 — (2.6) 4.3 24.9
Consumer 17.8 — — 2.6 20.4
Total Company 21.4 % — % (0.7) % 4.0 % 24.7 %
Six months ended June 30, 2021
Europe,
Middle
Sales Change Analysis Asia- East and World-
By Geographic Area Americas Pacific Africa Wide
Volume – organic 14.5 % 14.5 % 11.4 % 13.9 %
Price 0.8 (0.5) 0.7 0.4
Organic local-currency sales 15.3 14.0 12.1 14.3
Divestitures (1.2) — (2.4) (1.1)
Translation 0.5 5.1 9.0 3.5
Total sales change 14.6 % 19.1 % 18.7 % 16.7 %
Six months ended June 30, 2021
Worldwide Sales Change Organic local- Total sales
By Business Segment currency sales Acquisitions Divestitures Translation change
Safety and Industrial 13.7 % — % — % 4.1 % 17.8 %
Transportation and Electronics 16.4 — — 3.6 20.0
Health Care 15.8 — (4.3) 3.7 15.2
Consumer 12.8 — — 2.3 15.1
Total Company 14.3 % — % (1.1) % 3.5 % 16.7 %
(f) Total sales change is calculated based on reported sales results. The components of sales change include organic local-currency sales,
acquisitions, divestitures, and translation. Organic local-currency sales include both organic volume impacts (which excludes acquisition and
divestiture impacts) and selling price changes. Acquisition and divestiture impacts are measured separately for the first 12 months post-
transaction.
3M Company and Subsidiaries
BUSINESS SEGMENTS
(Unaudited)
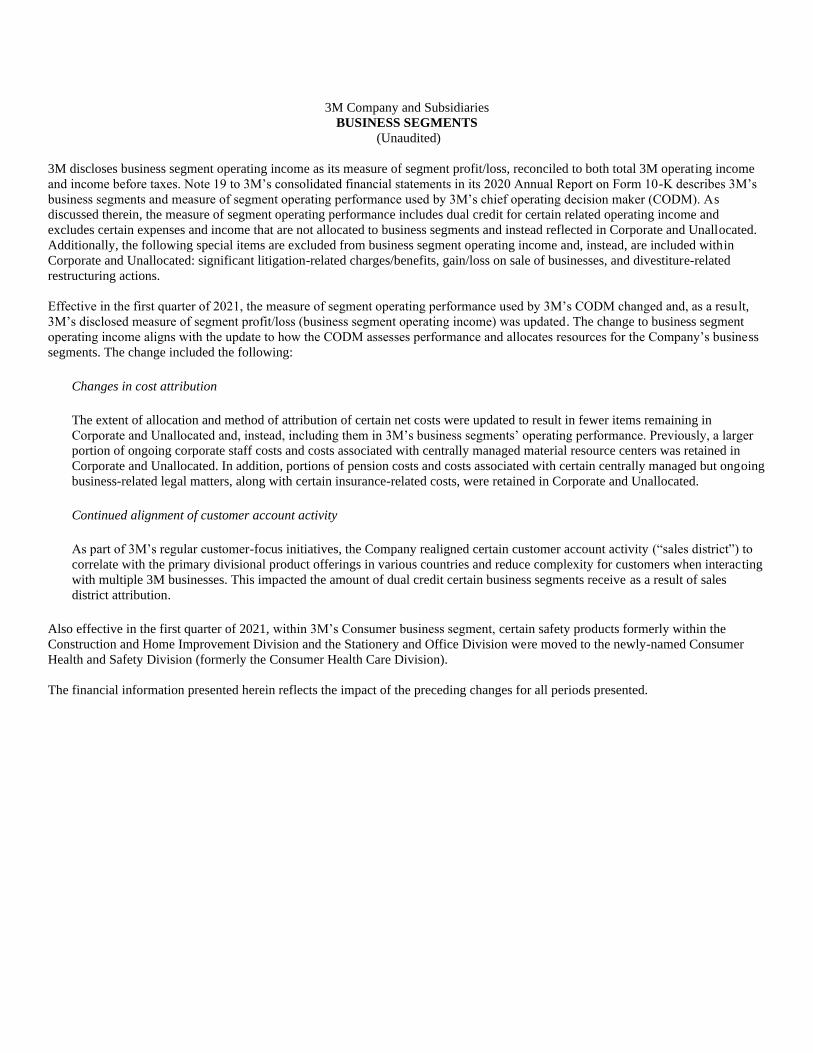
3M discloses business segment operating income as its measure of segment profit/loss, reconciled to both total 3M operating income
and income before taxes. Note 19 to 3M’s consolidated financial statements in its 2020 Annual Report on Form 10-K describes 3M’s
business segments and measure of segment operating performance used by 3M’s chief operating decision maker (CODM). As
discussed therein, the measure of segment operating performance includes dual credit for certain related operating income and
excludes certain expenses and income that are not allocated to business segments and instead reflected in Corporate and Unallocated.
Additionally, the following special items are excluded from business segment operating income and, instead, are included within
Corporate and Unallocated: significant litigation-related charges/benefits, gain/loss on sale of businesses, and divestiture-related
restructuring actions.
Effective in the first quarter of 2021, the measure of segment operating performance used by 3M’s CODM changed and, as a result,
3M’s disclosed measure of segment profit/loss (business segment operating income) was updated. The change to business segment
operating income aligns with the update to how the CODM assesses performance and allocates resources for the Company’s business
segments. The change included the following:
Changes in cost attribution
The extent of allocation and method of attribution of certain net costs were updated to result in fewer items remaining in
Corporate and Unallocated and, instead, including them in 3M’s business segments’ operating performance. Previously, a larger
portion of ongoing corporate staff costs and costs associated with centrally managed material resource centers was retained in
Corporate and Unallocated. In addition, portions of pension costs and costs associated with certain centrally managed but ongoing
business-related legal matters, along with certain insurance-related costs, were retained in Corporate and Unallocated.
Continued alignment of customer account activity
As part of 3M’s regular customer-focus initiatives, the Company realigned certain customer account activity (“sales district”) to
correlate with the primary divisional product offerings in various countries and reduce complexity for customers when interacting
with multiple 3M businesses. This impacted the amount of dual credit certain business segments receive as a result of sales
district attribution.
Also effective in the first quarter of 2021, within 3M’s Consumer business segment, certain safety products formerly within the
Construction and Home Improvement Division and the Stationery and Office Division were moved to the newly-named Consumer
Health and Safety Division (formerly the Consumer Health Care Division).
The financial information presented herein reflects the impact of the preceding changes for all periods presented.
3M Company and Subsidiaries
BUSINESS SEGMENTS– (CONTINUED)
(Unaudited)
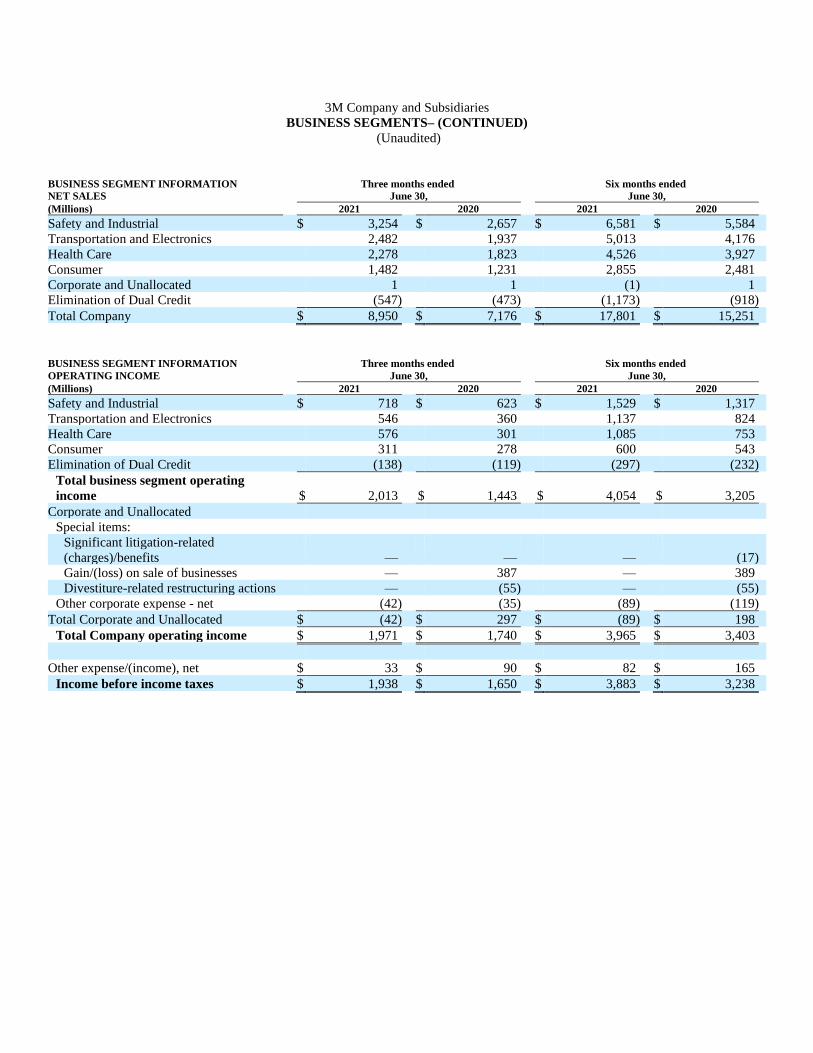
BUSINESS SEGMENT INFORMATION Three months ended Six months ended
NET SALES June 30, June 30,
(Millions) 2021 2020 2021 2020
Safety and Industrial $ 3,254 $ 2,657 $ 6,581 $ 5,584
Transportation and Electronics 2,482 1,937 5,013 4,176
Health Care 2,278 1,823 4,526 3,927
Consumer 1,482 1,231 2,855 2,481
Corporate and Unallocated 1 1 (1) 1
Elimination of Dual Credit (547) (473) (1,173) (918)
Total Company $ 8,950 $ 7,176 $ 17,801 $ 15,251
BUSINESS SEGMENT INFORMATION Three months ended Six months ended
OPERATING INCOME June 30, June 30,
(Millions) 2021 2020 2021 2020
Safety and Industrial $ 718 $ 623 $ 1,529 $ 1,317
Transportation and Electronics 546 360 1,137 824
Health Care 576 301 1,085 753
Consumer 311 278 600 543
Elimination of Dual Credit (138) (119) (297) (232)
Total business segment operating
income $ 2,013 $ 1,443 $ 4,054 $ 3,205
Corporate and Unallocated
Special items:
Significant litigation-related
(charges)/benefits — — — (17)
Gain/(loss) on sale of businesses — 387 — 389
Divestiture-related restructuring actions — (55) — (55)
Other corporate expense - net (42) (35) (89) (119)
Total Corporate and Unallocated $ (42) $ 297 $ (89) $ 198
Total Company operating income $ 1,971 $ 1,740 $ 3,965 $ 3,403
Other expense/(income), net $ 33 $ 90 $ 82 $ 165
Income before income taxes $ 1,938 $ 1,650 $ 3,883 $ 3,238
About 3M
At 3M, we apply science in collaborative ways to improve lives daily as our employees connect with customers
all around the world. Learn more about 3M’s creative solutions to the world’s problems at www.3M.com or on
Twitter @3M or @3MNews.
Contacts 3M
Investor Contacts:
Bruce Jermeland, 651-733-1807
or
Tony Riter, 651-733-1141
or
Media Contact:
Tim Post, 651-733-9789