SECOND QUARTER 2018 RESULTS...• Third consecutive quarter of organic sales growth • Second...
14
Confidential and Proprietary of R. R. Donnelley & Sons Company. All rights reserved. SECOND QUARTER 2018 RESULTS Dan Knotts, CEO Terry Peterson, CFO AUGUST 2, 2018
Transcript of SECOND QUARTER 2018 RESULTS...• Third consecutive quarter of organic sales growth • Second...

Confidential and Proprietary of R. R. Donnelley & Sons Company. All rights reserved.
SECOND QUARTER 2018 RESULTSDan Knotts, CEOTerry Peterson, CFO
AUGUST 2, 2018
2
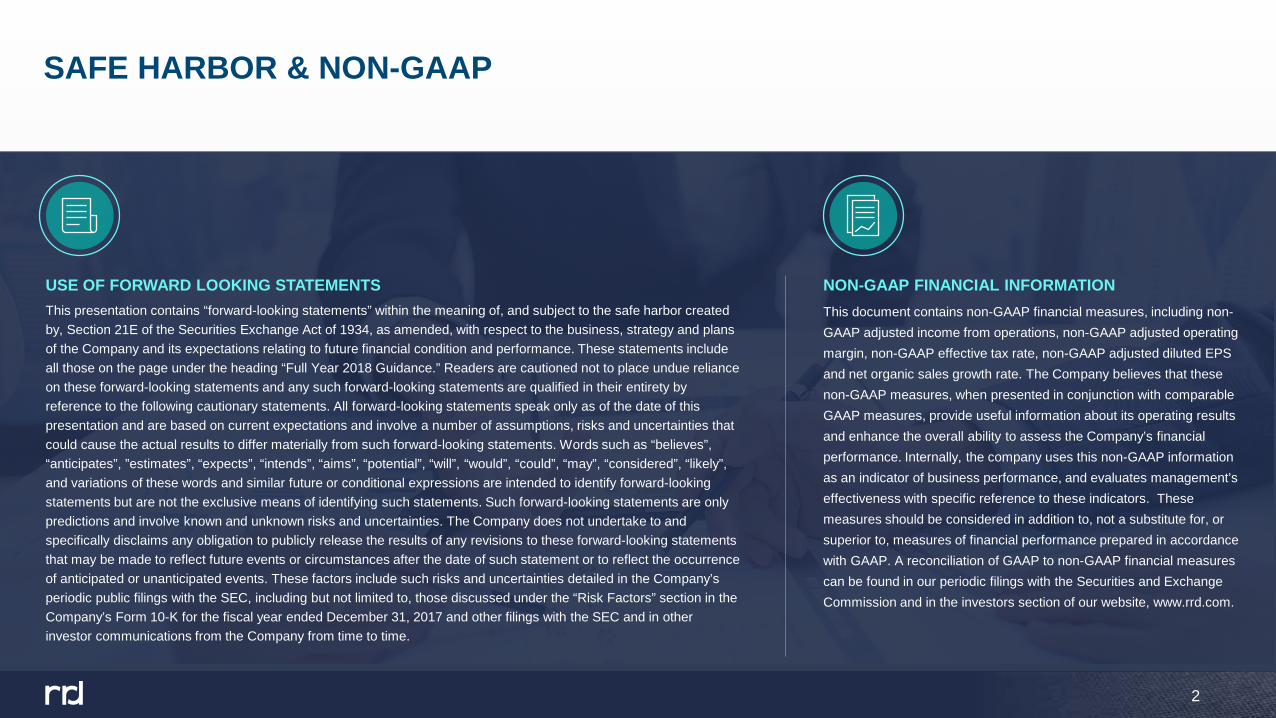
USE OF FORWARD LOOKING STATEMENTS NON-GAAP FINANCIAL INFORMATIONThis presentation contains “forward-looking statements” within the meaning of, and subject to the safe harbor created by, Section 21E of the Securities Exchange Act of 1934, as amended, with respect to the business, strategy and plans of the Company and its expectations relating to future financial condition and performance. These statements include all those on the page under the heading “Full Year 2018 Guidance.” Readers are cautioned not to place undue reliance on these forward-looking statements and any such forward-looking statements are qualified in their entirety by reference to the following cautionary statements. All forward-looking statements speak only as of the date of this presentation and are based on current expectations and involve a number of assumptions, risks and uncertainties that could cause the actual results to differ materially from such forward-looking statements. Words such as “believes”, “anticipates”, ”estimates”, “expects”, “intends”, “aims”, “potential”, “will”, “would”, “could”, “may”, “considered”, “likely”, and variations of these words and similar future or conditional expressions are intended to identify forward-looking statements but are not the exclusive means of identifying such statements. Such forward-looking statements are only predictions and involve known and unknown risks and uncertainties. The Company does not undertake to and specifically disclaims any obligation to publicly release the results of any revisions to these forward-looking statements that may be made to reflect future events or circumstances after the date of such statement or to reflect the occurrence of anticipated or unanticipated events. These factors include such risks and uncertainties detailed in the Company’s periodic public filings with the SEC, including but not limited to, those discussed under the “Risk Factors” section in the Company’s Form 10-K for the fiscal year ended December 31, 2017 and other filings with the SEC and in other investor communications from the Company from time to time.
This document contains non-GAAP financial measures, including non-GAAP adjusted income from operations, non-GAAP adjusted operating margin, non-GAAP effective tax rate, non-GAAP adjusted diluted EPS and net organic sales growth rate. The Company believes that these non-GAAP measures, when presented in conjunction with comparable GAAP measures, provide useful information about its operating results and enhance the overall ability to assess the Company’s financial performance. Internally, the company uses this non-GAAP information as an indicator of business performance, and evaluates management’s effectiveness with specific reference to these indicators. These measures should be considered in addition to, not a substitute for, or superior to, measures of financial performance prepared in accordance with GAAP. A reconciliation of GAAP to non-GAAP financial measures can be found in our periodic filings with the Securities and Exchange Commission and in the investors section of our website, www.rrd.com.
SAFE HARBOR & NON-GAAP
3
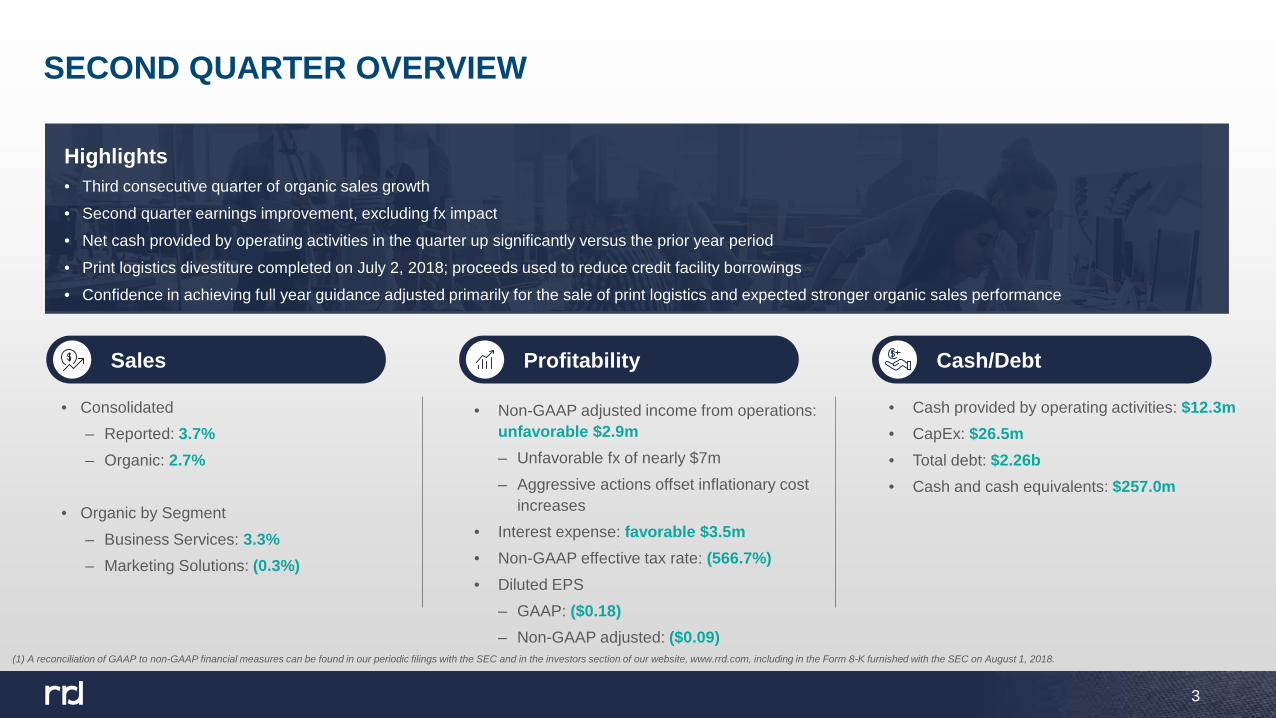
Highlights• Third consecutive quarter of organic sales growth• Second quarter earnings improvement, excluding fx impact• Net cash provided by operating activities in the quarter up significantly versus the prior year period• Print logistics divestiture completed on July 2, 2018; proceeds used to reduce credit facility borrowings• Confidence in achieving full year guidance adjusted primarily for the sale of print logistics and expected stronger organic sales performance
SECOND QUARTER OVERVIEW
• Consolidated– Reported: 3.7%– Organic: 2.7%
• Organic by Segment– Business Services: 3.3%– Marketing Solutions: (0.3%)
• Non-GAAP adjusted income from operations: unfavorable $2.9m– Unfavorable fx of nearly $7m– Aggressive actions offset inflationary cost
increases• Interest expense: favorable $3.5m• Non-GAAP effective tax rate: (566.7%)• Diluted EPS
– GAAP: ($0.18)– Non-GAAP adjusted: ($0.09)
• Cash provided by operating activities: $12.3m• CapEx: $26.5m• Total debt: $2.26b• Cash and cash equivalents: $257.0m
Sales Profitability Cash/Debt
(1) A reconciliation of GAAP to non-GAAP financial measures can be found in our periodic filings with the SEC and in the investors section of our website, www.rrd.com, including in the Form 8-K furnished with the SEC on August 1, 2018.
4
DISCIPLINED APPROACH TO CAPITAL ALLOCATION
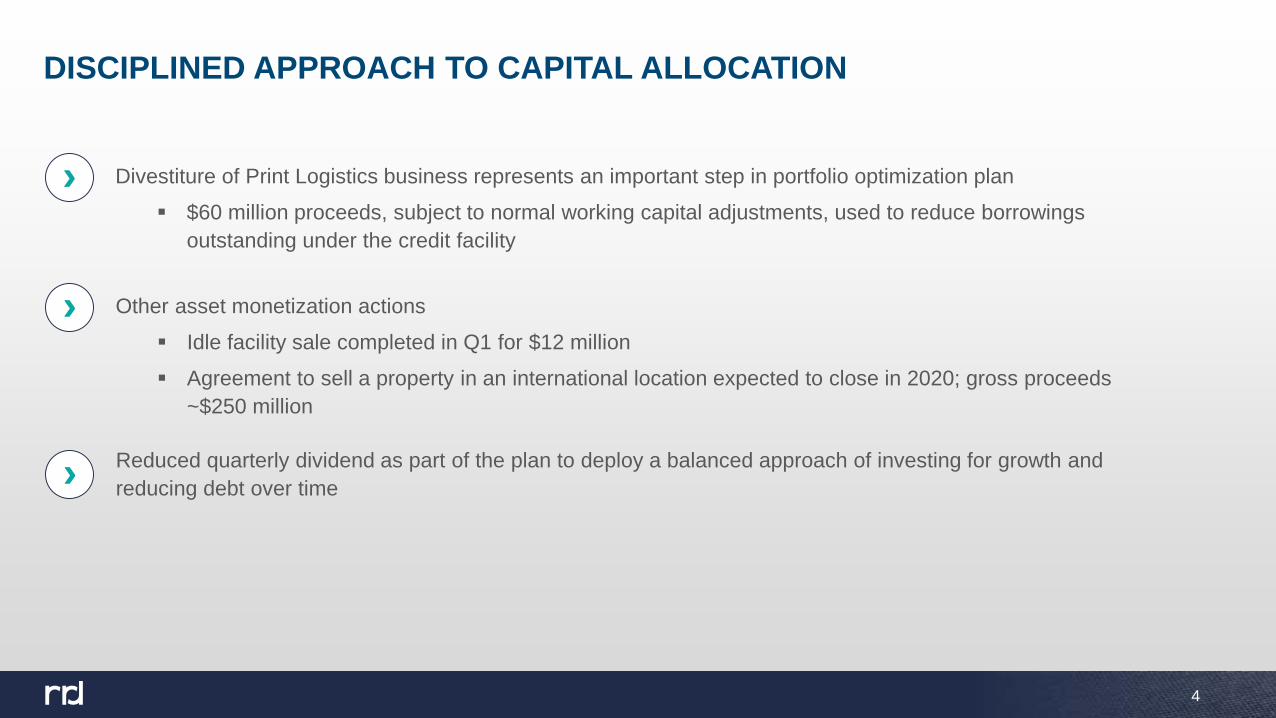
Divestiture of Print Logistics business represents an important step in portfolio optimization plan $60 million proceeds, subject to normal working capital adjustments, used to reduce borrowings
outstanding under the credit facility
›
›
Reduced quarterly dividend as part of the plan to deploy a balanced approach of investing for growth and reducing debt over time›
Other asset monetization actions Idle facility sale completed in Q1 for $12 million Agreement to sell a property in an international location expected to close in 2020; gross proceeds
~$250 million
5
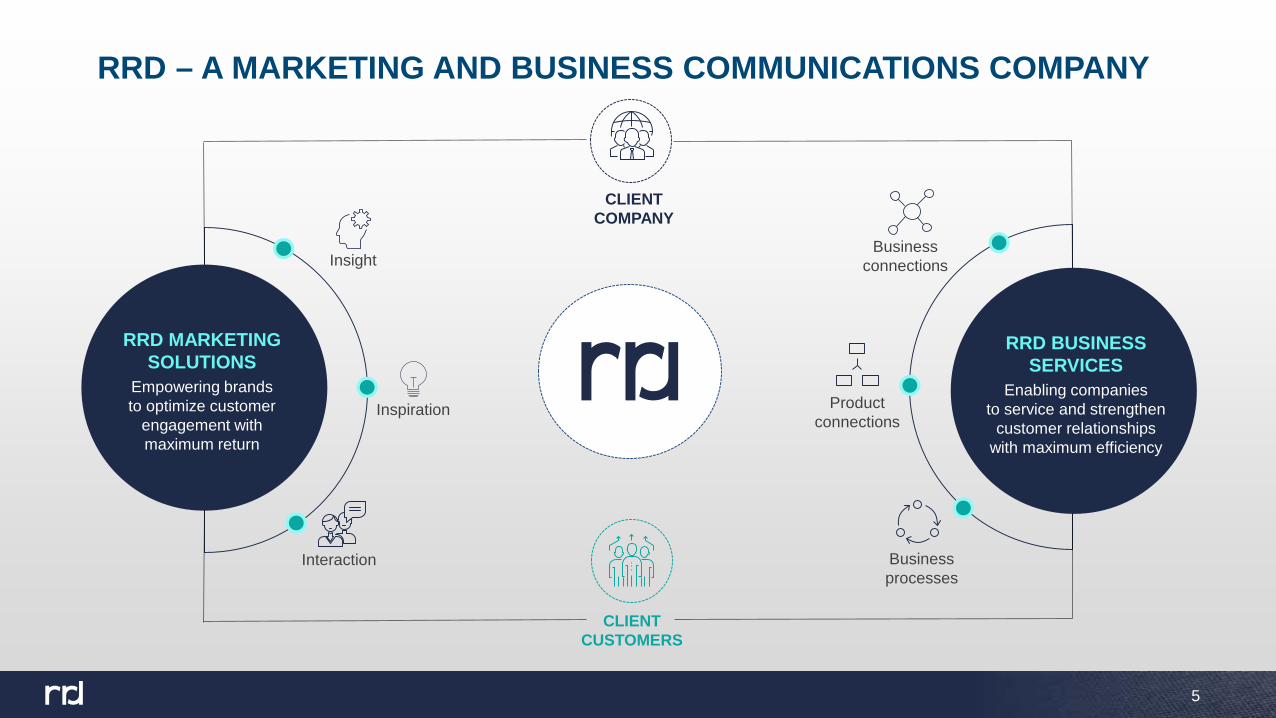
RRD – A MARKETING AND BUSINESS COMMUNICATIONS COMPANY
RRD MARKETING SOLUTIONS
Empowering brands to optimize customer
engagement with maximum return
Insight
Interaction
Inspiration
Business connections
Product connections
Business processes
CLIENTCOMPANY
CLIENTCUSTOMERS
RRD BUSINESS SERVICES
Enabling companies to service and strengthen
customer relationships with maximum efficiency
6
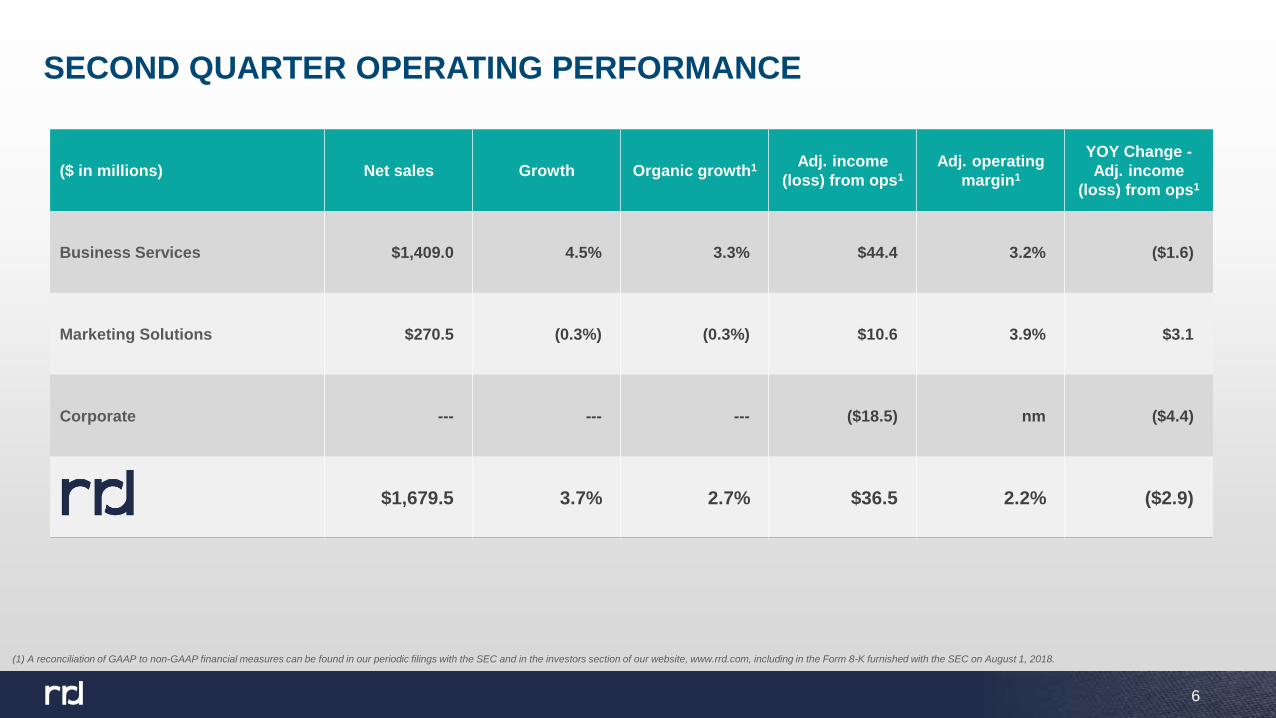
SECOND QUARTER OPERATING PERFORMANCE
($ in millions) Net sales Growth Organic growth1 Adj. income (loss) from ops1
Adj. operating margin1
YOY Change -Adj. income
(loss) from ops1
Business Services $1,409.0 4.5% 3.3% $44.4 3.2% ($1.6)
Marketing Solutions $270.5 (0.3%) (0.3%) $10.6 3.9% $3.1
Corporate --- --- --- ($18.5) nm ($4.4)
$1,679.5 3.7% 2.7% $36.5 2.2% ($2.9)
(1) A reconciliation of GAAP to non-GAAP financial measures can be found in our periodic filings with the SEC and in the investors section of our website, www.rrd.com, including in the Form 8-K furnished with the SEC on August 1, 2018.
7
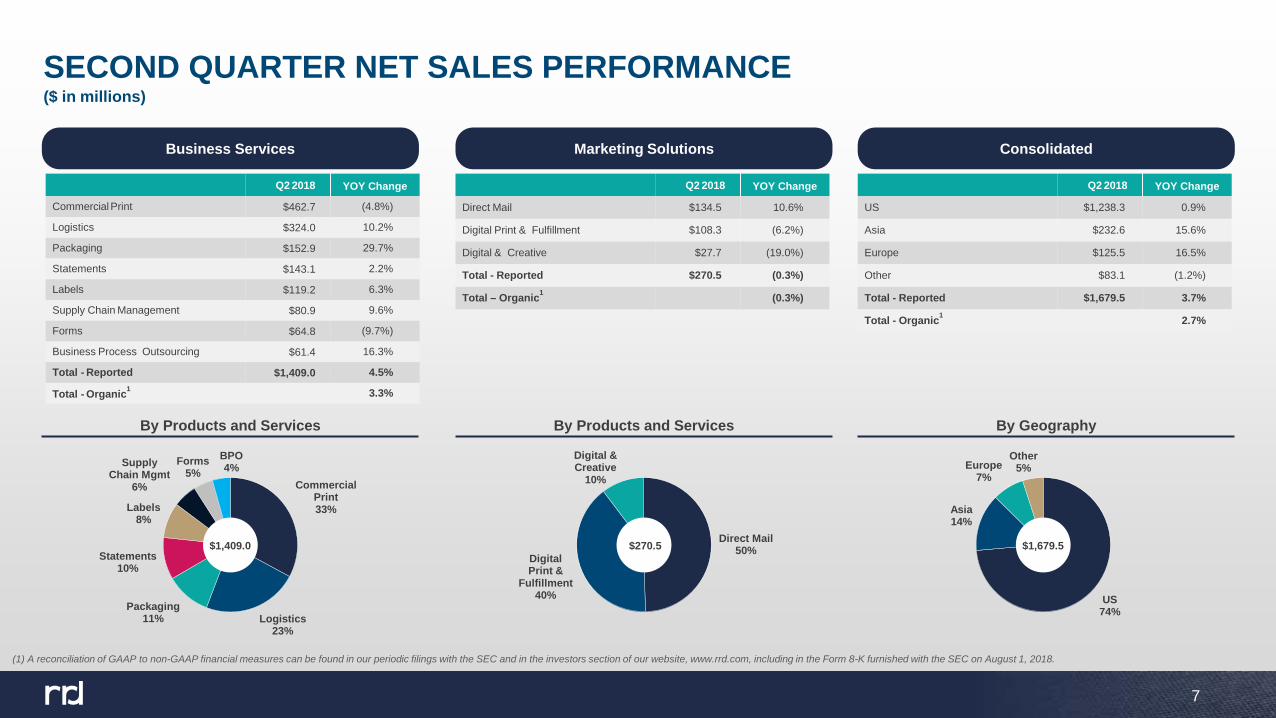
SECOND QUARTER NET SALES PERFORMANCE($ in millions)
7
Marketing SolutionsBusiness Services Consolidated
Q2 2018 YOY Change
CommercialPrint $462.7 (4.8%)
Logistics $324.0 10.2%
Packaging $152.9 29.7%
Statements $143.1 2.2%
Labels $119.2 6.3%
Supply Chain Management $80.9 9.6%
Forms $64.8 (9.7%)
Business Process Outsourcing $61.4 16.3%
Total - Reported $1,409.0 4.5%
Total - Organic1 3.3%
Q2 2018 YOY Change
Direct Mail $134.5 10.6%
Digital Print & Fulfillment $108.3 (6.2%)
Digital & Creative $27.7 (19.0%)
Total - Reported $270.5 (0.3%)
Total – Organic1 (0.3%)
Q2 2018 YOY Change
US $1,238.3 0.9%
Asia $232.6 15.6%
Europe $125.5 16.5%
Other $83.1 (1.2%)
Total - Reported $1,679.5 3.7%
Total - Organic1 2.7%
By Products and ServicesBy Products and Services By Geography
Commercial Print33%
Logistics23%
Packaging11%
Statements10%
Labels8%
Supply Chain Mgmt
6%
Forms5%
BPO4%
Direct Mail50%
DigitalPrint &
Fulfillment40%
Digital & Creative
10%
$1,409.0 $270.5
US74%
Asia14%
Europe7%
Other5%
$1,679.5
(1) A reconciliation of GAAP to non-GAAP financial measures can be found in our periodic filings with the SEC and in the investors section of our website, www.rrd.com, including in the Form 8-K furnished with the SEC on August 1, 2018.
8
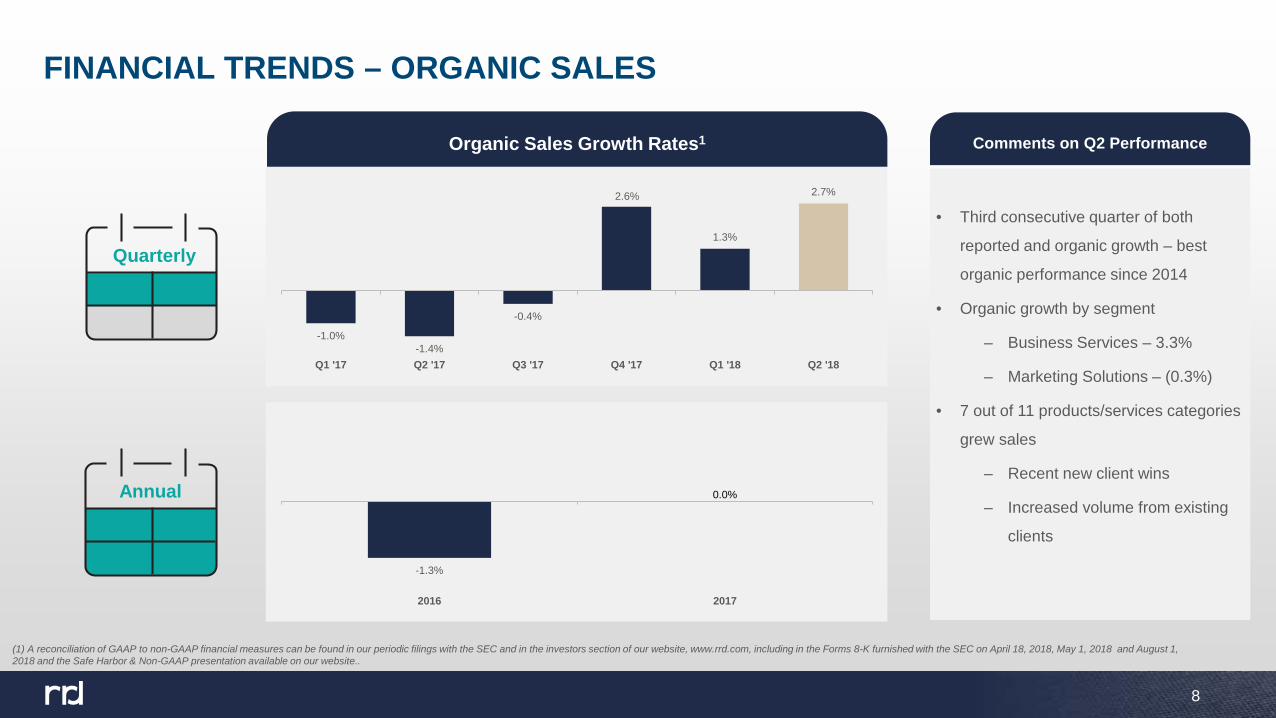
FINANCIAL TRENDS – ORGANIC SALES
-1.0%-1.4%
-0.4%
2.6%
1.3%
2.7%
Q1 '17 Q2 '17 Q3 '17 Q4 '17 Q1 '18 Q2 '18
Organic Sales Growth Rates1
-1.3%
0.0%
2016 2017
Annual
• Third consecutive quarter of both
reported and organic growth – best
organic performance since 2014
• Organic growth by segment
– Business Services – 3.3%
– Marketing Solutions – (0.3%)
• 7 out of 11 products/services categories
grew sales
– Recent new client wins
– Increased volume from existing
clients
Comments on Q2 Performance
Quarterly
(1) A reconciliation of GAAP to non-GAAP financial measures can be found in our periodic filings with the SEC and in the investors section of our website, www.rrd.com, including in the Forms 8-K furnished with the SEC on April 18, 2018, May 1, 2018 and August 1, 2018 and the Safe Harbor & Non-GAAP presentation available on our website..
9
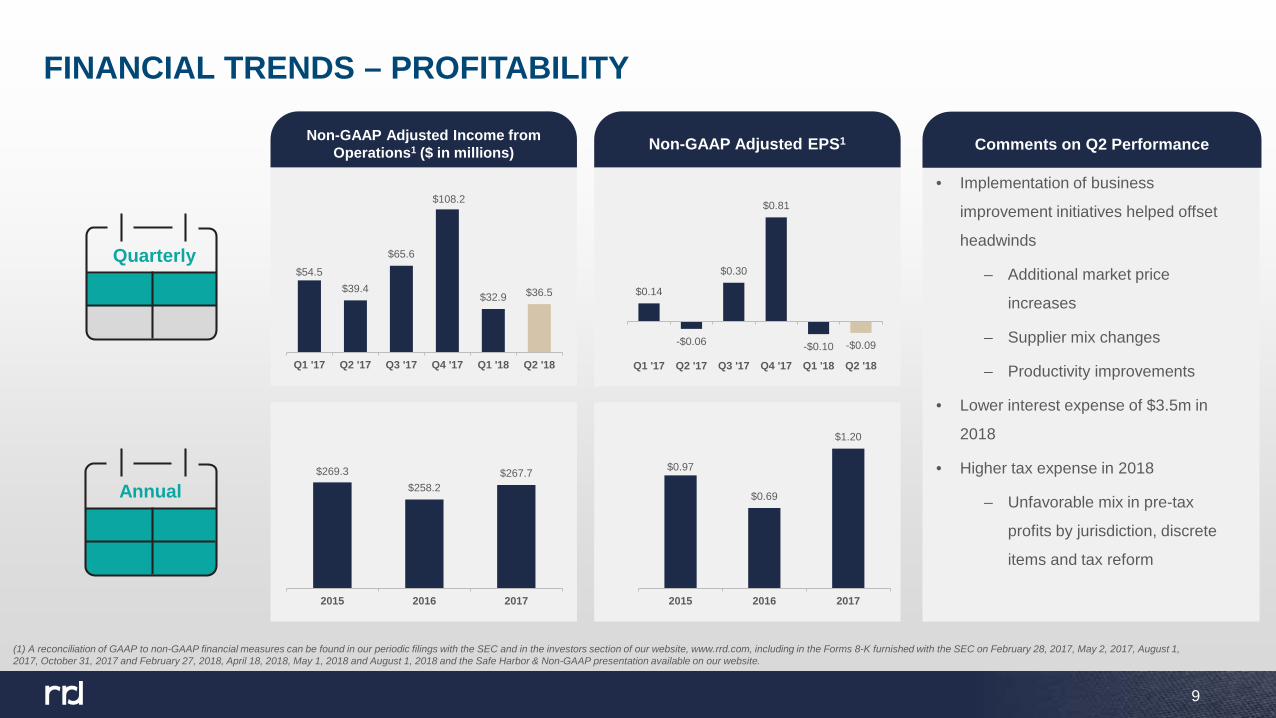
FINANCIAL TRENDS – PROFITABILITY
Non-GAAP Adjusted EPS1
$0.14
-$0.06
$0.30
$0.81
-$0.10 -$0.09
Q1 '17 Q2 '17 Q3 '17 Q4 '17 Q1 '18 Q2 '18
$54.5$39.4
$65.6
$108.2
$32.9 $36.5
Q1 '17 Q2 '17 Q3 '17 Q4 '17 Q1 '18 Q2 '18
Non-GAAP Adjusted Income from Operations1 ($ in millions)
$269.3$258.2
$267.7
2015 2016 2017
$0.97
$0.69
$1.20
2015 2016 2017
Annual
• Implementation of business
improvement initiatives helped offset
headwinds
– Additional market price
increases
– Supplier mix changes
– Productivity improvements
• Lower interest expense of $3.5m in
2018
• Higher tax expense in 2018
– Unfavorable mix in pre-tax
profits by jurisdiction, discrete
items and tax reform
Comments on Q2 Performance
Quarterly
(1) A reconciliation of GAAP to non-GAAP financial measures can be found in our periodic filings with the SEC and in the investors section of our website, www.rrd.com, including in the Forms 8-K furnished with the SEC on February 28, 2017, May 2, 2017, August 1, 2017, October 31, 2017 and February 27, 2018, April 18, 2018, May 1, 2018 and August 1, 2018 and the Safe Harbor & Non-GAAP presentation available on our website.
10
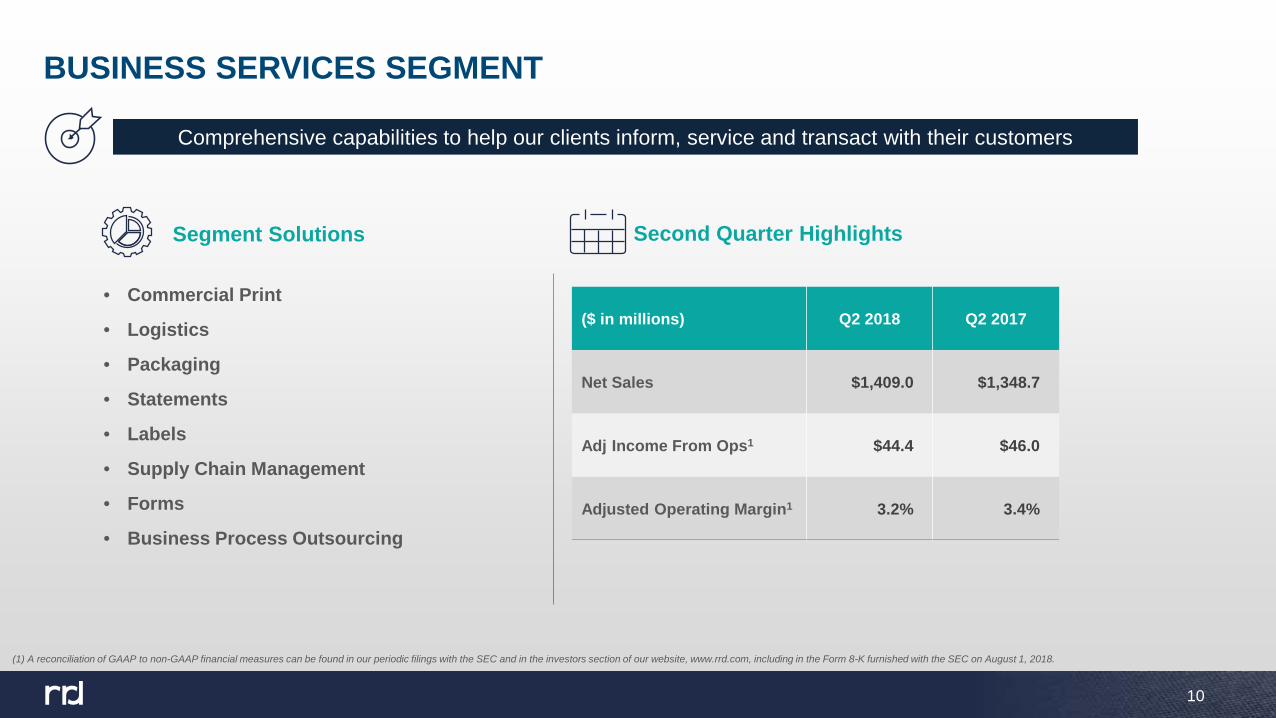
BUSINESS SERVICES SEGMENT
• Commercial Print
• Logistics
• Packaging
• Statements
• Labels
• Supply Chain Management
• Forms
• Business Process Outsourcing
($ in millions) Q2 2018 Q2 2017
Net Sales $1,409.0 $1,348.7
Adj Income From Ops1 $44.4 $46.0
Adjusted Operating Margin1 3.2% 3.4%
(1) A reconciliation of GAAP to non-GAAP financial measures can be found in our periodic filings with the SEC and in the investors section of our website, www.rrd.com, including in the Form 8-K furnished with the SEC on August 1, 2018.
Second Quarter HighlightsSegment Solutions
Comprehensive capabilities to help our clients inform, service and transact with their customers
11
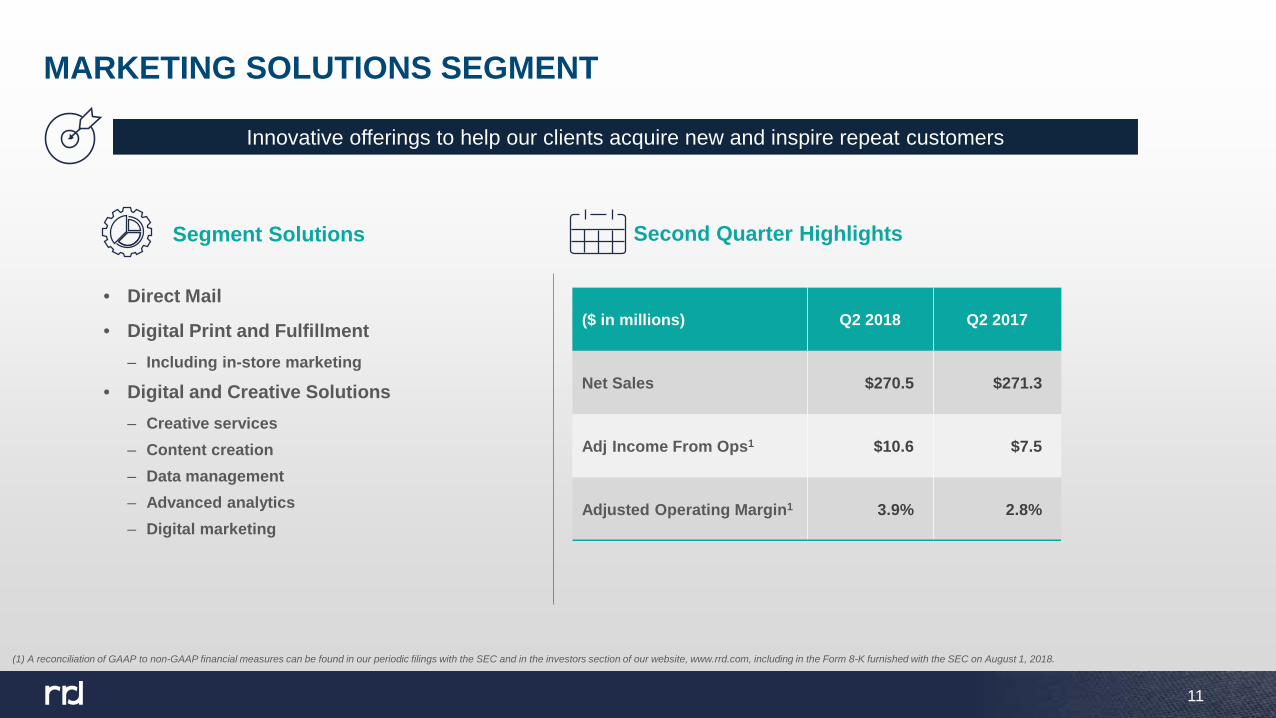
MARKETING SOLUTIONS SEGMENT
Innovative offerings to help our clients acquire new and inspire repeat customers
Segment Solutions Second Quarter Highlights
• Direct Mail
• Digital Print and Fulfillment– Including in-store marketing
• Digital and Creative Solutions– Creative services – Content creation– Data management– Advanced analytics– Digital marketing
($ in millions) Q2 2018 Q2 2017
Net Sales $270.5 $271.3
Adj Income From Ops1 $10.6 $7.5
Adjusted Operating Margin1 3.9% 2.8%
(1) A reconciliation of GAAP to non-GAAP financial measures can be found in our periodic filings with the SEC and in the investors section of our website, www.rrd.com, including in the Form 8-K furnished with the SEC on August 1, 2018.
12
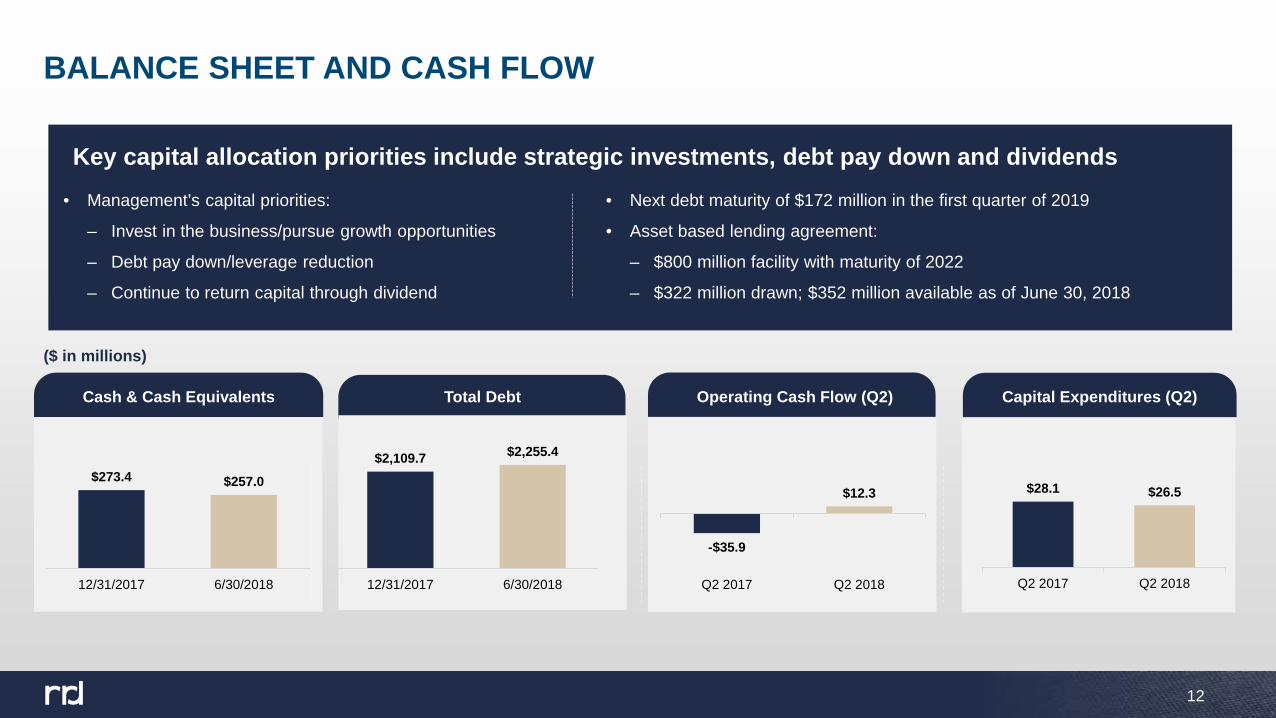
$273.4 $257.0
12/31/2017 6/30/2018
BALANCE SHEET AND CASH FLOW
-$35.9
$12.3
Q2 2017 Q2 2018
$2,109.7 $2,255.4
12/31/2017 6/30/2018
Cash & Cash Equivalents Total Debt Operating Cash Flow (Q2) Capital Expenditures (Q2)
• Management’s capital priorities:
– Invest in the business/pursue growth opportunities
– Debt pay down/leverage reduction
– Continue to return capital through dividend
• Next debt maturity of $172 million in the first quarter of 2019
• Asset based lending agreement:
– $800 million facility with maturity of 2022
– $322 million drawn; $352 million available as of June 30, 2018
($ in millions)
Key capital allocation priorities include strategic investments, debt pay down and dividends
$28.1 $26.5
Q2 2017 Q2 2018
13
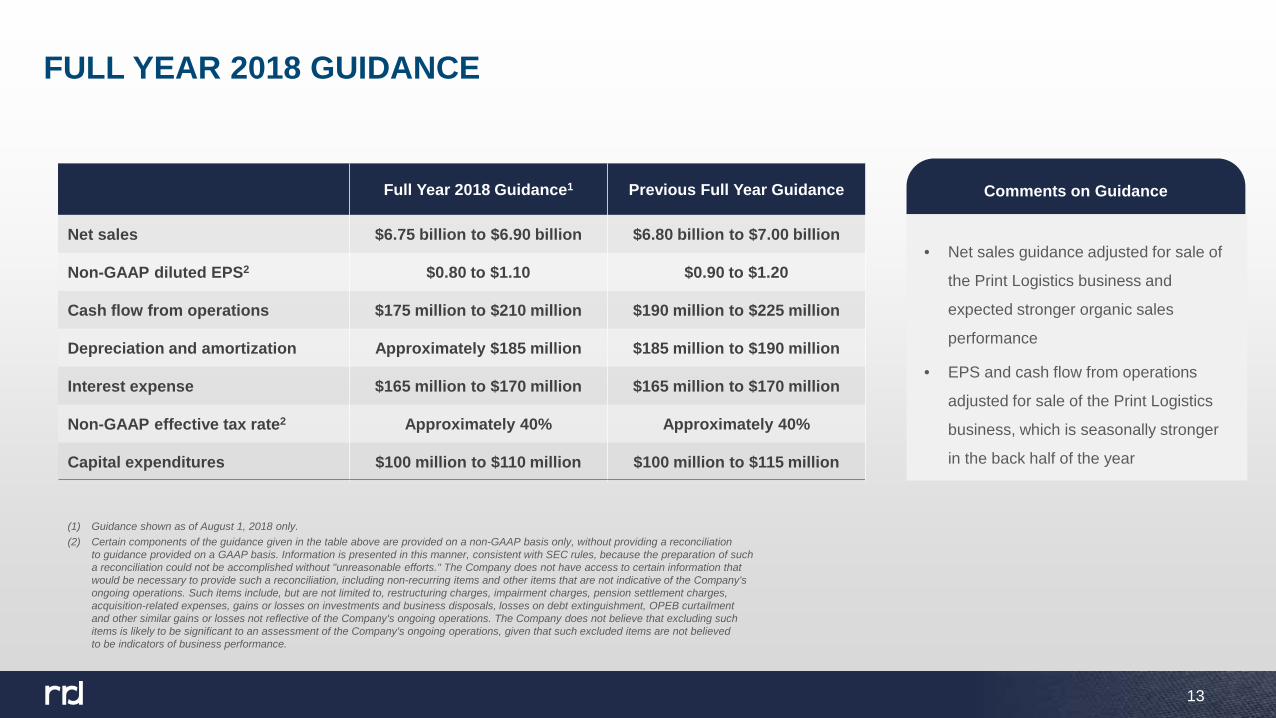
FULL YEAR 2018 GUIDANCE
Full Year 2018 Guidance1 Previous Full Year Guidance
Net sales $6.75 billion to $6.90 billion $6.80 billion to $7.00 billion
Non-GAAP diluted EPS2 $0.80 to $1.10 $0.90 to $1.20
Cash flow from operations $175 million to $210 million $190 million to $225 million
Depreciation and amortization Approximately $185 million $185 million to $190 million
Interest expense $165 million to $170 million $165 million to $170 million
Non-GAAP effective tax rate2 Approximately 40% Approximately 40%
Capital expenditures $100 million to $110 million $100 million to $115 million
(1) Guidance shown as of August 1, 2018 only.(2) Certain components of the guidance given in the table above are provided on a non-GAAP basis only, without providing a reconciliation
to guidance provided on a GAAP basis. Information is presented in this manner, consistent with SEC rules, because the preparation of such a reconciliation could not be accomplished without "unreasonable efforts." The Company does not have access to certain information that would be necessary to provide such a reconciliation, including non-recurring items and other items that are not indicative of the Company's ongoing operations. Such items include, but are not limited to, restructuring charges, impairment charges, pension settlement charges, acquisition-related expenses, gains or losses on investments and business disposals, losses on debt extinguishment, OPEB curtailment and other similar gains or losses not reflective of the Company's ongoing operations. The Company does not believe that excluding such items is likely to be significant to an assessment of the Company's ongoing operations, given that such excluded items are not believed to be indicators of business performance.
Comments on Guidance
• Net sales guidance adjusted for sale of
the Print Logistics business and
expected stronger organic sales
performance
• EPS and cash flow from operations
adjusted for sale of the Print Logistics
business, which is seasonally stronger
in the back half of the year
14
KEY TAKEAWAYS
Advanced strategy as a marketing and business communications provider›
Reported third consecutive quarter of organic sales growth - best organic sales performance since 2014
Announced actions reinforcing commitment to improving balance sheet in support of growth strategy
›
›
›
›
Delivered earnings improvement, excluding fx impact - actions completed to improve cost structure and offset inflationary cost pressures
Updated full year guidance to reflect divestiture of Print Logistics business and expected stronger organic sales performance