3D QSAR Studies of DAMNI Analogs as Possible Non...
12
ISSN: 0973-4945; CODEN ECJHAO E-Journal of Chemistry http://www.e-journals.net 2008, 5(S2), 1103-1113 3D QSAR Studies of DAMNI Analogs as Possible Non-nucleoside Reverse Transcriptase Inhibitors S. GANGULY * and V.GOPALAKRISHNAN Department of Pharmaceutical Sciences, Birla Institute of Technology, Mesra, Ranchi-835215, Jharkhand. [email protected] Received 27 January 2008; Accepted 20 March 2008 Abstract: The non-nucleoside inhibitors of HIV-1-reverse transcriptase (NNRTIs) are an important class of drugs employed in antiviral therapy. Recently, a novel family of NNRTIs commonly referred to as 1-[2- diarylmethoxy] ethyl) 2-methyl-5-nitroimidazoles (DAMNI) derivatives have been discovered. The 3D-QSAR studies on DAMNI derivatives as NNRTIs was performed by comparative molecular field analysis (CoMFA) and comparative molecular similarity indices analysis (CoMSIA) methods to determine the factors required for the activity of these compounds. The global minimum energy conformer of the template molecule 15, the most active molecule of the series, was obtained by simulated annealing method and used to build the structures of the molecules in the dataset. The combination of steric and electrostatic fields in CoMSIA gave the best results with cross-validated and conventional correlation coefficients of 0.654 and 0.928 respectively. The predictive ability of CoMFA and CoMSIA were determined using a test set of ten DAMNI derivatives giving predictive correlation coefficients of 0.92 and 0.98 respectively indicating good predictive power. Further, the robustness of the models was verified by bootstrapping analysis. The information obtained from CoMFA and CoMSIA 3D contour maps may be of utility in the design of more potent DAMNI analogs as NNRTIs in future. Keywords: 2-Methyl-5-Nitroimidazole, 3D QSAR, DAMNI analogs, CoMFA, CoMSIA Introduction The reverse transcriptase (RT) of the Human Immunodeficiency Virus is a key target in the treatment of Acquired Immune Deficiency Syndrome (AIDS) for which no completely successful, chemotherapy is yet available 1 .There are two classes of HIV-1-RT inhibitors, the nucleoside (NRTIs) (e.g., AZT, 3TC, ddI, ddC) and the non-nucleosideinhibitors (NNRTIs) depending on their mechanism of action. NRTIs act on the catalytic site of the reverse
Transcript of 3D QSAR Studies of DAMNI Analogs as Possible Non...

ISSN: 0973-4945; CODEN ECJHAO
E-Journal of Chemistry
http://www.e-journals.net 2008, 5(S2), 1103-1113
3D QSAR Studies of DAMNI Analogs as Possible
Non-nucleoside Reverse Transcriptase Inhibitors
S. GANGULY* and V.GOPALAKRISHNAN
Department of Pharmaceutical Sciences,
Birla Institute of Technology, Mesra, Ranchi-835215, Jharkhand.
Received 27 January 2008; Accepted 20 March 2008
Abstract: The non-nucleoside inhibitors of HIV-1-reverse transcriptase
(NNRTIs) are an important class of drugs employed in antiviral therapy.
Recently, a novel family of NNRTIs commonly referred to as 1-[2-
diarylmethoxy] ethyl) 2-methyl-5-nitroimidazoles (DAMNI) derivatives have
been discovered. The 3D-QSAR studies on DAMNI derivatives as NNRTIs was
performed by comparative molecular field analysis (CoMFA) and comparative
molecular similarity indices analysis (CoMSIA) methods to determine the factors
required for the activity of these compounds. The global minimum energy
conformer of the template molecule 15, the most active molecule of the series,
was obtained by simulated annealing method and used to build the structures of
the molecules in the dataset. The combination of steric and electrostatic fields in
CoMSIA gave the best results with cross-validated and conventional correlation
coefficients of 0.654 and 0.928 respectively. The predictive ability of CoMFA
and CoMSIA were determined using a test set of ten DAMNI derivatives giving
predictive correlation coefficients of 0.92 and 0.98 respectively indicating good
predictive power. Further, the robustness of the models was verified by
bootstrapping analysis. The information obtained from CoMFA and CoMSIA 3D
contour maps may be of utility in the design of more potent DAMNI analogs as
NNRTIs in future.
Keywords: 2-Methyl-5-Nitroimidazole, 3D QSAR, DAMNI analogs, CoMFA, CoMSIA
Introduction
The reverse transcriptase (RT) of the Human Immunodeficiency Virus is a key target in the
treatment of Acquired Immune Deficiency Syndrome (AIDS) for which no completely
successful, chemotherapy is yet available1.There are two classes of HIV-1-RT inhibitors, the
nucleoside (NRTIs) (e.g., AZT, 3TC, ddI, ddC) and the non-nucleosideinhibitors (NNRTIs)
depending on their mechanism of action. NRTIs act on the catalytic site of the reverse

1104 S.GANGULY et al.
transcriptase enzyme, preventing DNA synthesis, whereas NNRTIs bind noncompetitively
to a hydrophobic site close to the catalytic site, forcing the enzyme to adopt an inactive
conformation2 .The advantage of NNRTIs over NRTIs is that they are relatively less
cytotoxic and more selective than NRTIs. However, the real advantage is abolished by a
broad cross resistance by most of the NNRTIs.To date only three non-nucleosideRT
inhibitors have been approved for clinical use namely nevirapine, delaviridine and
efavirenz . Several NNRTIs (MKC442, Troviridine, S-1153/ AG1549 PNU142721, ACT,
and HBY1293/GW420867X) are currently undergoing clinical trials. Other examples of
NNRTIs include TIBO compounds3, HEPT derivatives
4, BHAP analogs
5, 2-pyridinones
6
and PETT compounds7. Recently 1-[2-(diarylmethoxy)-ethyl] 2-mehyl-5-nitroimidazoles
(DAMNIs), a novel family of NNRTIs active at submicromolar concentration has been
discovered8-10
.
Comparative molecular field analysis (CoMFA) and Comparative molecular
similarity indices analysis (CoMSIA) are powerful and versatile tools to build and
design an activity model (QSAR) for a given set of molecules in rational drug design
and related applications11
.CoMFA methodology is based on the assumption that the
changes in the biological activity correlate with the changes in the steric and
electrostatic fields of the molecules. The CoMSIA12,13
method differs by the way the
molecular fields are calculated and by including additional molecular fields, such as
lipophilic and hydrogen bond potential. The additional fields in CoMSIA provide better
visualization and interpretation of the obtained correlation in terms of field contribution
to the activity of the compound. On the basis of CoMFA and CoMSIA models for
DAMNI derivatives, we attempted to elucidate a structure/activity relationship to
provide useful information for the design and synthesis of more potent DAMNI analogs
and related derivatives with predetermined affinities.
Experimental
Dataset for analysis
Reported data on a series of 40 DAMNI analogs8-10
were used (Table 1). The EC50 data were
used for QSAR analysis as a dependent parameter after converting reciprocal of the
logarithm of EC50 (pEC50) values. EC50 is the micromolar concentration of the compounds
required to achieve 50% protection of MT-4 cells from HIV-1 induced cytopathogenicity, as
determined by MTT method. The total set of DAMNI analogs (40 compounds) was divided
into the training set (30 compounds) and test set (10 compounds) (Figure 1).The ratio of
training set molecules to test set molecules was in the approximate ratio 4:1.Test and
training set compounds were chosen manually such that low, moderate, and high activity
compounds were present approximately in equal proportions in both sets.
X
NN
R
R'R''
Ar
Ar'
*
*
*
**
* *
*
**
1-40
Figure1. Novel DAMNI analogs used for 3D QSAR studies.
Common substructure is labeled with*.

3D QSAR Studies of DAMNI Analogs 1105
Table 1. Dataset used for 3D-QSAR analyses
Substituents Compd.
No. Ar Ar′ X R R′ R′′ EC50
1 C6H5 C6H5 O H H H 100
2 C6H5 2,4-Cl-C6H3 O H H H 31
3 C6H5 4-C6H5-C6H4 O CH3 NO2 H 17
4 C6H5 H O CH3 H NO2 22
5 C6H5 C6H5 O CH3 NO2 H 0.20
6 C6H5 4-tertbutyl-C6H4 O CH3 NO2 H 4
7 C6H5 4-F-C6H4 O CH3 NO2 H 0.9
8 2,4-Cl-C6H3 C6H5 O CH3 NO2 H 1.5
9 2-CH3-C6H4 C6H5 O CH3 NO2 H 0.2
10 2-F-C6H4 C6H5 O CH3 NO2 H 0.2
11 3-CH3-C6H4 C6H5 O CH3 NO2 H 0.1
12 3-F-C6H4 C6H5 O CH3 NO2 H 5
13 C6H5 C6H11 O CH3 NO2 H 0.3
14 C6H5 H O CH3 NO2 H 4.2
15 C6H5 Thiophenyl O CH3 NO2 H 0.03
16 4-CH3-C6H4 Thiophenyl O CH3 NO2 H 0.3
17 3-F-C6H4 Thiophenyl O CH3 NO2 H 0.14
18 3-Cl-C6H4 Thiophenyl O CH3 NO2 H 0.08
19 2-F-C6H4 Thiophenyl O CH3 NO2 H 0.12
20 2,3-F-C6H4 Thiophenyl O CH3 NO2 H 0.06
21 C6H5 3-Cl-2-Thiophenyl O CH3 NO2 H 1.2
22 C6H5 Furyl O CH3 NO2 H 0.1
23 C6H5 Pyrimidinyl O CH3 NO2 H 0.08
24 4-OCH3-C6H4 C6H5 O CH3 NO2 H 86
25 C6H5 C6H5 O CH3 H NO2 67
26 C6H5 C6H5 O H H NO2 78
27 2,4-Cl-C6H4 4-Cl-C6H4 O H H H >26
28 C6H5 4-Cl-C6H4 O CH3 NO2 H 12.5
29 C6H5 C6H5 NH CH3 NO2 H 12
30 2-CH3-C6H4 Thiophenyl O CH3 NO2 H 0.45
31 a 5-(1,3 butadiene) C6H4 C6H5 O CH3 NO2 H 106
32 a C6H5 H N-CH2C6H5 CH3 NO2 H 84
33 a C6H5 C6H5 O H NO2 H >100
34 a 3,5-Cl-C6H3 C6H5 O CH3 NO2 H 45
35 a 2-Cl-C6H4 C6H5 S CH3 NO2 H 12
36 a 2-F-C6H4 C6H5 NH CH3 NO2 H 50
37 a 4-CH3-C6H4 C6H5 NH CH3 NO2 H 44
38 a 3-Cl-C6H4 C6H5 S CH3 NO2 H 64
39 a C6H5 H S CH3 NO2 H 60
40 a 4-Cl-C6H4 Thiophenyl O CH3 NO2 H 57.5
a Test set compounds

1106 S.GANGULY et al.
Molecular modelling
The 3D-QSAR was performed14
using SYBYL 7.1 installed on a Dell computer with Red Hat
Linux Enterprise Version 3.0.The initial conformation of the most active analog 15 was
obtained from simulated annealing as it enables the rapid identification of the global minimum
energy conformer15
. The system was subjected to simulated annealing by heating at 1000 K for
1 ps and then cooling at 200 K for1 ps. The exponential annealing function was used and 10
such cycles were run. The least energy conformer obtained by this method was subjected to
further minimization. The minimized conformer, thus obtained, was taken as the template and
rest of the molecules were built from it. A constrained minimization followed by full
minimization was carried out on these molecules in order to prevent the conformations moving
to a false region. Tripos force field and partial atomic charges calculated by the Gasteiger-
Huckel method were used. Powell’s conjugate gradient method was used for minimization.
The gradient of 0.05 kcal mol-1
A° -1
was set as a convergence criterion.
Alignment
The most crucial input for CoMFA is the alignment of the molecules. The template molecule
15 was taken and the rest of the molecules were aligned to it using the DATABASE
ALIGNMENT method in the SYBYL. The molecules were aligned to the template molecule
by using common substructure labeled with* in 1(Figure 1). The aligned molecules are
shown in Figure 2.
Figure 2. Alignment of the training set molecules.
CoMFA interaction energy calculation12
The steric and electrostatic CoMFA fields were calculated at each lattice intersection of a
regularly spaced grid of 2.0 A° in all three dimensions within defined region. The van der
Waals potential and coulombic terms representing the steric and electrostatic fields
respectively were calculated using standard tripos force fields. A distance dependent
dielectric constant of 1.00 was used. An sp3 carbon atom with +/1.00 charge was used as a
probe atom. The steric and electrostatic fields were truncated at +/30.00 kcal mol-1
, and the
electrostatic fields were ignored at the lattice points with maximal steric interactions.

3D QSAR Studies of DAMNI Analogs 1107
CoMSIA interaction energy calculation12
The steric, electrostatic, hydrophobic, hydrogen bond donor and hydrogen bond acceptor
potential fields were calculated at each lattice intersection of a regularly spaced grid of
2.0 A°. A probe atom with radius 1.0 A° and +/1.0 charge with hydrophobicity of +/1.0
and hydrogen bond donor and hydrogen bond acceptor properties of +/1.0 was used to
calculate steric, electrostatic, hydrophobic, donor and acceptor fields. The contribution
from these descriptors was truncated at 0.3 kcal mol-1
.
Partial least square (PLS) analysis12
PLS method was used to linearly correlate the CoMFA fields to the inhibitory activity
values. The cross-validation16,17
analysis was performed using the leave one out (LOO)
method in which one compound is removed from the dataset and its activity is predicted
using the model derived from the rest of the dataset. The cross-validated r2 that resulted in
optimum number of components and lowest standard error of prediction were considered for
further analysis. Equal weights were assigned to steric and electrostatic fields using
COMFA_STD scaling option. To speed up the analysis and reduce noise, a minimum filter
value σ of 2.00 kcal mol-1
was used. Final analysis was performed to calculate conventional
r2 using the optimum number of components. To further assess the robustness and statistical
confidence of the derived models, bootstrapping analysis for 100 runs was performed.
Bootstrapping involves the generation of many new data sets from original data set and is
obtained by randomly choosing samples from the original data set. The statistical calculation
is performed on each of these bootstrapping samplings. The difference between the
parameters calculated from the original data set and the average of the parameters calculated
from the many bootstrapping samplings is a measure of the bias of the original calculations.
The entire cross-validated results were analysed considering the fact that a value of r2
cv
above 0.3 indicates that probability of chance correlation12
is less than 5%.
Predictive correlation coefficient12
The predictive ability of each 3D-QSAR model was determined from a set of ten
compounds that were not included in the training set. These molecules were aligned, and
their activities were predicted. The predictive correlation coefficient (r2
pred), based on
molecules of test set, is defined as,
r2
pred = (SD-PRESS)/SD
where SD is the sum of the squared deviations between the biological activities of the test
set and mean activities of the training set molecules and PRESS is the sum of squared
deviation between predicted and actual activity values for every molecule in test set.
Results and Discussion
The CoMFA model obtained with 30 DAMNI derivatives in training set resulted in a six-
component model with cross-validated correlation coefficient of 0.697 and minimum
standard error. This analysis was used for final non-cross validated run, giving a correlation
coefficient of 0.925 giving a good linear correlation between the observed and predicted
activities of the molecules in the training set. To test the predictive ability of the resulting
model, a test set of ten molecules excluded from the model creation work was used. The
predictive correlation coefficient of 0.924 was obtained for CoMFA model. A high r2 value
of 0.739 during 100 runs of bootstrapped 18,19
analysis further supports the statistical validity
of the model. The results of PLS analysis for CoMFA and CoMSIA are shown in Table 2.
The alignment of the training set molecules is shown in Figure 2. The relative contributions
1108 S.GANGULY et al.
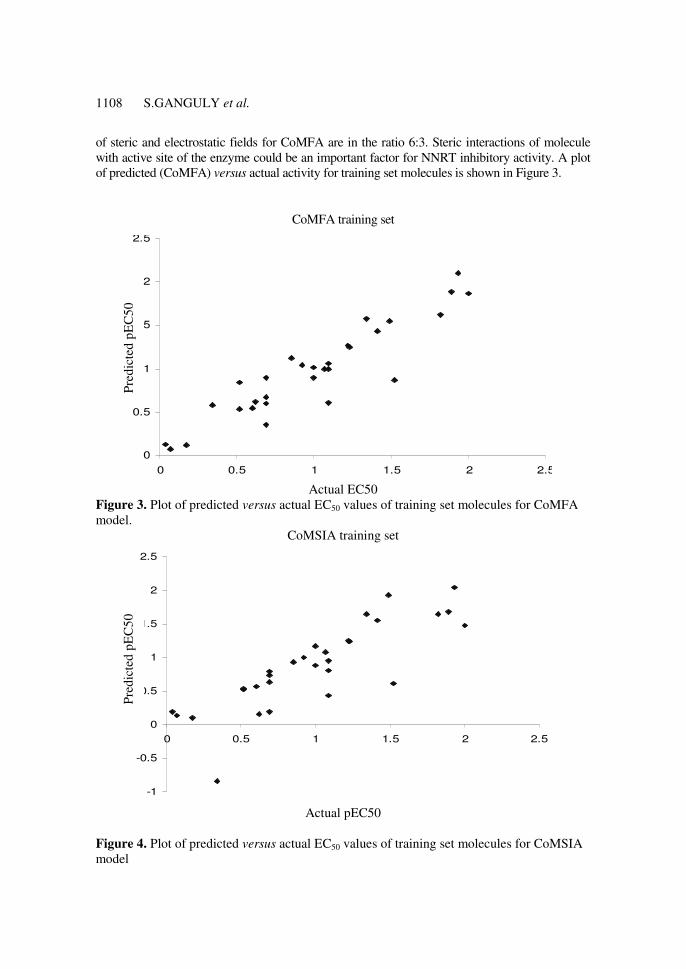
of steric and electrostatic fields for CoMFA are in the ratio 6:3. Steric interactions of molecule
with active site of the enzyme could be an important factor for NNRT inhibitory activity. A plot
of predicted (CoMFA) versus actual activity for training set molecules is shown in Figure 3.
CoMFA training set
0
0.5
1
1.5
2
2.5
0 0.5 1 1.5 2 2.5
Actual EC50 Figure 3. Plot of predicted versus actual EC50 values of training set molecules for CoMFA
model.
CoMSIA training set
-1
-0.5
0
0.5
1
1.5
2
2.5
0 0.5 1 1.5 2 2.5
Actual pEC50
Figure 4. Plot of predicted versus actual EC50 values of training set molecules for CoMSIA
model
Pre
dic
ted
pE
C5
0
Pre
dic
ted
pE
C5
0

3D QSAR Studies of DAMNI Analogs 1109
-0.8
-0.6
-0.4
-0.2
0
0.2
0.4
0.6
0.8
31 32 33 34 35 36 37 38 39 40
Resid
uals
CoMFA
CoMSIA
Figure 5. Histogram of test set molecules.
Table 2. Summary of CoMFA and CoMSIA Statistics
CoMSIA Parameters CoMFA
SE Model 1 SEH Model 2 SEHDA Model 3
r2
cv 0.697 0.654 0.564 0.525
N 6 6 6 6
r2 0.925 0.928 0.921 0.912
SEE 0.150 0.340 0.356 0.375
F-test value 68.830 49.370 44.606 39.940
PRESS 1.722 2.783 4.237 1.901
r2
pred 0.924 0.982 0.874 0.934
r2
bs 0.739 0.640 0.569 0.552
SD 0.012 0.019 0.021 0.020
Contributions, %
Steric 0.351 0.262 0.223 0.351
Electrostatic 0.649 0.428 0.405 0.649
Hydrophobic 0.311 0.245
Acceptor 0.019
Donor 0.108
r2
cv=/cross-validated correlation coefficient; N=/number of components; r2=/
conventional correlation coefficient; SEE=/standard error of estimate; PRESS=/predicted
residual sum of squares of test set molecules, r2
pred=/predictive correlation coefficient,
r2
bs=correlation coefficient after 100 runs of bootstrapping analysis, SD=/standard deviation
from 100 bootstrapping runs, S=/steric field, E=electrostatic field, H=/hydrophobic field,
D=/hydrogen bond donor field, A=/hydrogen bond acceptor field.
Figure 4 represents the plot of predicted (CoMSIA) versus actual activity values, while
the test set residuals of CoMFA and CoMSIA analyses are shown in Figure 5. The actual,
predicted and residual values of training and test set for CoMFA and CoMSIA are given in
Res
idu
als

1110 S.GANGULY et al.
Tables 3 and 4 respectively. Contour maps were generated as scalar product of coefficients
and standard deviation associated with each CoMFA column. The 3D-QSAR contour maps
revealing the contribution of CoMFA and CoMSIA fields are shown in Figures. 6 and 7
respectively. The CoMFA steric interactions are represented by green (G) and yellow (Y)
coloured contours while electrostatic interactions are represented by red (R) and blue (B)
coloured contours. The bulky substituents are favoured in green regions and disfavoured in
yellow (Y) regions. The increase in positive charge is favoured in blue (B) regions while the
increase in negative charge is favoured in red (R) regions. The most active molecule 15
(template, EC50 0.3 µM) is displayed in the background of contours. The electrostatic
contours of CoMFA (Figure 6) shows a red contour near the third position of the imidazole
nucleus, two red (R) contours near the thienyl ring, A blue contour enclosing the fifth position
of imidazole nucleus of the template molecule and a blue contour away from the phenyl ring.
a b Figure 6. The CoMFA steric and (b) electrostatic contour maps. One of the most active
molecules 15 is shown in the background. Red (R) colour is a negative charged region, blue
(B) a positively charged region,green (G) a positive sterically active region, and yellow
(G) a negatively sterically active region.
(a) (b)
Figure 7. The CoMSIA steric (a) and electrostatic (b) contour maps. One of the most active
molecules 15 is shown in the background. Red (R) colour is a negative charged region, blue
(B) a positively charged region, green (G) a positive sterically active region, and yellow
(G) a negatively sterically active region.

3D QSAR Studies of DAMNI Analogs 1111
Table 3. Experimental and predicted inhibitory activities of compounds in training set
pEC50 Predicted Residual activity Compd. No pEC50 Experimental
CoMFA CoMSIA CoMFA CoMSIA
1 2.00 1.87 1.48 0.13 0.52
2 1.49 1.55 1.93 -0.06 -0.44
3 1.23 1.25 1.24 -0.02 -0.01
4 1.34 1.58 1.65 -0.24 -0.31
5 0.69 0.35 0.19 0.34 0.50
6 0.60 0.54 0.57 0.06 0.03
7 0.04 0.13 0.19 -0.09 -0.15
8 0.17 0.12 0.10 0.05 0.07
9 0.69 0.60 0.64 0.09 0.05
10 0.69 0.67 0.80 0.02 -0.11
11 1.00 0.90 0.89 0.10 0.11
12 0.69 0.90 0.74 -0.21 -0.05
13 0.52 0.53 0.52 -0.01 0.00
14 0.62 0.62 0.16 0.00 0.46
15 1.52 0.87 0.61 -0.65 -0.91
16 0.52 0.84 0.53 -0.31 -0.01
17 0.85 1.12 0.93 -0.27 -0.08
18 1.09 1.06 0.81 0.03 0.28
19 0.92 1.04 1.00 -0.12 -0.08
20 1.22 1.27 1.25 -0.05 -0.03
21 0.07 0.07 0.14 0.00 -0.07
22 1.00 1.01 1.17 -0.01 -0.17
23 1.09 1.00 0.96 0.09 0.13
24 1.93 2.10 2.05 -0.17 -0.12
25 1.82 1.62 1.65 0.20 0.17
26 1.89 1.88 1.68 0.01 0.21
27 0.34 0.58 0.84 -0.24 -0.50
28 1.41 1.43 1.56 -0.02 -0.14
29 1.09 0.61 0.43 0.48 0.66
30 1.07 1.00 1.08 0.07 -0.01
Table 4. Experimental and predicted inhibitory activities of compounds in test set
Predicted pEC50 Residual activity Compd. No.
Actual pEC50
CoMFA CoMSIA CoMFA CoMSIA
31 2.02 1.46 1.54 0.56 0.48
32 1.92 1.54 1.43 0.38 0.49
33 2.00 1.38 1.32 0.62 0.68
34 1.65 1.57 1.71 0.08 -0.06
35 1.07 1.43 1.53 -0.36 -0.46
36 1.69 1.67 2.12 0.02 -0.43
37 1.64 0.96 1.13 -0.68 0.51
38 1.80 1.81 1.62 -0.01 0.18
39 1.77 1.61 1.49 0.16 0.28
40 1.76 1.25 1.20 0.51 0.56

1112 S. GANGULY et al.
The red regions near the third position of imidazole ring of template molecule indicates that
biological activity can be enhanced by introduction of more electronegative groups at this
position for strong electrostatic field interactions. The blue region near the fifth substitution
position of imidazole ring suggests that biological activity will be decreased by electronegative
group at the above-mentioned position. Two red contours near the thiophene group between
suggest that biological activity will be diminished by introduction of electropositive groups at this
site. Green contour near fourth and fifth position of thiophene ring indicates that the bulky groups
at this position will increase activity. Yellow contour near the sixth position of phenyl ring
indicates that bulky substituents at these positions decrease anti-HIV activity. The CoMSIA
results were obtained using the same structural alignment and same training and test set as
defined in the CoMFA. The combination of steric and electrostatic fields in CoMSIA gave
the best results (Model 1), giving cross-validation correlation coefficient of 0.654,
conventional correlation coefficient of 0.928 and predictive correlation coefficient of 0.982.
The other combinations like (i) steric, electrostatic and hydrophobic fields (Model 2) and (ii)
all fields (Model 3) in CoMSIA also gave statistically significant models. The other
combinations in CoMSIA gave statistically insignificant results (data not shown). The
Models 2 and 3 exhibit relatively lower cross-validated, conventional and predictive
correlation coefficients compared to model 1, the best amongst various fields combinations
in CoMSIA. The Model 1 of CoMSIA was used for final analysis and predictions. The r2
value of 0.640 during 100 runs of analysis 18, 19
also shows that the Model 1 is stable and
statistically robust. The contributions of steric and electrostatic fields of ComSIA are in ratio
6:3 (Table 2).Comparing this with the field contributions of CoMFA analysis, it is revealed
that steric and electrostatic interactions could be an important factor for NNRT inhibitory
activity. A comparison of the residuals of the models from CoMFA and CoMSIA is made to
evaluate their predictive ability (Table 4). Molecule 33 shows high residual value and this
may be due to the absence of a methyl group in the second position of the imidazole ring in
33 with respect to the corresponding substituents in other test molecules. Considering the
steric contours of CoMSIA (Model 1), green (G) contours indicate favourable regions while
yellow (Y) contours indicate unfavourable regions for bulkier substituents. In the
electrostatic contours, the introduction of electronegative substituents in red (R) regions may
increase the affinity while in blue (B) regions decrease the affinity. The steric contours
(Figure 6a and 7a) produced by CoMFA and CoMSIA (Model 1) respectively are quite
different. The analysis of steric CoMSIA contours shows presence of a green contour near
the third and fourth position of the phenyl ring, a small yellow contour at the fifth position
of the phenyl ring and a yellow contour enclosing the thiophene ring. The electrostatic
contours (Figure. 6b and 7b) produced by CoMFA and CoMSIA are slightly different. The
analysis of electrostatic CoMSIA contours shows presence of a small red (R) contour near
fourth position of the phenyl ring of the template molecule, a blue (B) contour near the third
and fourth position of the phenyl ring and a blue contour near the thiophene ring. The best
CoMSIA model (Model 1) indicates that hydrophobic, hydrogen bond donor and hydrogen
bond acceptor fields do not improve the model. The CoMFA and CoMSIA models described
are predictive enough to guide the design of new molecules.
Conclusions
The 3D-QSAR analyses, CoMFA and CoMSIA have been applied to a set of DAMNI
analogs active against HIV -1 RT .Statistically significant models with good correlative and
predictive power for NNRT inhibitory activities of the DAMNI analogs were obtained. The
initial geometry of the template molecule (15, the most active of the series) was obtained

3D QSAR Studies of DAMNI Analogs 1113
from the simulated annealing approach and was then used to derive remaining structures.
The robustness of the derived models was verified by bootstrapping method. The
comparison of CoMFA and CoMSIA models reveal that the combination of steric and
electrostatic fields in CoMSIA gave the best results. Results of this study may be utilized an
important basis for future drug design studies and synthesis of more potent HIV-1 RT
inhibitors.
Acknowledgements
One of the authors G.V. gratefully acknowledges the financial support to this work by UGC
in the form of Junior Research Fellowship.
References
1. Medina Franco J L B, Rodriguez-Morales S, Juarez-Gordiano C, Hernandez-Campos
A and Jimenez-Barbero J, Bioorg Med Chem., 2004, 12, 6085.
2. Freitas R F and Galembeck S E, Chem Phys Lett., 2005, 48, 131.
3. Lather V and Madan A K, Bioorg Med Chem., 2005, 13, 3263.
4. Miyasaka T, Tanaka H, Baba M, Hayakawa H, Walker R T, Balazarini J and
DeClercq E, J Med Chem., 1989, 32, 2507.
5. Romero D L, Busso M, Tan C, Reusser F, Palmer J R, Poppe S M, Aristoff P A,
Downey K M, So A G and Resnick L, Proc Natl Acad Sci., 1991, 88, 8806.
6. Saari W S, Wai J S, Fisher T E, Thomas C M, Hoffman J M, Rooney C S, Smith A
M, Jones J H, Bamberger D L, Goldman M E, O’Brien J A, Nunberg J H, Quintero J
C, Schleif W A, Emini E A and Anderson P S J, J Med Chem.,1992, 35(21), 3792.
7. Bell F W, Cantrell A S, Hoegberg M, Jaskunas S R, Johansson N G, Jordan C L,
Kinnick M D, Lind P and Morin J M Jr. et al, J Med Chem., 1995, 38(25), 4929.
8. Silvestri R, Artico M, Massa S, Marceddu T, Montis F D and Colla P L, Bioorg Med
Chem., 2000, 10, 253.
9. Silvestri R, Artico M, Martino G D, Ragno R, Massa S, Loddo R, Murgioni C, Loi A
G, La Colla P and Pani A, J Med Chem., 2002, 45, 1567.
10. Martino G D, Regina G L, Pasquali A D, Ragno R, Bergamini A, Ciaprini C, Sinistro
A, Maga G, Crespan E, Artico M and Silvetsri R, J Med Chem,. 2005, 48, 4378.
11. Ravichandran V and Agrawal R K, Bioorg & Med Chem Lett., 2007, 17, 2197.
12. Chakroborti A K, Gopalakrishnan B, Sobhia M E and Malde A K, Eur J Med Chem.,
2003, 38, 975.
13. Klebe G, Abraham U and Mietzner T, J Med Chem. 1994, 37(24), 4130.
14. SYBYL Molecular Modelling System, version 7.1; Tripos Associates; St.Louis, MO.
15. Barakat M T and Dean P M, J Comput Aided Mol Des., 1990, 4, 295.
16. Halgren T A, J Am Chem Soc., 1990, 112(12), 4710.
17. Podlogar B L and Ferguson D M, Drug Des Discov., 2000, 17(1), 4.
18. Cramer R D, Bunce J D, Patterson D E and Frank I E, Quantitative Structure-Activity
Relationships 1988, 7(1), 18.
19. Murthy V S and Kulkarni V M, Bioorg Med Chem., 2002, 10(7), 2267.

Submit your manuscripts athttp://www.hindawi.com
Chromatography Research International
Hindawi Publishing Corporationhttp://www.hindawi.com Volume 2013
Hindawi Publishing Corporationhttp://www.hindawi.com Volume 2013
Carbohydrate Chemistry
International Journal of
Hindawi Publishing Corporationhttp://www.hindawi.com
International Journal of
Analytical ChemistryVolume 2013
ISRN Chromatography
Hindawi Publishing Corporationhttp://www.hindawi.com Volume 2013
Hindawi Publishing Corporation http://www.hindawi.com Volume 2013Hindawi Publishing Corporation http://www.hindawi.com Volume 2013
The Scientific World Journal
Bioinorganic Chemistry and ApplicationsHindawi Publishing Corporationhttp://www.hindawi.com Volume 2013
Hindawi Publishing Corporationhttp://www.hindawi.com Volume 2013
CatalystsJournal of
ISRN Analytical Chemistry
Hindawi Publishing Corporationhttp://www.hindawi.com Volume 2013
ElectrochemistryInternational Journal of
Hindawi Publishing Corporation http://www.hindawi.com Volume 2013
Hindawi Publishing Corporationhttp://www.hindawi.com Volume 2013
Advances in
Physical Chemistry
ISRN Physical Chemistry
Hindawi Publishing Corporationhttp://www.hindawi.com Volume 2013
SpectroscopyInternational Journal of
Hindawi Publishing Corporationhttp://www.hindawi.com Volume 2013
ISRN Inorganic Chemistry
Hindawi Publishing Corporationhttp://www.hindawi.com Volume 2013
Hindawi Publishing Corporationhttp://www.hindawi.com Volume 2013
Journal of
Chemistry
Hindawi Publishing Corporationhttp://www.hindawi.com Volume 2013
Inorganic ChemistryInternational Journal of
Hindawi Publishing Corporation http://www.hindawi.com Volume 2013
International Journal ofPhotoenergy
Hindawi Publishing Corporationhttp://www.hindawi.com
Analytical Methods in Chemistry
Journal of
Volume 2013
ISRN Organic Chemistry
Hindawi Publishing Corporationhttp://www.hindawi.com Volume 2013
Hindawi Publishing Corporationhttp://www.hindawi.com Volume 2013
Journal of
Spectroscopy