3D-QSAR and Pharmacophore Identification of …best pharmacophore hypothesis was found to be...
11
Chiang Mai J. Sci. 2018; 45(2) : 1062-1072 http://epg.science.cmu.ac.th/ejournal/ Contributed Paper 3D-QSAR and Pharmacophore Identification of Benzothiazole Derivatives as Potent p56 lck Inhibitors Kanika Arora [a], Sukhbir Lal Khokra [a], Shah Alam Khan [b] and Asif Husain*[c] [a] Institute of Pharmaceutical Sciences, Kurukshetra University, Kurukshetra – 136119, Haryana, India. [b] Department of Pharmacy, Oman Medical College, Muscat, Sultanate of Oman. [c] Department of Pharmaceutical Chemistry, Faculty of Pharmacy, Jamia Hamdard (Hamdard University), New Delhi, 110062, India. *Author for correspondence; e-mail: [email protected], [email protected] Received 29 September 2016 Accepted 27 December 2016 ABSTRACT The current study aimed to identify the core structural features of selective p56 lck inhibitors to design and develop molecules useful in inflammatory and autoimmune disorders. A set of known p56 lck inhibitors were retrieved from the data bank using PHASE program and a three-dimensional pharmacophore hypothesis was constructed. Six points pharmacophore having four common structural features such as one hydrophobic site (H), two hydrogen bond acceptors (A), one hydrogen bond donor (D) and two aromatic rings (R) were developed. The best pharmacophore hypothesis was found to be AADHRR.15 which showed a regression coefficient value (r 2 ) of 0.854 and produced a statistically significant 3 dimensional Quantitative structure activity relationship (QSAR) model. An external validation was further carried out to assess the quality and prediction reliability of the developed pharmacophore model. The generated model showed potential in good prediction of activity as indicated by the squared predictive correlation coefficient of 0.841 observed between experimental and predicted activity values of test set molecules. Thus, based on the results, it can be contemplated that the constructed hypothesis in this study seems to be a useful and reliable tool that can be used in identifying p56 lck inhibitors with improved potency and efficacy. . Keywords: autoimmune disorders, 3D-QSAR, PHASE program, pharmacophore, p56 lck inhibitors 1. INTRODUCTION A number of protein tyrosine kinases (PTK) are activated as the earliest biochemical response in T-cell receptor (TCR) mediated signal transduction [1]. Tyrosine kinase enzyme is responsible for the transfer of the γ-phosphate group of either ATP or GTP to the specific tyrosine residues in protein substrates in a cell and hence, functions as a central “on” and “off ” switch in different cellular signal transduction pathways. They are considered as key mediators in the normal cellular signal transduction processes [2]. The sarcoma (src) family of protein tyrosine kinase (PTK) genes is made up of ten known members, c-src, c-yes, yrk, c-fgr, fyn, lyn, lck, hck, blk and rak [3]. A typical example of non- receptor PTK of src-family is p56 lck which is
Transcript of 3D-QSAR and Pharmacophore Identification of …best pharmacophore hypothesis was found to be...
Chiang Mai J. Sci. 2018; 45(2) : 1062-1072http://epg.science.cmu.ac.th/ejournal/Contributed Paper
3D-QSAR and Pharmacophore Identification of Benzothiazole Derivatives as Potent p56lck InhibitorsKanika Arora [a], Sukhbir Lal Khokra [a], Shah Alam Khan [b] and Asif Husain*[c][a] Institute of Pharmaceutical Sciences, Kurukshetra University, Kurukshetra – 136119, Haryana, India.
[b] Department of Pharmacy, Oman Medical College, Muscat, Sultanate of Oman.
[c] Department of Pharmaceutical Chemistry, Faculty of Pharmacy, Jamia Hamdard (Hamdard University), New Delhi, 110062, India.
*Author for correspondence; e-mail: [email protected], [email protected]
Received 29 September 2016Accepted 27 December 2016
ABSTRACT The current study aimed to identify the core structural features of selective p56lck
inhibitors to design and develop molecules useful in inflammatory and autoimmune disorders. A set of known p56lck inhibitors were retrieved from the data bank using PHASE program and a three-dimensional pharmacophore hypothesis was constructed. Six points pharmacophore having four common structural features such as one hydrophobic site (H), two hydrogen bond acceptors (A), one hydrogen bond donor (D) and two aromatic rings (R) were developed. The best pharmacophore hypothesis was found to be AADHRR.15 which showed a regression coefficient value (r2) of 0.854 and produced a statistically significant 3 dimensional Quantitative structure activity relationship (QSAR) model. An external validation was further carried out to assess the quality and prediction reliability of the developed pharmacophore model. The generated model showed potential in good prediction of activity as indicated by the squared predictive correlation coefficient of 0.841 observed between experimental and predicted activity values of test set molecules. Thus, based on the results, it can be contemplated that the constructed hypothesis in this study seems to be a useful and reliable tool that can be used in identifying p56lck inhibitors with improved potency and efficacy.
. Keywords: autoimmune disorders, 3D-QSAR, PHASE program, pharmacophore, p56lck inhibitors
1. INTRODUCTIONA number of protein tyrosine kinases
(PTK) are activated as the earliest biochemical response in T-cell receptor (TCR) mediated signal transduction [1]. Tyrosine kinase enzyme is responsible for the transfer of the γ-phosphate group of either ATP or GTP to the specific tyrosine residues in protein substrates in a cell and hence, functions as a central “on” and “off ”
switch in different cellular signal transduction pathways. They are considered as key mediators in the normal cellular signal transduction processes [2]. The sarcoma (src) family of protein tyrosine kinase (PTK) genes is made up of ten known members, c-src, c-yes, yrk, c-fgr, fyn, lyn, lck, hck, blk and rak [3]. A typical example of non-receptor PTK of src-family is p56lck which is

Chiang Mai J. Sci. 2018; 45(2) 1063
expressed at high levels in T-lymphocytes and natural killer (NK) cells [4]. p56lck is made up of a single polypeptide chain containing 509 amino acids. It plays pivotal roles in thymocyte development and transducing apoptotic signals in T-cells, initiation and regulation of T-cells antigen receptor (TCR) signaling, activation-induced intracellular Ca2+ mobilization, and up regulation of cytokine such as production of interleukin-2 (IL-2) [5,6]. The T-cells that lack lck are shown to be severely impaired in TCR tyrosine phosphorylation and activation [7]. Its typical role has also been shown for FasL expression during activation-induced T-cell apoptosis [8]. So, the selective inhibitors seems to be a viable option for treatment of both acute and chronic T-cell mediated inflammatory and autoimmune disorders like- rheumatoid arthritis, multiple sclerosis and delayed hypersensitivity and may have extensive therapeutic utilization in prevention of solid organ transplant rejection [9]. Although, chemicals such as, anthraquinone derivatives (e.g. damnacanthal, nordamnacanthal) have proven to be efficacious in p56lck inhibition, but unfortunately, their use is associated with some undesirable adverse effects [10,11]. In order to improve the efficacy, to minimize or abolish the adverse effects of existing therapeutic agents and/or to develop drugs of choice, there is a need to search for new, selective and potent p56lck inhibitors for further drug development.
Pharmacophore modeling is a computational method for the drug design which takes in to account the essential structural features of biologically active ligands and their interaction with the target protein receptors. In brief, this approach is based on the correlation of spatial arrangements of various chemical functionalities with the biological activities [12]. For this purpose, the structural features seem to be important for the biological activity of ligand(s) as well as for binding interaction with the receptors are identified and arranged in 3D
space [13, 14]. The pharmacophore modeling is a reliable and well established technique in pharmaceutical industries to quantitatively delve into common chemical features among a large data base of structures. A successful pharmacophore model could also be used as an important tool to search chemical databases in order to find new chemical entities (NCE). 3D quantitative structure activity relationships (3D QSAR) and pharmacophore modeling are the versatile and commonly used tools in ligand based drug design (LBDD). They can provide predictive models suitable for lead identification and optimization [15]. These in silico techniques can be used in drug discovery in several ways, e.g. to rationalize the activity trends in molecules under study, to predict the activity of new compounds, to conduct database search in hope of finding new hits and to identify essential chemical features for activity [16-19].
Benzothiazole is a versatile heterocyclic moiety representing a core structural feature of numerous synthetic and natural marine as well as plant products. It is an example of bicyclic ring system in which benzene is fused with a biologically active five membered thiazole ring [20]. The comprehensive literature review indicates that benzothiazole nucleus and its derivative possess a wide range of useful pharmacological activities including anti-inflammatory, anticonvulsant, antitumor, antidiabetic, anthelmintic, antimicrobial and antimalarial etc [21]. Because of the high degree of structural diversity offered by benzothiazole analogs, this nucleus attracted the attention of medicinal chemists and over the last decade this ring system has been explored for its p56lck inhibitory activity in an attempt to develop potent therapeutic agents[22]. Badiger et al., in 2006 developed a QSAR model based on the structure of 45 analogs of benzothiazole in order to predict the essential structural features of benzothiazole derivatives that

Chiang Mai J. Sci. 2018; 45(2)1064
could exhibit potent p56lck inhibitory activity [23]. The prediction results of their QSAR model were in agreement with the experimental results previously obtained by Das et al., [24]. In another study, Mohmed et al., built a 3D QSAR model based on comparative molecular field analysis (CoMFA) and comparative molecular similarity indices analysis (CoMSIA) to identify potent p56lck inhibitors having a benzothiazole ring system [25]. They also validated the predictive ability of the models to have better understanding of the relationship between the structural features of benzothiazole p56lck inhibitors and its activities.
In this article, we have discussed the development of a suitable, robust and reliable ligand-based 3D-pharmacophore hypothesis using pharmacophore alignment and scoring engine PHASE for benzothiazole derivatives as potent p56lck inhibitors. The alignment acquired from the pharmacophoric points is employed to develop a pharmacophore based 3D-QSAR model that can provide a rational hypothetical picture of primary chemical functionalities responsible for biological activity [19].
2. MATERIALS AND METHODS2.1 Data Set
The in- vitro biological data of a library of 64 compounds with the p56lck inhibitory activity was used in the current study [24]. IC50 value i.e. the effective concentration of a compound (µM) that inhibits 50% of enzyme activity is used to express the p56lck inhibitory activity. The dataset was divided randomly into two sets namely training and test set by keeping the 75% of the total compounds in the training set and remaining 25% in the test set. Forty eight structures in the training set were used for generation of pharmacophore models and to predict the activity of 16 compounds in test set. The developed models were also validated by using the same set. The basic chemical structures of selected molecules and
their various substituents are shown in Figure 1 and Table 1, respectively.
2.2 Pharmacophore Modeling Pharmacophore modeling and 3-D database searching are two important components of lead discovery and lead optimization. A ‘PHASE’ program was developed to meet the continuing demand in industries for the improved pharmacophore based tools in drug design and discovery [26]. In the present study, we have used ‘PHASE’ a module of Schrödinger’s software program ‘MAESTRO’ to develop a reliable pharmacophoric model for identifying potential therapeutic p56lck inhibitors [27].
2.3 Ligand Preparation Ligand preparation is the first step in any pharmacophore modeling studies. Maestro was used to draw the chemical structures of all the
N
SNH
R1
O
NH
R
(A)
N
SNH
O
NH
R
N
R1
(B)
N
SNH
O
NH
R
N
NR1
(C)
Figure 1. Basic structures of 2-amino-heteroaryl benzothiazole-6-anilides series.

Chiang Mai J. Sci. 2018; 45(2) 1065
Table 1. Different substituents attached to basic structures of 2-amino-heteroaryl benzothiazole-6-anilides.
Sr. No. Set R R1 Series Sr.
No. Set R R1 Series
1. A 2,4,6-Me3 H Training 33. B 2-Cl,6-Me 6-Me2NCH2 Training
2. A 2,4,6-Me3 Ph Training 34. B 2-Cl,6-Me 6-H2NCMe2-CH2NH Training
3. A 2,4,6-Me3 Cyclopropyl-CH2 Training 35. B 2,4,6-Me3 3-Me Test
4. A 2,4,6-Me3 2-Thiazolyl Training 36. B 2,4,6-Me3 5-Me Test
5. A 2,4,6-Me3 2-Imidazolyl Training 37. B 2-Cl, 6-Me 4-Me Test
6. A 2,4,6-Me3 4-Imidazolyl Training 38. B 2-Cl, 6-Me 6-Me Test
7. A 2,4,6-Me3 5-(1,2,4-Triazolyl) Training 39. B 2-Cl, 6-Me 4-NMe-Piperazino CH2 Test
8. A 2,4,6-Me3 2-Pyridyl Training 40. B 2-Cl, 6-Me 6-Morpholino CH2 Test
9. A 2,4,6-Me3 3-Pyridyl Training 41. B 2-Cl, 6-Me 6-HO-CH2CH2NH Test
10. A 2,4,6-Me3 4-Pyridyl Training 42. B 2-Cl, 6-Me 6-AcNH-CH2CH2NH Test
11. A 2,4,6-Me3 2-Pyrimidinyl Training 43. C 2,4,6-Me3 6-Et Training
12. A 2,4,6-Me3 2-Pyrazinyl Training 44. C 2-Cl,6-Me 2-Cl Training
13. A 2-Cl,6-Me 2-Imidazolyl Training 45. C 2-Cl,6-Me 2-MeNH Training
14. A 2-Cl,6-Me 3-Pyrazolyl Training 46. C 2-Cl,6-Me 2-HO-CH2CH2NH Training
15. A 2-Cl,6-Me 2-Pyridyl Training 47. C 2-Cl,6-Me 6-Me Training
16. A 2-Cl,6-Me 4-Pyrimidinyl Training 48. C 2-Cl,6-Me 6-Cl Training
17. A 2-Cl,6-Me 2-Pyridazinyl Training 49. C 2-Cl,6-Me 6-OMe Training
18. A 2-Cl,6-Me 3-Pyrazinyl Training 50. C 2-Cl,6-Me 6-NH2 Training
19. A 2,4,6-Me3 4-Pyrimidinyl Test 51. C 2-Cl,6-Me 6-MeNH Training
20. A 2,4,6-Me3 3-(1,2,4-Triazinyl) Test 52. C 2-Cl,6-Me 6-AcNH-CH2CH2NH Training
21. A 2-Cl, 6-Me Ph Test 53. C 2-Cl,6-Me 2,6-di-Me Training
22. B 2,4,6-Me3 4-Me Training 54. C 2-Cl,6-Me 2-Me, 6-MeNHCH2 Training
23. B 2,4,6-Me3 6-Me Training 55. C 2-Cl,6-Me 2-Me, 6-MeNHCH2 Training
24. B 2,4,6-Me3 3,5-di-Me Training 56. C 2-Cl,6-Me 2-HOCH2 -CH2NH, 6-Me Training
25. B 2-Cl,6-Me H Training 57. C 2-Cl,6-Me 2-HOCMe2 -CH2NH, 6-Me Training
26. B 2-Cl,6-Me 5-Me Training 58. C 2-Cl,6-Me 2-(2-tetrahyd- rofurylCH2 -NH), 6-Me Training
27. B 2-Cl,6-Me 4,6-di-Me Training 59. C 2-Cl,6-Me 2-Morpholino CH2, 6-Me Training
28. B 2-Cl,6-Me 4-Et Training 60. C 2,4,6-Me3 2,6-di-Me Test
29. B 2-Cl,6-Me 4-NH2 Training 61. C 2-Cl, 6-Me H Test
30. B 2-Cl,6-Me 4-Me2NCH2 Training 62. C 2-Cl, 6-Me 6-Et Test
31. B 2-Cl,6-Me 4-Morpholino CH2
Training 63. C 2-Cl, 6-Me 6-HOCH2 -CH2NH Test
32. B 2-Cl,6-Me 6-NH2 Training 64. C 2-Cl, 6-Me 2-Me, 6-Morp -holino CH2
Test

Chiang Mai J. Sci. 2018; 45(2)1066
compounds which were then geometrically refined by using LigPrep module. LigPrep is a combination of very powerful tools that are widely used to generate high quality, all-atom 3D structures for large numbers of drug-like molecules presented as 2D or 3D structures in SDF or Maestro format. The simplest use of LigPrep results in output of a single, low energy minimized 3D structure with correct chiralities for each successfully processed input structure.
In this step, 3D structure was used to determine chirality by retaining original states of ionization. A MacroModel method was used to generate tautomers after discarding current conformers. The conformations were obtained by the Monte Carlo (MCMM) method as implemented in MacroModel version 9.6 using a maximum of 2,000 steps with a distance-dependent dielectric solvent model and an OPLS-2005 force field. A truncated Newton conjugate gradient (TNCG) minimization up to 500 iterations was employed to minimize the energy of all conformers. For each compound, a set of conformers with a maximum energy difference of 30kcal/mol as compared to the global energy minimum conformer were retained. The generalized born/solvent accessible surface (GB/SA) continuum solvation model was used for conformational searches for aqueous solution [28].
2.4 Creation of Pharmacophoric Sites The second step in building a pharmacophore model is to use an array of pharmacophore features to create pharmacophore site points for all the ligands. An initial analysis of the selected benzothiazole compounds for essential chemical features indicated that there are four descriptors of chemical features i.e., hydrogen-bond acceptor (A), hydrogen bond donor (D), aromatic ring (R) and hydrophobic site (H) which could effectively map all important chemical features of all molecules in the data
set. The minimum and maximum sites for all the chemical features were set at 6 and 6, respectively. These selected chemical features were used to develop and generate a series of hypotheses using a find common pharmacophore command option in PHASE.
2.5 Search of a Common Pharmacophore This step involves grouping of pharmacophore based on common chemical features and similar spatial arrangements in the training set. After examination of all conformations of the ligand molecules in the training set, pharmacophores that were having similar sets of chemical features with almost alike spatial arrangements, were grouped together. If a particular group is found to have at least one pharmacophore from each ligand, then this group results in a common pharmacophore. Any single pharmacophore in the group could finally become a common pharmacophore hypothesis. For the identification of common pharmacophores a tree-based partitioning technique was used that groups together similar pharmacophores as per their inter site distances, i.e. the distances between pairs of sites in the pharmacophore.
2.6 Scoring Hypothesis The common pharmacophore hypothesis built in previous steps was assessed by employing a scoring function to get the best alignment of the active ligands keeping an overall maximum root mean square deviation (RMSD) value of 1.2 Å for distance tolerance. Survival score was used to measure the quality of alignment [29].
2.7 Generation of 3D-QSAR Model PHASE helps in building 3D QSAR models for a group of ligands that are aligned to a selected hypothesis. The PHASE 3D QSAR model divides the space occupied by the ligands into a cubic grid shape. Any structural component can occupy part of one or more cubes. A cube is considered occupied by a

Chiang Mai J. Sci. 2018; 45(2) 1067
feature if its centroid is within the radius of the feature. The size of the cubes can be adjusted and set manually by changing the value in the grid spacing text box. A series of models with an increasing number of Partial least squares (PLS) factors were constructed and regression analysis was done. In the present study, the pharmacophore based model was produced having 1Å grid space value while maximum number of PLS factors were set to 3.
2.8 Validation of Pharmacophore Model Validation is a pivotal part of pharmacophore design, especially when the intention of building a model is to predict activities of compounds in external test series [30]. External validation is seen as a definite proof for assessing quality and prediction reliability of a model. Our aim was to develop robust QSAR models that are statistically reliable and accurate in both internal and external validation for predicting the biological activities of new molecules. In this study, we validated the developed pharmacophore model by predicting the activity of test set molecules and by determining the correlation between the experimental and predicted activities of the test set molecules.
3. RESULTS AND DISCUSSION The motive of pharmacophore modeling is to perform in silico screening searches in a 3 dimensional database of a virtual or real compound library in order to find diverse structures with desired binding activity and selectivity [31]. We selected a series of 2-amino-heteroaryl benzothiazole-6-anilides for virtual molecular modeling studies. The study aimed to develop a ligand based pharmacophore model based on the p56lck inhibitory activity of 2-amino-heteroaryl benzothiazole-6-anilides to gain useful information and better insight of ligand – lymphocyte-specific protein tyrosine kinase inhibitor interaction.
Forty eight molecules comprising the training set were used to develop the pharmacophores. The pharmacophoric features chosen for creating sites were hydrogen bond acceptor (A), hydrogen bond donor (D), aromatic rings (R) and hydrophobic site (H). Pharmacophore models containing four, five, six and seven sites, i.e., chemical structural features were created. Because of low value of survival score, the pharmacophore hypotheses based on four and five features were rejected, as they were unable to define the complete binding space of the selected chemical compounds. Similarly, pharmacophore hypothesis developed using seven core features was also rejected as no common pharmacophore was found. Six featured pharmacophore hypothesis, the most suitable hypothesis was picked and subjected to severe scoring function analysis.
The results of six featured pharmacophore hypothesis, labeled AADHRR.15 is presented in Table 2. The first hypothesis of AADHRR.15 was found to be the best hypothesis in this study. It showed the highest survival score (3.203) and the best regression coefficient (r2=0.854). The AADHRR.15 pharmacophore hypothesis is illustrated in Figure 2. The chemical features of this hypothesis include two hydrogen bond acceptors (A), one hydrogen bond donor (D), one hydrophobic site (H) and two aromatic rings (R).
For each ligand, one aligned conformer based on the lowest RMSE of feature atom coordinates from those of the corresponding reference
Table 2. Parameters of six featured pharmacophore hypothesis.
S. No. Hypothesis Survival Score R2 F
1. AADHRR.15 3.203 0.854 66.52. AADHRR.16 3.184 0.798 77.73. AADHRR.13 2.966 0.7868 72.64. AADHRR.3 2.845 0.7605 62.55. AADHRR.14 2.333 0.8028 80.1

Chiang Mai J. Sci. 2018; 45(2)1068
18
Figure 2. PHASE generated pharmacophore model AADHRR.15 showing hydrogen bond acceptor (A2, A3; pink), hydrogen bond donor (D4; blue), hydrophobic group (H7; green) and aromatic ring (R11, R12; orange) features.
Figure 3. Best pharmacophore model AADHRR.15 aligned with molecule 23. Pharmacophore features are color coded: hydrogen bond acceptor (A2, A3: pink), hydrogen bond donor (D4, blue), hydrophobic group (H7, green) and aromatic ring (R11, R12, orange).
Figure 2. PHASE generated pharmacophore model AADHRR.15 showing hydrogen bond acceptor (A2, A3; pink), hydrogen bond donor (D4; blue), hydrophobic group (H7; green) and aromatic ring (R11, R12; orange) features.
to all training set molecules. Afterwards, the AADHRR.15 model was used to predict the activities of test set molecule and the results were compared with the actual activity. Actual and predicted activity values of test set molecules are given in Table 4. The predicted p56lck inhibitory activity of test molecule showed a correlation of 0.841 with reported p56lck inhibitory activity using model AADHRR.15 (Figure 5). For a reliable model, the squared predictive correlation coefficient should be >0.6 [32,33]. The results of this study support that the developed model AADHRR.15 can be used for the successful prediction of p56lck inhibitory activity of chemical compounds.
3-D QSAR of compound 23 of the training set model illustrates the hydrogen bond acceptor feature in Figure 6. The red region at pharmacophoric region highlights the importance of hydrogen acceptor group here; if this position is occupied by any hydrogen bond acceptor then it will result in significant increase in activity. Similarly, green region indicates that presence of any hydrogen bond acceptor in this region is not favorable for the activity.
The 3-D QSAR model based on hydrogen bond donor feature is shown in Figure 7. The green region at the site of pharmacophore (A2) shows that if any hydrogen bond donor occupies this position, it would result in decrease in p56lck inhibitory activity. Similarly, red and green regions in Figure 8 specify the positions where hydrophobic groups will increase and decrease p56lck inhibitory activity, respectively.
Several QSAR models based on hydrophobic parameters, hydration energy [2], partial charge, subdivided surface area, van der walls volume, Wiener path number (2D descriptors), internal 3D predictor parameters such as total energy, electronic energy, water accessible surface area, van der walls surface area and volume [23], k-Nearest Neighbor Molecular Field Analysis (kNN-MFA) [34], comparative molecular field
feature was superimposed on AADHRR.15. The fitness scores for all ligands were determined against the best scored pharmacophore model AADHRR.15. The higher is the fitness score, the greater would be the activity prediction of the compound. The fit function does not only check if the feature is mapped or not, it also contains a distance term, which measures the distance that separates the feature on the molecule from the centroid of the hypothesis feature. Table-3 shows the fitness score for all the molecules of training set.
In addition to the survival score analysis, the quality of AADHRR.15 was characterized by another validation method which is based on its capacity for correct activity prediction of training set molecules. The actual and estimated p56lck antagonistic activity of 48 molecules of the training set based on the pharmacophore hypothesis AADHRR.15 are given in Table-3. The predicted p56lck antagonistic activity of training set molecule gave a regression correlation coefficient of 0.854 with already reported p56lck antagonistic activity using model AADHRR.15 (Figure 4).
The validity and predictability of AADHRR.15 were further examined by using the test set prediction. The test set comprising of sixteen molecules was analyzed. All the test set molecules were built, energy minimized and used in conformational analysis similar

Chiang Mai J. Sci. 2018; 45(2) 1069
Table 3. Experimental and predicted pKi values of training set molecules based on hypothesis AADHRR.15.
Comp.No.
Experimental pKi
Predicted pKi
FitnessScore
Comp.No.
Experimental pKi
Predicted pKi
FitnessScore
1. 4.82 5.44 2.76 28. 8.30 7.60 1.402. 5.76 5.80 2.88 29. 6.40 6.68 1.403. 5.51 6.14 2.23 30. 8.05 7.77 1.384. 5.51 5.63 1.47 31. 9.00 9.18 2.055. 5.51 5.77 2.92 32. 8.70 8.04 2.866. 5.51 6.08 1.48 33. 8.00 7.90 2.787. 5.51 5.51 2.91 34. 8.22 8.10 2.708. 6.86 6.51 1.47 43. 7.11 7.03 1.459. 5.51 5.48 2.89 44. 7.51 7.61 2.8710. 5.51 5.53 2.90 45. 7.70 7.93 2.8511. 5.51 5.63 1.46 46. 8.52 8.67 2.7512. 6.63 6.31 2.95 47. 7.68 7.58 1.4013. 5.51 6.60 1.42 48. 7.70 7.74 1.4014. 5.80 6.52 2.80 49. 7.89 7.82 1.3915. 7.08 7.20 1.41 50. 8.10 7.55 1.4016. 7.57 7.50 1.41 51. 8.70 7.90 1.4017. 7.39 6.85 1.41 52. 8.22 8.24 2.6318. 7.82 7.23 1.41 53. 7.70 7.77 1.4022. 7.50 7.17 2.92 54. 8.16 8.01 2.7823. 6.75 6.68 3.00 55. 8.16 8.01 2.7824. 7.77 7.11 2.89 56. 8.70 8.87 2.7225. 7.06 7.20 1.41 57. 8.22 8.27 2.6726. 7.46 7.22 2.79 58. 9.00 9.04 2.0527. 8.10 7.91 2.84 59. 8.00 8.19 2.06
Table 4. Experimental and predicted pKi values of test set molecules based on hypothesis AADHRR.15.
Comp.No.
Experimental pKi
Predicted pKi
FitnessScore
Comp.No.
Experimental pKi
Predicted pKi
FitnessScore
19. 6.40 6.38 1.46 40. 7.89 7.87 2.04
20. 5.72 5.58 1.47 41. 9.30 8.52 2.77
21. 6.49 6.65 1.41 42. 8.70 7.43 2.49
35. 5.51 6.42 2.92 60. 7.28 7.30 2.96
36. 7.14 7.10 2.92 61. 7.57 7.50 1.41
37. 7.70 7.45 1.41 62. 8.30 7.89 1.41
38. 8.05 8.00 2.87 63. 8.10 8.04 2.71
39. 9.00 8.54 2.06 64. 8.22 8.47 2.05

Chiang Mai J. Sci. 2018; 45(2)1070
analysis (CoMFA) and comparative molecular similarity indices analysis (CoMSIA) [25] and receptor surface analysis (RSA) models [35] have been developed in the past to identify the compounds with potential p56lck inhibitory activities. All these proposed models employed different number of molecules which were subdivided into two sets of training and test molecules. Our proposed model showed either comparable or better regression coefficient (r2=
18
Figure 2. PHASE generated pharmacophore model AADHRR.15 showing hydrogen bond acceptor (A2, A3; pink), hydrogen bond donor (D4; blue), hydrophobic group (H7; green) and aromatic ring (R11, R12; orange) features.
Figure 3. Best pharmacophore model AADHRR.15 aligned with molecule 23. Pharmacophore features are color coded: hydrogen bond acceptor (A2, A3: pink), hydrogen bond donor (D4, blue), hydrophobic group (H7, green) and aromatic ring (R11, R12, orange).
Figure 3. Best pharmacophore model AADHRR.15 aligned with molecule 23. Pharmacophore features are color coded: hydrogen bond acceptor (A2, A3: pink), hydrogen bond donor (D4, blue), hydrophobic group (H7, green) and aromatic ring (R11, R12, orange).
19
Figure 4. Relation between experimental and predicted p56lck antagonistic activity values of training set molecules using model AADHRR.15.
Figure 5. Relation between experimental and predicted p56lck inhibitory activity values of test set molecules using model AADHRR.15.
R² = 0.8549
4
5
6
7
8
9
10
4 5 6 7 8 9 10
R² = 0.8417
4
4.5
5
5.5
6
6.5
7
7.5
8
8.5
9
4 5 6 7 8 9 10
Experimental activities
Pred
icte
d ac
tiviti
es
Experimental activities
Pred
icte
d ac
tiviti
es
Figure 4. Relation between experimental and predicted p56lck antagonistic activity values of training set molecules using model AADHRR.15.
19
Figure 4. Relation between experimental and predicted p56lck antagonistic activity values of training set molecules using model AADHRR.15.
Figure 5. Relation between experimental and predicted p56lck inhibitory activity values of test set molecules using model AADHRR.15.
R² = 0.8549
4
5
6
7
8
9
10
4 5 6 7 8 9 10
R² = 0.8417
4
4.5
5
5.5
6
6.5
7
7.5
8
8.5
9
4 5 6 7 8 9 10
Experimental activities
Pred
icte
d ac
tiviti
es
Experimental activities
Pred
icte
d ac
tiviti
es
Figure 5. Relation between experimental and predicted p56lck inhibitory activity values of test set molecules using model AADHRR.15.
20
Figure 6. 3-D QSAR model based on compound 23 of the training set illustrating hydrogen bond acceptor feature
Figure 7. 3-D QSAR model based on compound 23 of the training set illustrating hydrogen bond donor feature
Figure 6. 3-D QSAR model based on compound 23 of the training set illustrating hydrogen bond acceptor feature.
20
Figure 6. 3-D QSAR model based on compound 23 of the training set illustrating hydrogen bond acceptor feature
Figure 7. 3-D QSAR model based on compound 23 of the training set illustrating hydrogen bond donor feature
Figure 7. 3-D QSAR model based on compound 23 of the training set illustrating hydrogen bond donor feature.
21
Figure 8. 3-D QSAR model based on compound 23 of the training set illustrating hydrophobicity feature Table 1. Different substituents attached to basic structures of 2-amino-heteroaryl benzothiazole-6-anilides
Sr. No.
Set R R1 Series Sr. No.
Set R R1 Series
1. A 2,4,6-Me3 H Training 33. B 2-Cl,6-Me 6-Me2NCH2 Training 2. A 2,4,6-Me3 Ph Training 34. B 2-Cl,6-Me 6-H2NCMe2-
CH2NH Training
3. A 2,4,6-Me3 Cyclopropyl-CH2
Training 35. B 2,4,6-Me3 3-Me Test
4. A 2,4,6-Me3 2-Thiazolyl Training 36. B 2,4,6-Me3 5-Me Test 5. A 2,4,6-Me3 2-Imidazolyl Training 37. B 2-Cl, 6-Me 4-Me Test 6. A 2,4,6-Me3 4-Imidazolyl Training 38. B 2-Cl, 6-Me 6-Me Test 7. A 2,4,6-Me3 5-(1,2,4-
Triazolyl) Training 39. B 2-Cl, 6-Me 4-NMe-
Piperazino CH2 Test
8. A 2,4,6-Me3 2-Pyridyl Training 40. B 2-Cl, 6-Me 6-Morpholino CH2
Test
9. A 2,4,6-Me3 3-Pyridyl Training 41. B 2-Cl, 6-Me 6-HO-CH2CH2NH
Test
10. A 2,4,6-Me3 4-Pyridyl Training 42. B 2-Cl, 6-Me 6-AcNH-CH2CH2NH
Test
11. A 2,4,6-Me3 2-Pyrimidinyl Training 43. C 2,4,6-Me3 6-Et Training 12. A 2,4,6-Me3 2-Pyrazinyl Training 44. C 2-Cl,6-Me 2-Cl Training
Figure 8. 3-D QSAR model based on compound 23 of the training set illustrating hydrophobicity feature.
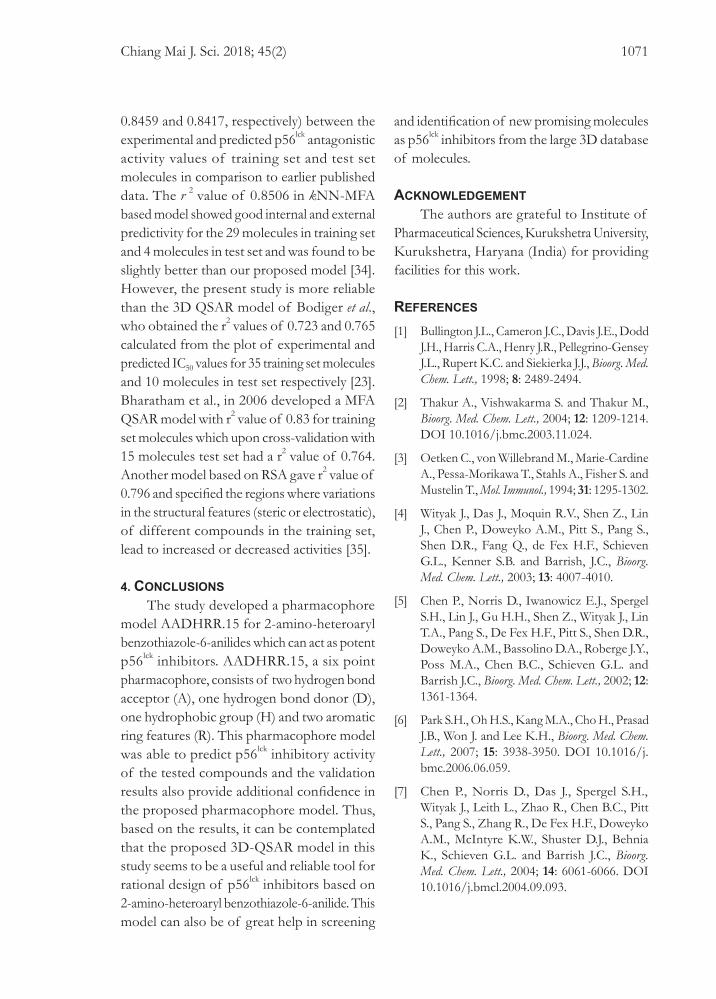
Chiang Mai J. Sci. 2018; 45(2) 1071
0.8459 and 0.8417, respectively) between the experimental and predicted p56lck antagonistic activity values of training set and test set molecules in comparison to earlier published data. The r 2 value of 0.8506 in kNN-MFA based model showed good internal and external predictivity for the 29 molecules in training set and 4 molecules in test set and was found to be slightly better than our proposed model [34]. However, the present study is more reliable than the 3D QSAR model of Bodiger et al., who obtained the r2 values of 0.723 and 0.765 calculated from the plot of experimental and predicted IC50 values for 35 training set molecules and 10 molecules in test set respectively [23]. Bharatham et al., in 2006 developed a MFA QSAR model with r2 value of 0.83 for training set molecules which upon cross-validation with 15 molecules test set had a r2 value of 0.764. Another model based on RSA gave r2 value of 0.796 and specified the regions where variations in the structural features (steric or electrostatic), of different compounds in the training set, lead to increased or decreased activities [35].
4. CONCLUSIONS The study developed a pharmacophore model AADHRR.15 for 2-amino-heteroaryl benzothiazole-6-anilides which can act as potent p56lck inhibitors. AADHRR.15, a six point pharmacophore, consists of two hydrogen bond acceptor (A), one hydrogen bond donor (D), one hydrophobic group (H) and two aromatic ring features (R). This pharmacophore model was able to predict p56lck inhibitory activity of the tested compounds and the validation results also provide additional confidence in the proposed pharmacophore model. Thus, based on the results, it can be contemplated that the proposed 3D-QSAR model in this study seems to be a useful and reliable tool for rational design of p56lck inhibitors based on 2-amino-heteroaryl benzothiazole-6-anilide. This model can also be of great help in screening
and identification of new promising molecules as p56lck inhibitors from the large 3D database of molecules.
ACKNOWLEDGEMENT The authors are grateful to Institute of Pharmaceutical Sciences, Kurukshetra University, Kurukshetra, Haryana (India) for providing facilities for this work.
REFERENCES
[1] Bullington J.L., Cameron J.C., Davis J.E., Dodd J.H., Harris C.A., Henry J.R., Pellegrino-Gensey J.L., Rupert K.C. and Siekierka J.J., Bioorg. Med.Chem. Lett., 1998; 8: 2489-2494.
[2] Thakur A., Vishwakarma S. and Thakur M., Bioorg. Med. Chem. Lett., 2004; 12: 1209-1214. DOI 10.1016/j.bmc.2003.11.024.
[3] Oetken C., von Willebrand M., Marie-Cardine A., Pessa-Morikawa T., Stahls A., Fisher S. and Mustelin T., Mol. Immunol., 1994; 31: 1295-1302.
[4] Wityak J., Das J., Moquin R.V., Shen Z., Lin J., Chen P., Doweyko A.M., Pitt S., Pang S., Shen D.R., Fang Q., de Fex H.F., Schieven G.L., Kenner S.B. and Barrish, J.C., Bioorg. Med. Chem. Lett., 2003; 13: 4007-4010.
[5] Chen P., Norris D., Iwanowicz E.J., Spergel S.H., Lin J., Gu H.H., Shen Z., Wityak J., Lin T.A., Pang S., De Fex H.F., Pitt S., Shen D.R., Doweyko A.M., Bassolino D.A., Roberge J.Y., Poss M.A., Chen B.C., Schieven G.L. and Barrish J.C., Bioorg. Med. Chem. Lett., 2002; 12: 1361-1364.
[6] Park S.H., Oh H.S., Kang M.A., Cho H., Prasad J.B., Won J. and Lee K.H., Bioorg. Med. Chem. Lett., 2007; 15: 3938-3950. DOI 10.1016/j.bmc.2006.06.059.
[7] Chen P., Norris D., Das J., Spergel S.H., Wityak J., Leith L., Zhao R., Chen B.C., Pitt S., Pang S., Zhang R., De Fex H.F., Doweyko A.M., McIntyre K.W., Shuster D.J., Behnia K., Schieven G.L. and Barrish J.C., Bioorg. Med. Chem. Lett., 2004; 14: 6061-6066. DOI 10.1016/j.bmcl.2004.09.093.

Chiang Mai J. Sci. 2018; 45(2)1072
[8] Park H.S., Jun D.Y., Han C.R. and Kim Y.H., Biochem. Biophys. Res. Commun., 2008; 377: 280-285. DOI 10.1016/j.bbrc.2008.09.126.
[9] Das J., Lin J., Moquin R.V., Shen Z., Spergel S.H., Wityak J., Doweyko A.M., DeFex H.F., Fang Q., Pang S., Pitt S., Shen D.R., Schieven G.L. and Barrish J.C., Bioorg. Med. Chem. Lett., 2003; 13: 2145-2149.
[10] Alitheen N.B., Mashitoh A.R., Yeap S.K., Shuhaimi M., Manaf A. and Nordin L., Int. Food Res. J., 2010; 17: 711-719.
[11] Myers M.R., Setzer N.N., Spada A.P., Zulli A.L., Hsu C.Y.J., Zilberstein A., Johnson S.E., Hook L.E. and Jackoski M.V., Bioorg Med.Chem. Lett., 1997; 7: 417-420. DOI 10.1016/S0960-894X(97)00034-6.
[12] Dixon S.L., Smondyrev A.M., Knoll E.H., Rao S.N., Shaw D.E. and Friesner R.A., J. Comput. Aided Mol. Des., 2006; 20: 647-671. DOI 10.1007/s10822-006-9087-6.
[13] Roy J., Kumar U.C., Machiraju P.K., Muttineni R.K., Kumar B.V.S.S., Gundla R., Dayam R. and Sarma J., J. Mol. Graph. Model., 2010; 29: 256-265. DOI 10.1016/j.jmgm.2010.07.002.
[14] Debnath A.K., J. Med. Chem., 2002; 45: 41-53.
[15] Acharya C., Coop A., Polli J.E. and Mackerell A.D. Jr., Curr. Comput. Aided Drug Des., 2011; 7: 10-22.
[16] Narkhede S.S. and Degani M.S., QSAR Comb. Sci., 2007; 26: 744-753.
[17] Vepuri S., Tawari N.R. and Degani M.S., QSAR Comb. Sci., 2007; 26: 204-214.
[18] Ramar S., Bag S., Tawari N.R. and Degani M.S., QSAR Comb. Sci., 2007; 26: 608-617.
[19] Hariprasad V. and Kulkarni V.M., J. Comput. Aided Mol. Des., 1996; 10: 284-292.
[20] Gill R.K., Rawal R.K. and Bariwal J., Arch. Pharm. Chem. Life Sci., 2015; 348: 155-178. DOI 10.1002/ardp.201400340.
[21] Keri R.S., Patil M.R., Patil S.A. and Budagumpi S., Eur. J. Med. Chem., 2015; 89 : 207-251. DOI10.1016/j.ejmech.2014.10.059.
[22] Solomon V.R., Hu C. and Lee H., Bioorg. Med. Chem. Lett., 2009; 17: 7585-7592. DOI 10.1016/j.bmc.2009.08.068.
[23] Badiger A.M., Noolvi M.N. and Nayak P.V., Lett. Drug Des. Discov., 2006; 3: 550-560. DOI 10.2174/157018006778194664.
[24] Das J., Moquin R.V., Lin J., Liu C., Doweyko A.M., DeFex H.F., Fang Q., Pang S., Pitt S., Shen D.R., Schieven G.L., Barrish J.C. and Wityak J., Bioorg. Med. Chem. Lett., 2003; 13: 2587-2590. DOI 10.1016/S0960-894X(03)00511-0.
[25] Mohmed J., Nalikala S. and Gunda S.K., Int. J. Pharm. Sci. Res., 2016; 7: 1139-1148.
[26] PHASE, Version 3.0, Schrodinger, LLC, NY2008.
[27] Maestro, Version 8.5, Schrodinger, LLC, NY2008.
[28] Chang G., Guida W.C. and Still W.C., J. Am. Chem. Soc., 1989; 111: 4379-4386. DOI 10.1021/ja00194a035.
[29] Tawari N.R., Bag S. and Degani M.S., J. Mol. Model., 2008; 14: 911-921. DOI: 10.1007/s00894-008-0330-z.
[30] Boyd D.B., Successes of computer- assisted molecular design; Reviews in computational chemistry, VCH, New York, 1990; 4: 355-371.
[31] Wei J., Wang S., Gao S., Dai X. and Gao Q., J. Chem. Inf. Model., 2007; 47: 613-625. DOI 10.1021/ci600410m.
[32] Dureja H., Kumar V., Gupta S. and Madan A.K., J. Theoret. Comput. Chem., 2007; 6: 435-448. DOI 10.1142/S021963360700309X.
[33] Wold S., Quant. Struct. Act. Relat., 1991; 10: 191-193.
[34] Khatik R., Mundada A.B. and Pathak A.K., J. Biomater. Tissue Eng., 2014; 4: 471-478. DOI 10.1166/jbt.2014.1190.
[35] Bharatham N., Bharatham K. and Lee K.W., Bull. Korean Chem. Soc., 2006; 27: 266-272. DOI 10.5012/bkcs.2006.27.2.266.