
Insight into the structural requirement for Anticancer ... Insight into the structural requirement...
21
1 Insight into the structural requirement for Anticancer Activity: Pharmacophore Generation and 3D QSAR Analysis PRITAM NAGESH DUBE* ,a , SANTOSH N. MOKALE b , VIVEKANAND A. CHATPALLIWAR a *Corresponding Author: [email protected] a Department of Pharmaceutical Chemistry, Shri Neminath Jain Bhamhacharyashram’s Shreeman Sureshdada Jain College of Pharmacy, Chandwad, Nashik 423 101, Maharashtra, India b Department of Pharmaceutical Chemistry, Y. B. Chavan College of Pharmacy, Aurangabad- 431001, Maharashtra, India Abstract Transforming growth factor β receptor -associated kinase 1 (TAK1) or mitogen activated-protein kinase kinase kinase 7 (MAP3K7) is a serine/threonine kinase which forms a key part of canonical immune and inflammatory signaling pathways. A 5-point pharmacophore model was developed and the generated pharmacophore model was used to derive a predictive atom-based 3D quantitative structure–activity relationship analysis (3D-QSAR) model for the studied dataset. The obtained 3D-QSAR model has an excellent correlation coefficient value (r 2 = 0.97) along with good statistical significance as shown by high Fisher ratio (F = 266.8). The QSAR model suggests that electron-withdrawing character, hydrogen bond-donating groups, hydrophobic and negative ionic groups positively contribute to the TAK1 inhibition. Keyword: TAK1 inhibitors, anticancer, pharmacophore, 3D QSAR
-
Upload
truongnhan -
Category
Documents
-
view
216 -
download
0
Transcript of Insight into the structural requirement for Anticancer ... Insight into the structural requirement...
1
Insight into the structural requirement for Anticancer Activity:
Pharmacophore Generation and 3D QSAR Analysis
PRITAM NAGESH DUBE*,a, SANTOSH N. MOKALE
b, VIVEKANAND A.
CHATPALLIWARa
*Corresponding Author: [email protected]
a Department of Pharmaceutical Chemistry, Shri Neminath Jain Bhamhacharyashram’s
Shreeman Sureshdada Jain College of Pharmacy, Chandwad, Nashik 423 101, Maharashtra,
India
b Department of Pharmaceutical Chemistry, Y. B. Chavan College of Pharmacy, Aurangabad-
431001, Maharashtra, India
Abstract
Transforming growth factor β receptor-associated kinase 1 (TAK1) or mitogen activated-protein
kinase kinase kinase 7 (MAP3K7) is a serine/threonine kinase which forms a key part of
canonical immune and inflammatory signaling pathways. A 5-point pharmacophore model was
developed and the generated pharmacophore model was used to derive a predictive atom-based
3D quantitative structure–activity relationship analysis (3D-QSAR) model for the studied
dataset. The obtained 3D-QSAR model has an excellent correlation coefficient value (r2 = 0.97)
along with good statistical significance as shown by high Fisher ratio (F = 266.8). The QSAR
model suggests that electron-withdrawing character, hydrogen bond-donating groups,
hydrophobic and negative ionic groups positively contribute to the TAK1 inhibition.
Keyword: TAK1 inhibitors, anticancer, pharmacophore, 3D QSAR
Usuario
Texto escrito a máquina
doi:10.3390/ecsoc-19-e004
2
1. Introduction
Transforming growth factor β receptor-associated kinase 1 (TAK1) or mitogen activated-protein
kinase kinase kinase 7 (MAP3K7) is a serine/threonine kinase which forms a key part of
canonical immune and inflammatory signaling pathways.1 TAK1 mediates signaling downstream
of multiple cytokine receptors (TGFβR, TNFR, TLRs, IL-1R, etc.). Although the precise
mechanisms governing TAK1 activation and signaling are complex, involving extensive
ubiquitination and the TAB family of adaptor proteins, it has been established that TAK1
directly phosphorylates and activates members of the MAP kinase kinase (MKK) family,
including MKK3/4/6/7, as well as the IKK family, which are the immediate activators of the
MAP kinases p38 and JNK and the transcription factor NFκB. 2-4
Members of the family of nuclear factor-κB (NF-κB) transcription factors regulate expression of
a large number of genes involved in immune and inflammatory responses, as well as in cell
survival, proliferation, and differentiation. Inappropriate activation of NF-κB signaling has been
implicated in the pathogenesis of chronic inflammation, autoimmunity, and various cancers.5 For
this reason, there has been some interest in exploring the therapeutic potential of TAK1
inhibitors in cancers with an inflammatory component, for example, ovarian and colorectal
carcinomas, as well as in hematological malignancies.6-7
A large number of molecular modelling programs have been developed and widely used in the
pharmaceutical and biological industry as well as in academia. The extensive applications of
these software‟s and the chemical databases have made CADD a valuable tool in drug discovery
and development process.8-10
Pharmacophore modelling involves extracting common chemical
features (hydrogen-bond acceptors, hydrogen bond donors, hydrophobic regions and positively
or negatively charged groups) from 3D structures of a set of known ligands, representative of
essential ligand–receptor interactions. In medicinal chemistry, pharmacophore modelling is used
not only for hit-and-lead identification but also for lead optimization, drug design and discovery.
3D QSAR analysis is performed for generating models which correlates biological activity with
physico-chemical properties of the molecules. A statistically significant 3D QSAR model helps
in better understanding of structure activity relationship of a series of molecules and predicts the
activity of yet to be synthesized compounds.11
Related to the foregoing studies, the present paper reports 3D-QSAR analysis of set of 7-
aminofuro [2,3-c]pyridine derivatives, reported by Hornberger K. R. et al. 12
and intends to

3
provide the platform to develop new compounds over existing substituted pyridines. Pyridines
scaffolds are to modify and a range of molecules can be synthesized. However, substituted
pyridines exhibit a range of diversity in the structures as well as in biological activities so this
series of molecules is good for generating the significant quantitative relationship. The
developed atom-based 3D-QSAR model highlight the structural features of pyridine analogs for
binding to TAK-1 which is useful for further design of more potent TAK-1 inhibitory agent
having anticancer activity.
2. Materials and Methods
2.1. Dataset for analysis
The present 3D-QSAR study was performed on substituted 7-aminofuro [2,3-c]pyridine
derivatives synthesized by Hornberger K. R. et al. 12
for the development of ligand based CPHs
(common pharmacophore hypothesis). Out of 57 compounds, 54 compounds with well defined
TAK-1 inhibitory activity (given as IC50 values in μM concentration) were used for the present
investigation. The compounds 12n, 12p and 12au were omitted from the QSAR set due to their
improper activity. The biological activities, IC50, were transformed into pIC50= [-Log IC50]
(Table 1) and used as dependent variable for 3D-QSAR model generation. The dataset consists
of both active and inactive molecules, and the dataset was divided into training and test set using
the „„Automated Random Selection‟‟ option present in the PHASE software. The total set of
inhibitors was divided randomly into a training set (35 compounds) for generation of 3D QSAR
models and a test set (19 compounds) for validation of the developed model. The partitioning
was so selected that there should be both active and inactive ligands in each test as well as
training set. The dataset was then used for generating common pharmacophore hypotheses and
subsequently for developing 3D-QSAR models (Tables 1).
2.2. Computational details
The 3D-QSAR pharmacophore model developing study was performed using the PHASE 3.4
module of Schrodinger molecular modeling software.13
PHASE is a versatile product to identify
common pharmacophore hypothesis, which is accompanied by a set of aligned conformations
that suggests the relative manner in which the molecules are likely to bind to the receptor. A
given hypothesis gives 3D-QSAR model to predict activity. The pharmacophore model was

4
developed using a set of pharmacophore features to generate sites for all the compounds. Each
structure is represented by various chemical features that may make easy non-covalent binding
among the ligand and its binding pocket.14,15
LigPrep provides a structure cleaning step,16
which is incorporated into PHASE.17
, PHASE
provides two built-in approaches for the purposes of pharmacophore model development, both of
which employ the MacroModel conformational search engine. Conformational analysis were
performed using Monte- Carlo Multiple Minimum method implemented in the Schrodinger
software.13
The ligands were assigned as active (above 6.2) and inactive (below 5.7) by giving an
appropriate activity threshold value. The activity threshold value was selected on the basis of
dataset activity distribution (4.590–8.398) and the active ligands were chosen to derive a set of
suitable pharmacophores. Common pharmacophore and QSAR model building were generated
by prepared ligands.
2.3. Scoring pharmacophores with respect to active and inactive ligands
The resulting pharmacophores were then scored and ranked. The overall ranking of all the
hypotheses based on scored hypothesis. The scoring algorithm included the contributions from
the alignment of site points and vectors, volume overlap, selectivity, number of ligands matched,
relative conformational energy, and activity.
2.4. Perceiving common pharmacophores
Common pharmacophores are examined by a scoring protocol to identify the pharmacophore
from each surviving n-dimensional box that yields the best alignment of the active set ligands.
The scoring protocol provides a ranking of different hypotheses to choose most appropriate for
further investigation. Also the inactive molecules were scored in order to observe the alignment
of these molecules with respect to the different pharmacophore hypotheses and to select the best
ones. The larger is the difference between the score of active and inactives, the better is the
hypothesis at discriminating the active from inactive molecules.

5
2.5. Building 3D-QSAR models
3D-QSAR models represented by binary-valued occupation patterns that can be used as
independent variables to create partial least-squares (PLS) factors. Statistics on the correlation of
predicted with actual activity data were collated for the hypothesis.
PHASE QSAR models may be either atom-based or pharmacophore- based, the difference being
whether all atoms are taken into account, or merely the pharmacophore sites that can be matched
to the hypothesis. Pharmacophore- based QSAR models were generated for hypothesis using a
grid spacing of 1.0 Å and the 35-member training set. QSAR models were validated by
predicting the activity of test set ligands containing one to four PLS factors.
3. Results and Discussions
3.1. Generation of 3D-QSAR models
Different variant CPHs were generated by common pharmacophore identification process. All
CPHs were examined and scored to identify the pharmacophore that yields the best alignment of
the active compounds (pIC50> 6.2). All CPHs were validated by aligning and scoring the inactive
compounds (pIC50< 5.7). We have selected top two CPHs models whose survival-inactive scores
ranked in the top 1 % for alignment of all compounds and 3D-QSAR studies. The survival score
for these CPHs is shown in Table 2. All top two CPHs were found to be associated with the five-
point hypotheses, which consists of one hydrogen bond acceptor (A), one hydrogen bond donor
(D), one hydrophobic (H), and two aromatic rings (R) vector features. All compounds were
aligned using CPH ADHRR.84 for 3D-QSAR study (Fig. 1) alignment of active compounds by
using CPH ADHRR.651 was shown in Fig. 2.
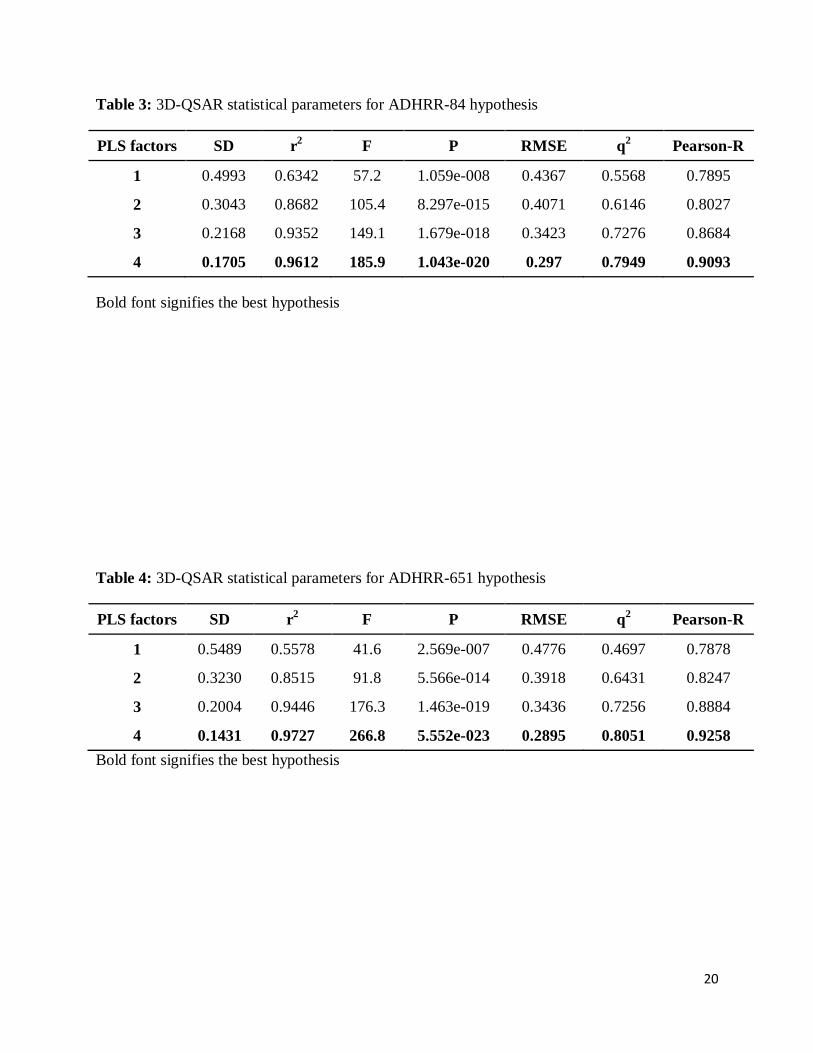
All top CPHs were used for atom-based 3D-QSAR model generation. The CPH ADHRR.84
yielded a 3D-QSAR model with good value of regression coefficient, low standard deviation,
and high variance ratio with good stability, but showed diminished predictive power along with
high RMSE value and low Pearson R value which stand for correlation between predicted and
observed activity for test set. The CPHs ADHRR.84 and ADHRR.651 yielded 3D-QSAR models
with good PLS statistical values. Both these hypotheses showed good internal as well as external
predictive power (Table 3 & 4). The training set correlation in both CPHs is characterized by
PLS factors (R2 = 0.9612, SD = 0.1705, F = 185.9, P = 1.043e-020, Q
2 = 0.7949 for CPH

6
ADHRR.84 and R2 = 0.9727, SD = 0.1431, F = 266.8, P = 5.552e-023, Q
2 = 0.8051 for CPH
ADHRR.651).
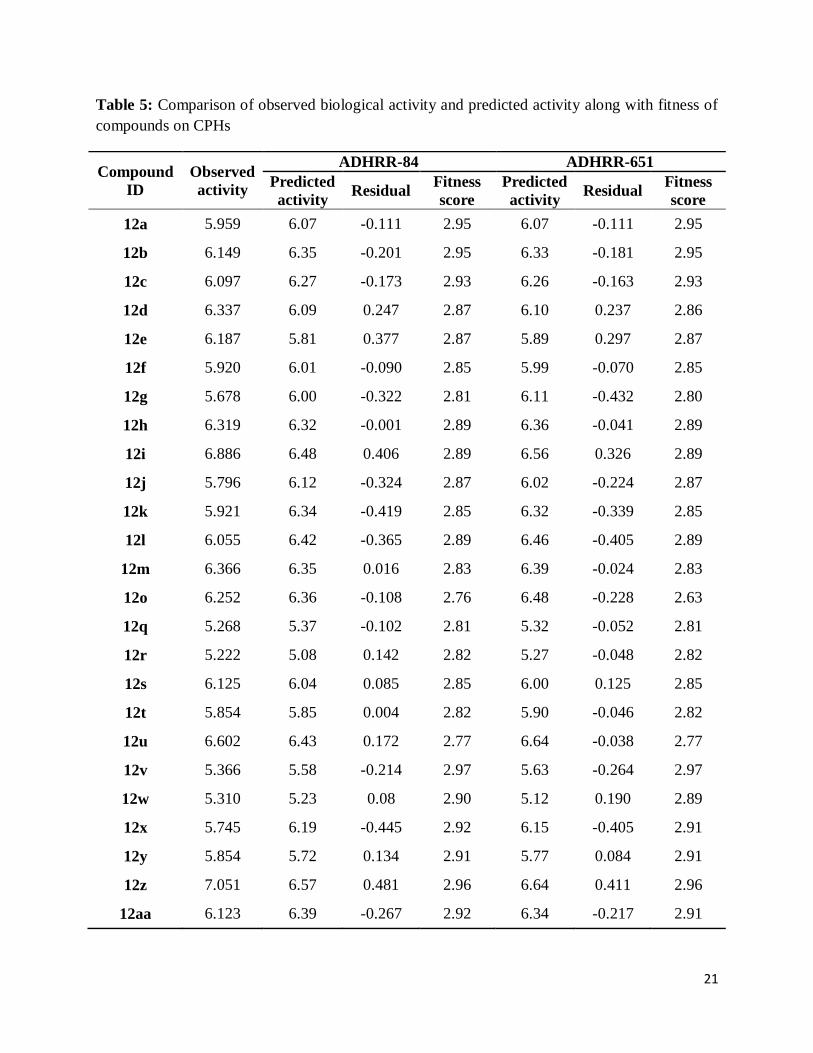
We have selected the 3D-QSAR models generated by CPHs ADHRR.84 and ADHRR.651 for
correlating the structure with activity. Graph of observed versus predicted biological activity of
training and test sets are shown in Figs. 3 and 4, respectively. Residuals values obtained by
subtraction of predicted activities from observed biological activities are near to zero which
indicated that error in prediction of biological activity is low and predicting ability of QSAR
models developed by CPHs ADHRR.84 and ADHRR.651 is good (Table 5). Mean of residual in
predicting the activity of compounds was calculated by average of summation of all residual
values. 3D-QSAR models associated with hypotheses ADHRR.84 and ADHRR.651 showed
0.1828 and 0.1554, respectively, as the mean of residual which also support the predictability of
both QSAR models. The pharmacophore hypothesis showing distance between pharmacophoric
sites is depicted in Fig. 5.
Based on overall statistical results, 3D-QSAR model developed using CPHs ADHRR.84 and
ADHRR.651 was applied to each compound in the series for the establishment of structure–
activity correlation. A pictorial representation of the cubes generated in the present 3D-QSAR
along with most active and inactive compounds is shown in Figs. 6 and 7. In these generated
cubes, the blue cubes indicate favorable features, while red cubes indicate unfavorable features
for biological activity. The blue cubes around the hydrogen bond acceptor and hydrogen bond
donor group of thiophene ring suggest the importance of core ring for activity.
3.2. SAR analysis by visualization of regression coefficients
Phase allows us to visualize effects due to each pharmacophoric feature and the positive and
negative regression coefficients associated with the effect, like H-bond donor effects,
hydrophobic effects, negative ionic effects, positive ionic effects and electron-withdrawing
effects. 3D-QSAR model visualization in Phase depends on the module used. In the grid-based
3D-QSAR method used here, visualization of the model is referred to as “regression coefficient
visualization” or “effects” from atom or pharmacophore types. In field-based QSAR methods,
the results are represented by field “contours”. In this study we looked at effects of each
pharmacophoric feature – H-bond donor, hydrophobic, negative ion and positive ion – with their
positive and negative regression coefficients around the pharmacophore hypothesis to visualize

7
the favorable and unfavorable regions. In all analyses, positive coefficients and negative
coefficients are shown as blue-colored and red-colored cubes, respectively.
3.2.1. Analysis of hydrogen bond donor effects
Ligand-receptor interactions inferred by the 3D-QSAR analysis can be visualized as color-coded
cubes in the space around the ligand, for each of the properties considered. For the convenience
and ease of viewing, the hydrogen-bond donor effects are visualized at a positive regression
coefficient threshold of 0.008 and a negative regression coefficient threshold of −0.008. The
presence of hydroxyl group on 3rd
position (blue-colored region) in the active compound 12ad
acts as a hydrogen bond donor and that might be a reason for high activity of the compound,
whereas absence of hydrogen bond donor group at same position leads to decrease in activity of
inactive compounds 12ag and 12ao.
3.2.2. Analysis of hydrophobic effects
Hydrophobic effects are visualized at a positive and a negative regression coefficient threshold
of 0.040 and −0.040, respectively. Blue colored cubes at thiophene ring in compound 12az
indicate the importance of hydrophobic groups at that position and the absence of hydrophobic
groups at this position might lead to a decrease in activity. Addition of various hydrophobic
groups at 3rd
and 4th position (red-color) of substituted benzene ring results in decrease in activity
of compounds can be observed by considering 12a (5.9), 12ae (5.7), 12ai (5.5) and 12as (5.4).
Active compound that gives rise to strong and positive hydrophobic effects are shown in Fig. 6a
and 7a.
4. Conclusion
Computational methods have become increasingly important in a number of areas such as
comparative or homology modelling, functional site location, characterization of ligand-binding
sites in proteins, docking of small molecules into protein binding sites, protein-protein docking,
and molecular dynamics simulations. The results obtained yield information that sometimes is
beyond current experimental possibilities and can be used to guide and improve a vast array of
experiments. On the basis of our improved level of understanding of molecular recognition and
the widespread availability of target structures, it is reasonable to assume that computational

8
methods will continue aiding not only in the design and interpretation of hypothesis-driven
experiments in the field of cancer research but also in the rapid generation of new hypotheses.
The two 3D-QSAR models were developed using variant CPHs which consist of one acceptor,
one donor, one hydrophobic, and two rings vector feature. This 3D-QSAR model gives a
hypothetical image for designing of new potential compounds. The overall study provides
detailed structure and important binding information of pyrimidine derivatives as TAK1
inhibitors for anticancer activity.
Acknowledgments
The authors wish to acknowledge the Department of Science and Technology, India for financial
support to carry out this work.

9
References
1. Walczak H, Miller RE, Ariail K. Tumoricidal activity of tumor necrosis factor-related
apoptosis-inducing ligand. Nat Med 1999;5:157–163.
2. Cretney E, Shanker A, Yagita H, Smyth MJ, Sayers TJ. TNF-related apoptosis-
inducing ligand as a therapeutic agent in autoimmunity and cancer. Immunol Cell Biol
2006;84:87–98.
3. Sakurai H, Shigemori N, Hasegawa K, Sugita T. TGF-β-activated kinase 1 stimulates
NF-κB activation by an NF-κB-inducing kinase independent mechanism. Biochem
Biophys Res Commun 1998;243:545–549.
4. Sakurai H, Miyoshi H, Toriumi W, Sugita T. Functional interactions of transforming
growth factor β-activated kinase 1 with IκB kinases to stimulated NF-κB activation. J
Biol Chem 1999;274:10641–10648.
5. Wiley SR, Schooley K, Smolak PJ. Identification and characterization of a new
member of the TNF family that induces apoptosis. Immunity 1995;3:673–682.
6. Chaoo MK, Sakurai H, Koizumi K, Saiki I. TAK1-mediated stress signaling pathways
are essential for TNF-α-promoted pulmonary metastasis of murine colon cancer cells.
Int J Cancer 2006;118:2758–2764.
7. Sato S, Sanjo H, Takeda K. Essential function for the kinase TAK1 in innate and
adaptive immune responses. Nat Immunol 2005;6:1087–1095.
8. Lokwani DK, Sarkate AP, Shinde DB. 3D-QSAR and docking studies of benzoyl urea
derivatives as tubulin-binding agents for antiproliferative activity. Med Chem Res
2013;22:1415–1425.
9. Kristam R, Parmar V, Viswanadhan VN. 3D-QSAR analysis of TRPV1 inhibitors
reveals a pharmacophore applicable to diverse scaffolds and clinical candidates. J Mol
Graph Model 2013;45:157–172.
10. Tanwar O, Marella A, Shrivastava S, Alam MM, Akhtar M. Pharmacophore model
generation and 3D-QSAR analysis of N-acyl and N-aroylpyrazolines for enzymatic and
cellular B-Raf kinase inhibition. Med Chem Res 2013;22:2174–2187.
11. Lokwani D, Shah R, Mokale S, Shastry P, Shinde D. Development of energetic
pharmacophore for the designing of 1,2,3,4-tetrahydropyrimidine derivatives as
selective cyclooxygenase-2 inhibitors. J Comput Aided Mol Des 2012;26:267–277.

10
12. Hornberger KR, Berger DM, Crew AP, Dong H, Kleinberg A, Li A, Medeiros MR,
Mulvihill MJ, Siu K, Tarrant J, Wang J, Weng F, Wilde VL, Albertella M, Bittner M,
Cooke A, Gray MJ, Maresca P, May E, Meyn P, Peick W, Romashko D, Tanowitz M,
Tokar B. Discovery and optimization of 7-aminofuro[2,3-c]pyridine inhibitors of
TAK1. Bioorg Med Chem Lett 2013;23:4517–4522.
13. Dixon SL, Smondyrev AM, Knoll EH, Rao SN, Shaw DE, Friesner RA. PHASE: a new
engine for pharmacophore perception, 3D QSAR model development, and 3D database
screening:1. Methodology and preliminary result. J Comput Aided Mol Des
2006;20:647–671.
14. Dixon SL, Smondyrev AM, Rao S. PHASE: A Novel Approach to Pharmacophore
Modeling and 3D Database Searching. Chem Biol Drug Des 2006;67:370–372.
15. Dube PN, Mokale S, Datar P. CoMFA and Docking Study of 2,N6-disubstituted 1,2-
dihydro-1,3,5-triazine-4,6-diamines as Novel PfDHFR Enzyme Inhibitors for
antimalarial activity. Bulletin Facult Pharmacy Cairo Univ 2014;52:125-134.
16. LigPrep, Version 2.5, Schrodinger, 2009, LLC, New York.
17. PHASE-3.4, Schrodinger, 2009, LLC New York.

11
Figure citation
Figure 1: Alignment of all compounds using the 5-point pharmacophore hypothesis CPH
ADHRR.84

12
Figure 2: Alignment of active compounds using the 5-point pharmacophore hypothesis CPH
ADHRR.651
a) b)
Figure 3: Plot of experimental versus predicted pIC50 values of compounds for the 3D-QSAR
model CPH ADHRR.84 a) Training set & b) Test set

13
a) b)
Figure 4: Plot of experimental versus predicted pIC50 values of compounds for the 3D-QSAR
model CPH ADHRR.651 a) Training set & b) Test set
Figure 5: The 5-point pharmacophore hypothesis that gave the best 3D-QSAR model; Green
represents hydrophobic feature, cyan represents hydrogen-bond donor and brown-colored ring
represents a ring aromatic; All the inter-feature distances are in Angstrom (Å).

14
a)
b)
Figure 6: Pictorial representation of the cubes generated using the QSAR model developed
using CPH ADDHR.84 for a) most active compound 12az and b) least active compound 12ao.

15
Blue cubes indicate favorable regions, while red cubes indicate unfavorable region for the
activity.
a)
b)
Figure 7: Pictorial representation of the cubes generated using the QSAR model developed
using CPH ADDHR.84 for a) most active compound 12az and b) least active compound 12ao.

16
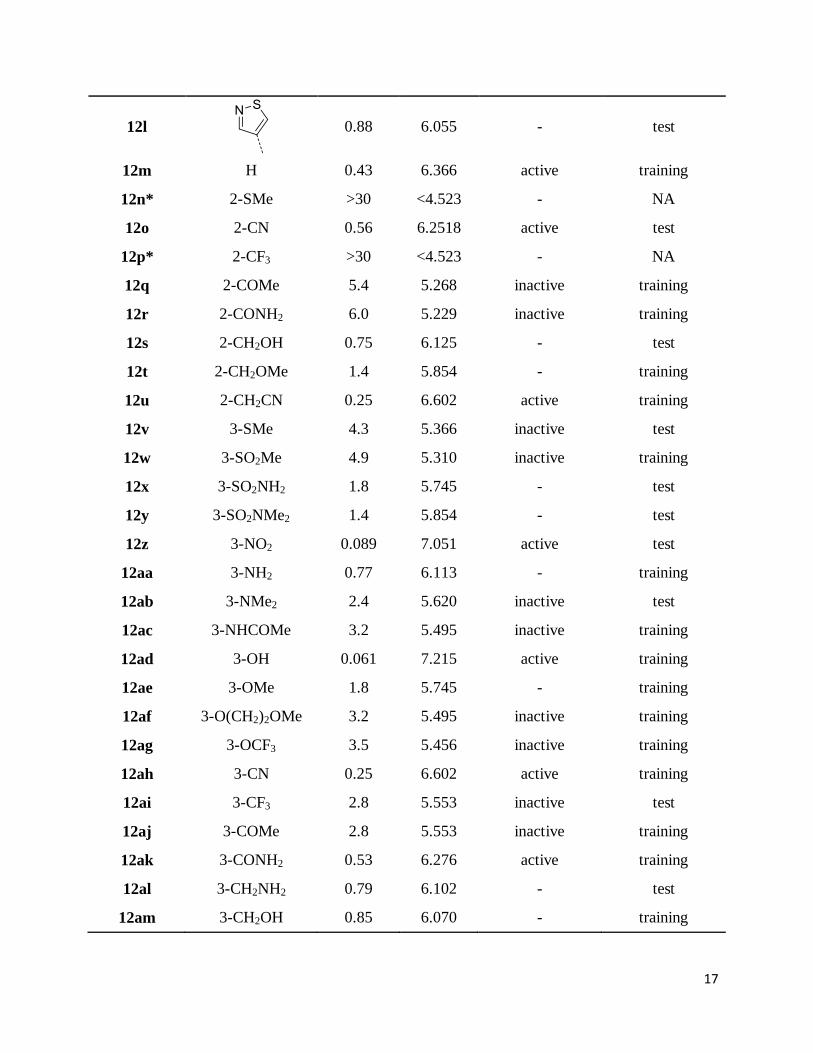
Table 1: Structure of compounds used for development of common pharmacophore hypothesis
and 3D-QSAR studies along with biological activity
Compound
ID R IC50 (µM) pIC50 Pharm Set QSAR Set
12a
1.1 5.959 - test
12b
0.71 6.149 - test
12c
0.80 6.097 - training
12d
0.46 6.337 active training
12e
0.65 6.187 - test
12f
1.2 5.920 - training
12g
2.1 5.678 inactive test
12h
0.48 6.319 active training
12i
0.13 6.886 active training
12j
1.6 5.796 - training
12k
1.2 5.921 - test
17
12l
0.88 6.055 - test
12m H 0.43 6.366 active training
12n* 2-SMe >30 <4.523 - NA
12o 2-CN 0.56 6.2518 active test
12p* 2-CF3 >30 <4.523 - NA
12q 2-COMe 5.4 5.268 inactive training
12r 2-CONH2 6.0 5.229 inactive training
12s 2-CH2OH 0.75 6.125 - test
12t 2-CH2OMe 1.4 5.854 - training
12u 2-CH2CN 0.25 6.602 active training
12v 3-SMe 4.3 5.366 inactive test
12w 3-SO2Me 4.9 5.310 inactive training
12x 3-SO2NH2 1.8 5.745 - test
12y 3-SO2NMe2 1.4 5.854 - test
12z 3-NO2 0.089 7.051 active test
12aa 3-NH2 0.77 6.113 - training
12ab 3-NMe2 2.4 5.620 inactive test
12ac 3-NHCOMe 3.2 5.495 inactive training
12ad 3-OH 0.061 7.215 active training
12ae 3-OMe 1.8 5.745 - training
12af 3-O(CH2)2OMe 3.2 5.495 inactive training
12ag 3-OCF3 3.5 5.456 inactive training
12ah 3-CN 0.25 6.602 active training
12ai 3-CF3 2.8 5.553 inactive test
12aj 3-COMe 2.8 5.553 inactive training
12ak 3-CONH2 0.53 6.276 active training
12al 3-CH2NH2 0.79 6.102 - test
12am 3-CH2OH 0.85 6.070 - training

18
12an 4-SMe 17.5 4.757 inactive training
12ao 4-SO2Me 25.7 4.590 inactive training
12ap 4-NH2 1.8 5.745 - test
12aq 4-NHSO2Me 4.9 5.310 inactive training
12ar 4-OH 0.27 6.569 active training
12as 4-OCF3 3.5 5.456 inactive test
12at 4-CN 2.5 5.602 inactive training
12au* 4-CONMe2 >30 <4.523 - NA
12av 4-CH2OH 2.8 5.553 inactive training
12aw 4-CH2CN 1.5 5.824 - training
12ax
0.023 7.638 active training
12ay
0.013 7.886 active test
12az
0.004 8.398 active training
12ba
0.030 7.523 active test
12bb
0.018 7.745 active training
12bc
1.0 6.000 - training
12bd
0.34 6.468 active training
12be
1.4 5.854 - training
*omitted from QSAR analysis

19
Table 2: Score of different parameters of the hypothesis ADHRR-84 and ADHRR-651
Sr. No. Parameter Score
ADHRR-84 ADHRR-651
1. Survival 3.880 3.864
2. Survival-inactive 1.041 1.056
3. Post hoc 5.860 5.844
4. Site 0.97 0.95
5. Vector 1.000 0.999
6. Volume 0.908 0.911
7. Selectivity 1.869 1.971
8. Matches 17 17
9. Energy 0.00 17
10. Activity 6.602 6.602
11. Inactive 2.838 2.808
20
Table 3: 3D-QSAR statistical parameters for ADHRR-84 hypothesis
PLS factors SD r2 F P RMSE q
2 Pearson-R
1 0.4993 0.6342 57.2 1.059e-008 0.4367 0.5568 0.7895
2 0.3043 0.8682 105.4 8.297e-015 0.4071 0.6146 0.8027
3 0.2168 0.9352 149.1 1.679e-018 0.3423 0.7276 0.8684
4 0.1705 0.9612 185.9 1.043e-020 0.297 0.7949 0.9093
Bold font signifies the best hypothesis
Table 4: 3D-QSAR statistical parameters for ADHRR-651 hypothesis
PLS factors SD r2 F P RMSE q
2 Pearson-R
1 0.5489 0.5578 41.6 2.569e-007 0.4776 0.4697 0.7878
2 0.3230 0.8515 91.8 5.566e-014 0.3918 0.6431 0.8247
3 0.2004 0.9446 176.3 1.463e-019 0.3436 0.7256 0.8884
4 0.1431 0.9727 266.8 5.552e-023 0.2895 0.8051 0.9258
Bold font signifies the best hypothesis
21
Table 5: Comparison of observed biological activity and predicted activity along with fitness of
compounds on CPHs
Compound
ID
Observed
activity
ADHRR-84 ADHRR-651
Predicted
activity Residual
Fitness
score
Predicted
activity Residual
Fitness
score
12a 5.959 6.07 -0.111 2.95 6.07 -0.111 2.95
12b 6.149 6.35 -0.201 2.95 6.33 -0.181 2.95
12c 6.097 6.27 -0.173 2.93 6.26 -0.163 2.93
12d 6.337 6.09 0.247 2.87 6.10 0.237 2.86
12e 6.187 5.81 0.377 2.87 5.89 0.297 2.87
12f 5.920 6.01 -0.090 2.85 5.99 -0.070 2.85
12g 5.678 6.00 -0.322 2.81 6.11 -0.432 2.80
12h 6.319 6.32 -0.001 2.89 6.36 -0.041 2.89
12i 6.886 6.48 0.406 2.89 6.56 0.326 2.89
12j 5.796 6.12 -0.324 2.87 6.02 -0.224 2.87
12k 5.921 6.34 -0.419 2.85 6.32 -0.339 2.85
12l 6.055 6.42 -0.365 2.89 6.46 -0.405 2.89
12m 6.366 6.35 0.016 2.83 6.39 -0.024 2.83
12o 6.252 6.36 -0.108 2.76 6.48 -0.228 2.63
12q 5.268 5.37 -0.102 2.81 5.32 -0.052 2.81
12r 5.222 5.08 0.142 2.82 5.27 -0.048 2.82
12s 6.125 6.04 0.085 2.85 6.00 0.125 2.85
12t 5.854 5.85 0.004 2.82 5.90 -0.046 2.82
12u 6.602 6.43 0.172 2.77 6.64 -0.038 2.77
12v 5.366 5.58 -0.214 2.97 5.63 -0.264 2.97
12w 5.310 5.23 0.08 2.90 5.12 0.190 2.89
12x 5.745 6.19 -0.445 2.92 6.15 -0.405 2.91
12y 5.854 5.72 0.134 2.91 5.77 0.084 2.91
12z 7.051 6.57 0.481 2.96 6.64 0.411 2.96
12aa 6.123 6.39 -0.267 2.92 6.34 -0.217 2.91