3 W 0 &/ .#)( W) W ' ,. W #-.,# /.#)( W ,# - W
150
Transcript of 3 W 0 &/ .#)( W) W ' ,. W #-.,# /.#)( W ,# - W


Aalto University publication series DOCTORAL DISSERTATIONS 69/2011
Reliability Evaluation of Smart Distribution Grids
Shahram Kazemi
Doctoral dissertation for the degree of Doctor of Science in Technology to be presented with due permission of the School of Electrical Engineering for public examination and debate in Auditorium S2 at the Aalto University School of Electrical Engineering (Espoo, Finland) on the 13th of October 2011 at 14 o’clock.
Aalto University School of Electrical Engineering Department of Electrical Engineering Power Systems

Supervisors Professor Matti Lehtonen (Supervisor at Aalto University) Professor Mahmud Fotuhi-Firuzabad (Supervisor at Sharif University of Technology) Preliminary examiners Associate Professor Petr Toman, Brno University of Technology, Czech Republic Dr. Pirjo Heine, Helen Electricity Network Ltd., Finland Opponents Professor Lina Bertling, Chalmers University of Technology, Sweden (Opponent nominated by Aalto University) Professor Mehdi Vakilian, Sharif University of Technology, Iran (Examiner nominated by Sharif University of Technology)
Aalto University publication series DOCTORAL DISSERTATIONS 69/2011 © Shahram Kazemi ISBN 978-952-60-4241-1 (pdf) ISBN 978-952-60-4240-4 (printed) ISSN-L 1799-4934 ISSN 1799-4942 (pdf) ISSN 1799-4934 (printed) Aalto Print Helsinki 2011 Finland The dissertation can be read at http://lib.tkk.fi/Diss/

Abstract Aalto University, P.O. Box 11000, FI-00076 Aalto www.aalto.fi
Author Shahram Kazemi Name of the doctoral dissertation Reliability Evaluation of Smart Distribution Grids Publisher School of Electrical Engineering Unit Department of Electrical Engineering Series Aalto University publication series DOCTORAL DISSERTATIONS 69/2011 Field of research Power Systems Manuscript submitted 13 April 2011 Manuscript revised 11 August 2011 Date of the defence 13 October 2011 Language English
Monograph Article dissertation (summary + original articles)
Abstract The term “Smart Grid” generally refers to a power grid equipped with the advanced technologies dedicated for purposes such as reliability improvement, ease of control and management, integrating of distributed energy resources and electricity market operations. Improving the reliability of electric power delivered to the end users is one of the main targets of employing smart grid technologies. The smart grid investments targeted for reliability improvement can be directed toward the generation, transmission or distribution system level. However, radial operating status, aging infrastructures, poor design and operation practices and high exposure to environmental conditions have caused the electric power distribution systems to be addressed as the main contributor to the customer reliability problems. Therefore, developing a smart distribution grid can be an attractive reliability enhancement solution for the electric utilities.
Whenever the targeted reliability enhancement solutions are limited to the simple conventional solutions, the available reliability assessment techniques can be easily used for purposes of the value-based reliability planning. However, the electric utilities face a challenge when the reliability enhancement solutions include sophisticated measures such as those of the smart grid technologies. Generally, the available reliability assessment approaches cannot be employed directly for such purposes. In this situation, it is necessary to develop a reliability evaluation approach for predicting the reliability performance of the electric power distribution systems when employing such sophisticated solutions.
A novel approach is proposed and demonstrated in this thesis for reliability assessment of an electric power distribution system when employing the advanced reliability enhancement technologies. In the proposed reliability evaluation approach, the overall impacts of the targeted reliability enhancement solutions on the sustained interruptions, momentary interruptions and voltage sags experienced by the customers are taken into account.
The results of various reliability case studies directed in this thesis show that employing a suitable set of the smart grid technologies in the functional zone of an electric power distribution system can virtually mitigate all the reliability indices. It is also possible to reduce the range of variation of the reliability indices among different customers. In addition, there is a possibility to reduce the burden on the utility repair crews.
Keywords Distribution Automation, Distribution Substation Automation, Distance to Fault Estimator, Dynamic Voltage Restorer, Feeder Automation, Fault Current Limiter, Fault Locator Scheme, Fault Passage Indicator, Electric Power Distribution System, Fault Management, Reliability Evaluation, Smart Grid, Sub-Transmission Substation Automation, Voltage Sag
ISBN (printed) 978-952-60-4240-4 ISBN (pdf) 978-952-60-4241-1 ISSN-L 1799-4934 ISSN (printed) 1799-4934 ISSN (pdf) 1799-4942 Location of publisher Espoo Location of printing Helsinki Year 2011 Pages 147 The dissertation can be read at http://lib.tkk.fi/Diss/


V
AUTHOR’S DECLARATION
I hereby declare that I am the sole author of this thesis. The author has had the main
responsibility for all contents of the thesis, for doing all analyses and simulations, and also for
developing and writing the corresponding published papers. This work has been carried out at
Sharif University of Technology (Tehran, Iran) and Aalto University (Espoo, Finland) based on the
cooperation agreement between these two universities for international co-supervision of my
doctoral thesis. Professor Mahmud Fotuhi-Firuzabad at Sharif University of Technology and
Professor Matti Lehtonen at Aalto University supervised this work.

VI
ACKNOWLEDGMENTS
This doctoral research project has been carried out based on the cooperation agreement between
Sharif University of Technology (Tehran, Iran) and Aalto University (Espoo, Finland) for
international co-supervision of my doctoral thesis. I would like to thank all the officials of both
universities who gave me such an exceptional opportunity.
This work has been accomplished under supervision of Professor Mahmoud Fotuhi-Firuzabad
from Sharif University of Technology and Professor Matti Lehtonen from Aalto University. I thank
both of them for their support during this work.
My doctoral research project has been technically and financially supported by several
organizations. I especially would like to thank Ministry of Science, Research and Technology in
Iran and Fortum Foundation in Finland for their financial supports during this work. I also
appreciate the technical supports of all the companies that assisted me by providing the data
required to direct the analyses and simulations targeted in this doctoral research project.
My colleagues at Sharif University of Technology and Aalto University have offered me a
pleasant and encouraging working environment. I would like to thank all of them for their supports.
I especially appreciate Dr. Robert John Millar for his great cooperation on providing some of the
technical data required for directing the case studies concerned in this thesis.
Finally, and most importantly, I would like to thank my loving family for the support and
encouragement I received while doing my thesis.
In Espoo, Finland August 2011 Shahram Kazemi

VII
CONTENTS
AUTHOR’S DECLARATION ....................................................................................................................... V
ACKNOWLEDGMENTS ............................................................................................................................. VI
CONTENTS .................................................................................................................................................. VII
LIST OF SYMBOLS AND ABBREVIATIONS ......................................................................................... IX
1 INTRODUCTION ...................................................................................................................................... 1
1.1 RESEARCH PROBLEM ................................................................................................................... 1 1.2 THESIS ORGANIZATION ............................................................................................................... 3
2 APPLICATION OF SMART GRID TECHNOLOGIES FOR DISTRIBUTION SYSTEM RELIABILITY IMPROVEMENT ................................................................................................................. 4
3 SMART GRID TECHNOLOGIES ........................................................................................................... 7
3.1 DISTANCE TO FAULT ESTIMATOR............................................................................................. 9 3.2 FAULT PASSAGE INDICATOR ...................................................................................................... 9 3.3 FAULT LOCATOR SCHEMES ...................................................................................................... 10 3.4 SUBSTATION AUTOMATION ..................................................................................................... 11 3.5 FEEDER AUTOMATION ............................................................................................................... 12 3.6 DISTRIBUTION AUTOMATION .................................................................................................. 13 3.7 FAULT CURRENT LIMITER......................................................................................................... 13 3.8 DYNAMIC VOLTAGE RESTORER .............................................................................................. 14
4 RELATED WORKS AND THESIS CONTRIBUTION ....................................................................... 15
5 PROPOSED RELIABILITY EVALUATION APPROACH ................................................................ 18
6 STUDY RESULTS .................................................................................................................................... 39
6.1 TEST SYSTEMS DATA AND ANALYSIS ASSUMPTIONS ....................................................... 39 6.2 COMPARATIVE CASE STUDIES ................................................................................................. 45
6.2.1 Case Study 1: Base Case .......................................................................................................... 45 6.2.2 Case Study 2: Integrating Distance to Fault Estimators ........................................................... 54 6.2.3 Case Study 3: Integrating Fault Passage Indicators .................................................................. 60 6.2.4 Case Study 4: Integrating Fault Locator Scheme ..................................................................... 66 6.2.5 Case Study 5: Integrating Sub-Transmission Substation Automation ...................................... 70 6.2.6 Case Study 6: Integrating Distribution Substation Automation ................................................ 75 6.2.7 Case Study 7: Integrating Feeder Automation .......................................................................... 79 6.2.8 Case Study 8: Integrating Distribution Automation System ..................................................... 85 6.2.9 Case Study 9: Integrating Fault Current Limiters ..................................................................... 91 6.2.10 Case Study 10: Integrating Dynamic Voltage Restorers .......................................................... 96
6.3 COMPARISON OF IMPLEMENTED SMART GRID TECHNOLOGIES .................................. 100 6.4 IMPACTS OF OPERATIONAL FAILURE OF SMART GRID TECHNOLOGIES ................... 105
6.4.1 Case Study 11: Impacts of Operational Failure of Distance to Fault Estimators .................... 106 6.4.2 Case Study 12: Impacts of Operational Failure of Fault Current Limiters ............................. 107
7 CONCLUSIONS ..................................................................................................................................... 109

VIII
8 REFERENCES ....................................................................................................................................... 111
Appendix I: Basic Data of Distribution Substations of the Distribution Test Network………….………....124
Appendix II: Basic Data of Underground Cables used in the Distribution Test Network…….……………128
Appendix III: Basic Data of Sections of the Distribution Test Network …………………….……….…....129
Appendix IV: Basic Data of Overhead Lines of the Sub-Transmission Test Network…………………..…133
Appendix V: Basic Data of Underground Cables of the Sub-Transmission Test Network…........................134

IX
LIST OF SYMBOLS AND ABBREVIATIONS
a Year
Contribution to annual expected cost arising from momentary interruptions affecting the load point Lj due to the contingency Ci
Contribution to annual expected cost arising from sustained interruptions affecting the load point Lj due to the contingency Ci
Contribution to annual expected cost arising from voltage sags affecting the load point Lj due to the contingency Ci
Annual expected cost arising from momentary interruptions affecting the load point Lj
Annual expected cost arising from sustained interruptions affecting the load point Lj
Annual expected cost arising from voltage sags affecting the load point Lj
Contribution to the annual expected duration of sustained interruptions affecting the load point Lj due to the contingency Ci
Annual expected duration of sustained interruptions affecting the load point Lj
Contribution to the annual expected frequency of momentary interruptions affecting the load point Lj due to the contingency Ci
Annual expected frequency of momentary interruptions affecting the load point Lj
Contribution to the annual expected frequency of sustained interruptions affecting the load point Lj due to the contingency Ci
Annual expected frequency of sustained interruptions affecting the load point Lj
Contribution to the annual expected frequency of voltage sags affecting the load point Lj due to the contingency Ci
Annual expected frequency of voltage sags affecting the load point Lj
Contribution to the annual expected frequency of voltage variation events imposed on the load point Lj due to the contingency Ci. The magnitude and duration of the voltage variation events lie in the ranges specified by parameters V and D.
Annual expected frequency of voltage variation events imposed on the load point Lj. The magnitude and duration of the voltage variation events lie in the ranges specified by parameters V and D.

X
Contribution to the annual expected energy not supplied of the load point Lj due to the contingency Ci
Annual expected energy not supplied of the load point Lj
Average load connected to the load point Lj
Annual occurrence rate of the contingency Ci
Average outage time of the load point Lj
ASAI Average System Availability Index
ASUI Average System Unavailability Index
AVSSI Average Voltage Sag Severity Index. It shows the average occurrence rate of the voltage sags that can cause problem for the customers.
AVVFI(V,D) Average Voltage Variation Frequency Index. It shows the average occurrence rate of the voltage variation events that their magnitude and duration lie in a range specified by the parameters V and D.
Ci Contingency number i
D A range of duration of voltage variation events, e.g. 0.01 ≤ D ≤ 0.1 seconds
Duration of the voltage variation event under examination (i.e. VVE)
€ Euro
ECOSTMI Total expected cost resulted from momentary interruptions
ECOSTSI Total expected cost resulted from sustained interruptions
ECOSTVS Total expected cost resulted from voltage sags
EENS Expected Energy Not Supplied
eve Event

XI
A fitness function which is equal to one if the characteristics of the voltage variation event under examination (i.e. VVE) fit to the thresholds defined for momentary interruptions. Otherwise, its value is equal to zero for the voltage variation event under examination.
A fitness function which is equal to one if the characteristics of the voltage variation event under examination (i.e. VVE) fit to the thresholds defined for sustained interruptions. Otherwise, its value is equal to zero for the voltage variation event under examination.
A fitness function which is equal to one if the characteristics of the voltage variation event under examination (i.e. VVE) fit to the thresholds defined for voltage sags. Otherwise, its value is equal to zero for the voltage variation event under examination.
A fitness function which is equal to one if the characteristics of the voltage variation event under examination (i.e. VVE) fit to the magnitude and duration range specified by parameters V and D. Otherwise, its value is equal to zero for the voltage variation event under examination. As an example, consider a range such as 0.2 ≤ V ≤ 0.3 per unit and 0.01 ≤ D ≤ 0.1 seconds. The value of this function for a voltage variation event with the remaining voltage 0.27 per unit and duration 0.09 seconds is equal to one. However, for a voltage variation event with the remaining voltage 0.27 per unit and duration 0.15 seconds, the value of this function is equal to zero.
h Hour
HV High Voltage
The value of this function shows the financial impacts of the voltage variation event (i.e. VVE) imposed on the load point Lj. For a voltage variation event which its characteristics fit to the thresholds of power interruptions, the duration of voltage variation event under examination is used to estimate the cost. However, in the case of a voltage variation event which its characteristics fit to the thresholds defined for the voltage sags, both magnitude and duration of the voltage variation event are normally required to estimate the cost.

XII
The value of this function shows the overall impacts on the customers connected to the load point Lj when the characteristics of the voltage variation event imposed on this load point (i.e. VVE) fit to the thresholds defined for voltage sags. Its value lies between zero and one. The value of this function is equal to zero when the characteristics of the imposed voltage variation event do not fit to the thresholds defined for voltage sags. Generally, the magnitude and duration of the voltage sag are compared with the voltage tolerance characteristics of sensitive equipments of the customers connected to the load point Lj to find its possible impacts. The impacts on the customers connected to the load point Lj of the voltage sag are sum up and divided by the total number of customers to estimate the value of this function.
int Interruption
km Kilometer
kV Kilovolt
kW Kilowatt
kWh Kilowatt hour
Lj Load point number j
LV Low Voltage
MAIFI Momentary Average Interruption Frequency Index
MV Medium Voltage
MVA Megavolt Ampere
MW Megawatt
Number of customers connected to the load point Lj
NCT Total number of primary contingencies
NLP Number of load points of the distribution system under study
Total number of operating states generated for the contingency Ci

XIII
Total number of voltage variation events imposed on the load point Lj due to the contingency Ci and the operating state k
occ Occurrence
Probability of residing in the operating state k of the contingency Ci
RMS Root Mean Square
s Second
SAIDI System Average Interruption Duration Index
SAIFI System Average Interruption Frequency Index
sub Substation
V A range of magnitude of the voltage variation events, e.g. 0.2 ≤ V ≤ 0.3 per unit
VVE Voltage Variation Event
Voltage variation event number m that imposed on the load point Lj due to the operating state k of the contingency Ci. Generally, the overall effects of the generated contingency are appeared to each load points as several voltage variation events. Each one of these voltage variation events can be corresponding to a power interruption, a voltage sag or just a slight deviation from the nominal voltage. The magnitude and duration of each voltage variation event are examined in order to identify the type of events.


Page 1
1 INTRODUCTION
1.1 Research Problem
Electric power distribution systems are responsible for delivering the electrical energy from the
bulk power systems to the end users. Issues such as radial operating status, aging infrastructures,
poor design and operation practices and high exposure to environmental conditions have caused the
electric power distribution systems to be addressed as the main contributor to the customer
reliability problems. Generally, about 80 to 90 percents of the customer reliability problems are
originated from the electric power distribution systems [1-3]. Such statistics always reinforce the
electric utilities to look after solutions that can be used for reliability enhancement of the electric
power distribution systems. There are a large numbers of solutions available to electric utilities for
distribution system reliability improvements. Electric utilities have traditionally improved the
distribution system reliability through simple measures such as tree trimming on a regular basis,
construction design modification, installation of lightning arresters, use of animal guards, replacing
overhead bare conductors by covered conductors or underground cables, protection scheme
modification, and so on [4-6]. In addition to these conventional solutions, there are some other
advanced reliability improvement measures that nowadays are categorized as smart grid
technologies. Major smart grid technologies applicable for distribution system reliability
improvements are fault passage indicators, fault locator schemes, substation automation, feeder
automation, distribution automation, fault current limiters and dynamic voltage restorers.
Availability of the various reliability enhancement solutions is both an opportunity and a
challenge for electric utilities. They have an opportunity to find the right solutions for their own
reliability problems. But, each electric utility is different from another one and has its own set of
failure causes for distribution system problems. In addition, the design history and the network
configuration have large impacts on the specific solutions to be selected [7]. Therefore, the
challenge for electric utilities, especially in the competitive electricity market, is to identify and
evaluate potential reliability reinforcement schemes and then determine and prioritize those
appropriate for implementation. This procedure is usually referred to as the value-based distribution
system reliability planning [8-10]. In order to perform the value-based distribution system reliability
planning, it is necessary to use a suitable reliability assessment tool. This tool should quantitatively
predict the various impacts that the targeted solutions may have on the reliability of electric power
delivered to the customers.

Page 2
Reliability assessment of the electric power distribution systems has received a great attention
over the past decades [11-18]. Nowadays, several commercial softwares are available to electric
utilities that can be used for reliability assessment of the electric power distribution systems. These
softwares usually work based on one or a combination of well-developed reliability assessment
techniques such as the analytical simulation approach and the Monte-Carlo simulation approach [3].
Whenever the targeted reliability enhancement solutions are limited to the simple conventional
solutions, the available reliability assessment techniques can be easily used for purposes of the
value-based reliability planning. The simple conventional solutions are reliability enhancement
measures that mainly affect the failure rates of the components of an electric power distribution
system. As an example, consider an electric utility which aims to assess the reliability impacts of a
tree trimming on a specific area of its distribution network. In this situation, the reliability impacts
of the tree trimming can be evaluated by available reliability assessment approaches. The effects of
the tree trimming is modeled by appropriate manipulations of the failure rates of the components
located in the targeted areas for the tree trimming. However, the electric utilities face a challenge
when the reliability enhancement solutions include sophisticated measures such as those of the
smart grid technologies. As an example, an electric utility may aim at comparing the impacts of
various available feeder automation schemes on the reliability performance of its distribution
system. The reliability impacts of the automation solutions normally depend on their operational
procedures. In addition, when an automation scheme encounters with an operational failure
condition, its reliability impacts deteriorate compared to the situation when it is fully available.
Therefore, it is necessary to model both the operational procedure of the targeted automation
solutions and their possible operational failures when conducting the related reliability assessment
studies. However, the available reliability assessment approaches cannot be employed directly for
such purposes. In a circumstance like this, it is necessary to develop a reliability evaluation
approach for predicting the reliability performance of the electric power distribution systems when
employing such sophisticated solutions.
This research aims to develop and demonstrate a comprehensive approach for reliability
assessment of the electric power distribution systems equipped with the advanced reliability
enhancement solutions. The majority of the advanced solutions for distribution system reliability
improvement are nowadays categorized as the smart grid technologies. Therefore, hereafter in this
thesis, the term “smart distribution grids” is used to refer to the electric power distribution systems
equipped with the smart grid technologies for purpose of improving the reliability of electric power
delivered to the customers.

Page 3
1.2 Thesis Organization
After this introductory chapter, Chapter 2 provides a brief description on how the smart grid
technologies can affect the reliability performance of an electric power distribution system. Chapter
3 introduces the major smart grid technologies that can be used for reliability improvement of the
electric power distribution systems. Chapter 4 deals with the previous works related to the
reliability assessment of distribution systems equipped with advanced technologies and the
contribution of this thesis. The proposed reliability evaluation approach is described in Chapter 5.
The application of the proposed reliability evaluation approach is presented in Chapter 6. Finally,
Chapter 7 provides the concluding remarks.

Page 4
2 APPLICATION OF SMART GRID TECHNOLOGIES FOR DISTRIBUTION SYSTEM RELIABILITY IMPROVEMENT
Sustained interruptions, momentary interruptions and voltage sags are three major attributes of
the reliability of electric power delivered to the customers. A sustained interruption is referred to the
situation where the electric service is interrupted for a long period of time, normally for a time
greater than 1 minute [19]. A momentary interruption is a brief disruption in the electric service,
usually lasting no longer than a few minutes. The maximum duration of a momentary interruption
varies from utility to utility, but is typically between one and five minutes [3]. In the past, the
momentary interruptions were not as noticeable to customers as they are today. In addition, today
customers use sensitive equipments that can even be sensitive to the slightest variations in the
power supply. Voltage sag is a significant power quality issue that can affect the majority of
sensitive equipments like personal computers, adjustable speed drives, programmable logic
controllers, semiconductor devices and contactors. A voltage sag is defined as the decrease in the
RMS voltage between 10 to 90 percents of the nominal voltage for durations from 0.5 cycles to 1
minute [19]. Voltage sags that can cause problem for sensitive equipments are usually originated
from faults within transmission and distribution systems [20]. Motor starting and transformer
energizing can also cause voltage sags but their characteristics are usually not severe enough to
cause equipment malfunction. The occurrence of voltage sags is far more than the number of
interruptions. Hence, for specific customers, the financial losses caused by the voltage sags may
even be greater than the cost associated with the power interruptions.
In the context of reliability, generation, transmission, and distribution systems are referred to as
functional zones. Each functional zone is made up of several subsystems. Generation system
consists of generation plants and generation substations. Transmission system consists of
transmission lines, transmission switching stations, transmission substations, and sub-transmission
systems. Distribution systems consist of HV/MV substations, primary (MV) distribution systems,
MV/LV substations, and secondary (LV) distribution systems [3].
A core mission of an electric power distribution system is to deliver electrical energy from the
supplying points to the end users. Reliability of the electric service provided to the end users can be
altered by the faults originated either inside or outside of the functional zone of an electric power
distribution system. Hereafter in this thesis, these faults are referred to as “internal faults” and
“external faults”, respectively. Regardless of a fault occurrence location, its impact is appeared to
the end users as a voltage variation event such as an interruption, a voltage sag or a slight change in
Page 5
the supply voltage. The effect of an external fault mainly appears to the end users as a voltage sag
rather than as an interruption. This is mainly because of the mesh configuration of the transmission
and sub-transmission networks which feed the supply points of an electric power distribution
system. As a result, the share of external faults in the total power interruptions experienced by the
end users is considerably lower than that of the internal faults. In contrast, an internal fault usually
results in either an interruption or a voltage sag for the end users. The share of internal faults in the
total interruptions and voltage sags experienced by the end users can be higher than that of the
external faults.
The reliability improvement activities can aim at reducing the rate of external and internal faults
and also mitigating their impacts on the end users. In the functional zone of an electric power
distribution system, it is possible to mitigate the impacts of both external and internal faults by
means of various smart grid technologies. Feeder automation is one of the major smart grid
technologies that can be used for distribution system reliability improvement. Therefore, for an
illustration purpose, the following section aims to show how the feeder automation schemes may
affect the reliability performance of an electric power distribution system.
Without the network automation facilities, the electric utilities have to perform the fault
management activities based on the customers’ outage calls. Upon receiving the trouble calls from
the customers, the operators look at the network configuration map and the protection design
manual to determine the outage area. Then a repair crew has to be sent to patrol the outage area.
When faced with a tripped circuit breaker and no indication as to where the fault lies, a repair crew
has a range of options by which the faulted section is identified. In a manually operated distribution
system either “feeder splitting and fault re-ignition method” or “feeder splitting and insulation test
method” can be used for locating the faulted section [21]. The diagnosis of the fault in these
manners can be an unsafe, rigorous and time-consuming task, which finally result in the poor
service reliability. In this situation, it may take a long time to restore power to those parts of a
distribution network which are undamaged but have lost power because of problems elsewhere in
the distribution network (say 50 to 80 minutes) and also to restore power to customers that can only
be restored after repair or replacement of the damaged component (say 1 to 5 hours). However, a
suitable feeder automation scheme can be used to perform fault management activities in much
more efficient manners. Hence, depending on the characteristics of the implemented feeder
automation scheme, the above processes can be completed more efficiently by less people in much
less time, which increase the distribution system reliability and efficiency. Moreover, the
implemented automation scheme may also mitigate the voltage sags experienced by customers and

Page 6
the damage to the distribution network infrastructure by reducing the number of inrush current
caused by the fault re-ignition activities required to locate the fault. Figure 1, as an example, shows
how the fault management activities might proceed with and without employing an advanced feeder
automation scheme [22]. The times shown will be extended even further during storm conditions
when control center operators are managing a multiple outage scenario.
Figure 1. Fault management activities in response to a fault condition without and with employing an advanced feeder automation scheme [22].

Page 7
3 SMART GRID TECHNOLOGIES
In a broad sense, the term “smart grid” is referred to a conventional electric power system that
has been equipped with advanced technologies for purposes such as reliability improvement, ease of
control and management, integrating of distributed energy resources and electricity market
operations. The smart grid technologies can be categorized in the following five key areas [23]:
Integrated Communications – High-speed, fully integrated, two-way communication technologies
will make the smart grid a dynamic, interactive “mega-infrastructure” for real-time information and
power exchange. Open architecture will create a plug-and-play environment that securely networks
grid components to talk, listen and interact.
Sensing and Measurement – These technologies will enhance power system measurements and
enable the transformation of data into information. They evaluate the health of equipment and the
integrity of the grid and support advanced protective relaying.
Advanced Components – Advanced components play an active role in determining the grid’s
behavior. The next generation of these power system devices will apply the latest research in
materials, superconductivity, energy storage, power electronics, and microelectronics. This will
produce higher power densities, greater reliability and power quality, enhanced electrical efficiency
producing major environmental gains and improved real-time diagnostics.
Improved Interfaces and Decision Support– In many situations, the time available for operators
to make decisions has shortened to seconds. Thus, the smart grid will require wide, seamless, real-
time use of applications and tools that enable grid operators and managers to make decisions
quickly. Decision support with improved interfaces will amplify human decision making at all
levels of the grid.
Advanced Control Methods – Advanced control methods are the devices and algorithms that will
analyze, diagnose, and predict conditions in the smart grid and determine and take appropriate
corrective actions to eliminate, mitigate, and prevent outages and power quality disturbances. To a
large degree, these technologies rely on and contribute to each of the other four key technology
areas. For instance, they will monitor essential components (Sensing and Measurements), provide
timely and appropriate response (Integrated Communications; Advanced Components), and enable
rapid diagnosis (Improved Interfaces and Decision Support) of any event.

Page 8
Smart grid technologies are used for accomplishing a specific set of applications or functions in
the electric power systems. For each application, there are numbers of smart grid technologies
available that can be classified in the above described five key areas. The scope of this thesis is
limited to the smart grid technologies that can be used in the functional zone of an electric power
distribution system for improving the reliability of electric power delivered to the customers. At the
moment, there are numbers of the smart grid technologies already available in the market and some
others are still in the research and development stage. The main emphasis in this thesis is on the
technologies which have already been implemented in the field either as a commercially available
product or as a prototype project. The various products of the following well-known companies
have also been examined in order to find the potential smart grid technologies applicable for
purposes of this thesis:
- ABB (http://www.abb.com/)
- Advanced Control Systems (http://www.acsatlanta.com/)
- AREVA (http://www.areva.com/)
- Cooper Power Systems (http://www.cooperpower.com/)
- Deltatronic (http://www.deltatronic.com/)
- GE Energy (http://www.gepower.com/)
- G&W Electric (http://www.gwelec.com/)
- Hubbell Power Systems (http://www.hubbellpowersystems.com/)
- Motorola (http://www.motorola.com/)
- NovaTech (http://www.novatechweb.com/)
- OSI (http://www.osii.com/)
- Power Delivery Products (http://www.powerdeliveryproducts.com/)
- SEL (http://www.selinc.com/)
- Siemens (http://www.siemens.com/)
- S&C Electric Company (http://www.sandc.com/)
- SNC-Lavalin (http://www.snclavalin.com/)
- Survalent Technology (http://www.survalent.com/)
- Telvent (http://www.telvent.com/)
- Thomas & Betts (http://www-public.tnb.com/)

Page 9
3.1 Distance to Fault Estimator
Distance to fault estimator is an optional module of the modern distribution protection
equipment that can be used for estimating the fault location. When a fault occurs, this module
calculates the fault location as a distance from the substation to the fault. It can also notify this
information to the control center or the utility repair crews through a suitable communication
equipment. By using the distance to fault estimators, a much smaller zone of an electricity
distribution network is required to be inspected by the repair crews in search for location and
isolation of the fault and restore service to the affected customers. However, when a feeder has
multiple taps, there might be several probable fault locations for the fault distance indicated by this
module. In this situation, the repair crews are unable to determine which tap to follow to find the
fault location. However, applying fault passage indicators together with distance to fault estimators
can overcome this issue.
3.2 Fault Passage Indicator
Fault passage indicator is a device that can be located at some convenient point on an electricity
distribution network to give an indication as to whether the fault current has passed the point where
it is located or not. It is able to distinguish between the fault current and the load current associated
with the healthy feeder, and has some means of displaying its operation to a repair crew. The status
of a fault passage indicator can be recognized remotely or by visiting its physical location. Usually,
the status of an indicator used with overhead line networks is illustrated in the form of flashing
indication. In the case of underground cable networks, it is also possible to use a kind of fault
passage indicators equipped with short range wireless communication equipment. The status of
such an indicator can be retrieved remotely from a short distance (a few meters) without the need to
access the distribution substation to recognize its status. By using the fault passage indicators, the
repair crews waste less time to travel around the network in search for location of the fault. In the
past, the majority of fault passage indicators available in the market were mainly applicable for
radial distribution networks with directly earthed neutral [21, 24]. However, nowadays, there are
new generations of fault passage indicators available in the market that can be used in the other
electricity distribution networks.
Page 10
3.3 Fault Locator Schemes
Fault locator schemes are devices and algorithms that are used to identify the location of a fault.
Developed schemes for automatic fault location in the electricity distribution networks are generally
operate based on a special fault locating technique. Various fault location techniques have been
proposed in the literatures. The principles, merits and demerits of each fault location technique in
the transmission and distribution systems have been discussed in [24-26]. Most of the proposed
fault location techniques have been developed for power transmission systems. Few methods have
been proposed for the electric power distribution networks due to the following reasons [26]:
Variety of Conductors and Structures: Along a typical distribution feeder there are different
cables, lines and configurations (cross-arm, twisted, spacer, underground, etc.); therefore, there is
no linear relation between the line impedance and the distance between the fault location and the
substation.
Lateral Branches: Unlike transmission lines, typical distribution feeders have several lateral
branches. Thus, short circuits in different geographical locations can produce the same currents and
voltages measured at the substation. Consequently, the fault location procedure may result in
several different points as possible locations.
Load Distributed along the Feeder: The current measured at the substation during a fault includes
a contribution given by the sum of the load currents at each node and, in contrast to transmission
systems, it is impossible to estimate these currents accurately.
Modifications in the Feeder Configuration: Distribution networks are subject to constant
modifications in their topology. As a result, any fault location algorithm must have access to a
database, periodically updated, in order to give a better estimate of the fault point.
Over the last few decades, several fault locator schemes have been developed for employing in
the electric power distribution systems. Some of these schemes mainly work based on the
measurements of voltage and current signals provided by devices such as the fault passage
indicators installed along the distribution feeders. Traditional fault indicators are useful tools for
fault management activities. However, they require local inspection by a repair crew. Repair crews
typically patrol the entire faulted circuit and spending valuable time patrolling a significant portion
of a feeder without any additional information that could be provided by fault indicators located
along the feeder. However, repair crews could be dispatched directly to the section of the
distribution network where the fault occurred and quickly restore power to the affected customers

Page 11
utilizing fault location information obtained from remote indicating fault passage indicators. The
status of fault passage indicators with remote indicating capability can be recognized by a remote
master station located at a main substation and/or a distribution control centre. Their information
might be used directly for detecting and locating of faults or indirectly to get a high level of
confidence about the fault type and/or the location. More information about the fault locator
schemes which mainly work based on the remote data retrieval of fault passage indicators can be
found in [27-30]. There is another group of fault locator schemes. These schemes normally operate
based on algorithms that use measurements of voltage and current signals provided by intelligent
electronic devices located at a main substation. The intelligent electronic device could be a digital
transient recorder or a digital protection equipment. These schemes often rely on additional
information such as the configuration of the electricity distribution network, load profiles,
characteristics of protective devices and their locations. This information can be gathered from
databases available at a main substation and/or from distribution control centre databases. One of
the benefits of such schemes is that they may also be useful to identify the location of transient
faults and thus serve as a tool for fault prevention. More information about the fault locator schemes
which normally operate based on the measurements at the substation level can be found in [31-40].
3.4 Substation Automation
Substation automation is a system which enables an electric utility to locally and remotely
monitor, control and coordinate the components installed at a substation. The substation automation
related functions include monitoring and data acquisition from various substation equipment, bus
voltage control, circulating current control, bus load balancing, overload control, and fault
management for substation related faults. In the functional zone of an electric power distribution
system, substation automation systems can be implemented in both sub-transmission (HV/MV)
substations and distribution (MV/LV) substations. Compared to other components of an electricity
distribution network, the failure rates of components of a sub-transmission substation are very low,
but their consequences can be much serious as they may result in extended outages. The substation
automation system with suitable automation functions can be used to automatically isolate the failed
component and restore supply to the affected feeders through proper switching actions. In addition,
when encountering with a failure condition in the electricity distribution network and facing with a
feeder circuit breaker operation, an alarm can be automatically issued to the distribution control
centre to notify the fault condition. The data recorded by various intelligent electronic devices
installed at the substation are also available to the operators. This data can be used for conducting

Page 12
various fault management activities. In the other hand, the substation automation system can also be
implemented at distribution substations for remote data acquisition from various equipments
installed at the substation and also to control the available actuators. The retrieved data can be used
for approximate fault location purpose. In addition, the operators can operate the remote controlled
switching devices available at the substations to isolate the fault and restore the service for as many
as possible of the affected customers. More information about the substation automation systems
can be found in [41-54].
3.5 Feeder Automation
Feeder automation is an automatic control scheme that is used for automatic fault detection,
isolation and service restoration in an electricity distribution network. When an electricity
distribution network encounters with a permanent failure condition, there are basically two groups
of affected customers. First group involves the customers that have to be waiting till the end of
repair process of the faulted section before power restoration. In contrast, the second group includes
the customers whose power supply can be restored through main or alternative supplies by means of
proper switching actions. Usually, the number of customers in the second group is much larger than
that of the first group. For power restoration of the second group of customers, healthy sections of
the distribution network should be isolated from the one that contains the fault. After that they can
be restored from main or alternative supplies by means of appropriated switching actions. In the
case of a manually operated distribution system, fault isolation and service restoration activities can
just be accomplished after the fault is located by utility repair crews. However, by employing a
feeder automation scheme, the interruption duration experienced by the affected customers can be
reduced. Feeder automation schemes can automatically perform the necessary switching operations
to isolate the faulted section from the healthy ones and restore power to as many as possible of the
affected customers. However, the impact of a special feeder automation scheme on the frequency
and duration of interruptions experienced by the customers are dependent on various parameters.
Among the rest, the operational procedure of the implemented automation scheme, number,
location and characteristics of switching devices, and also configuration and operational criteria of
the targeted distribution network are considerable.
Over the last few decades, several feeder automation schemes have been developed for
employing in the electricity distribution networks. Some of these feeder automation schemes
perform whole fault detection, isolation and restoration process locally without any involvement of
operators located at a master substation and/or a distribution control centre. These feeder

Page 13
automation schemes are stand alone schemes and mainly dependent on the automatic switching
devices installed along the distribution feeders. Actually, the necessary intelligence for performing
dedicated automatic functions is provided by appropriate equipment of such automatic switching
devices. More information about this kind of feeder automation schemes can be found in [55-69]. In
addition, there is another group of feeder automation schemes which perform whole or some part of
the fault detection, isolation and service restoration process based on a centralized intelligence
which may be located at a main substation and/or a distribution control centre. These automation
schemes are actually subsets of a full distribution automation system. This approach requires a full
knowledge of the distribution network, including the network topology and operation parameters.
The feeder automation functions are centrally implemented and automatic switching commands are
almost issued from the control centre. More information about this kind of feeder automation
schemes can be found in [70-87].
3.6 Distribution Automation
Distribution automation is a complete system that enables a utility to monitor, coordinate and
operate the distribution network components in a real-time mode from remote locations.
Distribution automation allows utilities to implement a flexible monitoring and control of an
electric power distribution system, which can be used to enhance efficiency, reliability, and quality
of the electric service. Flexible monitoring and control also results in a more effective utilization
and life-extension of the existing distribution system infrastructure. An advanced distribution
automation system has all the necessary components required for efficient fault management
activities in the feeder and the substation levels. It can automatically perform the fault detection,
isolation and service restoration activities without an intervention of distribution system operators.
It can also identify the fault location and assist the control center operators and the repair crews
during the fault management activities. More information about various aspects of distribution
automation systems can be found in [88-105].
3.7 Fault Current Limiter
Future power system will experience an increase of dense urban distribution networks and an
increased penetration of distributed energy recourses which both contribute to increasingly fault
current levels. In this situation, managing fault currents is crucial in order to avoid malfunctioning
and damage of equipment as well as to increase system reliability. There are number of
conventional solutions available for managing fault currents, such as construction of new

Page 14
substations, introducing a higher voltage level, bus splitting, upgrading circuit breakers, current
limiting reactors and high impedance transformers, impedance grounding, and sequential breaker
tripping. Normally, the application of these conventional methods leads to some technical and/or
economical problems. This issue has been the main driver for developing the fault current limiters.
Fault current limiter is a device which limits the amount of fault current during short circuit
conditions. It has negligible impedance at a normal operating condition but high impedance when
the fault current is passing through it. Currently, two broad categories of a fault current limiter
technologies exist, namely high-temperature superconducting and solid-state. High-temperature
superconducting types use superconducting-based material and reduce fault currents by introducing
a larger-than-normal impedance into the path of the fault current. Solid-state types use high-speed
solid-state switching devices to rapidly insert an energy absorbing impedance into the circuit to
limit the fault current. Emerging technologies have made it feasible to develop and test the fault
current limiters applicable in the sub-transmission voltages (up to 138 kV). Application aspects of
various fault current limiters have been reported in [106-117].
3.8 Dynamic Voltage Restorer
Dynamic voltage restorer is a waveform synthesis device based on power electronics that is
series-connected directly into the network by means of a set of single-phase insertion transformers.
This device can be installed in strategic locations of an electricity distribution network to mitigate
the effect of voltage sags on the customers. The dynamic voltage restorer cannot protect a load
against an interruption. When the voltage of one or more phases of incoming supply drops below a
preset threshold, this device injects a controlled amount of voltage into the affected phase or phases
to boost the voltage of outgoing side back to a more suitable level. The commercial brands of
dynamic voltage restorer are nowadays available in the market with ratings up to 50 MVA, voltage
injection transformers ratings up to 46 kV, response time of around a half cycle and capability to
correct the three-phase voltage sags with remaining voltage up to 50 percents of the nominal
voltage. Further information about dynamic voltage restorers can be found in [118-120].
Page 15
4 RELATED WORKS AND THESIS CONTRIBUTION
Two main literature surveys have been conducted for the purposes of this doctoral thesis. The
first literature survey aimed at finding the major smart grid technologies applicable for reliability
enhancement of distribution systems that outlined in Chapter 3. The second literature survey was
concerned with the previous research activities related to the application of probabilistic methods
for reliability evaluating of smart distribution grids. In the following, the results of this literature
survey and also the contribution of this thesis are described.
In [121-123], the impacts of different controlling strategies of dynamic voltage restorers for
mitigation of voltage sags have been simulated for specific case studies. The work by Tosato et al.
[124] deals with the application of fault current limiters for mitigation of voltage sags. In [125,
126], the impacts of fault current limiters on the reliability performance of various substation
configurations have been studied. The work by Lawler et al. [127] discusses the reliability effects of
distribution automation on the Athens Utilities Board. Several scenarios have been conducted in this
paper by providing the remote controlling facilities for targeted manually operated switching
devices. The reliability impacts of the automation solution concerned in this paper has been
modeled by modifying the switching times of the retrofitted switching devices. In [128, 129], the
optimal allocation of the specific automatic sectionalizing switching devices have been studied.
These switching devices are able to diagnose the fault and eventually to reschedule the
configuration of the network for restoring the power to the affected customers. The reliability
impact of the targeted automation scheme has been modeled by ignoring the effects of faults on the
customers that have been affected by the fault but are restored automatically through automatic
switching devices. The work by Rigler et al. [130] presents the potential benefits that may be
achieved by automation solutions for distribution system reliability improvement. The effects of the
number and location of reclosers on the frequency and duration of sustained interruptions imposed
on the customer have been examined in this paper. The works by He et al. [131, 132] describe an
approach based on the event tree method for assessing the reliability impacts of the operational
failures of the communication system and the protection system in the centralized feeder
automation schemes. The reliability indices concerned in these papers are limited to those which
only count the sustained interruptions. Brown et al. [133] models the effects of two-stage service
restoration through remote controlled switching devices on the duration of sustained interruptions
imposed on the customers. In [134-137], several optimization techniques have been used for the
allocation of the remote controlled switching devices. The reliability impacts of adding remote
Page 16
controlling facility to the retrofitted switching devices have been modeled as the reduction in time
required to operate these switching devices.
The reliability evaluation approaches proposed in the above described works have the following
shortfalls:
1- Virtually all of the reliability assessment studies have been concentrated on the sustained
interruptions, which is only one attribute of the reliability of electric power delivered to the
customer. However, nowadays, customers are also sensitive to momentary interruptions and even
voltage sags. Some of the available reliability enhancement solutions, such as the feeder automation
schemes, improve the reliability indices corresponding to the sustained interruptions in cost of
increasing the frequency of momentary interruptions and voltage sags. Therefore, the possible
impacts of the implemented solutions on all three major attributes of the service reliability should
be taken into account simultaneously.
2- The impacts of operational failures of the implemented reliability enhancement solutions have
not been considered in the majority of previous studies. However, the implemented reliability
enhancement solutions are not fully reliable [138, 139]. The operational failure modes of the
implemented solution are required to be taken into account as the reliability impacts of the
implemented solution may be affected due to this issue. It should be noted that the operational
failure is referred to the situation where a device fails to function when it is required to operate.
3- The reliability enhancement solutions have almost been limited to only one possible solution. In
other words, the integrated effects of several reliability enhancement solutions with different
technologies have not been taken into account. However, when employing a specific reliability
enhancement solution for improving a given set of reliability indices, there might be some negative
impacts on the other reliability indices. In this situation, it is normally possible to use other
reliability enhancement solutions, almost with different technologies, to mitigate the negative
impacts of the primary solution.
4- The practical aspects of the realistic distribution systems have not been considered in the
analyses. The majority of the previous works are concerned with the application of remote
controlled or automatic sectionalizing switching devices for speeding up the fault isolation and
service restoration activates. The reliability impacts of these solutions have almost been analyzed
using simple reliability modeling approaches. In the most cases only manual switching times have
been replaced by automatic or remote switching times. However, there are some other practical

Page 17
issues that should be taken into account. Among the rest, the impacts on the procedures that are
followed by the electric utilities for fault detection and location, the operating criterion of an electric
power distribution system in the normal and emergency conditions and also the switching
sequences that are followed for isolating the fault and restoring the power service for the affected
customers have not been considered in the analyses.
5- The proposed reliability evaluation approaches are case dependent. They have almost been
designed for a specific reliability enhancement solution and/or a given type of an electricity
distribution network. The application of these methods even for other similar solutions but with
different operating logics is questionable.
This research aimed at overcoming the above described shortfalls. The research activities were
organized to develop and demonstrate a comprehensive reliability evaluation approach that can be
used for the reliability evaluation of smart distribution grids. The proposed methodology is capable
of predicting the possible impacts of the implemented solutions on all three major attributes of the
service reliability, namely sustained interruptions, momentary interruptions and voltage sags. The
proposed approach has been such designed and developed that the impacts of various operational
failure modes of the implemented technologies can also be considered when conducting a reliability
case study. It is also possible to evaluate the reliability impacts of various technologies that are
implemented at the same time. In addition, the practical issues related to normal and emergency
operations of an electric power distribution system have been taken into account when developing
the proposed approach.

Page 18
5 PROPOSED RELIABILITY EVALUATION APPROACH
The results of research activities conducted during this doctoral research project indicated that
the impacts of reliability enhancement solutions are revealed through various processes involved in
the fault management activities [140-147]. When the fault effects are appeared in an electric power
distribution system, specific processes designated as fault management activities are required to be
carried out. The fault effects are normally appeared in the form of abnormal voltages and currents.
Typical fault management activities involve the following processes:
- Autonomous System Reaction Process: The autonomous system designated for protection,
control and monitoring purposes reacts against the fault effects and operates according to its
operational logics. The control center operators have no involvement in this process. In what
manner this process is carried out depends on the several factors such as the fault effects, settings
and operational logics of associated devices, and operational policies of the electric utility. The time
required to accomplish this process is almost very short; however, the outcome of this process has
vital impacts on the extent of the affected customers and the type of voltage variation events that
they may be encountered. The voltage variation events may range from a slight change in the RMS
voltage for a few cycles to more severe situations such as complete disappearing of the supply
voltage for a long period of time.
- Fault Notification Process: The control center operators should be notified about a forced outage
in order to initiate the necessary remedial actions. The time required for the control center operators
to be notified about a forced outage is a function of various parameters. Among the rest, the
available facilities to the operators for detecting and notifying the abnormal conditions are crucial.
- Approximate Fault Location Process: When the control center operators are notified about an
abnormal condition, the necessary data are collected and analyzed in order to find the approximate
fault location. The time required for accomplishing this task depends on the parameters such as the
fault effects and the available facilities for recording, retrieving and analyzing the related data.
- Decision Making Process: After the approximate fault location activity, the control center
operators should make a decision about the overall procedure for mitigating the reliability impacts
of the fault. This procedure is determined based on the factors such as the approximate fault
location, type of affected customers, number, location and type of switching devices involved and
also available repair crews. The time required for accomplishing this task mainly depends on the
decision making facilities available to the control center operators.
Page 19
- Remote Fault Isolation and Service Restoration Process: In order to mitigate the reliability
impacts of a permanent fault on the customers, the electricity network should be properly
reconfigured to isolate the fault and restore the power to as many as possible of the affected
customers. In a situation where the electricity network is equipped with suitable remote controlled
switching devices, the network reconfiguration can be initiated from the control center. The
applicability and effectiveness of the remote network reconfiguration process depend on the
number, type and location of the available remote controlled switching devices, the outcome of the
approximate fault location process and also the operational policies of the electric utility.
- Repair Crew Dispatching and Traveling Process: Once the approximate fault location and the
overall procedure for fault isolation and service restoration activities are known, the control center
operators dispatch the repair crews around the damaged area. The location, date and time of fault
occurrence and also availability of the facilities designated for notifying and navigation of the repair
crews affects the time required to get around the damaged area.
- Faulted Zone Location Process: In some situations, the outcome of the approximate fault
location process may just identify the faulted feeder or several zones as the probable locations of the
damaged component. A zone is referred to a set of the electricity network components rather than
switching devices that are permanently interconnected to each other and surrounded by switching
devices. In a situation where the faulted zone is unknown, the repair crews look for a zone that
contains the damaged component. The time required to accomplish this process depends on the
factors such as daylight, accessibility to the suspected feeder and its components, available
resources and facilities to the repair crews and also the operational policies of the electric utility.
- Local Fault Isolation and Service Restoration Process: After repair crews reached the damaged
area and found the faulted zone, there might be possible to reconfigure the electricity network in
order to further mitigate the reliability impacts of a permanent fault on the customers. This is
usually done by manually and/or remotely operating the available switching devices. This process is
normally coordinated between the repair crews and the control center operators in order to perform
this task properly. The local network reconfiguration process may involve several switching actions.
The time required to accomplish this process depends on the number, type and location of the
switching devices involved, the operational policies of the electric utility, the available repair crews
and their facilities and resources to access these switching devices.

Page 20
- Precise Fault Location Process: The damaged component should be identified for possible repair
or replacement activities. The damaged component is located in the faulted zone. As normally the
faulted zone contains several components, the repair crews may need further investigation to find
the failed component. Additional efforts are also required to find the damaged part of the failed
component. The time required to accomplish this process depends on the factors such as the type of
components involved in the faulted zone, the outcome of the approximate fault location process and
also facilities and resources available to the repair crews.
- Repair or Replacement Process: The damaged component should be repaired or replaced in
order to return the network configuration to the normal operating condition and to restore power to
the customers that can only be restored after repair or replacement of the damaged component. The
time required to accomplish this process depends on factors such as the resources available to the
electric utility, operational policies of the electric utility and the damage severity.
- Return to Normal Operation Process: Usually fault isolation and service restoration activities
necessitate changing the normal configuration of a faulted electricity network. As the normal
configuration of an electricity network is the basis for day-to-day operating and also setting of the
devices involved in the autonomous system, it is necessary to return the electricity network to its
normal operating configuration. This process is initiated after completing the repair or replacement
of the damaged component. It usually needs special switching sequences which may cause other
interruptions for some group of the customers. The duration of this process and its effects on the
customers depend on the factors such as the type, location and number of available switching
devices, type and location of the customers that may be affected, operating policies of the electric
utility, the available repair crews and their facilities and resources to access these switching devices.
When employing a given set of the smart grid technologies, some of the above described fault
management activities are affected which finally alter the reliability of electric power delivered to
the customers. Thereby, the reliability impacts of the targeted smart grid technologies can be
evaluated from their effects on the fault management activities. The reliability evaluation procedure
starts by enumerating a suitable contingency. Then, the impacts of the implemented smart grid
technologies on the various stages of the fault management activities are identified for each
contingency. This procedure is repeated for all the possible contingencies and finally, by summing
up the reliability impacts of the evaluated contingencies, the load points and system oriented
reliability indices are calculated. The flowchart of the procedure proposed for reliability evaluation
of smart distribution grids is shown in Figure 2. A modular approach has been used for developing

Page 21
the reliability evaluation procedure. Each module has its own functions for performing the targeted
tasks assigned to it. Following are overall explanations of each module involved in the proposed
evaluation procedure:
- Module 1: This module is responsible for gathering the data related to the electric power
distribution system under study. The details of data required are depending on the study purposes
and characteristics of the distribution system under study. The input data may include the following
information:
- Type of components (e.g. overhead line, underground cable, transformer and switching device)
- Electrical characteristics of components (e.g. rated voltage, normal capacity, emergency capacity,
positive, negative and zero sequence impedances, making and breaking capability of switching
devices, voltage ratio, winding connection and phase shift of transformers)
- Interconnections of components and their geographical information
- Fault rates of components (e.g. permanent failure rate and transient failure rate)
- Actual repair or replacement times for permanent faults
- Number of reclosing sequences required for clearing of multi-shot transient faults
- Operational procedures of the autonomous system designated for protection, control and
monitoring purposes. The operational procedures of the implemented smart grid technologies
should be clearly identified for various abnormal conditions that may occur in the distribution
system under study.
- Operating characteristics for devices involved in the autonomous system (e.g. time current
characteristics of protection relays and correction capabilities of dynamic voltage restorers)
- Operational failure data for the components that involve in the fault management activities. The
operational failure of each component can be represented through various operating states for the
component and assigning a state residing probability to each operating state. In each operating state,
specific operating logics may work successively and others remain inactive or malfunction.
- Load points data (e.g. average and maximum powers, power factor, number of customers,
interruption costs and their susceptibility against voltage sags)
- Module 2: This module is responsible for clarifying the details that should be considered when
analyzing the reliability performance of the distribution system under study. In addition, the data
related to various fault management activities are also collected in this stage. The input data may
include the following information:
Page 22
- Power flow operation data (e.g. base power, maximum number of iterations, maximum allowable
error, voltage constraints and overload constraints)
- Short circuit operation data (e.g. fault resistance, number of fault positions in the case of overhead
lines and underground cables)
- Definition of reliability attributes (e.g. voltage threshold for distinguishing interruptions from
voltage sags, time threshold for distinguishing sustained interruptions from momentary
interruptions and aggregation methods for evaluating the complex events)
- Availability of suitable facilities in the control center for purposes of the fault management
activities (e.g. fault notification facilities, approximate fault location facilities, decision making
supporting facilities and also the facilities targeted for dispatching and assisting the repair crews)
- Average times required for the control center operators to accomplish specific fault management
activities with and without the aid of employed smart grid technologies (e.g. the average time
required for the operators to be notified about a permanent fault, the average time required for the
operators to find the damaged area, the average time required for the operators to make a decision
about the fault management activities and also the average time required for the operators to
dispatch the repair crews around the damaged area)
- Travelling speed of the repair crews to get around the damaged area with and without the aid of
employed smart grid technologies
- Average patrolling speed of the repair crews for the precise fault location on the overhead lines
- Average time required for the precise fault location on the underground cables, including both pre-
location and pinpointing activities
- Average time required for reading a set of indicators with a local indication
- Average time required for performing an insulation test on the underground cables
- Average time required for the remote operation of the remote controlled switching devices
- Average time required for the manual operation of the switching devices
- Available repair crews and the geophysical information of the trouble call centers
- Requirement for considering the effects of voltage sags originated from external faults
- Maximum number of simultaneous operational failures that should be considered in the reliability
case study
- Policy of the electric utility for zonal fault location activities (e.g. feeder splitting and fault re-
ignition or feeder splitting and insulation test)
- Policy of the electric utility for returning the electricity distribution network to its normal
operating configuration. There are two common policies, namely the close transition and the open

Page 23
transition. In the close transition, the network can be such configured to temporary operate in a loop
configuration. This can avoid or reduce the number of additional interruptions imposed on the
customers during the network reconfiguration activities. Contrary, in the open transition, the
network is not allowed to operate in a loop configuration. Therefore, additional interruptions may
be imposed on the customers during the network reconfiguration activities.
- Policy of the electric utility for managing the earth fault in the cases where the sustained operation
with the earth faults is permitted
- Module 3: When requested by the analysis assumption, this module provides data related to
voltage sags arising from the faults outside of the functional zone of the electricity distribution
system under study. The voltage sags are assigned to specific supplying points (propagation points)
of the targeted distribution network. In the case of sustained and momentary interruptions, the
frequency and duration of interruptions are properly assigned to the power supplying components.
- Module 4: This module is responsible for generating a primary contingency to be analyzed in the
next modules. The generated contingency can be a voltage sag arising from an external fault or a
short circuit fault on a component within the functional zone of the distribution network under
study. For an external fault, the generated contingency contains the necessary information related to
the voltage sags such as the voltage magnitudes and phase angles of all three phases, propagation
points, occurrence rates and durations of the events. For an internal fault, the generated contingency
may contain the fault type (permanent: major, minor or transient: single-shot or multi-shot), the
fault location along the faulted component, fault rate, actual repair or replacement time, fault
resistance and also short circuit type (single-phase to ground, two-phase, two-phase to ground and
three-phase).
- Module 5: When requested by the analysis assumption, the attributes of the primary contingency
is further modified in this module for the situation where devices involve in the fault management
activities encounter with the operational failure conditions. Possible combinations of the operational
failures of these devices are considered as subsets of the primary contingency. Hence, in this
module, various operating states are generated for evaluating the primary contingency. Under any
circumstances, the state corresponding to no operational failure always exists in the generated
operating states.
Page 24
- Module 6: This module is responsible for evaluating the reaction of the autonomous system
against the contingency under study. In this module, depending on the analysis assumption, the
initial effects of the fault involved in the contingency under study are simulated based on the power
flow study, short circuit study or simple energy flow check. Then, the detailed reactions of various
devices designated for the protection, control and monitoring purpose are evaluated against the
initial fault effects. The events identified in this process are used in the next modules.
- Module 7: The average time required for the control center operators to be notified about a forced
outage arising from the contingency under study is estimated in this module. The effects of the
employed smart grid technologies and their possible operational failures are taken into account
when estimating this time period.
- Module 8: The average time required for the control center operators to find the approximate
location of the fault involved in the contingency under study is estimated in this module. The effects
of the employed smart grid technologies and their possible operational failures are also taken into
account when estimating this time period.
- Module 9: The average time required for the control center operators to make decision about the
activities required for managing the fault involved in the contingency under study is estimated in
this module. The effects of the employed smart grid technologies and their possible operational
failures are also taken into account when estimating this time period.
- Module 10: Depending on the analysis assumptions, the ratings of the available switching devices
and also the fault involved in the contingency under study, a suitable set of the remote controlled
switching devices are identified in this module for remote fault isolation and service restoration
activities.
- Module 11: Based on the identified maneuvering switching devices, all the possible network
configurations are generated in this module. Then, each configuration is further investigated against
criterion such as fault isolation condition, radial operating status, voltage and overload constraints
and also number of customers that are restored before and after the network reconfiguration.
Finally, a set of the network configurations that can meet the criterion are selected as the feasible
network configurations for fault isolation and service restoration purposes.

Page 25
- Module 12: In this module, a feasible network configuration with the maximum fault mitigation
impacts is selected as the final network configuration when the fault isolation and service
restoration activities are accomplished. Then, the optimal switching sequences for transferring the
present configuration to the final configuration are identified. The switching sequences are
organized in a way that all the configurations in this process just involve the identified feasible
network configurations.
- Module 13: In this module, the status of the electricity distribution network under study is
reconfigured when the targeted switching device is operated. The switching device is either
operated from the control center or by repair crews engaged in the field. The time of switching is
also estimated in this module. After operating the targeted switching device, there might be some
reactions from the autonomous system. Therefore, the possible reaction of autonomous system after
operating the targeted switching device should be evaluated in this module as well.
- Module 14: In this module, the process involved with the notification of repair crews and their
dispatching is evaluated. The outcomes of this module are the number, location, travelling speed
and dispatching time of repair crews that participate in the field activities for the contingency under
study.
- Module 15: In some situations, the outcome of the approximate fault location process may not be
able to identify the faulted zone. In this situation, the control center operators aid the repair crews to
identify the faulted zone. This module is responsible for evaluating the activities involved with the
faulted zone location process. Based on the analysis assumptions, the fault involved in the
contingency under study, the reaction of autonomous system, the available facilities to the repair
crews for fault location purposes and also the number, location and ratings of the available
switching devices, the faulted zone is identified. When the process involves any switching
operation, there might be some reactions from the autonomous system. Therefore, the possible
reaction of autonomous system after operating the targeted switching devices should be evaluated in
this module as well.

Page 26
- Module 16: Depending on the analysis assumptions, the ratings of the available switching devices
and also the fault involved in the contingency under study, a suitable set of the switching devices
are identified in this module for local fault isolation and service restoration activities.
- Module 17: In this module the activities involved with the precise fault location process are
evaluated. This module estimates the time at which the damaged part of the failed component is
identified. The activities involved in the precise fault location process depend on the analysis
assumptions, type of the fault involved in the contingency under study, type of the components
involved in the faulted zone, the reaction of autonomous system, the available facilities to the repair
crews for fault location purposes and also the outcome of approximate fault location process.
- Module 18: In this module the activities involved with the repair or replacement process are
evaluated. This module estimates the time at which the repair or replacement activities of the
damaged component are accomplished and it gets ready to return to its normal operating status.
- Module 19: Depending on the analysis assumptions and also the type, number and location of
switching devices whose normal operating statues have been changed due to the fault isolation and
service restoration activities, a suitable set of the switching devices are identified in this module for
returning the status of the electricity distribution network to its normal operating configuration.
- Module 20: Based on the identified maneuvering switching devices, all the possible network
configurations are generated in this module. Then, each configuration is further investigated against
criterion such as radial operating status, voltage and overload constraints and also number of
customers that are affected before and after the network reconfiguration. Finally, a set of the
network configurations that can meet the criterion are selected as the feasible network
configurations for return to normal operating status.
- Module 21: In this module, the normal operating status of the electricity distribution network is
selected as the final network configuration. Then, the optimal switching sequences for transferring
the present configuration to the final configuration are identified. The switching sequences are such
organized that all the configurations in this process just involve the identified feasible network
configurations.

Page 27
- Module 22: In this module, all the voltage variation events observed from the initiation of the
contingency under study till accomplishing the targeted fault management activities are evaluated
and compared against the thresholds defined for sustained interruptions, momentary interruptions
and voltage sags. Finally, by applying the aggregation methods, the equivalent voltage variation
events imposed on the customers are estimated for the contingency under study.
- Module 23: In this module, the impacts of various operating states generated for the primary
contingency are accumulated using the concepts of expectations. The following equations are used
to estimate the impacts of the primary contingency on the customers:
(1)
Where:
Contribution to the annual expected frequency of sustained interruptions affecting the load point Lj due to the contingency Ci
Total number of operating states generated for the contingency Ci
Ci Contingency number i
Annual occurrence rate of the contingency Ci
Probability of residing in the operating state k of the contingency Ci
Total number of voltage variation events imposed on the load point Lj due to the contingency Ci and the operating state k
Lj Load point number j
A fitness function which is equal to one if the characteristics of the voltage variation event under examination (i.e. VVE) fit to the thresholds defined for sustained interruptions. Otherwise, its value is equal to zero for the voltage variation event under examination.
Voltage variation event number m that imposed on the load point Lj due to the operating state k of the contingency Ci. Generally, the overall effects of the generated contingency are appeared to each load points as several voltage variation events. Each one of these voltage variation events can be corresponding to a power interruption, a voltage sag or just a slight deviation from the nominal voltage. The magnitude and duration of each voltage

Page 28
variation event are examined in order to identify the type of events.
(2)
Where:
Contribution to the annual expected frequency of momentary interruptions affecting the load point Lj due to the contingency Ci
A fitness function which is equal to one if the characteristics of the voltage variation event under examination (i.e. VVE) fit to the thresholds defined for momentary interruptions. Otherwise, its value is equal to zero for the voltage variation event under examination.
(3)
Where:
Contribution to the annual expected frequency of voltage sags affecting the load point Lj due to the contingency Ci
The value of this function shows the overall impacts on the customers connected to the load point Lj when the characteristics of the voltage variation event imposed on this load point (i.e. VVE) fit to the thresholds defined for voltage sags. Its value lies between zero and one. The value of this function is equal to zero when the characteristics of the imposed voltage variation event do not fit to the thresholds defined for voltage sags. Generally, the magnitude and duration of the voltage sag are compared with the voltage tolerance characteristics of sensitive equipments of the customers connected to the load point Lj to find its possible impacts. The impacts on the customers connected to the load point Lj of the voltage sag are sum up and divided by the total number of customers to estimate the value of this function.
(4)
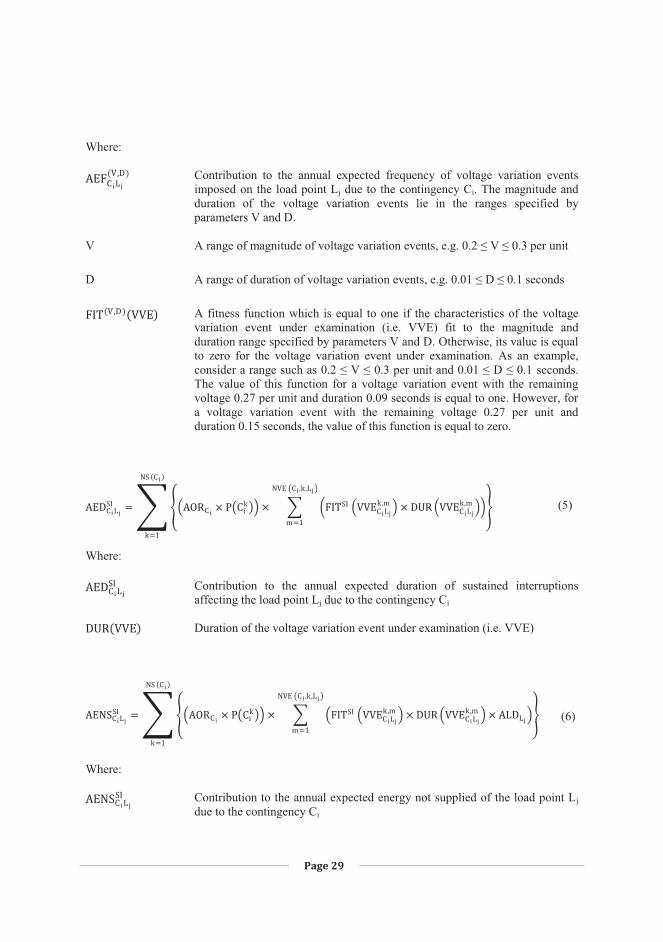
Page 29
Where:
Contribution to the annual expected frequency of voltage variation events imposed on the load point Lj due to the contingency Ci. The magnitude and duration of the voltage variation events lie in the ranges specified by parameters V and D.
V A range of magnitude of voltage variation events, e.g. 0.2 ≤ V ≤ 0.3 per unit
D A range of duration of voltage variation events, e.g. 0.01 ≤ D ≤ 0.1 seconds
A fitness function which is equal to one if the characteristics of the voltage variation event under examination (i.e. VVE) fit to the magnitude and duration range specified by parameters V and D. Otherwise, its value is equal to zero for the voltage variation event under examination. As an example, consider a range such as 0.2 ≤ V ≤ 0.3 per unit and 0.01 ≤ D ≤ 0.1 seconds. The value of this function for a voltage variation event with the remaining voltage 0.27 per unit and duration 0.09 seconds is equal to one. However, for a voltage variation event with the remaining voltage 0.27 per unit and duration 0.15 seconds, the value of this function is equal to zero.
(5)
Where:
Contribution to the annual expected duration of sustained interruptions affecting the load point Lj due to the contingency Ci
Duration of the voltage variation event under examination (i.e. VVE)
(6)
Where:
Contribution to the annual expected energy not supplied of the load point Lj due to the contingency Ci

Page 30
Average load connected to the load point Lj
(7)
Where:
Contribution to annual expected cost arising from sustained interruptions affecting the load point Lj due to the contingency Ci
The value of this function shows the financial impacts of the voltage variation event (i.e. VVE) imposed on the load point Lj. For a voltage variation event which its characteristics fit to the thresholds of power interruptions, the duration of voltage variation event under examination is used to estimate the cost. However, in the case of a voltage variation event which its characteristics fit to the thresholds defined for the voltage sags, both magnitude and duration of the voltage variation event are normally required to estimate the cost. The technique described in [148] can be used to estimate
. This technique has been developed by collaboration of the author.
(8)
Where is the contribution to annual expected cost arising from momentary interruptions affecting the load point Lj due to the contingency Ci.
(9)
Where
is Contribution to annual expected cost arising from voltage sags affecting the load point Lj due to the contingency Ci.

Page 31
A fitness function which is equal to one if the characteristics of the voltage variation event under examination (i.e. VVE) fit to the thresholds defined for voltage sags. Otherwise, its value is equal to zero for the voltage variation event under examination.
- Module 24: In this module, the contributions of all the primary contingencies are summed up to
deduce the load points and system oriented reliability indices. The following equations are used to
estimate the reliability indices:
(10)
Where:
Annual expected frequency of sustained interruptions affecting the load point Lj
NCT Total number of primary contingencies
(11)
Where is annual expected frequency of momentary interruptions affecting the load point Lj.
(12)
Where is the annual expected frequency of voltage sags affecting the load point Lj.
(13)
Where is the annual expected frequency of voltage variation events imposed on the load point Lj. The magnitude and duration of the voltage variation events lie in the ranges specified by parameters V and D.
(14)
Where is the annual expected duration of sustained interruptions affecting the load point Lj.

Page 32
(15)
Where is the average outage time of the load point Lj.
(16)
Where is the annual expected energy not supplied of the load point Lj.
(17)
Where is annual expected cost arising from sustained interruptions affecting the load point Lj.
(18)
Where is the annual expected cost arising from momentary interruptions affecting the load point Lj.
(19)
Where is the annual expected cost arising from voltage sags affecting the load point Lj.
(20)
Where: SAIFI System Average Interruption Frequency Index [1, 3, 152]
NLP Number of load points of the distribution system under study
Number of customers connected to the load point Lj

Page 33
(21)
Where MAIFI is the Momentary Average Interruption Frequency Index [1, 3,152].
(22)
Where AVSSI is the Average Voltage Sag Severity Index. This index shows the average occurrence rate of the voltage sags that can cause problem for the customers.
(23)
Where AVVFI(V,D) is the Average Voltage Variation Frequency Index. This index shows the average occurrence rate of the voltage variation events that their magnitude and duration lie in a range specified by the parameters V and D.
(24)
Where SAIDI is the System Average Interruption Duration Index [1, 3, 152].
(25)
Where ASAI is the Average System Availability Index [1, 3, 152].

Page 34
(26)
Where ASUI is the Average System Unavailability Index [1, 3,152].
(27)
Where EENS is the overall Expected Energy Not Supplied [1, 3, 152].
(28)
Where ECOSTSI is the total expected cost resulted from sustained interruptions.
(29)
Where ECOSTMI is the total expected cost resulted from momentary interruptions.
(30)
Where ECOSTVS is the total expected cost resulted from voltage sags.

Page 35
Figure 2. Flowchart of the procedure proposed for reliability
evaluation of smart distribution grids (part 1 of 4).
Module 1 Input Distribution
System Data
START
Module 2 Input Analysis
Assumption Data
Should the effects of external events be evaluated as well?
Module 3 Input External Events Data
YES
NO
Have all the contingencies
been evaluated?
Module 4 Generate the Next
Primary Contingency
NO
Module 24 Deduce the Load Points and
System Oriented Reliability Indices
YES
END
A
Have all the possible operating states been
evaluated?
NO
YES
B
Module 23 Evaluate the Overall Impacts of the Primary Contingency
on the Customers

Page 36
Figure 2. Flowchart of the procedure proposed for reliability
evaluation of smart distribution grids (part 2 of 4).
Module 5 Modify the Contingency for the Next Possible Operational Failure Status
Is there any forced outage?
A B
NO
Module 22 Evaluate the Impacts of the
Contingency on the Customers
YES
Module 6 Evaluate the Reaction of
Autonomous System
Module 7 Evaluate the Fault
Notification Process
Module 8 Evaluate the Approximate
Fault Location Process
Module 9 Evaluate the Decision
Making Process
Is it possible to reconfigure the
network remotely?
YES
D C
Module 10 Find the Remote Controlled Maneuvering Switching Devices for Fault Isolation and Service Restoration
NO

Page 37
Figure 2. Flowchart of the procedure proposed for reliability
evaluation of smart distribution grids (part 3 of 4).
Module 11 Find the Feasible Network Configurations for Fault Isolation and Service Restoration
All the remote switching operations
have been done?
NO
YES
The faulted zone has already been identified?
YES
E
Module 14 Dispatch the Repair Crews
to the Damaged Area
C
NO Module 13
Reconfigure the Network for the Next Switching Operation and Evaluate the Reaction of
Autonomous System
D
Module 15 Evaluate the Faulted Zone Location Process and the
Possible Reaction of Autonomous System
Module 16 Find the Maneuvering Switching Devices for Fault Isolation and Service Restoration
Is there any maneuvering switching devices?
YES
F
NO
Module 12 Find the Optimal Switching Sequences for
Fault Isolation and Service Restoration

Page 38
Figure 2. Flowchart of the procedure proposed for reliability
evaluation of smart distribution grids (part 4 of 4).
Module 11 Find the Feasible Network Configurations for Fault Isolation and Service Restoration
All the switching operations have
been done?
YES
Module 12 Find the Optimal Switching Sequences for
Fault Isolation and Service Restoration
Module 17 Evaluate the Precise Fault Location Process
NO
F
Module 20 Find the Feasible Network Configurations for Return to Normal Operating Status
E
Module 18 Evaluate the Repair or Replacement Process
Module 19 Find the Maneuvering Switching Devices for Return the Network to its Normal Operating Configuration
All the switching operations have
been done?
YES NO
B
Module 22 Evaluate the Impacts of the Contingency on the
Customers
Module 13 Reconfigure the Network for the Next Switching Operation and Evaluate the Reaction of
Autonomous System
Module 13 Reconfigure the Network for the Next Switching Operation and Evaluate the Reaction of
Autonomous System
Module 21 Find the Optimal Switching Sequences for Return to Normal Operating Status

Page 39
6 STUDY RESULTS
A powerful software package designated as “Smart Grid Simulator” was developed for realizing
the reliability evaluation procedure proposed in this thesis. In this chapter, the results of various
reliability case studies that have been conducted by the developed software are presented and
discussed. Various failure modes of each component of the electricity distribution network under
study are simulated in this software. For each failure mode, the detailed reactions of implemented
smart grid technologies and their impacts on the different stages of the fault management activities
are evaluated. As a result, the time periods required for accomplishing each step of the fault
management activities and manners in which different load points have been affected are
determined. Based on these outcomes, the software calculates the load points and system oriented
reliability indices. The software can also predict the reliability impacts of voltage sags generated at
higher voltage levels (sub-transmission and transmission networks) but propagated into the
distribution system under study.
6.1 Test Systems Data and Analysis Assumptions
A typical Finnish 20 kV urban distribution network is used as a distribution test network for
quantitative reliability case studies concerned in this thesis. The basic data related to the distribution
test network can be found in Appendixes I, II and III. The single-line diagram of this distribution
test network and its overall data are shown in Figure 3 and Table 1, respectively. There are 144
distribution substations (20/0.4 kV) in the distribution test network, which are supplied through 6
underground cable feeders originated from one sub-transmission substation. The average load factor
and the average power factor for distribution substations are assumed to be 73% and 95%,
respectively. Two 110/20 kV transformers each with rating 16 MVA and short circuit impedance of
10% supply this network through two incoming 110 kV feeders. The substation configuration at
110 kV level is H-connection and at 20 kV level is single-busbar. To limit the short circuit level in
20 kV level, the 20 kV switchgears are arranged to split the 20 kV busbar such that feeders 1, 2 and
3 are supplied by the first transformer and feeders 4, 5 and 6 are supplied by the second transformer.
A typical Finnish 110 kV sub-transmission network is also used in this thesis as a sub-
transmission test network for simulating the voltage sags which propagate through sub-transmission
network into the distribution test network. The single line diagram of this sub-transmission test
network is shown in Figure 4. The sub-transmission test network consists of 24 substations, 19

Page 40
underground cable circuits and 23 overhead line sections. The basic data of the overhead lines and
the underground cables of the sub-transmission test network can be found in Appendixes IV and V.
It should be mentioned that the above described test networks have been taken from different
areas of Finland. The components reliability data for the distribution test network and the sub-
transmission test network are assumed according to Table 2.
Figure 3. Single-line diagram of a typical Finnish 20 kV urban distribution network which is used as a distribution test network.
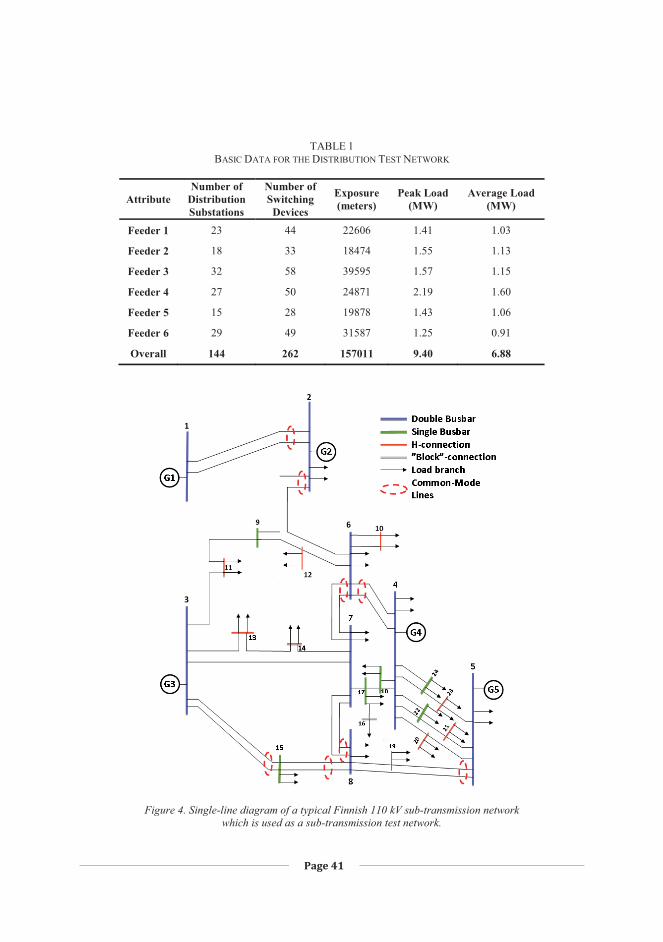
Page 41
TABLE 1 BASIC DATA FOR THE DISTRIBUTION TEST NETWORK
Attribute Number of
Distribution Substations
Number of Switching
Devices
Exposure (meters)
Peak Load (MW)
Average Load (MW)
Feeder 1 23 44 22606 1.41 1.03
Feeder 2 18 33 18474 1.55 1.13
Feeder 3 32 58 39595 1.57 1.15
Feeder 4 27 50 24871 2.19 1.60
Feeder 5 15 28 19878 1.43 1.06
Feeder 6 29 49 31587 1.25 0.91
Overall 144 262 157011 9.40 6.88
Figure 4. Single-line diagram of a typical Finnish 110 kV sub-transmission network which is used as a sub-transmission test network.

Page 42
TABLE 2 COMPONENT RELIABILITY DATA FOR THE DISTRIBUTION TEST NETWORK
AND THE SUB-TRANSMISSION TEST NETWORK
Component Total Failure Rate Actual Repair or Replacement Time (hours)
110 kV Overhead Lines 0.0218 occ/km-a 48
110 kV Underground Cables 0.001 occ/km-a 336
110/20 kV Transformers 0.023 occ/a 300
110 kV Circuit Breakers 0.00336 occ/a 100
110 kV Busbars 0.0068 occ/a 200
20 kV Underground Cables 0.006 occ/km-a 6
20/0.4 kV Transformers 0.001 occ/a 10
The following basic assumptions are also considered when evaluating the impact of voltage sags
on the customers:
- The share of different fault types at 110 kV and 20 kV levels are taken from [149, 150] as shown
in Table 3.
- The conventional distance relays are used for the protection of the 110 kV overhead lines. The
zone 1 covers 80% of the line length and zone 2 covers the whole length of the line length. The
fault clearing times for faults located in the zone 1 and zone 2 are assumed to be 4 and 20 cycles,
respectively.
- The pilot protection scheme is used for the 110kV underground cable circuits. In this situation, the
fault clearing time for all the faults along an underground cable circuit is assumed to be 4 cycles.
- The fault clearing time for a fault within the 110/20 kV substation (e.g. busbar and circuit
breakers) is assumed to be 5 cycles.
- The fault clearing times for faults on the components of the distribution test network are
determined by the fault type, fault location and also the characteristics of protection devices
implemented in the test network. The feeder circuit breakers are equipped with an over-current
relay with an extremely inverse time-current characteristic for short circuit faults and sensitive earth
fault relay for phase to ground faults. The distribution transformers are protected against the short
circuit faults by means of switch fuses equipped with K-speed fuse links rated according to the size
of the transformers. The feeder circuit breaker operates for the single-phase to ground faults.
- The winding connections of the 110/20 kV transformers and the 20/0.4 kV distribution service
transformers are assumed to be Yy0 and Dyn11, respectively.
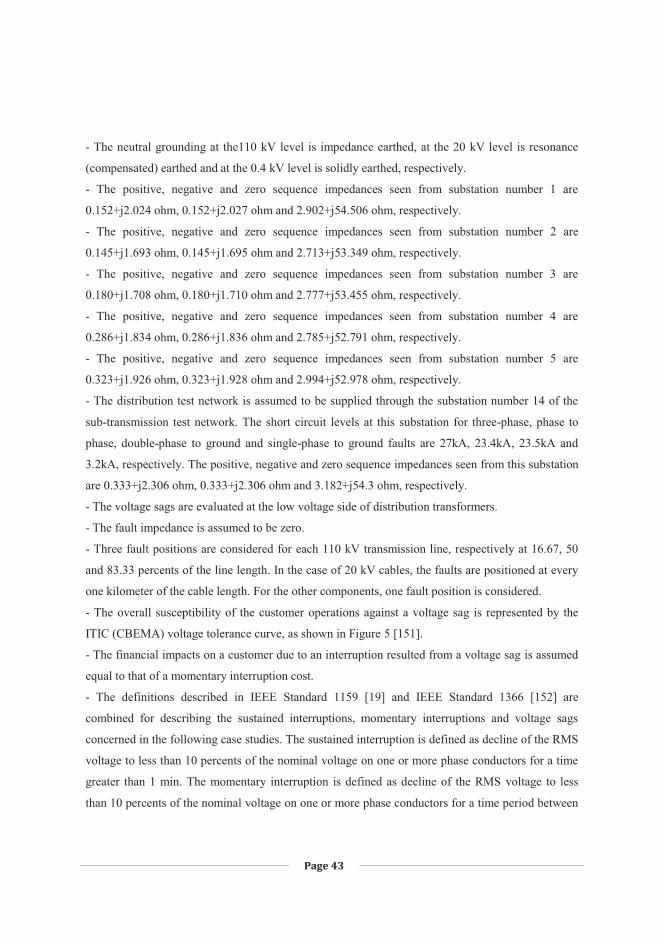
Page 43
- The neutral grounding at the110 kV level is impedance earthed, at the 20 kV level is resonance
(compensated) earthed and at the 0.4 kV level is solidly earthed, respectively.
- The positive, negative and zero sequence impedances seen from substation number 1 are
0.152+j2.024 ohm, 0.152+j2.027 ohm and 2.902+j54.506 ohm, respectively.
- The positive, negative and zero sequence impedances seen from substation number 2 are
0.145+j1.693 ohm, 0.145+j1.695 ohm and 2.713+j53.349 ohm, respectively.
- The positive, negative and zero sequence impedances seen from substation number 3 are
0.180+j1.708 ohm, 0.180+j1.710 ohm and 2.777+j53.455 ohm, respectively.
- The positive, negative and zero sequence impedances seen from substation number 4 are
0.286+j1.834 ohm, 0.286+j1.836 ohm and 2.785+j52.791 ohm, respectively.
- The positive, negative and zero sequence impedances seen from substation number 5 are
0.323+j1.926 ohm, 0.323+j1.928 ohm and 2.994+j52.978 ohm, respectively.
- The distribution test network is assumed to be supplied through the substation number 14 of the
sub-transmission test network. The short circuit levels at this substation for three-phase, phase to
phase, double-phase to ground and single-phase to ground faults are 27kA, 23.4kA, 23.5kA and
3.2kA, respectively. The positive, negative and zero sequence impedances seen from this substation
are 0.333+j2.306 ohm, 0.333+j2.306 ohm and 3.182+j54.3 ohm, respectively.
- The voltage sags are evaluated at the low voltage side of distribution transformers.
- The fault impedance is assumed to be zero.
- Three fault positions are considered for each 110 kV transmission line, respectively at 16.67, 50
and 83.33 percents of the line length. In the case of 20 kV cables, the faults are positioned at every
one kilometer of the cable length. For the other components, one fault position is considered.
- The overall susceptibility of the customer operations against a voltage sag is represented by the
ITIC (CBEMA) voltage tolerance curve, as shown in Figure 5 [151].
- The financial impacts on a customer due to an interruption resulted from a voltage sag is assumed
equal to that of a momentary interruption cost.
- The definitions described in IEEE Standard 1159 [19] and IEEE Standard 1366 [152] are
combined for describing the sustained interruptions, momentary interruptions and voltage sags
concerned in the following case studies. The sustained interruption is defined as decline of the RMS
voltage to less than 10 percents of the nominal voltage on one or more phase conductors for a time
greater than 1 min. The momentary interruption is defined as decline of the RMS voltage to less
than 10 percents of the nominal voltage on one or more phase conductors for a time period between

Page 44
0.5 cycles and 1 minute. The voltage sag is defined as the decrease in the RMS voltage between 10
to 90 percents of the nominal voltage for durations from 0.5 cycles to 1 minute.
- The common phase aggregation method described in IEEE Standard 493 [153] is used for
evaluating the three-phase voltage sags. In this method, a three-phase voltage sag is represented by
a single individual event. The lowest voltage among the three phases is considered as the voltage
sag magnitude and the sag duration is reported as the time until all three phase voltages have
recovered above 90 percents of the nominal voltage.
- A five-minute aggregation window is used for evaluating the multiple voltage sags. In this
condition, starting from the event initiation time, only one voltage sag is reported during this five-
minute period which is corresponding to the most severe voltage sag among multiple events. The
same aggregation window is used for evaluating the momentary interruption.
TABLE 3
SHARE OF DIFFERENT FAULT TYPES AT 110 KV AND 20 KV LEVELS [149, 150], IN PERCENTS
Voltage Level Phase to Ground Faults
Phase to Phase Faults
Double-Phase to Ground Faults
Three-Phase Faults
110 kV 81 3 14 2
20 kV 50 9 24 17
Figure 5. ITIC (CBEMA) voltage tolerance curve [151]

Page 45
6.2 Comparative Case Studies
In order to compare the impacts of the identified smart grid technologies on the reliability
performance of the distribution test network various case studies have been conducted. Obviously,
any feasible set of the identified technologies can be evaluated as a specific case study. However, to
limit the number of case studies, based on the engineering judgments, only some potential
combinations of these technologies are selected for presenting in this thesis. An integrating
approach is used for dealing with these technologies. The ultimate goal in this approach is to
provide a premium electricity service for the customers of the distribution test network. The studies
are started from a benchmark case study. Then, in the next case studies, a suitable smart grid
technology is integrated to the last upgraded case study. This sequential approach is ended up when
all the targeted smart grid technologies have been involved in the base case study.
6.2.1 Case Study 1: Base Case
The base case study aims to show the reliability performance of the distribution test network
when it is manually operated. In this situation, the operation of protective devices for a fault within
the 110/20 kV substation (e.g. transformer or circuit breaker failures) results in the power
interruptions for half or all of the distribution feeders. After notifying the outage condition by the
control center operators, the local operators of the 110/20 kV substation are committed to isolate the
failed component and restore the power service for as many as possible of the feeders through
appropriate switching actions. Otherwise, the failed component should be repaired or replaced
before the power could be restored. For a failure condition on a component of distribution feeders
(e.g. an underground cable section or a distribution transformer), either a feeder circuit breaker or a
distribution transformer protection operates. This usually leads to a power interruption for a group
of customers and a voltage sag for others. Then, the power interruptions are notified by the control
center operators through outage calls received from the customers or the local operators of the
110/20 kV substation. Next, the repair crews are sent to the outage area. When a feeder circuit
breaker operates due to a component failure, usually there is no information which section of the
feeder might be failed. In circumstances like this, the repair crews halve the downstream sections of
the operated circuit breaker by opening a suitable switching device. Then the feeder circuit breaker
is committed to be reclosed to determine whether the fault is located upstream of the opened
switching device or vice-versa. This trial-and-error process is repeated until the faulted section is
found. Then, the faulted section is isolated and the power service is restored for other healthy

Page 46
sections of the network through the proper manual switching operations. By the time these tasks are
accomplished, the precise fault location and the repair or replacement activities are carried out.
Finally, the network is returned to its normal operating status.
The basic data related to the fault management activities for the above described case study are
assumed according to Table 4. Typical data provided in this table, and similar tables that come later
for other case studies, are based on the engineering judgments, the characteristics of the
implemented smart grid technologies and also consulting with some experts in this area.
The system oriented reliability indices for the base case study are represented in Table 5. The
load point reliability indices are shown in Figures 6-13. The distributions of expected momentary
interruptions and voltage sags imposed on the customers of the distribution test network are also
shown in Figures 14-17.
The study results for the base case study indicate a large variation in the reliability indices
associated with sustained interruptions and moderate variation in the reliability indices associated
with momentary interruptions and voltage sags. When conducting trial and error switching activities
for faulted zone location, some of the customers are affected several times for the same fault. As the
switching operations are carried out manually and in time periods much longer than the aggregation
window for recording the momentary events (5 minutes); several sustained interruptions are
experienced by the customers. Therefore, parameters such as the network configuration, location of
switching devices, fault location and also trial and error switching strategy of the electric utility
result in more frequent sustained interruptions for some of the customers. However, examining the
distributions of momentary interruptions and voltage sags indicate the majority of momentary
interruptions and severe voltage sags (remaining voltage less than 70 percents of the nominal
voltage) are arising from faults within the high voltage network rather than the local medium
voltage network. The momentary interruptions and voltage sags which propagated through the high
voltage network affect all the customers of the distribution test network. Therefore, the reliability
indices associated with the momentary interruptions and voltage sags have much less variation
among different customers compared to those of sustained interruptions.
The short circuit faults close to the main substation result in the remaining voltage less than the
threshold of momentary interruptions (10 percent of the nominal voltage) and appear as momentary
interruptions to the customers. As the frequency of such faults is very low, the momentary
interruptions experienced by the customers are low as well.
The study results also indicate that the frequency of severe voltage sags is about 1.44 times of
that of sustained interruptions. However, the cost associated with severe voltage sags is about 15

Page 47
percents of the cost associated with sustained interruptions. This is because, for majority of
customers available in the distribution test network, the cost associated with a severe voltage sag
event is far less than that of a sustained interruption.
The term “repair crew burden” in Table 5 shows the sum of hours that the utility repair crews
spend annually for conducting various fault management activities.
TABLE 4
BASIC DATA RELATED TO THE FAULT MANAGEMENT ACTIVITIES IN CASE STUDY 1
Average time required for fault notification (s) 300
Average time required for approximate fault location (s) 600
Average time required for decision making about fault management activities (s) 600
Average time required for dispatching the repair crews (s) 300
Average speed of the repair crews for traveling to the faulted area (km/h) 40
Average time required for precise fault location on an underground cable section including both pre-location and pinpointing activities (s) 1800
Average time required for manual operation of switching devices involved in fault management activities (s) 180
Available teams of repair crews for performing fault management activities 2
TABLE 5 SYSTEM ORIENTED RELIABILITY INDICES FOR CASE STUDY 1
SAIFI (int/sub-a) 0.8444
SAIDI (h/sub-a) 0.8030
MAIFI (eve/sub-a) 0.0746
AVSSI (eve/sub-a) 1.2155
ASUI (%) 0.009169
EENS (kWh/a) 5120
ECOSTSI (€/a) 139926
ECOSTMI (€/a) 1291
ECOSTVS (€/a) 21079
Total Cost (€/a) 162296
Repair Crew Burden (h/a) 80.40

Page 48
Figure 6. Annual expected frequency of sustained interruptions for distribution substations of the distribution test network, (Case Study 1)
Figure 7. Annual expected duration of sustained interruptions for distribution substations of the distribution test network, (Case Study 1)
0.00
0.20
0.40
0.60
0.80
1.00
1.20
1.40
1.601 5 9 13 17 21 25 29 33 37 41 45 49 53 57 61 65 69 73 77 81 85 89 93 97 101
105
109
113
117
121
125
129
133
137
141
Inte
rrup
tion
Freq
uenc
y (in
t/a)
Distribution Substation Number
0.00
0.20
0.40
0.60
0.80
1.00
1.20
1.40
1 5 9 13 17 21 25 29 33 37 41 45 49 53 57 61 65 69 73 77 81 85 89 93 97 101
105
109
113
117
121
125
129
133
137
141
Inte
rrup
tion
Dur
atio
n (h
/a)
Distribution Substation Number
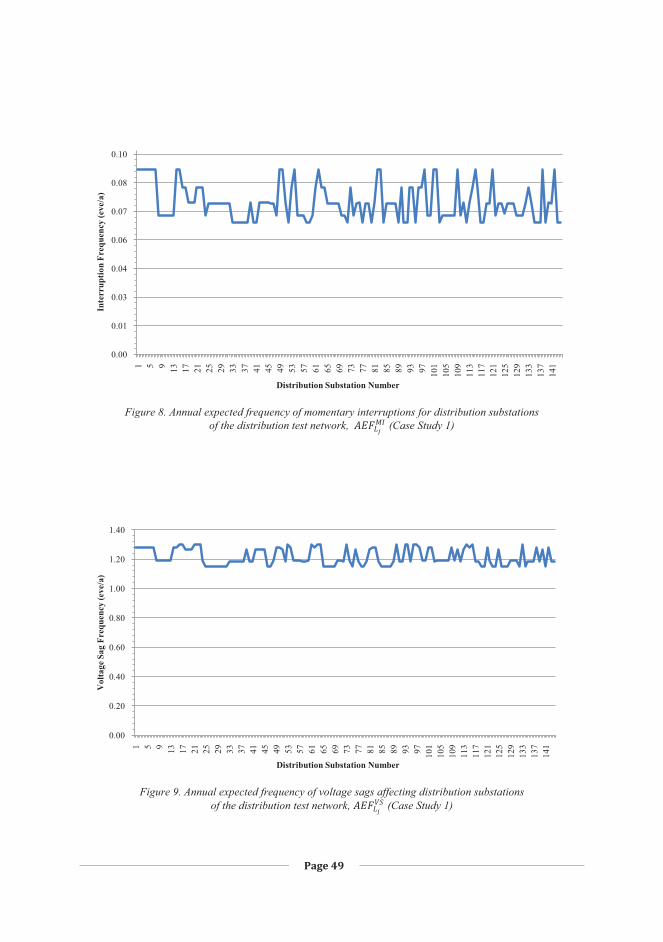
Page 49
Figure 8. Annual expected frequency of momentary interruptions for distribution substations of the distribution test network, (Case Study 1)
Figure 9. Annual expected frequency of voltage sags affecting distribution substations of the distribution test network, (Case Study 1)
0.00
0.01
0.03
0.04
0.06
0.07
0.08
0.10
1 5 9 13 17 21 25 29 33 37 41 45 49 53 57 61 65 69 73 77 81 85 89 93 97 101
105
109
113
117
121
125
129
133
137
141
Inte
rrup
tion
Freq
uenc
y (e
ve/a
)
Distribution Substation Number
0.00
0.20
0.40
0.60
0.80
1.00
1.20
1.40
1 5 9 13 17 21 25 29 33 37 41 45 49 53 57 61 65 69 73 77 81 85 89 93 97 101
105
109
113
117
121
125
129
133
137
141
Vol
tage
Sag
Fre
quen
cy (e
ve/a
)
Distribution Substation Number

Page 50
Figure 10. Annual expected energy not supplied for distribution substations of the distribution test network, (Case Study 1)
Figure 11. Annual expected cost arising from sustained interruptions for distribution substations of the distribution test network, (Case Study 1)
0
50
100
150
200
2501 5 9 13 17 21 25 29 33 37 41 45 49 53 57 61 65 69 73 77 81 85 89 93 97 101
105
109
113
117
121
125
129
133
137
141
Ene
rgy
Not
Sup
plie
d (k
Wh/
a)
Distribution Substation Number
0
750
1500
2250
3000
3750
4500
5250
1 5 9 13 17 21 25 29 33 37 41 45 49 53 57 61 65 69 73 77 81 85 89 93 97 101
105
109
113
117
121
125
129
133
137
141
Ann
ual C
ost (
€/a)
Distribution Substation Number

Page 51
Figure 12. Annual expected cost arising from momentary interruptions for distribution substations of the distribution test network, (Case Study 1)
Figure 13. Annual expected cost arising from voltage sags for distribution substations of the distribution test network, (Case Study 1)
0
15
30
45
60
751 5 9 13 17 21 25 29 33 37 41 45 49 53 57 61 65 69 73 77 81 85 89 93 97 101
105
109
113
117
121
125
129
133
137
141
Ann
ual C
ost (
€/a)
Distribution Substation Number
0
200
400
600
800
1000
1200
1400
1 5 9 13 17 21 25 29 33 37 41 45 49 53 57 61 65 69 73 77 81 85 89 93 97 101
105
109
113
117
121
125
129
133
137
141
Ann
ual C
ost (
€/a)
Distribution Substation Number

Page 52
Figure 14. Density distribution of the expected voltage variation events, due to the faults
originated from the distribution test network (Case Study 1)
Figure 15. Density distribution of the expected voltage variation events, due to the faults
originated from the sub-transmission test network (Case Study 1)
.01 - .04 s
.1 - .15 s
.2 - .4 s
.6 - .8 s1 - 60 s
0.00
0.02
0.04
0.06
0.08
0.10
80 -90%
70 -80%
60 -70%
50 -60%
40 -50%
30 -40%
20 -30%
10 -20%
0 -10%
Duration
Eve
nt F
requ
ency
(occ
/a)
Remaining Voltage
.01 - .04 s
.1 - .15 s
.2 - .4 s
.6 - .8 s
1 - 60 s
0.00
0.03
0.06
0.09
0.12
0.15
0.18
80 -90%
70 -80%
60 -70%
50 -60%
40 -50%
30 -40%
20 -30%
10 -20%
0 -10%
Duration
Eve
nt F
requ
ency
(occ
/a)
Remaining Voltage
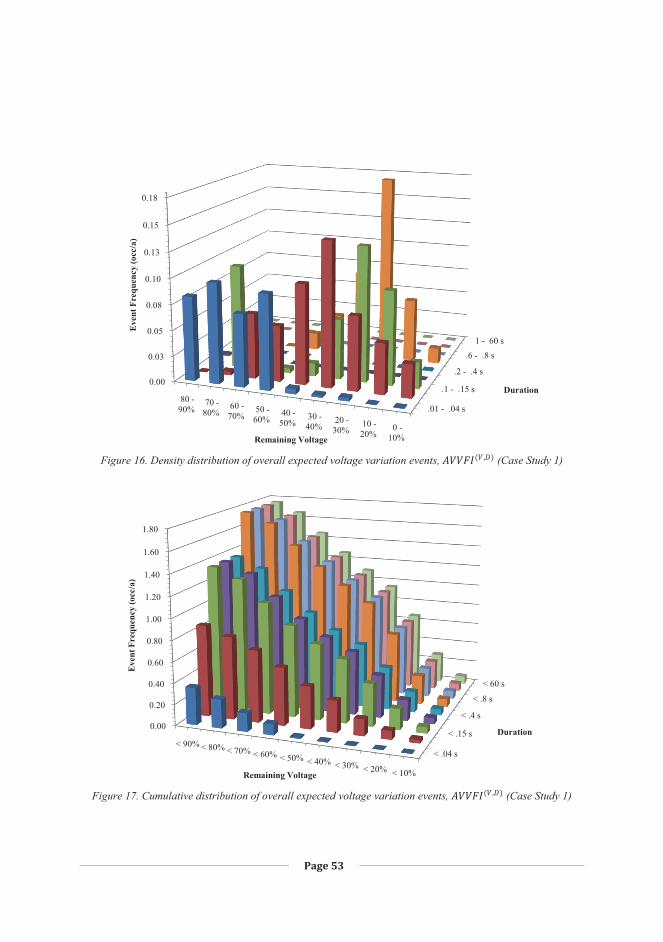
Page 53
Figure 16. Density distribution of overall expected voltage variation events, (Case Study 1)
Figure 17. Cumulative distribution of overall expected voltage variation events, (Case Study 1)
.01 - .04 s
.1 - .15 s
.2 - .4 s
.6 - .8 s1 - 60 s
0.00
0.03
0.05
0.08
0.10
0.13
0.15
0.18
80 -90%
70 -80%
60 -70%
50 -60%
40 -50%
30 -40%
20 -30%
10 -20%
0 -10%
Duration
Eve
nt F
requ
ency
(occ
/a)
Remaining Voltage
< .04 s
< .15 s
< .4 s
< .8 s
< 60 s
0.00
0.20
0.40
0.60
0.80
1.00
1.20
1.40
1.60
1.80
< 90% < 80% < 70% < 60% < 50% < 40% < 30% < 20% < 10%
Duration
Eve
nt F
requ
ency
(occ
/a)
Remaining Voltage

Page 54
6.2.2 Case Study 2: Integrating Distance to Fault Estimators
This case study aims to show the reliability performance of the distribution test network when
distance to fault estimators are employed at the 110/20 kV substation for estimating the fault
location as a distance from the substation to the fault. In this case study, it is assumed that the data
retrieving from these devices requires the intervention of the local operators of the 110/20 kV
substation. The basic data related to the fault management activities for this case study are assumed
similar to the Case Study 1 (Table 4).
The system oriented reliability indices for this case study are represented in Table 6. The load
point reliability indices are shown in Figures 18-25. The distributions of expected momentary
interruptions and voltage sags imposed on the customers of the distribution test network are shown
in Figures 26 and 27.
The study results show virtually all the reliability indices have been improved compared to the
base case study. The degree of improvements ranges from 16 to 39 percents. Actually, by using the
distance to fault estimators, a much smaller zone of the electricity distribution test network is
required to be inspected by the repair crews in search for location and isolation of the fault and
restore service to the affected customers. Hence, much less trial and error switching actions are
required to find the faulted section. Therefore, both the frequency and duration of sustained
interruptions imposed on the customers are reduced in this condition.
The study results also show that the reliability indices associated with the momentary
interruptions and voltage sags have been improvement when employing the distance to fault
estimators. The implemented smart grid technologies have no impact on the momentary
interruptions and voltage sags arising from the faults within the high voltage network. Therefore,
the improvements appeared in the reliability indices associated with the momentary interruptions
and voltage sags are solely due to decrease in the trial and error switching activities required for
fault location purposes.
The study results also indicate that the variation of reliability indices among different customers
has been much reduced compared to those of the base case study (Case Study 1).
The results presented in Table 6 show that the burden on the utility crews are also reduced when
employing the distance to the fault estimators. This is because much less field activities are required
to find the faulted section compared to the base case study.
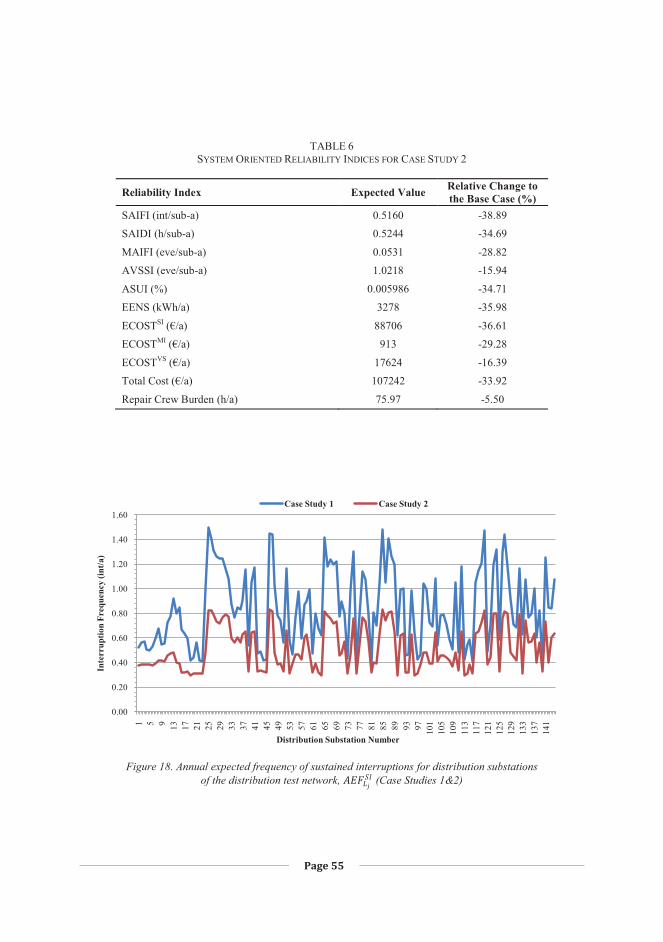
Page 55
TABLE 6 SYSTEM ORIENTED RELIABILITY INDICES FOR CASE STUDY 2
Reliability Index Expected Value Relative Change to the Base Case (%)
SAIFI (int/sub-a) 0.5160 -38.89
SAIDI (h/sub-a) 0.5244 -34.69
MAIFI (eve/sub-a) 0.0531 -28.82
AVSSI (eve/sub-a) 1.0218 -15.94
ASUI (%) 0.005986 -34.71
EENS (kWh/a) 3278 -35.98
ECOSTSI (€/a) 88706 -36.61
ECOSTMI (€/a) 913 -29.28
ECOSTVS (€/a) 17624 -16.39
Total Cost (€/a) 107242 -33.92
Repair Crew Burden (h/a) 75.97 -5.50
Figure 18. Annual expected frequency of sustained interruptions for distribution substations of the distribution test network, (Case Studies 1&2)
0.00
0.20
0.40
0.60
0.80
1.00
1.20
1.40
1.60
1 5 9 13 17 21 25 29 33 37 41 45 49 53 57 61 65 69 73 77 81 85 89 93 97 101
105
109
113
117
121
125
129
133
137
141
Inte
rrup
tion
Freq
uenc
y (in
t/a)
Distribution Substation Number
Case Study 1 Case Study 2

Page 56
Figure 19. Annual expected duration of sustained interruptions for distribution substations of the distribution test network, (Case Studies 1&2)
Figure 20. Annual expected frequency of momentary interruptions for distribution substations of the distribution test network, (Case Studies 1&2)
0.00
0.20
0.40
0.60
0.80
1.00
1.20
1.40
1 5 9 13 17 21 25 29 33 37 41 45 49 53 57 61 65 69 73 77 81 85 89 93 97 101
105
109
113
117
121
125
129
133
137
141
Inte
rrup
tion
Dur
atio
n (h
/a)
Distribution Substation Number
Case Study 1 Case Study 2
0.00
0.01
0.03
0.04
0.06
0.07
0.08
0.10
1 5 9 13 17 21 25 29 33 37 41 45 49 53 57 61 65 69 73 77 81 85 89 93 97 101
105
109
113
117
121
125
129
133
137
141
Inte
rrup
tion
Freq
uenc
y (e
ve/a
)
Distribution Substation Number
Case Study 1 Case Study 2

Page 57
Figure 21. Annual expected frequency of voltage sags affecting distribution substations of the distribution test network, (Case Studies 1&2)
Figure 22. Annual expected energy not supplied for distribution substations of the distribution test network, (Case Studies 1&2)
0.00
0.20
0.40
0.60
0.80
1.00
1.20
1.40
1 5 9 13 17 21 25 29 33 37 41 45 49 53 57 61 65 69 73 77 81 85 89 93 97 101
105
109
113
117
121
125
129
133
137
141
Vol
tage
Sag
Fre
quen
cy (e
ve/a
)
Distribution Substation Number
Case Study 1 Case Study 2
0
50
100
150
200
250
1 5 9 13 17 21 25 29 33 37 41 45 49 53 57 61 65 69 73 77 81 85 89 93 97 101
105
109
113
117
121
125
129
133
137
141
Ene
rgy
Not
Sup
plie
d (k
Wh/
a)
Distribution Substation Number
Case Study 1 Case Study 2

Page 58
Figure 23. Annual expected cost arising from sustained interruptions for distribution substations of the distribution test network, (Case Studies 1 &2)
Figure 24. Annual expected cost arising from momentary interruptions for distribution substations of the distribution test network, (Case Studies 1 &2)
0
750
1500
2250
3000
3750
4500
5250
1 5 9 13 17 21 25 29 33 37 41 45 49 53 57 61 65 69 73 77 81 85 89 93 97 101
105
109
113
117
121
125
129
133
137
141
Ann
ual C
ost (
€/a)
Distribution Substation Number
Case Study 1 Case Study 2
0
15
30
45
60
75
1 5 9 13 17 21 25 29 33 37 41 45 49 53 57 61 65 69 73 77 81 85 89 93 97 101
105
109
113
117
121
125
129
133
137
141
Ann
ual C
ost (
€/a)
Distribution Substation Number
Case Study 1 Case Study 2

Page 59
Figure 25. Annual expected cost arising from voltage sags for distribution substations of the distribution test network, (Case Studies 1 &2)
Figure 26. Density distribution of overall expected voltage variation events, (Case Study 2)
0
200
400
600
800
1000
1200
1400
1 5 9 13 17 21 25 29 33 37 41 45 49 53 57 61 65 69 73 77 81 85 89 93 97 101
105
109
113
117
121
125
129
133
137
141
Ann
ual C
ost (
€/a)
Distribution Substation Number
Case Study 1 Case Study 2
.01 - .04 s
.1 - .15 s
.2 - .4 s
.6 - .8 s1 - 60 s
0.00
0.03
0.05
0.08
0.10
0.13
0.15
0.18
80 -90%
70 -80%
60 -70%
50 -60%
40 -50%
30 -40%
20 -30%
10 -20%
0 -10%
Duration
Eve
nt F
requ
ency
(occ
/a)
Remaining Voltage

Page 60
Figure 27. Cumulative distribution of overall expected voltage variation events, (Case Study 2)
6.2.3 Case Study 3: Integrating Fault Passage Indicators
Examination of the distribution test network shows that the majority of the distribution feeders
have multiple taps. When a feeder has multiple taps, there might be several probable fault locations
for the fault distance indicated by the distance to fault estimators employed in the Case Study 2. In
this circumstance, the repair crews are unable to determine which tap to follow to find the location
of the fault. Therefore, they need to perform trial and error switching actions to find the right tap
that contains the faulted section, which deteriorates the service reliability. However, applying fault
passage indicators together with distance to fault estimators can overcome this issue. This case
study aims to show the reliability performance of the distribution test network when the fault
passage indicators are used along the distribution feeders together with the distance to fault
estimators. The basic data related to the fault management activities for this case study are assumed
similar to the Case Studies 1 and 2 (Table 4). In addition, it is assumed that the average time
required for reading the status of a set of fault passage indicators is 5 minutes per each visited
distribution substation.
The system oriented reliability indices for this case study are represented in Table 7. The load
point reliability indices that differ from those of the Case Study 2 are shown in Figures 28-33. The
< .04 s
< .15 s
< .4 s
< .8 s
< 60 s
0.00
0.20
0.40
0.60
0.80
1.00
1.20
1.40
1.60
< 90% < 80% < 70% < 60% < 50% < 40% < 30% < 20% < 10%
Duration
Eve
nt F
requ
ency
(occ
/a)
Remaining Voltage

Page 61
distributions of expected momentary interruptions and voltage sags imposed on the customers of the
distribution test network are shown in Figures 34 and 35.
The study results show that virtually all the reliability indices have been improved compared to
the base case study. The results presented in Table 7 also show that the rates of sustained
interruptions and severe voltage sags have been decreased when the fault passage indicators are
used with the distance to fault estimators. However, the average duration of sustained interruptions
are slightly increased as the repair crews may have to visit more distribution substations to read the
status of the fault passage indicators. Instead, the less trial and error switching actions are required
to find the faulted section compared to the Case Studies 1 and 2. As a result, the frequency and
financial impacts on the customers due to voltage sags are decreased in this case study compared to
those of the Case Studies 1 and 2.
The study results also show that the reliability indices associated with the momentary
interruptions have not been improvement compared to those of the Case Study 2. Actually, the
origin of momentary interruptions is the short circuit faults close to the 110/20 kV substation. The
implemented smart grid technologies in the Case Studies 2 and 3 have no mitigation on the
momentary interruptions arising from the faults within the high voltage network. In addition, the
first few kilometers of the feeders outgoing from the 110/20 kV substation have no or few taps. The
short circuit faults within these short distances almost cause momentary interruptions for the
customers connected to the neighboring feeders. However, when employing the distance to fault
estimators, the faulted zone can be identified for these short distances. Therefore, applying the fault
passage indicators do not provide further information for locating the faults close to the 110/20 kV
substation. Hence, as the study results show, there is no improvement in the reliability indices
associated with the momentary interruptions compared to those of the Case Study 2.
The study results also indicate that the variation of reliability indices among different customers
has been much reduced compared to those of the Case Studies 1 and 2.
The results presented in Table 7 also show that the burden on the utility crews is the same as that
of the Case Study 2. This is because, when employing the fault passage indicators, the repair crews
have to visit more distribution substations to read the status of the fault passage indicators. The
overall time required for accomplishing the activities involved in this process is virtually about the
same of that of previous trial and error switching activities involved in the Case Study 2. Therefore,
the burden on the utility crews is almost the same for Case Studies 2 and 3.

Page 62
TABLE 7 SYSTEM ORIENTED RELIABILITY INDICES FOR CASE STUDY 3
Reliability Index Expected Value Relative
Change to Case Study 2 (%)
Relative Change to the Base Case (%)
SAIFI (int/sub-a) 0.3285 -36.34 -61.10
SAIDI (h/sub-a) 0.5401 +2.99 -32.74
MAIFI (eve/sub-a) 0.0531 0.00 -28.82
AVSSI (eve/sub-a) 0.9777 -4.32 -19.56
ASUI (%) 0.006166 +3.01 -32.75
EENS (kWh/a) 3400 +3.72 -33.59
ECOSTSI (€/a) 88965 +0.29 -36.42
ECOSTMI (€/a) 913 0.00 -29.28
ECOSTVS (€/a) 16850 -4.39 -20.06
Total Cost (€/a) 106728 -0.48 -34.24
Repair Crew Burden (h/a) 75.97 0.00 -5.50
Figure 28. Annual expected frequency of sustained interruptions for distribution substations of the distribution test network, (Case Studies 1, 2&3)
0.00
0.20
0.40
0.60
0.80
1.00
1.20
1.40
1.60
1 5 9 13 17 21 25 29 33 37 41 45 49 53 57 61 65 69 73 77 81 85 89 93 97 101
105
109
113
117
121
125
129
133
137
141
Inte
rrup
tion
Freq
uenc
y (in
t/a)
Distribution Substation Number
Case Study 1 Case Study 2 Case Study 3

Page 63
Figure 29. Annual expected duration of sustained interruptions for distribution substations of the distribution test network, (Case Studies 1, 2&3)
Figure 30. Annual expected frequency of voltage sags affecting distribution substations of the distribution test network, (Case Studies 1, 2&3)
0.00
0.20
0.40
0.60
0.80
1.00
1.20
1.40
1 5 9 13 17 21 25 29 33 37 41 45 49 53 57 61 65 69 73 77 81 85 89 93 97 101
105
109
113
117
121
125
129
133
137
141
Inte
rrup
tion
Dur
atio
n (h
/a)
Distribution Substation Number
Case Study 1 Case Study 2 Case Study 3
0.00
0.20
0.40
0.60
0.80
1.00
1.20
1.40
1 5 9 13 17 21 25 29 33 37 41 45 49 53 57 61 65 69 73 77 81 85 89 93 97 101
105
109
113
117
121
125
129
133
137
141
Vol
tage
Sag
Fre
quen
cy (e
ve/a
)
Distribution Substation Number
Case Study 1 Case Study 2 Case Study 3
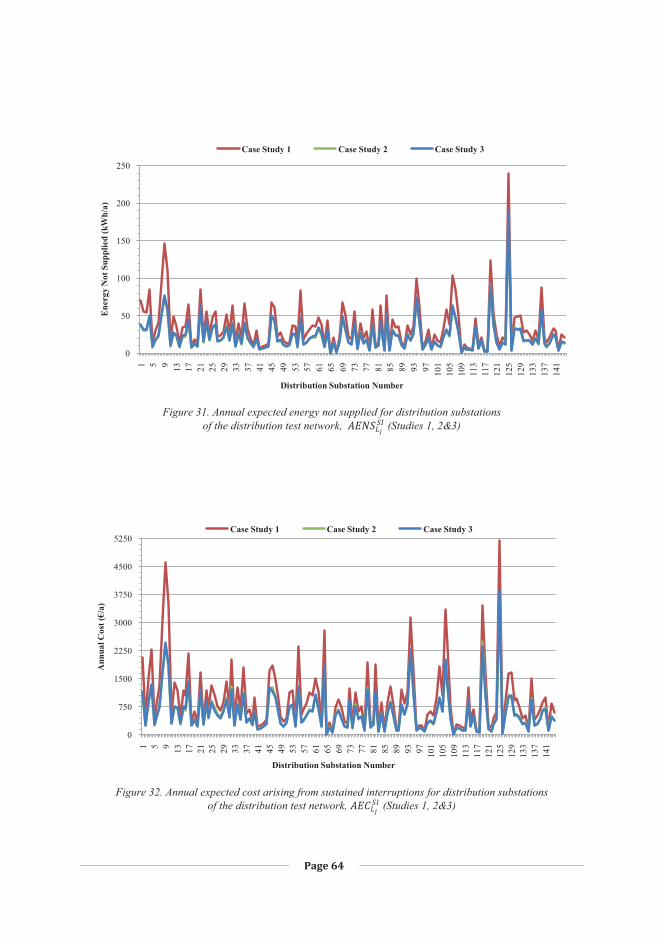
Page 64
Figure 31. Annual expected energy not supplied for distribution substations of the distribution test network, (Studies 1, 2&3)
Figure 32. Annual expected cost arising from sustained interruptions for distribution substations of the distribution test network, (Studies 1, 2&3)
0
50
100
150
200
250
1 5 9 13 17 21 25 29 33 37 41 45 49 53 57 61 65 69 73 77 81 85 89 93 97 101
105
109
113
117
121
125
129
133
137
141
Ene
rgy
Not
Sup
plie
d (k
Wh/
a)
Distribution Substation Number
Case Study 1 Case Study 2 Case Study 3
0
750
1500
2250
3000
3750
4500
5250
1 5 9 13 17 21 25 29 33 37 41 45 49 53 57 61 65 69 73 77 81 85 89 93 97 101
105
109
113
117
121
125
129
133
137
141
Ann
ual C
ost (
€/a)
Distribution Substation Number
Case Study 1 Case Study 2 Case Study 3

Page 65
Figure 33. Annual expected cost arising from voltage sags for distribution substations of the distribution test network, (Case Studies 1, 2&3)
Figure 34. Density distribution of overall expected voltage variation events, (Case Study 3)
0
200
400
600
800
1000
1200
1400
1 5 9 13 17 21 25 29 33 37 41 45 49 53 57 61 65 69 73 77 81 85 89 93 97 101
105
109
113
117
121
125
129
133
137
141
Ann
ual C
ost (
€/a)
Distribution Substation Number
Case Study 1 Case Study 2 Case Study 3
.01 - .04 s
.1 - .15 s
.2 - .4 s
.6 - .8 s1 - 60 s
0.00
0.03
0.05
0.08
0.10
0.13
0.15
0.18
80 -90%
70 -80%
60 -70%
50 -60%
40 -50%
30 -40%
20 -30%
10 -20%
0 -10%
Duration
Eve
nt F
requ
ency
(occ
/a)
Remaining Voltage

Page 66
Figure 35. Cumulative distribution of overall expected voltage variation events, (Case Study 3)
6.2.4 Case Study 4: Integrating Fault Locator Scheme
The smart grid technologies implemented through the Case Studies 2 and 3 can be replaced or
retrofitted to develop a fault locator scheme. These facilities can be arranged such that the fault
notification and location activities accomplish automatically. As an example, the status of fault
passage indicators installed along the distribution feeders can be retrieved over a communication
link. This data together with the outcome of the distance to fault estimators are then automatically
analyzed to find the fault location. Then, the control center operators and the utility repair crews are
automatically notified about the outage condition and the probable fault location.
This case study aims to evaluate the impact of the above described fault locator scheme on the
reliability performance of the distribution test network. In this situation, the basic data related to the
fault management activities are assumed according to Table 8.
The system oriented reliability indices for this case study are represented in Table 9. The load
point reliability indices that differ from those of the Case Study 3 are shown in Figures 36-38. The
distributions of expected momentary interruptions and voltage sags imposed on the customers of the
distribution test network are similar to those of the Case Study 3.
< .04 s
< .15 s
< .4 s
< .8 s
< 60 s
0.00
0.20
0.40
0.60
0.80
1.00
1.20
1.40
< 90% < 80% < 70% < 60% < 50% < 40% < 30% < 20% < 10%
Duration
Eve
nt F
requ
ency
(occ
/a)
Remaining Voltage

Page 67
The study results show that the durations of the sustained interruptions have been reduced
compared to the Case Study 3. As a result, the energy not supplied, service unavailability and also
the financial impacts of the sustained interruptions have also been reduced compared to those of the
Case Study 3.
The reliability indices corresponding to the momentary interruptions and voltage sags remain the
same as those of the Case Study 3. Actually, the fault locator scheme implemented in this case
study cannot further decrease the impact of voltage sags. This is because, in both Case Studies 3
and 4, all the faults can be located without the need for any trial and error switching activities. The
remaining voltage sags are either due to the impacts of the faults originated from the sub-
transmission network or the faults within the distribution test networks.
The study results also indicate that the variation of reliability indices among different customers
has been reduced again compared to those of the Case Studies 1, 2 and 3.
The results presented in Table 9 also show that the burdens on the utility crews are reduced
when employing the fault locator scheme. This is because much less field activities are required to
find the faulted section compared to the other case studies.
TABLE 8
BASIC DATA RELATED TO THE FAULT MANAGEMENT ACTIVITIES IN CASE STUDY 4
Average time required for fault notification (s) 60
Average time required for approximate fault location (s) 60
Average time required for decision making about fault management activities (s) 600
Average time required for dispatching the repair crews (s) 120
Average speed of the repair crews for traveling to the faulted area (km/h) 40
Average time required for precise fault location on an underground cable section including both pre-location and pinpointing activities (s) 1800
Average time required for manual operation of switching devices involved in fault management activities (s) 180
Available teams of repair crews for performing fault management activities 2

Page 68
TABLE 9 SYSTEM ORIENTED RELIABILITY INDICES FOR CASE STUDY 4
Reliability Index Expected Value Relative
Change to Case Study 3 (%)
Relative Change to the Base Case (%)
SAIFI (int/sub-a) 0.3285 0.00 -61.10 SAIDI (h/sub-a) 0.3027 -43.95 -62.30 MAIFI (eve/sub-a) 0.0531 0.00 -28.82 AVSSI (eve/sub-a) 0.9777 0.00 -19.56 ASUI (%) 0.003455 -43.97 -62.32 EENS (kWh/a) 1897 -44.21 -62.95 ECOSTSI (€/a) 51815 -41.76 -62.97 ECOSTMI (€/a) 913 0.00 -29.28 ECOSTVS (€/a) 16850 0.00 -20.06 Total Cost (€/a) 69578 -34.81 -57.13 Repair Crew Burden (h/a) 72.81 -4.16 -9.43
Figure 36. Annual expected duration of sustained interruptions for distribution substations of the distribution test network, (Case Studies 1, 3&4)
0.00
0.20
0.40
0.60
0.80
1.00
1.20
1.40
1 5 9 13 17 21 25 29 33 37 41 45 49 53 57 61 65 69 73 77 81 85 89 93 97 101
105
109
113
117
121
125
129
133
137
141
Inte
rrup
tion
Dur
atio
n (h
/a)
Distribution Substation Number
Case Study 1 Case Study 3 Case Study 4

Page 69
Figure 37. Annual expected energy not supplied for distribution substations of the distribution test network, (Studies 1, 3&4)
Figure 38. Annual expected cost arising from sustained interruptions for distribution substations of the distribution test network, (Studies 1, 3&4)
0
50
100
150
200
250
1 5 9 13 17 21 25 29 33 37 41 45 49 53 57 61 65 69 73 77 81 85 89 93 97 101
105
109
113
117
121
125
129
133
137
141
Ene
rgy
Not
Sup
plie
d (k
Wh/
a)
Distribution Substation Number
Case Study 1 Case Study 3 Case Study 4
0
750
1500
2250
3000
3750
4500
5250
1 5 9 13 17 21 25 29 33 37 41 45 49 53 57 61 65 69 73 77 81 85 89 93 97 101
105
109
113
117
121
125
129
133
137
141
Ann
ual C
ost (
€/a)
Distribution Substation Number
Case Study 1 Case Study 3 Case Study 4
Page 70
6.2.5 Case Study 5: Integrating Sub-Transmission Substation Automation
Employing a suitable set of the substation automation functions at the 110/20 kV substation can
help to further improve the reliability level achieved in the Case Study 4. The substation automation
scheme, which is responsible for performing the targeted functions, can be deployed by means of
various smart grid technologies. For an illustration purpose, it is assumed that a substation
automation scheme is implemented at the 110/20 kV substation to automatically perform the fault
detection, isolation and service restoration activities for faults within this substation. The basic data
related to the fault management activities are assumed similar to that of the Case Study 4 (Table 8).
The system oriented reliability indices for this case study are represented in Table 10. The load
point reliability indices that differ from those of the Case Study 4 are also shown in Figures 39-44.
The distributions of expected momentary interruptions and voltage sags imposed on the customers
of the distribution test network are also shown in Figures 45 and 46.
By comparing the study results presented for the Case Studies 4 and 5, it can be found that the
reliability indices associated with the sustained interruptions have been improved. However, the
situation is different for the reliability indices associated with the momentary interruptions.
Actually, employing the automatic fault detection, isolation and service restoration function at the
110/20 kV sub-transmission substation only result in the shorter interruptions for the substation
originated faults. In other word, the lengthy interruptions originated from the substation faults are
now becoming momentary interruptions due to the automatic switching operations. However, as the
failure rate of the substation components are much lower than that of the components of the
distribution test network, the levels of reliability improvements in this case study are not much
higher than that of the Case Study 4.
The automated switching scheme implemented in the Case Study 5 has no impacts on the
voltage sags experienced by the customers. Therefore, the reliability indices associated with the
voltage sags remains similar to those of the Case Study 4.
As the switching operation activities within the 110/20 kV substation are conducted by its local
operators rather than the utility repair crews, the burdens on the utility crews remain similar to those
of the Case Study 4.

Page 71
TABLE 10 SYSTEM ORIENTED RELIABILITY INDICES FOR CASE STUDY 5
Reliability Index Expected Value Relative
Change to Case Study 4 (%)
Relative Change to the Base Case (%)
SAIFI (int/sub-a) 0.2987 -9.07 -64.63 SAIDI (h/sub-a) 0.2967 -1.98 -63.05 MAIFI (eve/sub-a) 0.0828 +55.93 +10.99 AVSSI (eve/sub-a) 0.9777 0.00 -19.56 ASUI (%) 0.003387 -1.97 -63.06 EENS (kWh/a) 1856 -2.16 -63.75 ECOSTSI (€/a) 50271 -2.98 -64.07 ECOSTMI (€/a) 1424 +55.97 +10.30 ECOSTVS (€/a) 16850 0.00 -20.06 Total Cost (€/a) 68546 -1.48 -57.76 Repair Crew Burden (h/a) 72.81 0.00 -9.43
Figure 39. Annual expected frequency of sustained interruptions for distribution substations of the distribution test network, (Case Studies 1, 4&5)
0.00
0.20
0.40
0.60
0.80
1.00
1.20
1.40
1.60
1 5 9 13 17 21 25 29 33 37 41 45 49 53 57 61 65 69 73 77 81 85 89 93 97 101
105
109
113
117
121
125
129
133
137
141
Inte
rrup
tion
Freq
uenc
y (in
t/a)
Distribution Substation Number
Case Study 1 Case Study 4 Case Study 5

Page 72
Figure 40. Annual expected duration of sustained interruptions for distribution substations of the distribution test network, (Case Studies 1, 4&5)
Figure 41. Annual expected frequency of momentary interruptions for distribution substations of the distribution test network, (Case Studies 1, 4&5)
0.00
0.20
0.40
0.60
0.80
1.00
1.20
1.40
1 5 9 13 17 21 25 29 33 37 41 45 49 53 57 61 65 69 73 77 81 85 89 93 97 101
105
109
113
117
121
125
129
133
137
141
Inte
rrup
tion
Dur
atio
n (h
/a)
Distribution Substation Number
Case Study 1 Case Study 4 Case Study 5
0.00
0.01
0.03
0.04
0.06
0.07
0.08
0.10
1 5 9 13 17 21 25 29 33 37 41 45 49 53 57 61 65 69 73 77 81 85 89 93 97 101
105
109
113
117
121
125
129
133
137
141
Inte
rrup
tion
Freq
uenc
y (e
ve/a
)
Distribution Substation Number
Case Study 1 Case Study 4 Case Study 5

Page 73
Figure 42. Annual expected energy not supplied for distribution substations of the distribution test network, (Studies 1, 4&5)
Figure 43. Annual expected cost arising from sustained interruptions for distribution substations of the distribution test network, (Studies 1, 4&5)
0
50
100
150
200
250
1 5 9 13 17 21 25 29 33 37 41 45 49 53 57 61 65 69 73 77 81 85 89 93 97 101
105
109
113
117
121
125
129
133
137
141
Ene
rgy
Not
Sup
plie
d (k
Wh/
a)
Distribution Substation Number
Case Study 1 Case Study 4 Case Study 5
0
750
1500
2250
3000
3750
4500
5250
1 5 9 13 17 21 25 29 33 37 41 45 49 53 57 61 65 69 73 77 81 85 89 93 97 101
105
109
113
117
121
125
129
133
137
141
Ann
ual C
ost (
€/a)
Distribution Substation Number
Case Study 1 Case Study 4 Case Study 5

Page 74
Figure 44. Annual expected cost arising from momentary interruptions for distribution substations of the distribution test network, (Case Studies 1, 4&5)
Figure 45. Density distribution of overall expected voltage variation events, (Case Study 5)
0
15
30
45
60
75
90
1 5 9 13 17 21 25 29 33 37 41 45 49 53 57 61 65 69 73 77 81 85 89 93 97 101
105
109
113
117
121
125
129
133
137
141
Ann
ual C
ost (
€/a)
Distribution Substation Number
Case Study 1 Case Study 4 Case Study 5
.01 - .04 s
.1 - .15 s
.2 - .4 s
.6 - .8 s1 - 60 s
0.00
0.03
0.05
0.08
0.10
0.13
0.15
0.18
80 -90%
70 -80%
60 -70%
50 -60%
40 -50%
30 -40%
20 -30%
10 -20%
0 -10%
Duration
Eve
nt F
requ
ency
(occ
/a)
Remaining Voltage

Page 75
Figure 46. Cumulative distribution of overall expected voltage variation events, (Case Study 5)
6.2.6 Case Study 6: Integrating Distribution Substation Automation
The substation automation scheme implemented in the 110/20 kV substation was only
responsible for control and monitoring the equipment installed within this substation. However, it is
possible to increase the scope of this substation automation scheme such that the distribution
substations fed by its feeders can also be remotely monitored and controlled. The number and
location of distribution substations that are going to be modernized can affect the level of reliability
improvement. Optimal allocation of these distribution substations requires a course of cost-benefit
studies. However, for sake of simplicity, the shared distribution substations between each pair of
feeders (containing normally open tie switch) and midpoint substations of each feeder are selected
for upgrading. The selected distribution substations are 7, 9, 12, 17, 26, 42, 90, 117 and 134. It is
also assumed that all the switching devices of the targeted distribution substations are retrofitted
with suitable actuators for remote control and monitoring purpose.
The basic data related to the fault management activities are assumed similar to that of the Case
Studies 4 and 5 (Table 8). In addition, it is assumed that the uncoordinated and coordinated remote
switching operation can be accomplished within 5 and 120 seconds, respectively. Uncoordinated
remote switching operation is conducted whenever the repair crews have not been engaged with the
< .04 s
< .15 s
< .4 s
< .8 s
< 60 s
0.00
0.20
0.40
0.60
0.80
1.00
1.20
1.40
1.60
< 90% < 80% < 70% < 60% < 50% < 40% < 30% < 20% < 10%
Duration
Eve
nt F
requ
ency
(occ
/a)
Remaining Voltage

Page 76
fault management activities yet. However, the coordinated remote switching operation is carried out
whenever the repair crews are engaging with the fault management activities and due to the safety
issues they should be aware of any ongoing remote switching operation.
The system oriented reliability indices for this case study are represented in Table 11. The load
point reliability indices that differ from those of the Case Study 5 are also shown in Figures 47-49.
The distributions of expected momentary interruptions and voltage sags imposed on the customers
of the distribution test network are similar to those of the Case Study 5.
The study results show the durations of the sustained interruptions have been reduced compared
to those of the Case Study 5. As a result, the energy not supplied, service unavailability and also the
financial impacts of the sustained interruptions have also been reduced compared to those of the
Case Study 5. However, the reliability indices associated with the momentary interruptions and
voltage sags are similar to those of the Case Study 5. Actually, the remote controlled switching
devices available in the upgraded distribution substations can aid the repair crews and the control
center operators to perform the necessary switching activities in a much shorter period of time. It is
also possible to perform both remote and local fault isolation and service restoration activities. In
this method, first using the available remote controlled switching devices, the faulted feeder is
broken to the several zones. Then the power service is restored to as many as possible of these
zones by means of remote controlled switching devices. Afterwards, when the repair crews reach to
the faulted area, they can conduct the local fault isolation and service restoration activities. They
normally first isolate the faulted section from the other healthy parts of the feeder by means of the
manually operated switching devices. Then, the power service is restored to as many as possible of
the customer through proper switching operations. The remote fault isolation and service restoration
activities in this method require the intervention of the distribution system operators. Usually the
time required for restoring the power supply for the affected customers in this method is much
above the aggregation window for recording the momentary events (5 minutes). As a result, only
the durations of sustained interruptions are reduced and their frequencies remain the same to those
of the Case Study 5.

Page 77
TABLE 11 SYSTEM ORIENTED RELIABILITY INDICES FOR CASE STUDY 6
Reliability Index Expected Value Relative
Change to Case Study 5 (%)
Relative Change to the Base Case (%)
SAIFI (int/sub-a) 0.2987 0.00 -64.63 SAIDI (h/sub-a) 0.2734 -7.85 -65.95 MAIFI (eve/sub-a) 0.0828 0.00 +10.99 AVSSI (eve/sub-a) 0.9777 0.00 -19.56 ASUI (%) 0.003121 -7.85 -65.96 EENS (kWh/a) 1703 -8.24 -66.74 ECOSTSI (€/a) 46429 -7.64 -66.82 ECOSTMI (€/a) 1424 0.00 +10.30 ECOSTVS (€/a) 16850 0.00 -20.06 Total Cost (€/a) 64704 -5.60 -60.13 Repair Crew Burden (h/a) 72.66 -0.21 -9.62
Figure 47. Annual expected duration of sustained interruptions for distribution substations of the distribution test network, (Case Studies 1, 5&6)
0.00
0.20
0.40
0.60
0.80
1.00
1.20
1.40
1 5 9 13 17 21 25 29 33 37 41 45 49 53 57 61 65 69 73 77 81 85 89 93 97 101
105
109
113
117
121
125
129
133
137
141
Inte
rrup
tion
Dur
atio
n (h
/a)
Distribution Substation Number
Case Study 1 Case Study 5 Case Study 6

Page 78
Figure 48. Annual expected energy not supplied for distribution substations of the distribution test network, (Studies 1, 5&6)
Figure 49. Annual expected cost arising from sustained interruptions for distribution substations of the distribution test network, (Studies 1, 5&6)
0
50
100
150
200
250
1 5 9 13 17 21 25 29 33 37 41 45 49 53 57 61 65 69 73 77 81 85 89 93 97 101
105
109
113
117
121
125
129
133
137
141
Ene
rgy
Not
Sup
plie
d (k
Wh/
a)
Distribution Substation Number
Case Study 1 Case Study 5 Case Study 6
0
750
1500
2250
3000
3750
4500
5250
1 5 9 13 17 21 25 29 33 37 41 45 49 53 57 61 65 69 73 77 81 85 89 93 97 101
105
109
113
117
121
125
129
133
137
141
Ann
ual C
ost (
€/a)
Distribution Substation Number
Case Study 1 Case Study 5 Case Study 6

Page 79
6.2.7 Case Study 7: Integrating Feeder Automation
In the Case Study 6, several distribution substations were equipped with suitable facilities for
remote control and monitoring purposes. It is possible to develop a feeder automation scheme in
order to perform automatic fault detection, isolation and service restoration activities in the
distribution feeder level. The operational procedure of the targeted feeder automation scheme
depends on several factors such as the type of automated switching devices, network structure, the
neutral grounding method, type of customers, utility safety regulations and so on. For an illustration
purpose, an advanced feeder automation scheme that can be implemented in the distribution test
network is described here as follows.
The neutral grounding at the 20 kV level of the distribution test network is resonance
(compensated) earthed. In this situation, normally the fault currents for phase to ground faults in 20
kV level can be interrupted by the load breaking switching devices available in the automated
distribution substations. In addition, this kind of fault does not cause any voltage sag for the
customers supplied by the faulted feeder. Therefore, it is possible to develop an advanced feeder
automation scheme capable of distinguish between phase to ground faults and the other over-current
short circuit faults. The main benefit of such an automation scheme is its ability in decreasing the
extent of outages for phase to ground faults. In this condition, for a phase to ground fault located
between feeder circuit breaker and the automated distribution substation, the supply of customers
located downstream of the automated distribution substation are rerouted to the neighboring healthy
feeder through automatic closed-transition switching actions without any power interruption for the
customers. For a phase to ground fault located downstream of the automated distribution substation,
instead of the feeder circuit breaker, a switching device located at the automated distribution
substation operates and isolates the fault. For a fault which results in an over-current condition, the
feeder circuit breaker is operated. Then, the proper switching operations are automatically carried
out in order to isolate the faulted zone and restore as many as possible of the customers.
The basic data related to the fault management activities are assumed similar to that of the Case
Study 6. The system oriented reliability indices for this case study are represented in Table 12. The
load point reliability indices that differ from those of the Case Study 6 are shown in Figures 50-55.
The distributions of expected momentary interruptions and voltage sags imposed on the customers
of the distribution test network are also shown in Figures 56 and 57.
The study results show that all the reliability indices associated with the sustained interruptions
have been improved compared to those of the Case Study 6. Actually, the automated switching

Page 80
devices available in the upgraded distribution substations can perform the necessary switching
activities in a much shorter period of time. As the automatic fault isolation and service restoration
activities in this method do not require the intervention of the control center operators, the
restoration time for the affected customers is much below the aggregation window for recording the
momentary events (5 minutes). Therefore, both the frequencies and durations of the sustained
interruptions have been reduced compared to those of the Case Study 6. Instead, the number of
momentary interruptions imposed on the customers is increased. The voltage sags experienced by
the customers remain the same to those of the Case Study 6.
The study results also indicate that the variation of reliability indices associated with momentary
interruptions has been increased compared to those of the Case Study 6.
TABLE 12
SYSTEM ORIENTED RELIABILITY INDICES FOR CASE STUDY 7
Reliability Index Expected Value Relative
Change to Case Study 6 (%)
Relative Change to the Base Case (%)
SAIFI (int/sub-a) 0.1212 -59.42 -85.65 SAIDI (h/sub-a) 0.2373 -13.20 -70.45 MAIFI (eve/sub-a) 0.1325 +60.02 +77.61 AVSSI (eve/sub-a) 0.9777 0.00 -19.56 ASUI (%) 0.002709 -13.20 -70.45 EENS (kWh/a) 1470 -13.68 -71.29 ECOSTSI (€/a) 37701 -18.80 -73.06 ECOSTMI (€/a) 2221 +55.97 +72.04 ECOSTVS (€/a) 16850 0.00 -20.06 Total Cost (€/a) 56773 -12.26 -65.02 Repair Crew Burden (h/a) 72.66 0.00 -9.63

Page 81
Figure 50. Annual expected frequency of sustained interruptions for distribution substations of the distribution test network, (Case Studies 1, 6&7)
Figure 51. Annual expected duration of sustained interruptions for distribution substations of the distribution test network, (Case Studies 1, 6&7)
0.00
0.20
0.40
0.60
0.80
1.00
1.20
1.40
1.60
1 5 9 13 17 21 25 29 33 37 41 45 49 53 57 61 65 69 73 77 81 85 89 93 97 101
105
109
113
117
121
125
129
133
137
141
Inte
rrup
tion
Freq
uenc
y (in
t/a)
Distribution Substation Number
Case Study 1 Case Study 6 Case Study 7
0.00
0.20
0.40
0.60
0.80
1.00
1.20
1.40
1 5 9 13 17 21 25 29 33 37 41 45 49 53 57 61 65 69 73 77 81 85 89 93 97 101
105
109
113
117
121
125
129
133
137
141
Inte
rrup
tion
Dur
atio
n (h
/a)
Distribution Substation Number
Case Study 1 Case Study 6 Case Study 7

Page 82
Figure 52. Annual expected frequency of momentary interruptions for distribution substations of the distribution test network, (Case Studies 1, 6&7)
Figure 53. Annual expected energy not supplied for distribution substations of the distribution test network, (Studies 1, 6&7)
0.00
0.03
0.06
0.09
0.12
0.15
0.18
0.21
1 5 9 13 17 21 25 29 33 37 41 45 49 53 57 61 65 69 73 77 81 85 89 93 97 101
105
109
113
117
121
125
129
133
137
141
Inte
rrup
tion
Freq
uenc
y (e
ve/a
)
Distribution Substation Number
Case Study 1 Case Study 6 Case Study 7
0
50
100
150
200
250
1 5 9 13 17 21 25 29 33 37 41 45 49 53 57 61 65 69 73 77 81 85 89 93 97 101
105
109
113
117
121
125
129
133
137
141
Ene
rgy
Not
Sup
plie
d (k
Wh/
a)
Distribution Substation Number
Case Study 1 Case Study 6 Case Study 7

Page 83
Figure 54. Annual expected cost arising from sustained interruptions for distribution substations of the distribution test network, (Studies 1, 6&7)
Figure 55. Annual expected cost arising from momentary interruptions for distribution substations of the distribution test network, (Case Studies 1, 6&7)
0
750
1500
2250
3000
3750
4500
5250
1 5 9 13 17 21 25 29 33 37 41 45 49 53 57 61 65 69 73 77 81 85 89 93 97 101
105
109
113
117
121
125
129
133
137
141
Ann
ual C
ost (
€/a)
Distribution Substation Number
Case Study 1 Case Study 6 Case Study 7
0
20
40
60
80
100
1 5 9 13 17 21 25 29 33 37 41 45 49 53 57 61 65 69 73 77 81 85 89 93 97 101
105
109
113
117
121
125
129
133
137
141
Ann
ual C
ost (
€/a)
Distribution Substation Number
Case Study 1 Case Study 6 Case Study 7
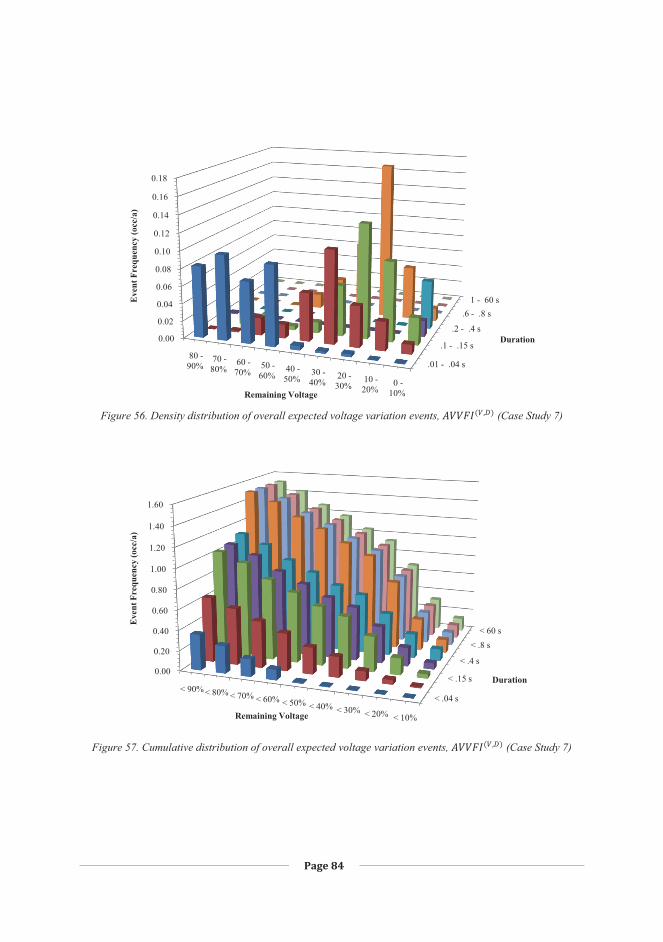
Page 84
Figure 56. Density distribution of overall expected voltage variation events, (Case Study 7)
Figure 57. Cumulative distribution of overall expected voltage variation events, (Case Study 7)
.01 - .04 s
.1 - .15 s
.2 - .4 s
.6 - .8 s1 - 60 s
0.00
0.02
0.04
0.06
0.08
0.10
0.12
0.14
0.16
0.18
80 -90%
70 -80%
60 -70%
50 -60%
40 -50%
30 -40%
20 -30%
10 -20%
0 -10%
Duration
Eve
nt F
requ
ency
(occ
/a)
Remaining Voltage
< .04 s
< .15 s
< .4 s
< .8 s< 60 s
0.00
0.20
0.40
0.60
0.80
1.00
1.20
1.40
1.60
< 90%< 80% < 70% < 60% < 50% < 40% < 30% < 20% < 10%
Duration
Eve
nt F
requ
ency
(occ
/a)
Remaining Voltage

Page 85
6.2.8 Case Study 8: Integrating Distribution Automation System
The Case Study 7 contains the majority of infrastructures required to develop a distribution
automation system. Therefore, it is possible to develop an advanced distribution automation system
by integrating the implemented smart grid technologies with some new or modified technologies
such as high speed communication systems and improved interfacing and decision supports. In this
situation, the fault management activities can be accomplished more efficiently. For an illustration
purpose, when employing this distribution automation system, it is assumed that the fault
management activities in the distribution test network are now accomplished according to Table 13.
The system oriented reliability indices for this case study are represented in Table 14. The load
point reliability indices that differ from those of the Case Study 7 are also shown in Figures 58-63.
The distributions of expected momentary interruptions and voltage sags imposed on the customers
of the distribution test network are also shown in Figures 64 and 65.
The study results show that the reliability indices associated with the sustained interruptions
have been improved compared to those of the Case Study 7. However, the reliability indices
associated with the momentary interruptions have been deteriorated compared to those of the Case
Study 7. As some of the fault condition cannot be managed completely by the available feeder
automation scheme, the remote fault detection, isolation and service restoration activities are
required to restore the power to as many as possible of the customers. In the Case Study 7, the time
required for accomplishing this task was much above the aggregation window for recording the
momentary events (5 minutes). Therefore, the customers whose power services were restored by
remote switching operation faced sustained interruptions instead of momentary interruptions.
However, when employing the advanced distribution automation system, the remote fault detection,
isolation and service restoration activities can be accomplished in a period of time well below the
threshold of a momentary interruption. As a result, the number and duration of sustained
interruptions are decreased and the frequency of momentary interruptions is increased. This can also
be found by comparison of the results provided in Figures 56 and 64. As it can be seen in these
figures, the number of events corresponding to momentary interruptions (remaining voltage less
than 10 percents of the nominal voltage) has been increased in the range 1-60 seconds for the Case
Study 8 compared to that of the Case Study 7.
The smart grid technologies implemented in this case study do not have any impacts on the
voltage sags experienced by the customers compared to those of the Case Study 7.

Page 86
The results presented in Table 14 show that the burden on the utility crews is also reduced when
employing the advanced distribution automation system. This is because much less time is required
to dispatch the repair crews and also they spend less time for travelling around the network in order
to perform field activities.
TABLE 13
BASIC DATA RELATED TO THE FAULT MANAGEMENT ACTIVITIES IN CASE STUDY 8
Average time required for fault notification (s) 5
Average time required for approximate fault location (s) 10
Average time required for decision making about fault management activities (s) 25
Average time required for dispatching the repair crews (s) 20
Average speed of the repair crews for traveling to the faulted area (km/h) 60
Average time required for precise fault location on an underground cable section including both pre-location and pinpointing activities (s) 1800
Average time required for manual operation of switching devices involved in fault management activities (s) 180
Average time required for uncoordinated remote switching operation (s) 5
Average time required for coordinated remote switching operation (s) 120
Available teams of repair crews for performing fault management activities 2
TABLE 14 SYSTEM ORIENTED RELIABILITY INDICES FOR CASE STUDY 8
Reliability Index Expected Value Relative
Change to Case Study 7 (%)
Relative Change to the Base Case (%)
SAIFI (int/sub-a) 0.1050 -13.37 -87.57 SAIDI (h/sub-a) 0.2195 -7.50 -72.67 MAIFI (eve/sub-a) 0.1487 +12.23 +99.33 AVSSI (eve/sub-a) 0.9777 0.00 -19.56 ASUI (%) 0.002505 -7.53 -72.68 EENS (kWh/a) 1353 -7.96 -73.57 ECOSTSI (€/a) 34547 -8.37 -75.31 ECOSTMI (€/a) 2538 +14.27 +96.59 ECOSTVS (€/a) 16850 0.00 -20.06 Total Cost (€/a) 53935 -5.00 -66.77 Repair Crew Burden (h/a) 71.67 -1.36 -10.85

Page 87
Figure 58. Annual expected frequency of sustained interruptions for distribution substations of the distribution test network, (Case Studies 1, 7&8)
Figure 59. Annual expected duration of sustained interruptions for distribution substations of the distribution test network, (Case Studies 1, 7&8)
0.00
0.20
0.40
0.60
0.80
1.00
1.20
1.40
1.60
1 5 9 13 17 21 25 29 33 37 41 45 49 53 57 61 65 69 73 77 81 85 89 93 97 101
105
109
113
117
121
125
129
133
137
141
Inte
rrup
tion
Freq
uenc
y (in
t/a)
Distribution Substation Number
Case Study 1 Case Study 7 Case Study 8
0.00
0.20
0.40
0.60
0.80
1.00
1.20
1.40
1 5 9 13 17 21 25 29 33 37 41 45 49 53 57 61 65 69 73 77 81 85 89 93 97 101
105
109
113
117
121
125
129
133
137
141
Inte
rrup
tion
Dur
atio
n (h
/a)
Distribution Substation Number
Case Study 1 Case Study 7 Case Study 8

Page 88
Figure 60. Annual expected frequency of momentary interruptions for distribution substations of the distribution test network, (Case Studies 1, 7&8)
Figure 61. Annual expected energy not supplied for distribution substations of the distribution test network, (Studies 1, 7&8)
0.00
0.04
0.08
0.12
0.16
0.20
0.24
0.28
1 5 9 13 17 21 25 29 33 37 41 45 49 53 57 61 65 69 73 77 81 85 89 93 97 101
105
109
113
117
121
125
129
133
137
141
Inte
rrup
tion
Freq
uenc
y (e
ve/a
)
Distribution Substation Number
Case Study 1 Case Study 7 Case Study 8
0
50
100
150
200
250
1 5 9 13 17 21 25 29 33 37 41 45 49 53 57 61 65 69 73 77 81 85 89 93 97 101
105
109
113
117
121
125
129
133
137
141
Ene
rgy
Not
Sup
plie
d (k
Wh/
a)
Distribution Substation Number
Case Study 1 Case Study 7 Case Study 8

Page 89
Figure 62. Annual expected cost arising from sustained interruptions for distribution substations of the distribution test network, (Studies 1, 7&8)
Figure 63. Annual expected cost arising from momentary interruptions for distribution substations of the distribution test network, (Case Studies 1, 7&8)
0
750
1500
2250
3000
3750
4500
5250
1 5 9 13 17 21 25 29 33 37 41 45 49 53 57 61 65 69 73 77 81 85 89 93 97 101
105
109
113
117
121
125
129
133
137
141
Ann
ual C
ost (
€/a)
Distribution Substation Number
Case Study 1 Case Study 7 Case Study 8
0
20
40
60
80
100
120
140
1 5 9 13 17 21 25 29 33 37 41 45 49 53 57 61 65 69 73 77 81 85 89 93 97 101
105
109
113
117
121
125
129
133
137
141
Ann
ual C
ost (
€/a)
Distribution Substation Number
Case Study 1 Case Study 7 Case Study 8

Page 90
Figure 64. Density distribution of overall expected voltage variation events, (Case Study 8)
Figure 65. Cumulative distribution of overall expected voltage variation events, (Case Study 8)
.01 - .04 s
.1 - .15 s
.2 - .4 s
.6 - .8 s1 - 60 s
0.00
0.02
0.04
0.06
0.08
0.10
0.12
0.14
0.16
0.18
0.20
80 -90%
70 -80%
60 -70%
50 -60%
40 -50%
30 -40%
20 -30%
10 -20%
0 -10%
Duration
Eve
nt F
requ
ency
(occ
/a)
Remaining Voltage
< .04 s
< .15 s
< .4 s
< .8 s< 60 s
0.00
0.20
0.40
0.60
0.80
1.00
1.20
1.40
1.60
< 90% < 80% < 70% < 60% < 50% < 40% < 30% < 20% < 10%
Duration
Eve
nt F
requ
ency
(occ
/a)
Remaining Voltage

Page 91
6.2.9 Case Study 9: Integrating Fault Current Limiters
The smart grid technologies implemented in the Case Studies 2 and 3 could alleviate the voltage
sags experiencing by the customers. Hence, the frequency of severe voltage sags was reduced for
these case studies. However, employing the smart grid technologies targeted in the Case Studies 4-8
could not result in any further mitigation in the voltage sags experiencing by the customers.
Actually, these technologies are mainly used for reducing the number and duration of sustained
interruptions imposed on the customers. However, there are some other smart grid technologies
available that can be used in the functional zone of the electricity distribution networks to further
mitigate the voltage sags experienced by the customers.
Fault current limiters are one of the attractive smart grid technologies that are mainly used for
managing the fault currents in the electric power systems. Appropriate allocation of the fault current
limiters may also alleviate the voltage sags arising from the over-current faulty conditions.
Installing the fault current limiters immediately downstream of the feeder circuit breaker is one of
the most potential locations for such purpose. In this method, it might be possible to close the
normally-open tie switching device between medium voltage buses which results in a better voltage
regulation and enhanced substation reliability. In the case of an over-current fault condition, the
voltage drop across the fault current limiter keeps the busbar voltage high enough for majority of
downstream faults. This will lead to the less severe voltage sags on the other feeders originated
from the common busbar. For an illustration purpose, it is assumed that the fault current limiters are
installed at immediately downstream of each feeder circuit breaker of the distribution test network.
It is also assumed that the technology of the fault current limiters is based on the high-temperature
superconducting materials. In this situation, the reaction time of the fault current limiters is around
5 milliseconds. The activated impedance of the fault current limiters is chosen to be 4 ohms in order
to keep the voltage of 20 kV busbar above 75 percents of the nominal voltage for downstream
three-phase faults close to the 110/20 kV substation. The basic data related to the fault management
activities are assumed similar to that of the Case Study 8.
The system oriented reliability indices for this case study are represented in Table 15. The load
point reliability indices associated with the momentary interruptions and voltage sags are also
shown in Figures 66-69. The other reliability indices are similar to those of the Case Study 8. The
distributions of expected momentary interruptions and voltage sags imposed on the customers of the
distribution test network are also shown in Figures 70 and 71.

Page 92
In the previous case studies, the short circuit faults close to the main substation result in the
remaining voltage less than the threshold of the momentary interruptions (10 percent of the nominal
voltage) and appear as the momentary interruptions to the customers. However, after installing the
fault current limiters, the voltage drop across the fault current limiter keeps the busbar voltage high
enough for majority of downstream faults and hence the frequency of the momentary interruptions
is reduced compared to those of the Case Study 8. But, the frequency of the momentary
interruptions is still much higher than that of the base case study.
The study results also show that the number and hence the financial impacts of the severe
voltage sags have been alleviated when employing the fault current limiters. By comparing the
results presented in Figures 64 and 70, it can be found that after installing the fault current limiters
the density of severe voltage sags which cause malfunction for majority of the customers (e.g.
events with remaining voltage less than 70 percents of the nominal voltage) has been decreased and
instead the density of shallow voltage sags has been increased.
TABLE 15
SYSTEM ORIENTED RELIABILITY INDICES FOR CASE STUDY 9
Reliability Index Expected Value Relative
Change to Case Study 8 (%)
Relative Change to the Base Case (%)
SAIFI (int/sub-a) 0.1050 0.00 -87.57 SAIDI (h/sub-a) 0.2195 0.00 -72.67 MAIFI (eve/sub-a) 0.1219 -18.02 +63.40 AVSSI (eve/sub-a) 0.8913 -8.84 -26.67 ASUI (%) 0.002505 0.00 -72.68 EENS (kWh/a) 1353 0.00 -73.57 ECOSTSI (€/a) 34547 0.00 -75.31 ECOSTMI (€/a) 2075 -18.24 +60.73 ECOSTVS (€/a) 15363 -8.82 -27.12 Total Cost (€/a) 51984 -3.62 -67.97 Repair Crew Burden (h/a) 71.67 0.00 -10.85

Page 93
Figure 66. Annual expected frequency of momentary interruptions for distribution substations of the distribution test network, (Case Studies 1, 8&9)
Figure 67. Annual expected frequency of voltage sags affecting distribution substations of the distribution test network, (Case Studies 1, 8&9)
0.00
0.04
0.08
0.12
0.16
0.20
0.24
0.28
1 5 9 13 17 21 25 29 33 37 41 45 49 53 57 61 65 69 73 77 81 85 89 93 97 101
105
109
113
117
121
125
129
133
137
141
Inte
rrup
tion
Freq
uenc
y (e
ve/a
)
Distribution Substation Number
Case Study 1 Case Study 8 Case Study 9
0.00
0.20
0.40
0.60
0.80
1.00
1.20
1.40
1 5 9 13 17 21 25 29 33 37 41 45 49 53 57 61 65 69 73 77 81 85 89 93 97 101
105
109
113
117
121
125
129
133
137
141
Vol
tage
Sag
Fre
quen
cy (e
ve/a
)
Distribution Substation Number
Case Study 1 Case Study 8 Case Study 9

Page 94
Figure 68. Annual expected cost arising from momentary interruptions for distribution substations of the distribution test network, (Case Studies 1, 8&9)
Figure 69. Annual expected cost arising from voltage sags for distribution substations of the distribution test network, (Case Studies 1, 8&9)
0
20
40
60
80
100
120
140
1 5 9 13 17 21 25 29 33 37 41 45 49 53 57 61 65 69 73 77 81 85 89 93 97 101
105
109
113
117
121
125
129
133
137
141
Ann
ual C
ost (
€/a)
Distribution Substation Number
Case Study 1 Case Study 8 Case Study 9
0
200
400
600
800
1000
1200
1400
1 5 9 13 17 21 25 29 33 37 41 45 49 53 57 61 65 69 73 77 81 85 89 93 97 101
105
109
113
117
121
125
129
133
137
141
Ann
ual C
ost (
€/a)
Distribution Substation Number
Case Study 1 Case Study 8 Case Study 9

Page 95
Figure 70. Density distribution of overall expected voltage variation events, (Case Study 9)
Figure 71. Cumulative distribution of overall expected voltage variation events, (Case Study 9)
.01 - .04 s
.1 - .15 s
.2 - .4 s
.6 - .8 s1 - 60 s
0.00
0.05
0.10
0.15
0.20
0.25
80 -90%
70 -80%
60 -70%
50 -60%
40 -50%
30 -40%
20 -30%
10 -20%
0 -10%
Duration
Eve
nt F
requ
ency
(occ
/a)
Remaining Voltage
< .04 s
< .15 s
< .4 s
< .8 s< 60 s
0.00
0.20
0.40
0.60
0.80
1.00
1.20
1.40
1.60
1.80
< 90%< 80% < 70% < 60% < 50% < 40% < 30% < 20% < 10%
Duration
Eve
nt F
requ
ency
(occ
/a)
Remaining Voltage

Page 96
6.2.10 Case Study 10: Integrating Dynamic Voltage Restorers
The fault current limiters implemented in the Case Study 9 could just mitigate the voltage sags
originated from the faults within the distribution test network. They cannot alleviate the voltage
sags that propagated from the sub-transmission network into the distribution test network. The
frequency and severity of the voltage sags arising from external faults can be alleviated at the
transmission and sub-transmission levels by means of fault prevention schemes, network
configuration modification, advanced protection schemes and so on. However, within the functional
zone of an electricity distribution system, it is possible to use the dynamic voltage restorers to
mitigate the voltage sags regardless of their origins. Optimal allocation of the dynamic voltage
restorers for voltage sag mitigation purpose requires a course of cost-benefit analyses. However, for
the sake of simplicity, it is assumed that the distribution substations 4, 9, 10, 17, 55, 82, 94, 107,
119 and 125 are equipped with dynamic voltage restorers. These distribution substations have high
contribution to the overall costs associated with the voltage sags. It is also assumed that all the
dynamic voltage restorers have the same correction capability. The correction capability of the
dynamic voltage restorers is modeled according to the characteristics of a commercially available
device in the market (ABB-PCS 100AVC). Activation time less than half a cycle, full correction for
three-phase sags down to 70 percents of the nominal voltage and also full correction for single-
phase sags down to 55 percents of the nominal voltage are the main characteristic of the employed
dynamic voltage restorers. It is assumed that for the voltage sags with the remaining voltage less
than 50 percents of the nominal voltage, the dynamic voltage restorers stay in the bypass mode. In
this situation, there is no boosting in the sagged phases.
The basic data related to the fault management activities are assumed similar to that of the Case
Study 8. The system oriented reliability indices for this case study are represented in Table 16. The
load point reliability indices associated with the voltage sags are shown in Figures 72 and 73. The
other reliability indices are similar to those of the Case Study 9. As an example, the distributions of
expected momentary interruptions and voltage sags imposed on the customers of the distribution
substation number 4 before and after employing the dynamic voltage restorers are also shown in
Figures 74 and 75.
The study results show that the number and hence the financial impacts of the voltage sags for
the distribution substations equipped with dynamic voltage restorers have been considerably
alleviated. As dynamic voltage restorers are capable of correcting the voltage sags regardless of
their origin, much better improvements are achieved when employing these devices compared to the

Page 97
situation where fault current limiters are used for voltage sag mitigation purposes. Actually,
application of the fault current limiters is an effective solution for mitigation of voltage sags
originated from faults within the distribution network. However, in a situation where the
contribution of externally generated voltage sags in the overall cost is dominated, other solutions
such as employing the dynamic voltage restorers at strategic locations can be a potential option.
The dynamic voltage restorers alleviate the voltage sags experienced by the customers connected
downstream of their locations. Instead, the fault current limiters have the reverse behavior. The fault
current limiters alleviate the voltage sag experienced by the upstream customers and aggravate
those experienced by downstream customers.
TABLE 16
SYSTEM ORIENTED RELIABILITY INDICES FOR CASE STUDY 10
Reliability Index Expected Value Relative
Change to Case Study 9 (%)
Relative Change to the Base Case (%)
SAIFI (int/sub-a) 0.1050 0.00 -87.57 SAIDI (h/sub-a) 0.2195 0.00 -72.67 MAIFI (eve/sub-a) 0.1214 -0.41 +62.73 AVSSI (eve/sub-a) 0.8484 -4.81 -30.20 ASUI (%) 0.002506 0.00 -72.67 EENS (kWh/a) 1353 0.00 -73.57 ECOSTSI (€/a) 34548 0.00 -75.31 ECOSTMI (€/a) 2064 -0.53 +59.88 ECOSTVS (€/a) 12542 -18.36 -40.50 Total Cost (€/a) 49155 -5.44 -69.71 Repair Crew Burden (h/a) 71.67 0.00 -10.85

Page 98
Figure 72. Annual expected frequency of voltage sags affecting distribution substations of the distribution test network, (Case Studies 1, 9&10)
Figure 73. Annual expected cost arising from voltage sags for distribution substations of the distribution test network, (Case Studies 1, 9&10)
0.00
0.20
0.40
0.60
0.80
1.00
1.20
1.40
1 5 9 13 17 21 25 29 33 37 41 45 49 53 57 61 65 69 73 77 81 85 89 93 97 101
105
109
113
117
121
125
129
133
137
141
Vol
tage
Sag
Fre
quen
cy (e
ve/a
)
Distribution Substation Number
Case Study 1 Case Study 9 Case Study 10
0
200
400
600
800
1000
1200
1400
1 5 9 13 17 21 25 29 33 37 41 45 49 53 57 61 65 69 73 77 81 85 89 93 97 101
105
109
113
117
121
125
129
133
137
141
Ann
ual C
ost (
€/a)
Distribution Substation Number
Case Study 1 Case Study 9 Case Study 10

Page 99
Figure 74. Density distribution of overall expected voltage variation events, imposed on the
distribution substation number 4 (before employing dynamic voltage restorers)
Figure 75. Density distribution of overall expected voltage variation events, imposed on the
distribution substation number 4 (after employing dynamic voltage restorers)
.01 - .04 s
.1 - .15 s
.2 - .4 s
.6 - .8 s1 - 60 s
0.00
0.05
0.10
0.15
0.20
0.25
0.30
80 -90%
70 -80%
60 -70%
50 -60%
40 -50%
30 -40%
20 -30%
10 -20%
0 -10%
Duration
Eve
nt F
requ
ency
(occ
/a)
Remaining Voltage
.01 - .04 s
.1 - .15 s
.2 - .4 s
.6 - .8 s1 - 60 s
0.00
0.05
0.10
0.15
0.20
0.25
0.30
80 -90%
70 -80%
60 -70%
50 -60%
40 -50%
30 -40%
20 -30%
10 -20%
0 -10%
Duration
Eve
nt F
requ
ency
(occ
/a)
Remaining Voltage

Page 100
6.3 Comparison of Implemented Smart Grid Technologies
Various smart grid technologies were examined in the previous sections to estimate their impacts
on the reliability of electric power delivered to the customers of the distribution test network. The
study results show that various smart grid technologies have different reliability impacts. The
impacts of the examined smart grid technologies on the various system oriented reliability indices
of the distribution test network have been compared against each other in Figures 76-80.
Figure 76 shows that after integrating the distance to fault estimators (Case Study 2), the fault
passage indicators (Case Study 3) and also the feeder automation scheme (Case Study 7), the
average frequency of the sustained interruptions has been considerably reduced. Integrating other
smart grid technologies has no or only little impact on SAIFI.
As it can be seen from Figure 77, after integrating the distance to fault estimators (Case Study 2)
and the fault locator scheme (Case Study 4), the average duration of sustained interruptions has
been considerably decreased. Integrating the automation solutions toward the complete distribution
automation system (Case Studies 5 to 8) could also result in some additional improvements in
SAIDI. Integrating the fault passage indicators (Case Study 3) has negative impact on SAIDI. The
fault current limiters (Case Study 9) and the dynamic voltage restorers (Case Study 10) have no
impacts on SAIDI.
Figure 78 shows that after integrating the distance to fault estimators (Case Study 2), the
frequency of the momentary interruptions has been considerably reduced. The value of MAIFI
remains the same after integrating the fault passage indicators (Case Study 3) and the fault locator
scheme (Case Study 4). However, integrating the sub-transmission substation automation (Case
Study 5), the feeder automation scheme (Case Study 7) and the distribution automation system
(Case Study 8) have negative impacts on MAIFI. Although employing the fault current limiters
(Case Study 9) cause a little bit improvement in MAIFI, but the value of MAIFI is still much above
of that of the base case study.
As it can be seen from Figure 79, integrating the distance to fault estimators (Case Study 2)
could significantly alleviate the impacts of the voltage sags on the customers. After integrating the
fault passage indicators (Case Study 3), the fault current limiters (Case Study 9) and the dynamic
voltage restorers (Case Study 10) additional improvements have also been achieved in AVSSI.
Integrating other smart grid technologies has no impact on AVSSI.
Figure 80 shows the overall cost of the service reliability issues on the customers of the
distribution test network. This figure shows the accumulated impacts of the sustained interruptions,

Page 101
momentary interruptions and voltage sags on the customers. Therefore, the overall effects of the
examined smart grid technologies can be well understood from this figure. As it can be seen from
Figure 80, after integrating each smart grid technology, an improvement is appeared in the overall
expected cost. However, the levels of improvements are dominated when integrating the distance to
fault estimators (Case Study 2) and the fault locator scheme (Case Study 4). Actually, when a
customer encounters with an abnormal situation due to a severe voltage sag, a momentary
interruption or a sustained interruption; the imposed costs on the customer are almost the same at
the beginning of the event. However, the sustained interruptions last for longer time periods; hence,
the costs associated with the sustained interruptions are increased proportional with the duration of
interruptions. Therefore, normally, the costs associated with the momentary interruptions and
voltage sags can only be reduced by mitigating the occurrence frequency of such events. Instead,
the costs of sustained interruptions can be mitigated through reducing both frequency and duration
of interruptions. Therefore, as it can be seen from the results presented in Figure 80, the impacts of
the smart grid technologies which reduce the annual duration of sustained interruptions (SAIDI) are
more dominated.
Figure 81 shows the impact of the examined smart grid technologies on the burdens on the utility
crews. The results presented in this figure indicate that integrating technologies toward a complete
distribution automation system can considerably reduce the burdens on the utility repair crews.
When dealing with the results presented in Figures 76-81, it should be noted that the
technologies have been added to a set of previously implemented technologies. As an example,
when integrating the sub-transmission substation automation it has been assumed that the distance
to fault estimators, fault passage estimators and fault locator scheme have already been
implemented in the distribution test network. The integrating sequence which has been used in this
thesis follows the practical chronology of developing smart distribution grids. Therefore, if this
sequence changes from that used in this thesis, different reliability impacts might be obtained for
each implemented technology. However, the overall improvement remains the same regardless of
the sequence that these technologies are integrated.
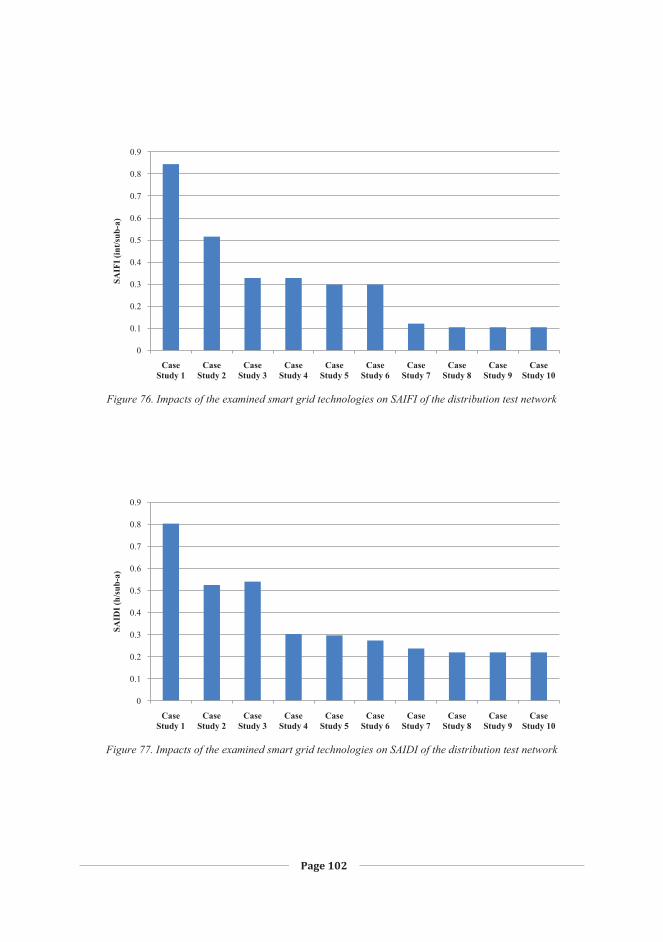
Page 102
Figure 76. Impacts of the examined smart grid technologies on SAIFI of the distribution test network
Figure 77. Impacts of the examined smart grid technologies on SAIDI of the distribution test network
0
0.1
0.2
0.3
0.4
0.5
0.6
0.7
0.8
0.9
Case Study 1
Case Study 2
Case Study 3
Case Study 4
Case Study 5
Case Study 6
Case Study 7
Case Study 8
Case Study 9
Case Study 10
SAIF
I (in
t/sub
-a)
0
0.1
0.2
0.3
0.4
0.5
0.6
0.7
0.8
0.9
Case Study 1
Case Study 2
Case Study 3
Case Study 4
Case Study 5
Case Study 6
Case Study 7
Case Study 8
Case Study 9
Case Study 10
SAID
I (h/
sub-
a)

Page 103
Figure 78. Impacts of the examined smart grid technologies on MAIFI of the distribution test network
Figure 79. Impacts of the examined smart grid technologies on AVSSI of the distribution test network
0.04
0.06
0.07
0.09
0.10
0.12
0.13
0.15
0.16
Case Study 1
Case Study 2
Case Study 3
Case Study 4
Case Study 5
Case Study 6
Case Study 7
Case Study 8
Case Study 9
Case Study 10
MA
IFI (
eve/
sub-
a)
0.80
0.85
0.90
0.95
1.00
1.05
1.10
1.15
1.20
1.25
Case Study 1
Case Study 2
Case Study 3
Case Study 4
Case Study 5
Case Study 6
Case Study 7
Case Study 8
Case Study 9
Case Study 10
AV
SSI (
eve/
sub-
a)

Page 104
Figure 80. Impacts of the examined smart grid technologies on the annual cost of the service reliability issues
imposed on the customers of the distribution test network
Figure 81. Impacts of the examined smart grid technologies on the burdens on the utility repair crews
20000
45000
70000
95000
120000
145000
170000
Case Study 1
Case Study 2
Case Study 3
Case Study 4
Case Study 5
Case Study 6
Case Study 7
Case Study 8
Case Study 9
Case Study 10
Ann
ual C
ost (
€/a)
Sustained Interruptions Momentary Interruptions Voltage Sags
70
72
74
76
78
80
82
Case Study 1
Case Study 2
Case Study 3
Case Study 4
Case Study 5
Case Study 6
Case Study 7
Case Study 8
Case Study 9
Case Study 10
Cre
w B
urde
n (h
/a)

Page 105
6.4 Impacts of Operational Failure of Smart Grid Technologies
In the previous sections, the reliability impacts of major smart grid technologies were evaluated
and compared against each other. When conducting the related reliability studies, it was assumed
that the implemented smart grid technologies are fully reliable. This assumption may not be correct.
Similarly to other components of an electricity distribution network, the implemented smart grid
technologies may have some failure modes. However, the advanced smart grid technologies are
normally equipped with sophisticated fault diagnosis algorithms that automatically monitor the
status of devices and initiate a suitable alarm if required. Therefore, some of the failure modes of
the implemented smart grid technologies are detected and mitigated during normal operating status
of an electric power distribution network. But, there is always a chance to face a situation where a
device is required to do specific tasks in response to an abnormal condition but fails to function
properly. This failure condition, which is referred to as operational failure mode, may cause serious
reliability impacts.
In order to evaluate the reliability impacts of operational failure modes of a smart grid
technology, it is necessary to use a specific reliability model. This reliability model normally
represents the possible statuses that a smart grid technology may reside when it fully functions and
also when it encounters with various operational failure modes. The targeted functions of a smart
grid technology may be altered due to its operational failure modes. Therefore, for each status of the
reliability model, specific functions of a smart grid technology are available and the others are
unavailable. Although, it is possible to deduce a suitable reliability model for representing the
operational failure modes of a smart grid technology, but there is a common problem: the data. A
smart grid technology should remain in service for a quite long time in order to gather the data that
are of interest for modeling its operational failure modes.
In this section, for illustrative purposes, the reliability impacts of operational failure modes are
evaluated for two of the examined smart grid technologies. They are distance to fault estimators and
fault current limiters. For sake of simplicity and also due to lack of the relevant data, it is assumed
that the targeted smart grid technology operates successfully in 95 percents of times and encounters
with an operational failure 5 percents of times. However, in [140] - [145], the operational failure
modes have been analyzed in more details for several feeder automation schemes.

Page 106
6.4.1 Case Study 11: Impacts of Operational Failure of Distance to Fault Estimators
This case study aims to evaluate and compare the effects of the operational failure of distance to
fault estimators on the reliability indices of the distribution test network. The basic data related to
the fault management activities are assumed similar to that of the Case Study 2.
The system oriented reliability indices for this case study are represented in Table 17. The study
results show that virtually all the reliability indices have been deteriorated compared to those of the
Case Study 2. The degree of deteriorations ranges from 1 to 3 percents. Actually, when employing
the distance to fault estimators, a much smaller zone of the electricity distribution network is
required to be inspected by the repair crews. Therefore, much less trial and error switching actions
are required to find the faulted section. However, in a situation that the distance to fault estimators
encounter with the operational failure condition, the repair crews have to use the trial and error
switching method to find the faulted zone. This process is time consuming as the repair crews have
to travel around the network and perform the necessary switching activities. As a result, both the
frequency and duration of sustained interruptions are increased.
The trial and error switching operations for fault location purposes normally cause the re-
ignition of a fault. The effects of the fault re-ignition appear to the customers supplied by the other
healthy feeders either as a momentary interruption or a voltage sag. Therefore, as the study results
indicate, the reliability indices associated with the momentary interruptions and voltage sags have
also been deteriorate compared to the Case Study 2.
The results presented in Table 17 also show that the burden on the utility crews is increased
compared to the Case Study 2. This is because more field activities are required to find the faulted
section when the distance to fault estimators encounter with the operational failure conditions.

Page 107
TABLE 17 SYSTEM ORIENTED RELIABILITY INDICES FOR CASE STUDY 11
Reliability Index Expected Value Relative Change to Case Study 2 (%)
SAIFI (int/sub-a) 0.5324 +3.19 SAIDI (h/sub-a) 0.5383 +2.66 MAIFI (eve/sub-a) 0.0541 +1.96 AVSSI (eve/sub-a) 1.0315 +0.95 ASUI (%) 0.006145 +2.66 EENS (kWh/a) 3370 +2.81 ECOSTSI (€/a) 91267 +2.89 ECOSTMI (€/a) 932 +2.03 ECOSTVS (€/a) 17797 +0.98 Total Cost (€/a) 109995 +2.57 Repair Crew Burden (h/a) 76.19 +0.29
6.4.2 Case Study 12: Impacts of Operational Failure of Fault Current Limiters
This case study aims to evaluate and compare the effects of the operational failure of the fault
current limiters on the reliability indices of the distribution test network. The basic data related to
the fault management activities are assumed similar to that of the Case Study 9. When conducting
this case study, it is assumed that each feeder circuit breaker can interrupt short circuit currents up
to 4500 amperes.
The system oriented reliability indices for this case study are represented in Table 18. The study
results show that the reliability indices associated with the momentary interruptions and voltage
sags have been a little bit deteriorated compared to the Case Study 9. The degree of deteriorations is
less than 1.5 percents. Actually, when a fault current limiter fails to operate successfully, a much
higher fault current is expected compared to the situation when it operates successfully. This
condition can cause a momentary interruption or a voltage sag for the customers supplied by the
other healthy feeders. In a situation where a fault current limiter fails to operate successfully and the
fault current is above the interrupting capability of the feeder circuit breaker, the backup circuit
breakers have to operate for interrupting the fault current. This will result in an interruption for
several feeders. However, the substation automation scheme can detect this abnormal condition and
automatically perform the necessary switching operations to restore the power of the affected
healthy feeders. As a result, the duration of such an interruption is limited well below the threshold

Page 108
of the momentary interruptions. There are also conditions where a fault current limiter fails to
operate successfully but the fault current is below the interrupting capability of the feeder circuit
breaker. In this situation, the circuit breaker of the faulted feeder operates to interrupt the fault
current. Situation like this normally causes a voltage sag for the customers supplied by the other
healthy feeders.
It should be noted that factors such as existing of the substation automation scheme, small value
of operational failure probability for the fault current limiters, feasibility of the feeder circuit
breakers for interrupting the fault currents within their ratings, no contribution from single-phase to
ground faults in the over-current fault conditions, decreasing the fault current and its effects on the
customers for faults far from the main substation have caused the impact of the operational failure
of the fault current limiters to be as small as that observed in this case study.
TABLE 18
SYSTEM ORIENTED RELIABILITY INDICES FOR CASE STUDY 12
Reliability Index Expected Value Relative Change to Case Study 9 (%)
SAIFI (int/sub-a) 0.1050 0.00 SAIDI (h/sub-a) 0.2195 0.00 MAIFI (eve/sub-a) 0.1237 +1.48 AVSSI (eve/sub-a) 0.8949 +0.40 ASUI (%) 0.002505 0.00 EENS (kWh/a) 1353 0.00 ECOSTSI (€/a) 34547 0.00 ECOSTMI (€/a) 2106 +1.49 ECOSTVS (€/a) 15424 +0.40 Total Cost (€/a) 52077 +0.18 Repair Crew Burden (h/a) 71.67 0.00

Page 109
7 CONCLUSIONS
This doctoral research project was aimed at developing an approach for predicting the reliability
impacts of advanced reliability enhancement solutions within the functional zone of an electric
power distribution system. The results indicate that the impacts of the reliability enhancement
solutions are revealed through the various processes involved in the fault management activities.
When employing a given set of the smart grid technologies, some of the fault management activities
are affected which finally alter the reliability of electric power delivered to the customers. Thereby,
the proposed reliability evaluation approach was such designed that the impacts of the targeted
smart grid technologies can be evaluated from their effects on the fault management activities. This
reliability assessment technique is capable of predicting the impacts of targeted reliability
enhancement solutions on the sustained interruptions, momentary interruptions and voltage sags
experienced by the end-users.
Various smart grid technologies, applicable in the functional zone of an electricity distribution
system, were identified during this doctoral research project. The fault passage indicators, fault
locator schemes, substation automation, feeder automation, distribution automation, fault current
limiters and dynamic voltage restorers were recognized as the major smart grid technologies
applicable for distribution system reliability improvements. Therefore, in order to demonstrate the
capabilities of the proposed reliability evaluation approach and also to have some ideas about the
possible effects of the identified smart grid technologies, it was necessary to conduct a course of
reliability case studies on a realistic power distribution system. Hence, considerable effort was put
forth to develop a computer software that can be used for reliability evaluation of smart distribution
grids. This software is now available and can be used for estimating the impacts of various
distribution system reliability enhancement solutions.
Two groups of the reliability case studies were directed in this doctoral thesis. The first group
included ten comparative case studies which aimed at comparing the reliability impacts of the
identified smart grid technologies. An integrating approach was used for dealing with these case
studies. The ultimate goal was to provide a premium electricity service for the customers of the
distribution test network. The studies were started from a benchmark case study. Then, in the next
case studies, a suitable smart grid technology was integrated to the last upgraded case study. The
study results showed that employing a suitable set of the smart grid technologies in the distribution
test network can mitigate all the reliability indices within a range of 30 to 88 percents. The study
results also indicated that, using a suitable set of the smart grid technologies, it is possible to reduce

Page 110
the range of variation of reliability indices among different customers. In addition, more than 10
percents reduction on the burden on the utility repair crews were observed when employing
appropriate set of the smart grid technologies. The second group of the reliability case studies aimed
at evaluating the effects of operational failure of the implemented smart grid technologies. The
distance to fault estimators and the fault current limiters were selected for purposes of this study.
The study results indicated that the operational failure of the targeted smart grid technologies can
deteriorate the service reliability. However, whenever there are some facilities for supporting fault
management activities while the targeted smart grid technology fails to operate successfully, it is
possible to mitigate the overall impacts of such failures. The first case study in this group was
concerned with the operational failure of the distance to fault estimators. In this case study, when
the distance to fault estimators encounter with the operational failure condition, there was no other
facilities for approximate location of the fault. Therefore, the repair crews had to use the trial and
error switching method to find the faulted zone. This process is time consuming and normally
causes the re-ignition of the fault. Hence, all the reliability indices associated with the sustained
interruptions, momentary interruptions and voltage sags were deteriorated in this case study.
However, the second case study which was concerned with the operational failure of the fault
current limiters showed different results. In this case study, the substation automation scheme
available in the main substation was able to automatically detect and mitigate the abnormal
condition arising from the operational failure of the fault current limiters. As a result, the overall
impact of the operational failure of the fault current limiters on the service reliability was
insignificant.
The smart grid technologies examined in this doctoral thesis are already available in the market.
However, there are some other technologies still in the research and development stage. The
reliability evaluation procedure proposed in this doctoral thesis can be used for evaluating the
impacts of emerging distribution system reliability enhancement technologies as well. The main
requirement is to know how the targeted technologies may affect the process involved with the fault
management activities.

Page 111
8 REFERENCES
[1] R. Billinton, R. N. Allan, “Reliability Evaluation of Power Systems”, Plenum Press, Second Edition, 1996.
[2] R. E. Brown, A. P. Hanson, H. L. Willis, F. A. Luedtke, M. F. Born, “Assessing the Reliability of Distribution Systems”, IEEE Computer Applications in Power, January 2001, pp. 44-49.
[3] R. E. Brown, “Electric Power Distribution Reliability”, Marcel Dekker, Second Edition, 2009.
[4] A. T. Brint, W. R. Hodgkings, D. M. Rigler, S. A. Smith, “Evaluating Strategies for Reliable Distribution”, IEEE Computer Applications in Power, July 1998, pp. 43-47.
[5] T. Short, L. Taylor, D. Power, “Practical Approaches to Reliability Improvement”, Transmission & Distribution World, May 2004.
[6] Y. Zhou, J. H. Spare, “Optimizing Reliability Project Portfolios for Electric Distribution Companies”, in Proceedings of the 2007 IEEE Power Engineering Society General Meeting, 24-28 June 2007, pp. 1-5.
[7] J. R. Redmon, “Traditional Versus Automated Approaches to Reliability”, in Proceedings of the 2001 IEEE/PES Summer Power Meeting, 2001, pp. 739-742.
[8] T. F. Tsao, H. C. Chang, “Comparative Case Studies for Value-Based Distribution System Reliability Planning”, Electric Power Systems Research, Vol. 68, Issue 3, March 2004, pp. 229–237.
[9] A. A. Chowdhury, D. O. Koval, “Current Practices and Customer Value-Based Distribution System Reliability Planning”, IEEE Transactions on Industry Applications, Vol. 40, No. 5, September/October 2004, pp. 1174-1182.
[10] J. M. Sohn, S. R. Nam, J. K. Park, “Value-Based Radial Distribution System Reliability Optimization”, IEEE Transactions on Power Systems, Vol. 21, No. 2, May 2006, pp. 941-947.
[11] R. Billinton, “Bibliography on the Application of Probability Methods in Power System Reliability Evaluation”, IEEE Transactions on Power Apparatus and Systems, Vol. PAS91, No. 2, March/Apr. 1972, pp. 649-660.
[12] IEEE Working Group on Distribution System Reliability, Distribution Subcommittee of the Transmission and Distribution Committee, “Bibliography on Distribution System Reliability”, IEEE Transactions on Power Apparatus and Systems, Vol. PAS-97, No. 2, March/April 1978, pp. 545-548.
[13] IEEE Subcommittee on the Application of Probability Methods, Power System Engineering Committee, “Bibliography on the Application of Probability Methods in Power System Reliability Evaluation”, IEEE Transactions on Power Apparatus and Systems, Vol. PAS-97, No. 6, Nov./Dec. 1978, pp. 2235-2242.

Page 112
[14] R. N. Allan, R. Billinton, S. H. Lee, “Bibliography on the Application of Probability Methods in Power System Reliability Evaluation”, IEEE Transactions on Power Apparatus and Systems, Vol. PAS-103, No. 2, Feb. 1984, pp. 275-282.
[15] R. N. Allan, R. Billinton, S. M. Shahidehpour, C. Singh, “Bibliography on the Application of Probability Methods in Power System Reliability Evaluation”, IEEE Transactions on Power Systems, Vol. 3, No. 4, Nov. 1988, pp. 1555-1564.
[16] R. N. Allan, R. Billinton, A. M. Breipohl, C. H. Grigg, “Bibliography on the Application of Probability Methods in Power System Reliability Evaluation”, IEEE Transactions on Power Systems, Vol. 9, No. 1, Feb. 1994, pp. 41-49.
[17] R. N. Allan, R. Billinton, A. M. Breipohl, C. H. Grigg, “Bibliography on the Application of Probability Methods in Power System Reliability Evaluation”, IEEE Transactions on Power Systems, Vol. 14, No. 1, Feb. 1999, pp. 51-57.
[18] R. Billinton, M. Fotuhi-Firuzabad, L. Bertling, “Bibliography on the Application of Probability Methods in Power System Reliability Evaluation: 1996–1999”, IEEE Transactions on Power Systems, Vol. 16, No. 4, Nov. 2001, pp. 595-602.
[19] IEEE Recommended Practice for Monitoring Electric Power Quality, IEEE Standard 1159, New York, 2009.
[20] Math H. J. Bollen, “Understanding Power Quality Problems: Voltage Sags and Interruptions”, New Jersey, USA, IEEE Press, 1999.
[21] J. Northcote-Green, R. Wilson, “Control and Automation of Electric Power Distribution Systems”, CRC Press, First Edition, 2007.
[22] D. M. Staszesky, D. Craig, C. Befus, “Advance Feeder Automation is Here”, IEEE Power and Energy Magazine, September/October 2005, pp. 56-63.
[23] “System View of the Modern Grid”, Document Prepared by the National Energy Technology Laboratory for the U.S. Department of Energy, Office of Electricity Delivery and Energy Reliability, January 2007, [online]. Available: http://www.netl.doe.gov/smartgrid/refshelf.html
[24] M. Lehtonen, “Fault Management in Electrical Distribution System”, Final report of the CIRED Working Group WG03 Fault Management, Espoo, Finland, December 22, 1998.
[25] Y. Tang, H. F. Wang, R. K. Aggarwal, A. T. Johns, “Fault Indicators in Transmission and Distribution Systems”, in Proceedings of the IEEE International Conference on Electric Utility Deregulation and Restructuring and Power Technologies 2000, City University, London, 4-7 April 2000, pp. 238-243].
[26] IEEE Standard C37.114, “IEEE Guide for Determining Fault Location on AC Transmission and Distribution Lines”, June 2005.

Page 113
[27] A. Newbould, L. Hu, K. Chapman, “Cable Automation for Urban Distribution Systems”, in Proceedings of IEE Conference on Developments in Power System Protection, 2001, No.479, pp. 319-322.
[28] A. Campoccia, M. L. Di Silvestre, I. Incontrera, E. Riva Sanseverino, C. Spataro, “Applicational Aspects of a New Diagnostic Methodology for Fault Location in MV Networks Problems, Solutions and Improvements”, in Proceedings of 2005 International Conference on Future Power Systems, Nov. 2005, pp. 1-6.
[29] V. N. Gohokar, V. V. Gohokar, “Fault Location in Automated Distribution Network”, in Proceedings of 2005 IEEE International Symposium on Circuits and Systems, ISCAS 2005, Kobe, Japan, 23-26 May 2005, pp. 3898-3901.
[30] S. Bagley, D. Branca, “A New Approach to Find Fault Locations on Distribution Feeder Circuits”, in Proceedings of 2007 IEEE Rural Electric Power Conference, Rapid City, South Dakota, 6-8 May 2007, pp. B5-1-4.
[31] G. E. Hager, R. N. Medicine Bear, A. S. Baum, “Automated Distribution Fault Locating System”, IEEE Transactions on Industry Applications, Vol. 32, No. 3, May/June 1996, pp. 704-708.
[32] J. Zhu, D. L. Lubkeman, A. A. Girgis, “Automated Fault Location and Diagnosis on Electric Power Distribution Feeders”, IEEE Transactions on Power Delivery, Vol. 12, No. 2, April 1997, pp. 801-809.
[33] J. P. Krivine, F. R Monclar, P. Järventausta, P. Verho, J. Partanen, M. P. Bongrain, M. Kärenlampi, “Comparison of Fault Management Application in French and Finnish Distribution Control Centers”, in Proceedings of 14th International Conference and Exhibition on Electricity Distribution, CIRED 1997, Birmingham, UK, 2 - 5 June 1997, Vol. 4, pp. 6.1-6.5.
[34] M. Lehtonen, A. Matsinen, E. Antila, J. Kuru, P. Vuorenpää, E. Matinlassi, S. Pettissalo, “Automatic Fault Management in Distribution Networks”, in Proceedings of 16th International Conference on Electricity Distribution, CIRED 2001, Amsterdam, 18 - 21 June 2001.
[35] R. Apel, C. Jaborowicz, R. Kussel, “Fault Management in Electrical Distribution Networks”, in Proceedings of 16th International Conference on Electricity Distribution, CIRED 2001, Amsterdam, 18 - 21 June 2001, Paper No. 3.7.
[36] M. S. Choi, S. J. Lee, D. S. Lee, B. G. Jin, “A New Fault Location Algorithm Using Direct Circuit Analysis for Distribution Systems”, IEEE Transactions on Power Delivery, Vol. 19, No. 1, January 2004, pp. 35-41.
[37] S. J. Lee, M. S. Choi, S. H. Kang, B. G. Jin, D. S. Lee, B. S. Ahn, N. S. Yoon, H. Y. Kim, S. B. Wee, “An Intelligent and Efficient Fault Location and Diagnosis Scheme for Radial Distribution Systems”, IEEE Transactions on Power Delivery, Vol. 19, No. 2, April 2004, pp. 524-532.
[38] E. C. Senger, G. Manassero, C. Goldemberg, E. L. Pellini, “Automated Fault Location System for Primary Distribution Networks”, IEEE Transactions on Power Delivery, Vol. 20, No. 2, April 2005, pp. 1332-1340.
Page 114
[39] R. H. Salim, K. R. Caino de Oliveira, A. D. Filomena, M. Resener, A. S. Bretas, “Hybrid Fault Diagnosis Scheme Implementation for Power Distribution Systems Automation”, IEEE Transactions on Power Delivery, Vol. 23, No. 4, October 2008, pp. 1846-1856.
[40] X. Yang, M. S. Choi, S. J. Lee,C. W. Ten, S. I. Lim, “Fault Location for Underground Power Cable Using Distributed Parameter Approach”, IEEE Transactions on Power Systems, Vol. 23, No. 4, November 2008, pp. 1809-1816.
[41] B. Lundqvist , H. Kronander , and A. J. Mackrell, “The Integration of Protection, Monitoring, Control and Communication Functions in Modem Electrical HV Installations”, in Proceedings of the Sixth International Conference on Developments in Power System Protection, Nottingham, UK, March 1997, pp. 176-179.
[42] S. Trabulus, “General Configuration of Automation System within a High Voltage Power Substation”, in Proceedings of Canadian Conference on Electrical and Computer Engineering, 2000, Vol. 2, pp. 1167-1171.
[43] D. Proudfoot, “Information Technologies for Substation Automation Applications”, in Proceedings of 2001 IEEE Power Engineering Society Transmission and Distribution Conference, Vol. 1, 2001, pp. 349-361.
[44] S. Bricker, T. Gonen, L. Rubin, “Substation Automation Technologies and Advantages”, IEEE Computer Applications in Power, Vol. 14, No. 3, July, 2001, pp. 31-37.
[45] N. Kusano, “New Trends in Protection Relays and Substation Automation Systems in Japan”, in Proceedings of 2002 IEEE/PES Transmission and Distribution Conference and Exhibition, 2002, Vol. 1, pp. 624-628.
[46] I. D. Kim, “Experiences and Future Prospects on the Digital Relay Application and Substation Automation”, in Proceedings of 2002 IEEE/PES Transmission and Distribution Conference and Exhibition, 2002, Vol. 1, pp. 613-617.
[47] M. Kezunovic, “Future Trends in Protective Relaying, Substation Automation, Testing and Related Standardization”, in Proceedings of 2002 IEEE Power Engineering Society Transmission and Distribution Conference, Vol. 1, ASIA PACIFIC, 2002, pp. 598-602.
[48] M. Kosakada, H. Watanabe, T. Ito, Y. Sameda, Y. Minami, M. Saito, S. Maruyama, “Integrated Substation Systems-Harmonizing Primary Equipment with Control and Protection Systems”, in Proceedings of 2002 IEEE/PES Transmission and Distribution Conference and Exhibition, 2002, Vol. 2, pp. 1020-1025.
[49] D. P. Buse, P. Sun, Q. H. Wu, J. Fitch, “Agent-Based Substation Automation”, IEEE Power & Energy Magazine, Vol. 1, No. 2, March-April 2003, pp. 50-55.
[50] S. Haacke, S. Border, D. Stevens, B. Uluski, “Plan Ahead for Substation Automation”, IEEE Power & Energy Magazine, Vol. 1, No. 2, March-April 2003, pp. 32-41.

Page 115
[51] S. Zhao, X. Jia, B. Li, J. Yuan, G. Yue, “Remote Automatic Monitoring and Diagnosis Status of Substation Based on Computer Image Processing”, in Proceedings of 2004 International Conference on Power System Technology, 2004, Vol. 2, pp. 1179-1182.
[52] Q. H. Wu, J. Q. Feng, W. H. Tang, J. Fitch, “Multi-Agent Based Substation Automation Systems”, in Proceedings of 2005 IEEE Power Engineering Society General Meeting, 2005, Vol. 2, pp. 1048-1049.
[53] T. S. Sidhu, P. K. Gangadharan, “Control and Automation of Power System Substation using IEC61850 Communication”, in Proceedings of 2005 IEEE International Conference on Control Applications (CCA), 2005, pp. 1331-1336.
[54] J. Amantegui, I. Ojanguren, C. de Carlos, F. Cobelo, R. Quintanilla, “Automation of HV Substations in Iberdrola: Experiences and Plans”, in Proceedings of 2005 IEEE Annual Conference for Protective Relay Engineers, 2005, pp. 194-200.
[55] IEEE Task Group on State of the Art Distribution System Design, “Bibliography on Distribution Automation: 1969-1982”, IEEE Transactions on Power Apparatus and Systems, Vol. PAS-103, No. 6, June 1984, pp. 1176-1182.
[56] J. A. Stuart, C. W. Hood, “Rural Distribution System Automation”, in Proceedings of IEE Colloquium on Improving Supply Security on 11 kV Overhead Networks, London, UK, 1988, pp. 27/1-9.
[57] L. Jackson, E. P. Burdis, A. Bennett, “The Design and Application of Automated Switchgear for Urban and Rural MV Systems”, in Proceedings of 10th International Conference on Electricity Distribution, CIRED 1989, Brighton, UK, 8-12 May 1989, Vol. 1, pp. 12-17.
[58] L. H. Winnie, H. Yueh, D. J. Allen, “Auto-Loop Improvement”, IEEE Transactions on Power Delivery, Vol. 9, No. 2, April 1994, pp. 828-832.
[59] C. Ennis, R. Clarke, J. S. Smart, “Automation of Overhead Line Distribution Systems”, in Proceedings of 4th IEE International Conference on Trends in Distribution Switchgear, London, UK, 7 - 9 November 1994, pp. 90-94.
[60] D. G. Hart, D. Uy, J. Northcote-Green, C. LaPlace, D. Novose, “Automated Solutions for Distribution Feeders”, IEEE Computer Applications in Power, October 2000, pp. 25-30.
[61] H. Liu, H. Singh, D. Walder, “New Triple-Single Reclosers Improve Distribution Reliability”, in Proceedings of the IEEE Rural Electric Power Conference, 29 April – 1 May 2001, pp. D2/1-6.
[62] J. L. McElray, V. Gharpure, “Loop Control Schemes Increase Restoration”, in Proceedings of IEEE/PES Transmission and Distribution Conference and Exposition, Atlanta, GA, USA, 28 November – 2 December 2001, Vol. 1, pp. 171-176.
[63] L. A. Kojovic, T. R. Day, “Advanced Distribution System Automation”, in proceedings of IEEE/PES Transmission and Distribution Conference and Exposition, 7-12 Sept. 2003, Vol. 1, pp. 348 -353.

Page 116
[64] R. E. Goodin, T. S. Fahey, A. Hanson, “Distribution Reliability Using Reclosers and Sectionlisers”, ABB Inc., February 2004, Document No.: 1VAL2601-WP.
[65] D. R. Joens, T. Weir, “Application of Single Phase Sectionalizers with Three Phase Reclosers to Increase Reliability”, in Proceedings of the 2004 IEEE Rural Electric Power Conference, 23-25 May 2004, pp. B2-1-9.
[66] D. M. Staszesky, “Use of Virtual Agents to Effect Intelligent Distribution Automation”, in Proceedings of the 2006 IEEE-PES General Meeting, Montreal, Quebec, Canada, 18-22 June 2006, pp. 1-6.
[67] D. Elizalde, D. Staszesky, M. Meisinger, “Use of Distributed Intelligence for Reliability Improvement using Minimum Available Distribution Assets”, in Proceedings of IEEE/PES Transmission and Distribution Conference and Exposition, Latin America, August 2006, pp. 1-6.
[68] T. S. Fahey, N. V. Burbure, “Three-Phase Reclosers with Single-Phase Tripping Capability Improve Distribution System Reliability”, IEEE Power and Energy Magazine, Vol. 6, No. 2, March/April 2008, pp. 46-52.
[69] C. McCarthy, D. Staszesky, “Advancing the State of Looped Distribution Feeders”, Presented by S&C Electric Company at DistribuTECH 2008, Tampa, Florida, January 22-24, 2008.
[70] S. L. Purucker, R. J. Thomas, L. D. Monteen, “Feeder Automation Designs for Installing an Integrated Distribution Control System”, IEEE Transactions on Power Apparatus and Systems, Vol. PAS-104, No. 10, October 1985, pp. 2929-2934.
[71] N. Luu-Quang, B. Paradis, “Installation of Hydro Quebec’s Distribution Feeder Automation System”, IEEE Transactions on Power Delivery, Vol. 3, No. 4, October 1988, pp. 1935-1941.
[72] K. Kato, H. Nagasaka, A. Okimoto, T. Kunieda, T. Nakamura, “Distribution Automation Systems for High Quality Power Supply”, IEEE Transactions on Power Delivery, Vol. 6, No. 3, July 1991, pp. 1196-1204.
[73] M. A. Hughes, “Distribution Automation to Improve Customer Service in the United Kingdom”, Proceedings of the IEE 2nd International Conference on Advances in Power System Control, Operation and Management, Hong Kong, December 1993, pp. 30-36.
[74] M. L. Hammond, A. J. Bower, T. Wade, “The Practical Implementation of an 11 kV Rural Distribution Automation Pilot Scheme”, in Proceedings of the IEE Conference on Developments in Power System Protection, 25-27th March 1997, No. 434, pp. 247-250.
[75] P. Vinter, H. Vikelgaard, A. Berg, L. N. Bjørn, “A Novel Approach to Distribution Grid Automation at NESA A/S”, Proceedings of the Nordic Distribution and Asset Management Conference 2004, 23 August 2003, Pages 1-18.
[76] F. Lorito, M. Mariani, F. Viaro, “Advanced Decentralized Control System for MV/LV Distribution System”, Proceedings of the 14th International Conference on Electricity Distribution, CIRED 1997, Birmingham, UK, 2 - 5 June 1997, Paper No. 4.11.

Page 117
[77] J. Cornell, “Philosophy for Operation of Distribution System Automation Schemes: ACTEW’s Approach”, Proceedings of the IEEE International Conference on Energy Management and Power Delivery, EMPD95, Vol. 1, 1995, pp. 37-42.
[78] T. Genji, M. Shimamoto, K. Kishida, “Development of a High Speed Switching System for Distribution Networks”, IEEE Transactions on Power Delivery, Vol. 13, No. 1, January 1998, pp. 186-193.
[79] Y. Matsumoto, A. Ono, S. Hase, T. Kinoshita, K. Abe, “Development of Advanced Distribution Automation System Using Genetic Algorithm”, Proceedings of the IEEE Power Engineering Society Transmission and Distribution Conference, Vol. 1, ASIA PACIFIC, 2002, pp. 214-219.
[80] A. Fujisawa., N. Kurokawa, “Oversea Distribution Automation System based on Japanese Experience”, Proceedings of the IEEE Power Engineering Society Transmission and Distribution Conference, ASIA & PACIFIC 2002, 6-10 October 2002, pp. 1164-1169.
[81] E. Antila, P. Heine, M. Lehtonen, “Economic Analysis of Implementing Novel Power Distribution Automation”, CIGRE/IEEE PES International Symposium on Quality and Security of Electric Power Delivery Systems, Montreal, Canada, October 8-10, 2003, pp. 121-126.
[82] J. McDonald, “Equipment for Feeder Automation”, IEEE/PES Seminar on the Recent Trends in Feeder Automation, Miami, Florida. June 2, 2005.
[83] J. Fan, X. Zhang, “Feeder Automation within the Scope of Substation Automation”, Proceedings of 2006 IEEE/PES Power Systems Conference and Exposition, PSCE 2006, Atlanta, Georgia, USA, 29 October- 1 November 2006, pp. 607-612.
[84] X. Wen, L. Xiao-lan, W. Yan-jun, J. Hai-tao, Z. Qiang, Z. Jian-min, G. Yu, “The Study of Feeder Automation System Based on Quick Communication Mechanism”, Proceedings of the IEEE 2006 International Conference on Power System Technology, PowerCon2006, Chongqing, China, 22-26 October 2006, pp. 1-9.
[85] I. H. Lim, S. I. Lim, S. J. Lee, M. S. Choi, B. N. Ha, “Multi-Fault Multi-Outage Handling in Primary Distribution Feeder System”, Proceedings of the 2007 IEEE Lausanne PowerTech Conference, PowerTech2007, Lausanne, Switzerland, 1-5 July 2007, pp. 1464-1467.
[86] H. Lim, Y. I. Kim, H. T. Lim, M. S. Choi, S. Hong, S. J. Lee, S. I. Lim, S. W. Lee, and B. N. Ha, “Distributed Restoration System Applying Multi-Agent in Distribution Automation System”, Proceedings of the IEEE Power and Energy Society 2008 General Meeting: Conversion and Delivery of Electrical Energy in the 21st Century, Pittsburg, Pennsylvania, USA, 20-24 July 2008, pp.1-7.
[87] K. Rajamani, R. Vaishnav, “Automation and Information Management for a Large Urban Power Distribution Network”, Proceedings of the 2008 IEEE Power and Energy Society General Meeting - Conversion and Delivery of Electrical Energy in the 21st Century, Pittsburgh, PA, USA, 20-24 July 2008, pp. 1-7.

Page 118
[88] D. Borowski, R. Seamon, “EPRI Project RP2592, Large Scale Distribution Automation and Load Control, Enters Test Year”, IEEE Transactions on Power Delivery, Vol. 5, No. 1, January 1990, pp. 486-492.
[89] B. R. Williams, D. C. Walden, “Distribution Automation Strategy for the Future”, IEEE Computer Applications in Power, July 1994, pp. 16-21.
[90] T. E. Dy-Liacco, “Modern Control Centers and Computer Networking”, IEEE Computer Applications in Power, October 1994, pp. 17-22.
[91] M. V. K. Rao, R. Peri, K. N. Clinard, Dr. C. R. Krishna, J. V. Pandurangam, “Development and Evaluation of a Distribution Automation System for an Indian Utility”, IEEE Transactions on Power Delivery, Vol. 10, No. 1, January 1995, pp. 452-458.
[92] M. Lehtonen, S. Kupari, “A Method for Cost/Benefit Analysis of Distribution Automation”, in Proceedings of 1995 IEEE International Conference on Energy Management and Power Delivery, 1995, Vol. 1, pp. 49-54.
[93] K. Ghoshalm, “Distribution Automation: SCADA Integration Is Key”, IEEE Computer Application in Power, January 1997, pp. 31-35.
[94] B. Watson, C. F. Higgins, “Benefits of Distribution Automation and Performance Results from a Network Trial”, in Proceedings of the IEE Conference on Developments in Power System Protection, 25-27th March 1997, No. 434, pp. 251-255.
[95] N. Cho, B. Ha, “The Results of the Field Test in Distribution Automation System for the Korea Utility”, in Proceedings of the IEEE International Conference on Power System Technology, PowerCon98, Beijing, China, 18-21 August 1998, Vol. 1, pp. 48-52.
[96] B. Wilson, “Integrating Technologies into Distribution Systems Automation in Distribution Networks”, IEE Seminar on Integrating Technologies into Distribution Systems (Ref. No. 1999/078), 1999, pp. 6/1-7.
[97] P. Tannlund, G. Björkman, “An Advanced Distribution Automation System Experience from Application Development and Project Implementation”, in Proceedings of the IEEE International Conference on Power System Technology, PowerCon 2000, Perth, WA, Australia, 4-7 December 2000, Vol. 1, pp. 127-132.
[98] J. Bak-Jensen, H. J. Jørgensen, “Practical Implementation of Distribution Automation”, in Proceedings of the Nordic Distribution and Asset Management Conference 2004, 23 August 2003, Pages 1-11.
[99] F. C. Chan, “Distribution Automation System - from Design to Implementation”, in Proceedings of IEEE 2000 Power Engineering Society Winter Meeting, Singapore, 23-27 January 2000, pp. 2368-2373.

Page 119
[100] R. L. Chen, S. Sabir, “The Benefit of Implementing Distribution Automation and System Monitoring in the Open Electricity Market”, Canadian Conference on Electrical and Computer Engineering, 2001, Toronto, pp. 825-830.
[101] M. Mcgranaghan, F. R. Goodman, “EPRI Research Plan for Advanced Distribution Automation”, IEEE Power Engineering Society 2005 General Meeting, San Francisco, Ca, June 12-16, 2005.
[102] G. Simard, D. Chartrand, “Hydro-Québec's Economic and Technical Approach to Justify its Distribution Automation Program”, IEEE Power Engineering Society General Meeting, 24-28 June 2007, Tampa, FL, USA, pp. 1-5.
[103] R. P. Gupta, R. K. Varma, “Power Distribution Automation: Development and Implementation Experience”, in Proceedings of International Journal of Power and Energy Systems, Issue. 2, 2007, Paper No. 203-3479.
[104] S. Price, M. Mcgranaghan, “Value of Distribution Automation Applications”, California Energy Commission, PIER, Publication No.: CEC 500-2007-028, April 2007.
[105] C. L. Su, J. H. Teng, “Economic Evaluation of a Distribution Automation Project”, IEEE Transactions on Industry Applications, Nov.-Dec. 2007, Vol. 43, No. 6, pp. 1417-1425.
[106] P. G. Slade, J. Wu, E. J. Stacey, W. F. Stubler, R. E. Voshall, J. J. Bonk, J. W. Porter, L. Hong, “The Utility Requirements for a Distribution Fault Current Limiter”, IEEE Transactions on Power Delivery, Vol. 7, No. 2, April 1992, pp. 507-515.
[107] A. Y. Wu, Y. Yin, “Fault-Current Limiter Applications in Medium- and High-Voltage Power Distribution Systems”, IEEE Transactions on Industry Applications, Vol. 34, No. 1, January/February 1998, pp. 236-242.
[108] M. Noe, B. R. Oswald, “Technical and Economical Benefits of Superconducting Fault Current Limiters in Power Systems”, IEEE Transactions on Applied Superconductivity, Vol. 9, No. 2, June 1999, pp. 1347-1350.
[109] J. Cerulli, “Requirements for a Superconducting Fault Current Limiter in the Utility Bus-Tie Location”, in Proceedings of 1999 IEEE Power Engineering Society Winter Meeting, pp 950-955.
[110] S. S. Kalsi, A. Malozemoff, “HTS Fault Current Limiter Concept”, in Proceedings of 2004 Power Engineering Society General Meeting, 10-10 June 2004, pp. 1426 – 1430.
[111] L. Kovalsky, Y. Xing, K. Tekletsadik, A. Keri, J. Bock, F. Breuer, “Applications of Superconducting Fault Current Limiters in Electric Power Transmission Systems”, IEEE Transactions on Applied Superconductivity, Vol. 15, No. 2, June 2005, pp. 2130-2133.
[112] “Fault Current Management Guidebook”, Updated Report, EPRI 1012419, Palo Alto, CA, 2006.

Page 120
[113] E. Chong, J.L. Rasolonjanahary, J. Sturgess, A. Baker, C. Sasse, “A Novel Concept for a Fault Current Limiter”, in Proceedings of the 8th IEE International Conference on AC and DC Power Transmission, 2006, 28-31 March 2006, pp. 251 – 255.
[114] J. J. Zhang, Q. Liu, C. Rehtanz, S. Rudin, “Investigation of Several New Technologies for Mega City Power Grid Issues”, in Proceedings of the International Conference on Power System Technology, 22-26 Oct. 2006, Chongqing, China, pp. 1-6.
[115] C. Neumann, “Superconducting Fault Current Limiter (SFCL) in the Medium and High Voltage Grid”, in Proceedings of 2006 IEEE Power Engineering Society General Meeting, pp 1-6.
[116] M. Noe, A. Kudymow, S. Fink, S. Elschner, F. Breuer, J. Bock, H. Walter, M. Kleimaier, K. H. Weck, C. Neumann, F. Merschel, B. Heyder, U. Schwing, C. Frohne, K. Schippl, M. Stemmle, “Conceptual Design of a 110 kV Resistive Superconducting Fault Current Limiter Using MCP-BSCCO 2212 Bulk Material”, IEEE Transactions on Applied Superconductivity, Vol. 17, No. 2, June 2007, pp. 1784-1787.
[117] B. W. Lee, J. Sim, K. B. Park, I. S. Oh, “Practical Application Issues of Superconducting Fault Current Limiters for Electric Power Systems”, IEEE Transactions on Applied Superconductivity, Vol. 18, No. 2, June 2008, pp. 620-623.
[118] S. W. Middlekauff, E. R. Collins, “System and Customer Impact Considerations for Series Custom Power Devices”, IEEE Transactions on Power Delivery, Vol. 13, No. 1, January 1998, pp. 278-282.
[119] “Technical and Economic Considerations for Power Quality Improvements”, Final Report, EPRI 1005910, Palo Alto, CA, 2001.
[120] J. G. Nielsen, F. Blaabjerg, “Detailed Comparison of System Topologies for Dynamic Voltage Restorers”, IEEE Transactions on Industry Applications, Vol. 41, No. 5, Sept. /Oct. 2005, pp. 1272-1280.
[121] I. Etxeberria-Otadui, U. Viscarret, S. Bacha, M. Caballero, R. Reyero, “Evaluation of Different Strategies for Series Voltage Sag Compensation”, in Proceedings of the 33th Annual Power Electronic Specialists Conference, 2002, pp. 1797-1802.
[122] D. M. Vilathgamuwa, A. A. D. Ranjith Perera, S. S. Choi, “Voltage Sag Compensation With Energy Optimized Dynamic Voltage Restorer”, IEEE Transactions on Power Delivery, Vol. 18, No. 3, July 2003, pp. 928-936.
[123] A. K. Ramasamy, R. K. Iyer, V. K. Ramachandaramuthy, R.N. Mukerjee, “Dynamic Voltage Restorer for Voltage Sag Compensation”, in Proceedings of the International Conference on Power Electronics and Drives Systems, 2005, pp. 1289-1294.
[124] F. Tosato, S. Quaia, “Reducing Voltage Sags through Fault Current Limitation”, IEEE Transactions on Power Delivery, Vol. 16, No. 1, Jan. 2001, pp. 12 – 17.

Page 121
[125] S. Behzadi Rafi, M. Fotuhi-Firuzabad, T. S. Sidhu, “Reliability Enhancement in Switching Substations Using Fault Current Limiters”, in Proceedings of the 9th International Conference on Probabilistic Methods Applied to Power Systems, Stockholm, Sweden, 11-15 June 2006, pp. 1-5.
[126] I. Rahmati, M. Fotuhi-Firuzabad, “ Reliability Evaluation of HV Substations in the Presence of Fault Current Limiter”, in proceedings of 2009 IEEE Bucharest Power Tech Conference, June 28th - July 2nd, 2009, Bucharest, Romania, pp. 1-5.
[127] J. S. Lawler, J. S. Lai, L. D. Monteen, J. B. Patton, D. T. Rizy, “Impact of Automation on the Reliability of the Athens Utilities Board’s Distribution System”, IEEE Transactions on Power Delivery, Vol. 4, No. 1, January 1989, pp. 770-778.
[128] G. Celli, F. Pilo, “Optimal Sectionalizing Switches Allocation in Distribution Networks”, IEEE Transactions on Power Delivery, Vol. 14, No. 3, July 1999, pp. 1167-1172.
[129] E. D. Tuglie, M. L. Scala, G. Patrono, P. Pugliese, F. Torelli, “An Optimal Strategy for Switching Devices Allocation in Radial Distribution Network”, In Proceedings of 2004 IEEE AFRICON Conference in Africa: Technology Innovation, Vol. 2, 2004, pp. 683-689.
[130] D. M. Rigler, W. R. Hodgkins, R. N. Allan, “Quantitative Reliability Analysis of Distribution Systems: Automation”, Power Engineering Journal, August 1999, 201-204.
[131] Y. He, G. Andersson, R. N. Allan, “Modeling the Impact of Automation and Control on the Reliability of Distribution Systems”, in Proceedings of 2000 IEEE Power Engineering Society Transmission and Distribution Conference, Vol. 1, 2000, pp. 79-84.
[132] Y. He, L. Soder, R. N. Allan, “Distribution Automation: Impact of Communication System on Reliability of Automatic Control”, in Proceedings of 2001 IEEE Porto Power Tech Conference 10-13 September 2001, Porto, Portugal, Vol. 3.
[133] R. E. Brown, A. P. Hanson, “Impact of Two-Stage Service Restoration on Distribution Reliability”, IEEE Transactions on Power Systems, Vol. 16, No. 4, November 2001, pp. 624-629.
[134] P. M. S. Carvalho, L. A. F. M. Ferreira, A. J. Cerejo da Silva, “A Decomposition Approach to Optimal Remote Controlled Switch Allocation in Distribution Systems”, IEEE Transactions on Power Delivery, Vol. 20, No. 2, April 2005, pp. 1031-1036.
[135] J. H. Teng, C. N. Lu, “Value-Based Distribution Feeder Automation Planning”, Electrical Power and Energy Systems, Vol. 28, Issue 3, March 2006, pp. 186–194.
[136] C. S. Chen, C. H. Lin, H. J. Chuang, C. S. Li, M.Y. Huang, C. W. Huang, “Optimal Placement of Line Switches for Distribution Automation Systems Using Immune Algorithm”, IEEE Transaction on Power Systems, Vol. 21, No. 3, August 2006, pp. 1209-1217.
[137] M. Fotuhi-Firuzabad, A. Moradi, “Optimal Switch Placement in Distribution Systems using Trinary Particle Swarm Optimization Algorithm”, IEEE Transactions on Power Delivery, Vol. 23, No. 1, Jan. 2008, pp. 271 – 279.
Page 122
[138] J. B. Bunch, J. T. Tengdin, “Reliability Consideration for Distribution Automation Equipment”, IEEE Transactions on Power Apparatus and Systems, Vol. PAS-102, No. 8, August 1983, pp. 2556-2564.
[139] A. Pahwa, J. K. Shultis, D. M. Rucker, W. N. Dowling, “Field Test of Distribution Automation Equipment at Kansas Utilities”, IEEE Transactions on Power Delivery, Vol. 6, No. 4, October 1991, pp. 1564-1572.
[140] S. Kazemi, M. Fotuhi-Firuzabad, R. Billinton, “Reliability Assessment of an Automated Distribution System”, in Proceedings of IET Generation, Transmission and Distribution, Vol. 1, No. 1, March 2007, pp. 223-233.
[141] S. Kazemi, M. Fotuhi–Firuzabad, M. Lehtonen, “Reliability Worth Assessment of an Advanced Centralized Feeder Automation Scheme”, in Proceedings of the IEEE 2008 Annual Electrical Power Conference, EPEC2008, Vancouver, Canada, 6-7 October 2008, pp. 1-8.
[142] S. Kazemi, M. Fotuhi–Firuzabad, M. Sanaye-Pasand, M, Lehtonen, “Impacts of Loop Restoration Strategy on Distribution System Reliability”, in Proceedings of the 2009 IEEE Bucharest PowerTech Conference, Bucharest, Romania, 28 June - 2 July 2009.
[143] S. Kazemi, M. Fotuhi–Firuzabad, M. Sanaye-Pasand, M. Lehtonen, “Impacts of Automatic Control Systems of Loop Restoration Scheme on the Distribution System Reliability”, in Proceedings of IET Generation, Transmission and Distribution, Vol. 3, No. 10, October 2009, pp. 891-902.
[144] S. Kazemi, M. Lehtonen, M. Fotuhi–Firuzabad, “A Comprehensive Approach for Reliability Worth Assessment of the Automated Fault Management Schemes”, in Proceedings of 2010 IEEE/PES Transmission and Distribution Conference and Exhibition, New Orleans, Louisiana, USA, 19-22 April 2010.
[145] S. Kazemi, M. Lehtonen, M. Fotuhi–Firuzabad, “Reliability Worth Assessment of an Automatic Loop Restoration Scheme for Urban Distribution Networks”, in Proceedings of 2010 IEEE/PES Conference on Innovative Smart Grid Technologies Europe, Gothenburg, Sweden, 11-13 October 2010.
[146] S. Kazemi, M. Lehtonen, M. Fotuhi–Firuzabad, “Applications of Distribution Automation Technologies for Improving Reliability of Power Distribution Systems”, IEEE Transactions on Smart Grid (Under Review).
[147] S. Kazemi, M. Lehtonen, M. Fotuhi–Firuzabad, “Impacts of Fault Diagnosis Schemes on Distribution System Reliability”, IEEE Transactions on Smart Grid (Under Review).
[148] M. Yasir, “A Novel Approach for Assessing the Impact of Voltage Sag Events on Customer Operations”, Master’s Thesis, Aalto University, Espoo, Finland, March 2011.
[149] P. Heine, P. Pohjanheimo, M. Lehtonen, E. Lakervi, “A Method for Estimating the Frequency and Cost of Voltage Sags”, IEEE Transactions on Power Systems, Vol. 17, No. 2, May 2002, pp. 290-296.

Page 123
[150] P. Heine, M. Lehtonen, “Voltage Sag Distributions Caused by Power System Faults”, IEEE Transactions on Power Systems, Vol. 18, No. 4, November 2003, pp. 1367-1373.
[151] ITI (CBEMA) Curve (Revised 2000), [online]. Available: http://www.itic.org/clientuploads/Oct2000Curve.pdf.
[152] IEEE Guide for Electric Power Distribution Reliability Indices, IEEE Standard 1366, New York, 2003.
[153] IEEE Recommended Practice for the Design of Reliable Industrial and Commercial Power Systems, IEEE Standard 493, New York, 2007.

Page 124
Appendix I: Basic Data of Distribution Substations of the Distribution Test Network
Substation Number
X and Y Coordinates with Respect to the HV/MV Substation
(meters)
Peak Demand (kVA)
Transformer Rating (kVA)
Transformer Impedance (%)
Interruption Cost *
€/kW €/kWh
1 3497 6925 154.00 315 4 2.39 27.60 2 2965 6574 118.00 200 4 0.64 7.41 3 2515 6812 117.00 200 4 3.52 24.50 4 1956 7249 167.00 315 4 3.52 24.50 5 1142 7013 25.90 100 4 2.65 29.90 6 3155 6870 63.60 100 4 2.65 29.90 7 2691 5509 91.40 200 4 2.65 29.90 8 4919 5411 176.00 315 4 2.65 29.90 9 4227 7015 256.00 500 4 2.65 29.90
10 5575 6598 195.00 315 4 2.65 29.90 11 5031 3604 29.80 100 4 2.65 29.90 12 3983 3649 96.10 200 4 3.52 24.50 13 4221 1870 73.20 200 4 2.65 29.90 14 1821 1696 35.70 100 4 2.65 29.90 15 514 787 94.00 200 4 2.65 29.90 16 -211 1145 119.00 200 4 3.52 24.50 17 -685 1596 211.00 315 4 2.65 29.90 18 -1198 -575 27.40 100 4 2.65 29.90 19 -2669 683 58.10 100 4 2.65 29.90 20 -3591 1158 39.60 100 4 2.00 22.60 21 -2710 3137 198.00 315 4 1.86 18.00 22 -3969 4898 34.00 100 4 1.75 17.10 23 -3561 6535 83.90 200 4 2.05 20.60 24 2260 776 53.00 100 4 2.46 24.10 25 834 -573 86.30 200 4 2.07 23.30 26 2617 -1856 95.10 200 4 1.86 16.10 27 4636 -719 30.90 100 4 2.65 29.90 28 6433 -2175 27.60 100 4 3.52 24.50 29 7073 -1002 31.50 100 4 2.43 27.90 30 4529 -4177 68.60 100 4 2.27 24.80 31 1083 -1995 40.00 100 4 2.26 25.10 32 277 -4041 99.10 200 4 2.50 28.30 33 -332 -5689 22.30 100 4 2.33 26.30 34 -637 -8328 49.90 100 4 2.65 29.90
* These values represent the overall per-unit interruption costs for all the customers supplied by the dedicated substations. In this thesis, the financial impacts of the sustained interruptions and momentary interruptions are estimated by the following equations: Cost of a Sustained Interruption = [(Peak Demand of the Substation — in kW) × (Load Factor of the Substation — in per unit)] ×
[(Value Corresponding to €/kW) + ((Length of the Interruption — in h) × (Value Corresponding to €/kWh)] Cost of a Momentary Interruption = (Peak Demand of the Substation — in kW) × (Load Factor of the Substation — in per unit) ×
(Value Corresponding to €/kW) In this thesis, the financial impacts on a customer due to an interruption resulted from a voltage sag is assumed equal to that of a momentary interruption. However, on availability of the required data, the technique described in [148] can be used to gain more accurate results.
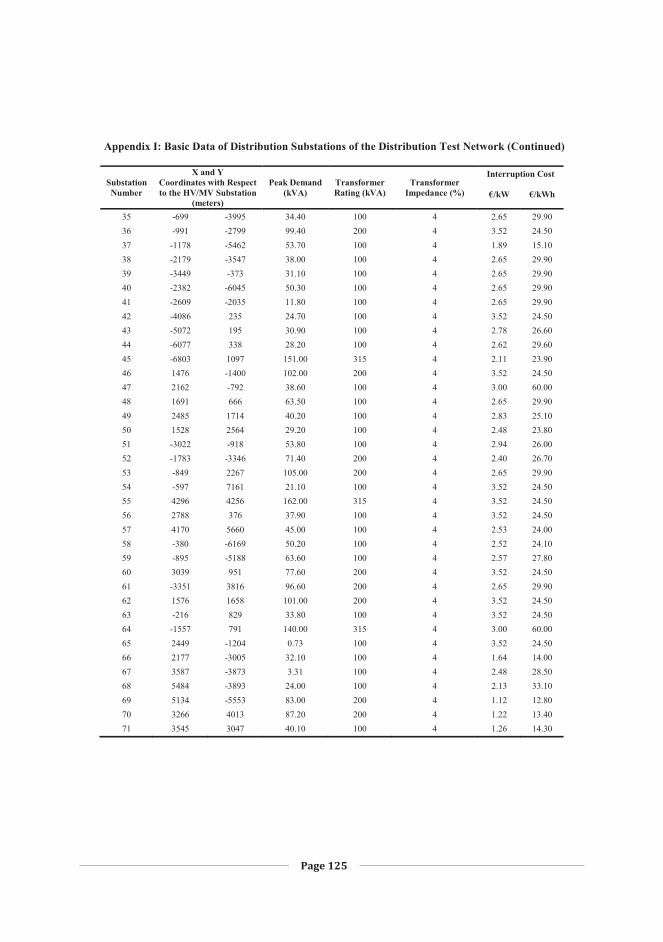
Page 125
Appendix I: Basic Data of Distribution Substations of the Distribution Test Network (Continued)
Substation Number
X and Y Coordinates with Respect to the HV/MV Substation
(meters)
Peak Demand (kVA)
Transformer Rating (kVA)
Transformer Impedance (%)
Interruption Cost
€/kW €/kWh
35 -699 -3995 34.40 100 4 2.65 29.90 36 -991 -2799 99.40 200 4 3.52 24.50 37 -1178 -5462 53.70 100 4 1.89 15.10 38 -2179 -3547 38.00 100 4 2.65 29.90 39 -3449 -373 31.10 100 4 2.65 29.90 40 -2382 -6045 50.30 100 4 2.65 29.90 41 -2609 -2035 11.80 100 4 2.65 29.90 42 -4086 235 24.70 100 4 3.52 24.50 43 -5072 195 30.90 100 4 2.78 26.60 44 -6077 338 28.20 100 4 2.62 29.60 45 -6803 1097 151.00 315 4 2.11 23.90 46 1476 -1400 102.00 200 4 3.52 24.50 47 2162 -792 38.60 100 4 3.00 60.00 48 1691 666 63.50 100 4 2.65 29.90 49 2485 1714 40.20 100 4 2.83 25.10 50 1528 2564 29.20 100 4 2.48 23.80 51 -3022 -918 53.80 100 4 2.94 26.00 52 -1783 -3346 71.40 200 4 2.40 26.70 53 -849 2267 105.00 200 4 2.65 29.90 54 -597 7161 21.10 100 4 3.52 24.50 55 4296 4256 162.00 315 4 3.52 24.50 56 2788 376 37.90 100 4 3.52 24.50 57 4170 5660 45.00 100 4 2.53 24.00 58 -380 -6169 50.20 100 4 2.52 24.10 59 -895 -5188 63.60 100 4 2.57 27.80 60 3039 951 77.60 200 4 3.52 24.50 61 -3351 3816 96.60 200 4 2.65 29.90 62 1576 1658 101.00 200 4 3.52 24.50 63 -216 829 33.80 100 4 3.52 24.50 64 -1557 791 140.00 315 4 3.00 60.00 65 2449 -1204 0.73 100 4 3.52 24.50 66 2177 -3005 32.10 100 4 1.64 14.00 67 3587 -3873 3.31 100 4 2.48 28.50 68 5484 -3893 24.00 100 4 2.13 33.10 69 5134 -5553 83.00 200 4 1.12 12.80 70 3266 4013 87.20 200 4 1.22 13.40 71 3545 3047 40.10 100 4 1.26 14.30

Page 126
Appendix I: Basic Data of Distribution Substations of the Distribution Test Network (Continued)
Substation Number
X and Y Coordinates with Respect to the HV/MV Substation
(meters)
Peak Demand (kVA)
Transformer Rating (kVA)
Transformer Impedance (%)
Interruption Cost
€/kW €/kWh
72 -455 -7338 24.40 100 4 1.36 15.80 73 -3881 5996 91.60 200 4 1.75 21.60 74 2645 221 18.00 100 4 2.65 29.90 75 5451 -1372 49.90 100 4 3.52 24.50 76 -4134 1266 56.50 100 4 2.65 29.90 77 194 -7762 37.30 100 4 3.52 24.50 78 583 -3037 7.10 100 4 2.65 29.90 79 675 -5038 85.80 200 4 2.65 29.90 80 -480 -6658 15.40 100 4 3.52 24.50 81 -6863 3145 23.60 100 4 3.52 24.50 82 1802 1177 170.00 315 4 3.52 24.50 83 2206 5249 11.40 100 4 3.52 24.50 84 -2914 -5439 124.00 200 4 0.78 10.20 85 1811 -316 10.20 100 4 2.29 19.20 86 2120 -6673 58.60 100 4 1.41 17.90 87 3213 -1499 56.40 100 4 2.30 33.80 88 2934 -2601 55.60 100 4 1.64 19.20 89 -1557 -1671 24.20 100 4 0.87 10.40 90 -2159 790 29.20 100 4 1.40 15.90 91 -3384 -6466 55.40 100 4 2.65 29.90 92 -3142 -6779 39.30 100 4 2.65 29.90 93 -4108 3609 65.10 100 4 2.65 29.90 94 -3792 4282 192.00 315 4 2.65 29.90 95 -3259 -7597 87.80 200 4 3.52 24.50 96 -1043 1164 20.60 100 4 1.86 22.30 97 -3993 5299 25.50 100 4 1.67 15.30 98 873 6592 49.40 100 4 0.73 7.86 99 932 666 14.00 100 4 1.50 16.00 100 2837 906 54.40 100 4 2.35 18.10 101 853 3136 42.70 100 4 2.62 33.20 102 1497 4561 36.30 100 4 2.49 31.10 103 -1507 -4020 58.50 100 4 3.52 24.50 104 5816 6778 99.90 200 4 2.65 29.90 105 2967 4330 64.70 100 4 3.52 24.50 106 2802 3950 177.00 315 4 2.65 29.90 107 4393 5093 158.00 315 4 3.52 24.50 108 4607 5788 85.50 200 4 1.26 14.30

Page 127
Appendix I: Basic Data of Distribution Substations of the Distribution Test Network (Continued)
Substation Number
X and Y Coordinates with Respect to the HV/MV Substation
(meters)
Peak Demand (kVA)
Transformer Rating (kVA)
Transformer Impedance (%)
Interruption Cost
€/kW €/kWh
109 3933 7208 2.43 100 4 1.36 15.80 110 1181 752 22.30 100 4 1.75 21.60 111 -4626 175 21.70 100 4 2.65 29.90 112 -2593 -2543 11.40 100 4 3.52 24.50 113 -3135 957 13.60 100 4 2.65 29.90 114 -2358 3880 101.00 200 4 3.52 24.50 115 3002 5620 23.60 100 4 2.65 29.90 116 -3036 6922 32.80 100 4 2.65 29.90 117 -1516 -5281 7.36 100 4 3.52 24.50 118 -3357 -3882 6.07 100 4 3.52 24.50 119 6707 -4831 143.00 315 4 3.52 24.50 120 1708 -853 89.00 200 4 3.52 24.50 121 1392 7198 45.20 100 4 0.78 10.20 122 4638 5043 16.20 100 4 2.29 19.20 123 2014 -2118 32.00 100 4 1.41 17.90 124 5338 -310 22.70 100 4 2.30 33.80 125 -1664 -1079 889.00 1250 6 1.64 19.20 126 5667 -809 6.11 100 4 0.87 10.40 127 1932 -1026 81.40 200 4 1.40 15.90 128 1462 -2557 78.20 200 4 2.65 29.90 129 4788 1618 103.00 200 4 2.65 29.90 130 4497 4737 49.90 100 4 2.65 29.90 131 5198 5085 54.60 100 4 2.65 29.90 132 974 -1950 38.50 100 4 3.52 24.50 133 -252 1785 53.40 100 4 1.86 22.30 134 -112 -4489 43.50 100 4 1.67 15.30 135 -1284 -8806 23.70 100 4 0.73 7.86 136 -935 -7814 120.00 200 4 1.50 16.00 137 -2310 -6382 29.70 100 4 2.35 18.10 138 2814 5268 32.90 100 4 2.62 33.20 139 -909 -3515 31.80 100 4 2.49 31.10 140 -7667 3212 57.30 100 4 3.52 24.50 141 5818 -1917 35.30 100 4 2.65 29.90 142 178 407 14.30 100 4 3.52 24.50 143 -588 -4359 42.20 100 4 2.65 29.90 144 -1773 -4714 34.90 100 4 3.52 24.50

Page 128
Appendix II: Basic Data of Underground Cables used in the Distribution Test Network
Cable Size Rated Voltage (kV)
Positive (Negative) Sequence Impedance (ohms/m)
Zero Sequence Impedance (ohms/m) Rated
Current (A) Resistance Inductance Resistance Inductance
1 24 0.000451 0.000132 0.001804 0.000528 155 2 24 0.000262 0.000123 0.001048 0.000492 210

Page 129
Appendix III: Basic Data of Sections of the Distribution Test Network
Leaving Substation
Switching Device
Entering Substation
Switching Device
Exposure (meters)
Cable Size
Emergency Rating (%)
Main Yes 142 No 628 2 120 Main Yes 18 No 1879 2 120 Main Yes 25 Yes 1431 2 120 Main Yes 63 No 1212 2 120 Main Yes 89 No 3230 2 120 Main Yes 99 No 1620 2 120
1 Yes 109 No 735 2 120 2 No 3 No 720 1 120 2 Yes 6 No 497 2 120 3 Yes 4 No 1003 1 120 4 Yes 121 No 801 1 120 5 Yes 98 No 707 1 120 6 No 1 Yes 490 2 120 7 Yes 83 No 778 2 120 7 Yes 115 No 467 2 120 8 Yes 108 No 692 2 120 8 Yes 131 No 607 1 120 9 Yes 10 Yes 1995 1 120
10 Yes 104 No 425 1 120 12 Yes 55 Yes 966 2 120 12 Yes 70 No 1137 1 120 13 Yes 71 No 1920 2 120 13 No 129 No 877 1 120 14 Yes 49 No 939 1 120 14 No 62 No 351 2 120 15 Yes 82 Yes 1903 2 120 16 Yes 17 Yes 925 2 120 17 Yes 53 No 977 1 120 17 Yes 96 No 793 1 120 17 Yes 133 No 668 1 120 18 No 125 Yes 971 2 120 19 Yes 113 No 765 1 120 20 No 76 No 783 1 120 21 Yes 61 No 1321 1 120 21 Yes 114 No 1163 1 120 22 No 97 No 568 1 120 23 No 116 No 922 1 120 24 No 100 Yes 836 2 120

Page 130
Appendix III: Basic Data of Sections of the Distribution Test Network (Continued)
Leaving Substation
Switching Device
Entering Substation
Switching Device
Exposure (meters)
Cable Size
Emergency Rating (%)
25 Yes 120 Yes 1298 2 120 26 Yes 87 No 983 1 120 26 Yes 88 No 1145 1 120 26 Yes 123 No 930 1 120 27 No 124 No 1149 1 120 28 Yes 29 No 1890 1 120 30 Yes 68 No 1409 1 120 30 Yes 69 No 2126 1 120 31 No 128 Yes 959 1 120 31 No 132 No 167 1 120 32 Yes 78 No 1484 1 120 33 No 58 No 682 1 120 34 No 135 No 1138 1 120 35 No 143 No 538 1 120 37 No 59 Yes 557 2 120 38 No 52 No 628 2 120 38 Yes 118 No 1732 1 120 39 No 51 Yes 979 2 120 40 Yes 84 No 1140 1 120 40 Yes 137 No 487 1 120 41 No 112 No 719 2 120 42 Yes 39 No 1245 2 120 42 No 111 No 768 1 120 43 Yes 44 No 1436 1 120 44 No 45 No 1485 1 120 45 Yes 81 No 2898 1 120 46 No 127 No 834 1 120 47 Yes 65 No 710 2 120 48 Yes 24 No 820 2 120 50 No 101 Yes 1251 2 120 51 Yes 125 Yes 1934 2 120 52 Yes 103 No 1030 2 120 53 Yes 21 No 2905 1 120 55 Yes 11 No 1389 1 120 55 Yes 130 No 737 2 120 56 No 74 No 298 1 120 58 Yes 80 No 706 1 120 59 Yes 33 No 1066 1 120

Page 131
Appendix III: Basic Data of Sections of the Distribution Test Network (Continued)
Leaving Substation
Switching Device
Entering Substation
Switching Device
Exposure (meters)
Cable Size
Emergency Rating (%)
59 Yes 143 Yes 1250 1 120 60 Yes 13 Yes 2117 2 120 61 Yes 94 No 907 1 120 62 Yes 50 No 1283 2 120 63 No 16 Yes 447 2 120 64 Yes 90 No 851 1 120 65 No 26 Yes 952 2 120 67 No 30 No 1400 1 120 68 No 119 No 2180 1 120 70 No 105 No 616 1 120 71 No 12 Yes 1053 2 120 72 Yes 77 No 1096 1 120 72 No 136 No 956 1 120 73 Yes 23 No 886 1 120 75 Yes 141 No 929 1 120 76 Yes 42 Yes 1460 1 120 79 Yes 86 No 3086 1 120 80 No 72 No 962 1 120 81 No 140 No 1141 1 120 82 Yes 14 Yes 734 2 120 83 No 102 Yes 1397 2 120 87 Yes 27 No 2295 1 120 88 Yes 67 No 2022 1 120 89 No 41 Yes 1574 2 120 90 Yes 19 Yes 737 1 120 92 Yes 91 No 560 1 120 92 Yes 95 No 1169 1 120 94 Yes 22 No 906 1 120 94 Yes 93 No 1051 1 120 96 No 64 Yes 898 1 120 97 No 73 No 998 1 120 98 No 54 No 2229 1 120 99 No 110 No 373 2 120 100 Yes 56 No 753 1 120 100 No 60 No 293 2 120 101 Yes 102 Yes 2211 2 120 103 Yes 144 No 1051 2 120 105 No 106 No 586 1 120

Page 132
Appendix III: Basic Data of Sections of the Distribution Test Network (Continued)
Leaving Substation
Switching Device
Entering Substation
Switching Device
Exposure (meters)
Cable Size
Emergency Rating (%)
108 Yes 10 Yes 1785 2 120 108 No 57 No 644 1 120 109 Yes 9 No 497 2 120 110 No 48 Yes 731 2 120 111 No 43 No 631 1 120 112 No 38 Yes 1536 2 120 113 No 20 Yes 705 1 120 115 No 2 Yes 1350 2 120 117 Yes 37 No 542 2 120 117 No 40 No 1633 1 120 120 No 85 No 773 1 120 120 No 127 Yes 400 2 120 121 No 5 No 440 1 120 122 Yes 8 Yes 655 2 120 122 No 107 No 354 1 120 123 No 128 Yes 997 1 120 124 Yes 126 No 845 1 120 126 No 75 No 853 1 120 127 Yes 47 No 464 2 120 128 Yes 66 No 1193 1 120 128 Yes 78 No 1416 1 120 130 No 122 Yes 476 2 120 134 Yes 32 Yes 839 1 120 134 No 79 No 1357 1 120 136 Yes 34 No 840 1 120 137 No 92 No 1304 1 120 138 No 7 No 383 1 120 139 No 35 Yes 741 1 120 139 No 36 No 1019 1 120 141 No 28 No 943 1 120 142 No 15 Yes 717 2 120 143 Yes 134 Yes 698 1 120 144 No 117 Yes 880 2 120

Page 133
Appendix IV: Basic Data of Overhead Lines of the Sub-Transmission Test Network
Sending Bus
Receiving Bus
Circuit Number Conductor Type Length
(km) Resistance
(Ω/km) Reactance
(Ω/km) Rating (MVA)
6 12 1 2 Finch 3.018 0.027 0.260 410
4 6 1 2 Duck 5.902 0.049 0.282 281
4 6 2 2 Duck 5.810 0.049 0.282 281
6 7 1 2 Duck & 3*2000Cu 4.660 0.058 0.252 225
6 7 2 2 Duck & 3*2000Cu 4.700 0.058 0.252 225
2 6 1 2 Finch 8.600 0.027 0.266 410
8 15 1 2 Duck 3.708 0.049 0.279 281
8 15 2 2 Duck 3.722 0.049 0.279 281
3 15 1 2 Duck 8.368 0.049 0.291 281
3 15 2 2 Duck 8.368 0.049 0.291 281
2 9 1 2 Finch 3.927 0.027 0.262 410
8 19 1 2 Duck 3.611 0.049 0.285 281
5 19 1 2 Duck 3.373 0.049 0.297 281
9 12 1 2 Finch 1.761 0.027 0.256 410
5 8 1 2 Duck 6.991 0.049 0.296 281
7 8 1 Ibis 6.164 0.142 0.390 110
7 8 2 Ibis 6.197 0.142 0.390 110
3 7 1 2 Duck 7.717 0.049 0.287 281
7 14 1 2 Duck 3.637 0.049 0.287 281
3 13 1 2 Duck 4.820 0.049 0.285 281
3 11 1 2 Duck 8.243 0.049 0.324 281
9 11 1 2 Duck 7.552 0.049 0.294 281
1 2 1 2 Finch 5.496 0.027 0.265 410
1 2 2 2 Finch 5.496 0.027 0.265 410
13 14 1 2 Duck 3.637 0.049 0.287 281

Page 134
Appendix V: Basic Data of Underground Cables of the Sub-Transmission Test Network
Sending Bus
Receiving Bus
Circuit Number Conductor Type Length
(km) Resistance
(Ω/km) Reactance
(Ω/km)
Nominal Rating (MVA)
6 10 1 3x300Al 4.100 0.125 0.141 82
6 10 2 3x300Al 4.040 0.125 0.141 82
21 21 1 3x800Al 0.985 0.053 0.116 134
4 22 1 3x300Cu & 3x800Al 3.896 0.069 0.119 104
4 22 2 3x800Al 4.542 0.054 0.128 134
23 24 1 3x300Cu & 3x800Al 1.38 0.074 0.142 104
4 24 1 3x300Cu & 3x800Al 2.083 0.076 0.133 104
4 24 2 3x800Al 2.593 0.054 0.126 134
5 23 1 3x300Cu & 3x800Al 3.147 0.082 0.129 104
17 18 1 3x400Cu & 3x800Al 1.64 0.054 0.120 120
7 17 1 3x400Cu & 3x800Al 4.50 0.066 0.114 120
16 17 1 3x800Al 0.45 0.145 0.195 134
5 21 1 3x300Cu & 3x800Al 2.259 0.079 0.136 104
5 20 1 3x800Al 3.093 0.053 0.116 134
4 20 1 3x800Al 3.603 0.051 0.123 134
4 18 1 3x400Cu & 3x800Al 1.95 0.058 0.118 120
4 18 2 3x800Al 2.241 0.053 0.128 134