3 user pref routing valr
128
Initial VALR (Step 1 V3) Document information Project Title User Preferred Routing Project Number 07.05.03 Project Manager NORACON Deliverable Name Initial VALR (Step 1 V3) Deliverable ID D06 Edition 00.00.03 Template Version 03.00.00 Task contributors NORACON, EUROCONTROL Abstract The present document is the Validation Report (VALR) for the V3 SESAR Step 1 User Preferred Routing (UPR) validation activities of P07.05.03. It is largely based on free routing initiatives already on-going within the European Civil Aviation Conference (ECAC) area. It describes two activities that contribute to the validation of UPR: SESAR Step 1 Free Routing MUAC - a Real Time Simulation (RTS) investigating and simulating specific User Preferred Routing (UPR) scenarios by using direct routing between published entry/exit waypoints; SESAR Step 1 Free Routing Live Trial in Northern European airspace - a Live Trial investigating the feasibility of UPR in Northern European airspace, including cross- border and cross-FAB operations.
description
http://www.sesarju.eu/sites/default/files/solutions/3_User_Pref_Routing_VALR.pdf
Transcript of 3 user pref routing valr
Initial VALR (Step 1 V3)
Document information
Project Title User Preferred Routing
Project Number 07.05.03
Project Manager NORACON
Deliverable Name Initial VALR (Step 1 V3)
Deliverable ID D06
Edition 00.00.03
Template Version 03.00.00
Task contributors
NORACON, EUROCONTROL
Abstract
The present document is the Validation Report (VALR) for the V3 SESAR Step 1 User
Preferred Routing (UPR) validation activities of P07.05.03. It is largely based on free
routing initiatives already on-going within the European Civil Aviation Conference
(ECAC) area. It describes two activities that contribute to the validation of UPR:
SESAR Step 1 Free Routing MUAC - a Real Time Simulation (RTS) investigating
and simulating specific User Preferred Routing (UPR) scenarios by using direct routing
between published entry/exit waypoints;
SESAR Step 1 Free Routing Live Trial in Northern European airspace - a Live
Trial investigating the feasibility of UPR in Northern European airspace, including cross-
border and cross-FAB operations.

Project Number 07.05.03 Edition 00.00.03 D06 - Validation Report
2 of 128
©SESAR JOINT UNDERTAKING, 2011. Created by AVINOR for the SESAR Joint Undertaking within the frame of the SESAR
Programme co-financed by the EU and EUROCONTROL. Reprint with approval of publisher and the source properly acknowledged.
Authoring & Approval
Prepared By - Authors of the document.
Name & Company Position & Title Date
Sarah Dain, Rory Hedman, Peter Weeks Think Research on behalf of AVINOR
VP-465 Contributor (Section 6.2) and Results Consolidation
31/07/2013
Hamid Kadour, EUROCONTROL VP-571 Contributor (Section 6.1) 18/04/2013
Reviewed By - Reviewers internal to the project.
Name & Company Position & Title Date
<Name / Company> <Position / Title> <DD/MM/YYYY>
Reviewed By - Other SESAR projects, Airspace Users, staff association, military, Industrial Support, other organisations.
Name & Company Position & Title Date
<Name / Company> <Position / Title> <DD/MM/YYYY>
Approved for submission to the SJU By - Representatives of the company involved in the project.
Name & Company Position & Title Date
<Name / Company> <Position / Title> <DD/MM/YYYY>
Rejected By - Representatives of the company involved in the project.
Name & Company Position & Title Date
<Name / Company> <Position / Title> <DD/MM/YYYY>
Rational for rejection
None.
Document History
Edition Date Status Author Justification
00.00.01 19/02/2013 Draft EUROCONTROL
First version. General section updated according to template. Fill-in EXE-VP571 results (Section 6.1).
00.00.02 18/04/2012 Revised Draft EUROCONTROL Updated success criteria Corrected Issues with SJU template
00.00.03 31/07/2013 Revised Draft Sarah Dain Rory Hedman Peter Weeks
Update following SESAR assessment review and VP-465 (Section 6.2). Results consolidation.
Intellectual Property Rights (foreground)
The foreground is owned by the SJU.

Project Number 07.05.03 Edition 00.00.03 D06 - Validation Report
3 of 128
©SESAR JOINT UNDERTAKING, 2011. Created by AVINOR for the SESAR Joint Undertaking within the frame of the SESAR
Programme co-financed by the EU and EUROCONTROL. Reprint with approval of publisher and the source properly acknowledged.
Table of Contents
TABLE OF CONTENTS ..................................................................................................................................... 3
LIST OF TABLES ................................................................................................................................................ 5
LIST OF FIGURES .............................................................................................................................................. 5
EXECUTIVE SUMMARY .................................................................................................................................... 7
1 INTRODUCTION .......................................................................................................................................... 9
1.1 PURPOSE OF THE DOCUMENT .............................................................................................................. 9 1.2 INTENDED READERSHIP ........................................................................................................................ 9 1.3 STRUCTURE OF THE DOCUMENT .......................................................................................................... 9 1.4 GLOSSARY OF TERMS ......................................................................................................................... 10 1.5 ACRONYMS AND TERMINOLOGY ......................................................................................................... 11
2 CONTEXT OF THE VALIDATION .......................................................................................................... 16
2.1 CONCEPT OVERVIEW .......................................................................................................................... 16 2.2 SUMMARY OF VALIDATION EXERCISES............................................................................................... 19
2.2.1 Summary of Expected Exercise Outcomes .............................................................................. 19 2.2.2 Benefit Mechanisms Investigated .............................................................................................. 20 2.2.3 Summary of Validation Objectives and Success Criteria ....................................................... 26 2.2.4 Summary of Validation Scenarios ............................................................................................. 33 2.2.5 Summary of Assumptions ........................................................................................................... 34 2.2.6 Choice of Methods and Techniques .......................................................................................... 35 2.2.7 Validation Exercise List and Dependencies ............................................................................. 35
3 CONDUCT OF VALIDATION EXERCISES .......................................................................................... 36
3.1 EXERCISES PREPARATION .................................................................................................................. 36 3.2 EXERCISES EXECUTION ...................................................................................................................... 36 3.3 DEVIATIONS FROM THE PLANNED ACTIVITIES .................................................................................... 36
3.3.1 Deviations with Respect to the Validation Strategy ................................................................ 36 3.3.2 Deviations with Respect to the Validation Plan ....................................................................... 36
4 EXERCISES RESULTS ............................................................................................................................ 39
4.1 SUMMARY OF EXERCISES RESULTS ................................................................................................... 39 4.1.1 Results on Concept Clarification ................................................................................................ 41 4.1.2 Results per KPA ........................................................................................................................... 42 4.1.3 Results impacting Regulation and Standardisation Initiatives ............................................... 44
4.2 ANALYSIS OF EXERCISES RESULTS ................................................................................................... 45 4.2.1 Unexpected Behaviours/Results ................................................................................................ 54
4.3 CONFIDENCE IN RESULTS OF VALIDATION EXERCISES ...................................................................... 54 4.3.1 Quality of Validation Exercise Results ...................................................................................... 54 4.3.2 Significance of Validation Exercise Results ............................................................................. 54
5 CONCLUSIONS AND RECOMMENDATIONS .................................................................................... 55
5.1 CONCLUSIONS ..................................................................................................................................... 55 5.2 RECOMMENDATIONS ........................................................................................................................... 58
5.2.1 Recommendations on Concept and Procedures..................................................................... 58 5.2.2 Recommendations on Key Performance Areas ...................................................................... 58 5.2.3 Recommendations for Future Validation Exercises/Planning ............................................... 58
6 VALIDATION EXERCISES REPORTS .................................................................................................. 60
6.1 FREE ROUTING VIA DIRECT ROUTES, MUAC REAL TIME SIMULATION (EXE-07.05.03-VP-571) REPORT ............................................................................................................................................................ 60
6.1.1 Exercise Scope ............................................................................................................................. 60 6.1.2 Conduct of Validation Exercise .................................................................................................. 60 6.1.3 Exercise Results ........................................................................................................................... 71 6.1.4 Conclusions and Recommendations ......................................................................................... 95

Project Number 07.05.03 Edition 00.00.03 D06 - Validation Report
4 of 128
©SESAR JOINT UNDERTAKING, 2011. Created by AVINOR for the SESAR Joint Undertaking within the frame of the SESAR
Programme co-financed by the EU and EUROCONTROL. Reprint with approval of publisher and the source properly acknowledged.
6.2 LIVE TRIAL IN NORACON AIRSPACE ADDRESSING FREE ROUTE OPERATIONS USING
INTERMEDIATE WAYPOINTS (EXE-07.05.03-VP-465) REPORT .................................................................... 98 6.2.1 Exercise Scope ............................................................................................................................. 98 6.2.2 Conduct of Validation Exercise .................................................................................................. 98 6.2.3 Exercise Results ......................................................................................................................... 104 6.2.4 Conclusions and Recommendations ....................................................................................... 124
7 REFERENCES ......................................................................................................................................... 128
7.1 APPLICABLE DOCUMENTS ................................................................................................................. 128 7.2 REFERENCE DOCUMENTS ................................................................................................................ 128
Project Number 07.05.03 Edition 00.00.03 D06 - Validation Report
5 of 128
©SESAR JOINT UNDERTAKING, 2011. Created by AVINOR for the SESAR Joint Undertaking within the frame of the SESAR
Programme co-financed by the EU and EUROCONTROL. Reprint with approval of publisher and the source properly acknowledged.
List of tables
Table 1: EXE-07.05.03-VP-571 Concept Overview .............................................................................. 17 Table 2: EXE-07.05.03-VP-465 Concept Overview .............................................................................. 18 Table 3: Breakdown of OFA targets ...................................................................................................... 19 Table 4: Stakeholder Validation Expectations ...................................................................................... 19 Table 5: Choice of metrics and indicators ............................................................................................. 33 Table 6: Validation Scenarios ............................................................................................................... 33 Table 7: Validation Assumptions ........................................................................................................... 34 Table 8: Methods and Techniques ........................................................................................................ 35 Table 9: P07.05.03 Exercises execution/analysis dates ....................................................................... 36 Table 10: VP-571: Updated Brussels simulation runs planning ............................................................ 37 Table 11: OBJ-07.05.03-VALP-A007.0070 and Success Criterion ...................................................... 37 Table 12: OBJ-07.05.03-VALP-A008.0080 and Success Criterion ...................................................... 38 Table 13: Summary of Validation Objective Results (consolidated across all exercises) .................... 40 Table 14: Summary of Validation Objective Results for all exercises .................................................. 53 Table 15: Average efficiency results for total flights within each scenario compared to OFA targets .. 55 Table 16: Brussels Sectors list .............................................................................................................. 61 Table 17: Hannover Sector list .............................................................................................................. 62 Table 18: DECO Sector List .................................................................................................................. 64 Table 19: List of VP-571 used military areas ........................................................................................ 66 Table 20: Scenarios for VP-571 ............................................................................................................ 68 Table 21: Number of run per scenarios within VP-571 ......................................................................... 68 Table 22: Number of flights simulated by sector group. ....................................................................... 68 Table 23 - Simulation Timetable ........................................................................................................... 70 Table 24: VP-571: Updated Brussels simulation runs planning ............................................................ 71 Table 25: Summary of exercise results for VP-571 .............................................................................. 72 Table 26: Different Route Categories ................................................................................................... 73 Table 27: Performance Indicators ......................................................................................................... 94 Table 28: VP-465 Baseline Scenarios .................................................................................................. 98 Table 29: Scenarios for VP-465 ............................................................................................................ 99 Table 30: Participating Flights in Trial ................................................................................................. 100 Table 31 - Details of Non UPR and UPR FPLs................................................................................... 102 Table 32: Summary of exercise results for VP-465 ............................................................................ 105 Table 33: Amount of Questionnaire Responses from Trial ................................................................ 113 Table 34: Performance Indicators ....................................................................................................... 123 Table 35: Efficiency results for total FPLs within each scenario compared to OFA targets ............... 125
List of figures
Figure 1: Benefit Mechanism Flexibility, Efficiency and Predictability .................................................. 20 Figure 2: Benefit Mechanism for Environmental Sustainability ............................................................. 22 Figure 3: Benefit Mechanism for Capacity ............................................................................................ 23 Figure 4: Benefit Mechanism for Operational Feasibility and Cost Effectiveness ................................ 25 Figure 5: Validation Exercises List and Dependencies ......................................................................... 35 Figure 6: Simulation Room Layout VP-571 ........................................................................................... 60 Figure 7: View of MUAC Airspace ........................................................................................................ 61 Figure 8: Brussels sector configurations ............................................................................................... 62 Figure 9: Hanover sector configurations ............................................................................................... 64 Figure 10: DECO sector configurations ................................................................................................ 65 Figure 11: Military Anchor Points 1 ....................................................................................................... 67 Figure 12: Military Anchor Points 2 ....................................................................................................... 67 Figure 13: Night, near-night and weekend DCTs (Scenario SCN-07.05.03-VALP-B001.0001) issue areas ..................................................................................................................................................... 73 Figure 14: Validated H24/7 DCTs ......................................................................................................... 74 Figure 15: Active AMC avoided by DCTs using anchor points ............................................................. 75 Figure 16: Active AMC area filed through ............................................................................................. 75

Project Number 07.05.03 Edition 00.00.03 D06 - Validation Report
6 of 128
©SESAR JOINT UNDERTAKING, 2011. Created by AVINOR for the SESAR Joint Undertaking within the frame of the SESAR
Programme co-financed by the EU and EUROCONTROL. Reprint with approval of publisher and the source properly acknowledged.
Figure 17: Flown trajectories with tactical rerouting to avoid AMC manageable area .......................... 76 Figure 18: Flight density with tactical rerouting to avoid AMC area ...................................................... 76 Figure 19: Level of predicted conflicts with and without anchor points ................................................. 77 Figure 20: Flown distance reduction (%) .............................................................................................. 78 Figure 21: Scenario SCN-07.05.03-VALP-E001.0001 - Flown Distance per Flights (NM) ................... 78 Figure 22: Difference in Distance Flown per Flight with/without anchor points .................................... 79 Figure 23: Brussels Scenario SCN-07.05.03-VALP-B001.0001 - Standard Routing Vs. UPR for Night/Weekend ...................................................................................................................................... 80 Figure 24: Brussels Scenario SCN-07.05.03-VALP-C001.0001 Standard Routing Vs. UPR for H24/7 .............................................................................................................................................................. 81 Figure 25: Hannover Scenario SCN-07.05.03-VALP-B001.0001 - Standard Routing vs. UPR for Night/weekend ...................................................................................................................................... 82 Figure 26: Hannover Scenario SCN-07.05.03-VALP-C001.0001 - Standard Routing Vs. UPR for H24/7 ..................................................................................................................................................... 83 Figure 27: Deco Scenario SCN-07.05.03-VALP-B001.0001 - Standard Routing Vs. UPR for Night/Weekends .................................................................................................................................... 84 Figure 28: Deco Scenario SCN-07.05.03-VALP-C001.0001 - Standard Routing Vs. UPR for H24/7 .. 85 Figure 29: Environmental Impact during Scenario SCN-07.05.03-VALP-B001.0001 (Night and weekend DCTs) .................................................................................................................................... 86 Figure 30: Environmental Impact for Scenario SCN-07.05.03-VALP-C001.0001 (H24/7 DCTs) ......... 87 Figure 31: Environmental Impact for Scenario SCN-07.05.03-VALP-E001.0001 Flights through ARES when active using anchor points ........................................................................................................... 87 Figure 32: Safety of the scenario .......................................................................................................... 88 Figure 33: Acceptability of Controller Tasks ......................................................................................... 88 Figure 34: Acceptability of the Workload .............................................................................................. 89 Figure 35: Iceland Air Non UPR FPLs Vs. UPR FPLs ........................................................................ 100 Figure 36: SAS Non UPR FPLs Vs. UPR FPLs .................................................................................. 101 Figure 37: Emirates Non UPR FPLs Vs. UPR FPLs ........................................................................... 101 Figure 38: Distance Saving Percentage Comparing UPR FPLs and Non UPR FPLs for Each Airline (Emirates, n=4; SAS, n=28) ................................................................................................................ 106 Figure 39: Average Difference between FPL and Great Circle Comparing Airline and UPR/Non UPR FPLs .................................................................................................................................................... 106 Figure 40: Time Saving Percentage Comparing UPR and Non UPR FPLs for Each Airline (Emirates, n=4; SAS, n=28) .................................................................................................................................. 107 Figure 41: Fuel Saving Percentage Comparing UPR and Non UPR FPLs for Each Airline (Emirates, n=4; Iceland Air, n=42; SAS, n=28) .................................................................................................... 108 Figure 42: Proportion of Most Cost Effective FPLs Comparing UPR and Non UPR .......................... 110 Figure 43: Cost Saving Percentage Comparing UPR and Non UPR FPLs for Iceland Air (Iceland Air, n=42) ................................................................................................................................................... 111 Figure 44: Correlation between Fuel Saving and Cost Saving For Iceland Air Comparing UPR and Non UPR FPLs .................................................................................................................................... 111 Figure 45 : Proportion of UPR/Non UPR FPLs Flown as Planned According to Controller Feedback ............................................................................................................................................................ 112 Figure 46: Impact of UPR/Non UPR FPLs that were flown on Safety Comparing Scenarios from Controller Perspective ......................................................................................................................... 114 Figure 47: Impact of UPR/Non UPR FPLs that were flown on Other Traffic Comparing Scenarios from Controller Perspective ......................................................................................................................... 115 Figure 48: Impact of UPR/Non UPR FPLs that were flown on Workload Comparing Scenarios from Controller Perspective ......................................................................................................................... 116
Project Number 07.05.03 Edition 00.00.03 D06 - Validation Report
7 of 128
©SESAR JOINT UNDERTAKING, 2011. Created by AVINOR for the SESAR Joint Undertaking within the frame of the SESAR
Programme co-financed by the EU and EUROCONTROL. Reprint with approval of publisher and the source properly acknowledged.
Executive summary
This document is the Validation Report (VALR) for the Operational Focus Area (OFA) OFA03.01.03 “Free Routing” under Operational Sub Package (SPC) SPC03.01 “4D Trajectory Management”. It describes the activities that were conducted in support of the validation of the UPR concept as defined in the P07.05.03 Operational Services and Environmental Description (OSED). SPC03.01 is also addressed by P07.05.02 “Advanced Flexible Use of Airspace” and P07.05.04 “Dynamic Airspace Configurations”.
The relevant Operational Improvement (OI) is identified as AOM-0501 “Use of Free Routing for Flight in cruise and vertically evolving, inside Functional Airspace Blocks (FAB) above a certain level, within low to medium traffic complexity areas”.
The primary driver for the UPR concept is that it contributes to Flexibility. It was foreseen that the concept under this OI Step would introduce key elements to allow improvement compared to flights using non UPR FPLs and also add flexibility and predictability benefits to existing Free Route Airspace operations. Maintaining Operational Feasibility depends also on Efficiency, Environmental sustainability, Safety, Human Performance and Capacity and so these areas were also explored.
In keeping with the mappings defined in the OSED, the UPR concept falls under SESAR Operational Step 1 (ATM Service Level 2). This operational service is already quite mature. There are several on-going Free Route initiatives across Europe, and some states and/or FABs have already implemented or plan to implement Free Route operations within their airspace.
The principal concept aim is to allow Airspace Users (AUs) to fly their preferred business trajectories without the need to adhere to a predefined route structure. Flight Plans (FPLs) allow execution of routes involving unpublished waypoints, in between published entry and exit points. At step 1 this concept addressed Free Route Operations at FAB level, investigating the impacts of varying complexity of airspace and traffic demand.
For Step 1, the only project contributing to OFA03.01.03 was P07.05.03. The two validation exercises described in this document took place in different environments with differences in traffic complexity and workload; therefore they focused on different aspects of the UPR concept and were expected to complement each other with regards to OFA validation targets. The validation exercises will mainly made use of a RTS and a live operational trial. The initial maturity of the concept is V3.
Operational Package
Operational Sub-Package
Operational Focus Area
OIs or Operational Services
Initial Maturity level
Target Maturity
level
Reused validation material
from past R&D
Initiatives
PAC03 “Network
Operations”
SPC03.01 “4D
Trajectory Management”
OFA03.01.03 “Free
Routing”
AOM-0501 “Pre-defined ATS Routes activation only When and
Where Required within FRA (Free Route Airspace)”
V3 V4
Dynamic Route
Structures Early
Project
The results from two validation exercises are described in this VALR:
Identifier EXE-07.05.03-VP-571
Description RTS - Free Routing MUAC
Identifier EXE-07.05.03-VP-465
Description Live Trial in Northern European airspace
Seven out of the twelve objective’s success criteria were successfully met. The concept of UPR was found to be operationally feasible and acceptable due to the route optimisation and increased flexibility. ATCOs mentioned the most suitable environment for the concept is low traffic
Project Number 07.05.03 Edition 00.00.03 D06 - Validation Report
8 of 128
©SESAR JOINT UNDERTAKING, 2011. Created by AVINOR for the SESAR Joint Undertaking within the frame of the SESAR
Programme co-financed by the EU and EUROCONTROL. Reprint with approval of publisher and the source properly acknowledged.
density/complexity environments. A wider variety of test conditions is required to fully assess safety. When transiting through AMC manageable airspace, results suggested the acceptability of the concept is heavily reliant on the use of anchor points to provide a means to FPL around such areas. This resulted in a reduction of ATCO workload compared to the ATCO having to tactically re-route the aircraft to avoid the AMC manageable airspace.
ATCOs agreed that Direct Routes (DCTs) in a cross border scenario was not feasible as it increased workload and the need for coordination. Fuel and distance savings were found with the UPR concept and airlines found that the increased flexibility led to maximising fuel efficiency. In addition, results showed a positive impact on accuracy and predictability with a decrease in flight time with the introduction of the UPR concept. However, as the flexibility of the routes increased there was an increase in traffic complexity which increased the severity of the potential conflict types but generally a decrease in number of conflicts. ATCOs felt that it was possible to maintain capacity without a detrimental effect on safety.
Workload whilst using the UPR concept was acceptable and was found not to increase in the majority of circumstances. The concept also had a positive response regarding safety with ATCOs indicating the UPR concept would not impact safety or other traffic. However, safety under a range of conditions was not investigated during the two exercises.
It is recommended that this concept should undergo another iteration of V3 validation before maturing to V4. Despite the successful completion of the majority of Validation Objectives, the concepts scope needs to be focused and exercises addressing the concept with a higher degree of relevance so that fitness for purpose in a range of operational scenarios can be established. The quality of data needs to be more controlled so that the confidence in results can be improved.
Project Number 07.05.03 Edition 00.00.03 D06 - Validation Report
9 of 128
©SESAR JOINT UNDERTAKING, 2011. Created by AVINOR for the SESAR Joint Undertaking within the frame of the SESAR
Programme co-financed by the EU and EUROCONTROL. Reprint with approval of publisher and the source properly acknowledged.
1 Introduction
1.1 Purpose of the Document
This document provides the Validation report for Single European Sky ATM Research Programme (SESAR) P07.05.03 “User Preferred Routing (UPR)” (Step 1 only) for the Operational Package (PAC) PAC03 “Moving from Airspace to Trajectory Management” under Operational Sub-Package (SPC) SPC03.01 “4D Trajectory Management”. This encompasses Operational Focus Area (OFA) OFA03.01.03 “Free Routing”. It describes the results of validation exercises defined in the P07.05.03 Initial Validation Plan (VALP) (Step 1 V3) [6] and how they have been conducted.
The Initial VALR covers the results from two exercises under P07.05.03: EXE-07.05.03-VP-571 and EXE-07.05.03-VP-465.
VP-571 is a Real Time Simulation (RTS) performed in Maastricht Upper Area Control Centre (MUAC) that aimed to validate the application of UPR (i.e. Free Route Airspace (FRA)) to the maximum extent within a Functional Airspace Block (FAB), depending on the complexity (low to medium) of the airspace and the traffic demand. This aimed to provide an assessment of Free/UPR operations via DCTs defined between published entry and exit points (i.e. the aircraft is supposed to fly direct between those points).
VP-465 is a live trial which was performed in Northern European airspace. It aimed to investigate UPR operations using intermediate (published or not) waypoints specified by the airspace user within a FRA.
1.2 Intended Readership The intended audience for this document are other P07.05.03 team members. Projects 07.05.04 and 07.05.02 under WP 7 may also have an interest in this VALR, along with P04.07.02.
At a higher project level, SWP07.02, WP B, WP 13, WP 16 and SWP04.02 are expected to have an interest in this document.
External to the SESAR project, other stakeholders are to be found among:
Appropriate National Security Agency (NSA);
Air Navigation Service Providers (ANSP);
Airport owners/providers;
Affected employee unions;
Airspace users.
1.3 Structure of the Document
The structure of the document is as follows:
Section 1 is the Introduction of the document providing high level information related to the scope, the intended audience and a list of acronyms and terminology used throughout the document;
Section 2 describes the context of the validation outlining the scope of the validation and references the Validation Plan / Strategy and concept related documents used;
Section 3 describes the conduct of validation exercises, focusing on validation exercise preparation and execution, including deviations from planned activities;
Section 4 describes the validation exercise results, these results will be analysed, interpreted and summarised with respect to how they relate to the relevant KPAs;
Section 5 states the conclusions and recommendations as a global summary of all key elements and findings and how these extend into the feasibility for practical implementation of UPR operations in Europe;
Project Number 07.05.03 Edition 00.00.03 D06 - Validation Report
10 of 128
©SESAR JOINT UNDERTAKING, 2011. Created by AVINOR for the SESAR Joint Undertaking within the frame of the SESAR
Programme co-financed by the EU and EUROCONTROL. Reprint with approval of publisher and the source properly acknowledged.
Section 6 details the validation exercise reports obtained from each of the validation exercises individually;
Section 7 contains applicable and reference documents.
1.4 Glossary of Terms
Term Definition
Anchor Point
Published points around an active military/restricted area allowing Airspace Users (AU) to FPL around such areas. This avoids the requirement for controller tactical intervention of free route flights that may otherwise route through restricted areas. The purpose of anchor points is therefore to reduce controller workload.
Anchor points are specified at a minimum 5 NM from the restricted area boundary.
Airspace Reservation
A defined volume of airspace temporarily reserved for exclusive or specific use by categories of users.
Airspace Restriction
A defined volume of airspace within which, variously, activities dangerous to the flight of aircraft may be conducted at specified times (a ‘danger area’); or such airspace situated above the land areas or territorial waters of a State, within which the flight of aircraft is restricted in accordance with certain specified conditions (a ‘restricted area’); or airspace situated above the land areas or territorial waters of a State, within which the flight of aircraft is prohibited (a ‘prohibited area’).
AMC-Manageable Area
An area subject to management and allocation by an Airspace Management Cell (AMC) at Airspace Management (ASM) Level 2. Under the TAA Process, these manageable areas are either formal structures entitled “TRAs or TSAs” or R and D Areas that are manageable at ASM Level 2 in the same way as TRA/TSAs.
Airspace Management Cell (AMC)
A joint civil/military cell responsible for the day-to-day management and temporary allocation of national or sub-regional airspace under the jurisdiction of one or more ECAC State(s).
Filed Flight Plan (FPL)
The FPL as filed with an ATS unit by the pilot or a designated representative, without any subsequent changes.
Functional Airspace Block (FAB)
A FAB is an airspace block based on operational requirements and established regardless of State boundaries, where the provision of air navigation services and related functions is performance-driven and optimised through enhanced cooperation among air navigation service providers or, when appropriate, an integrated provider.
Free Route Airspace (FRA)
A specified airspace within which users may freely plan a route between a defined entry point and a defined exit point with the possibility to route via intermediate way points without reference to the Air Traffic Service (ATS) route network, subject to airspace availability. The FRA is a fully managed airspace within which flights remain subject to Air Traffic Control (ATC).
Flexible Use of Airspace (FUA) Concept
Is based on the fundamental principle that airspace should not be designated as either pure civil or military airspace, but rather be considered as one continuum in which all user requirements have to be accommodated to the extent possible.
Level 1 – Strategic ASM
The act of defining and reviewing, as required, the national airspace policy taking into account national and international airspace requirements.
Project Number 07.05.03 Edition 00.00.03 D06 - Validation Report
11 of 128
©SESAR JOINT UNDERTAKING, 2011. Created by AVINOR for the SESAR Joint Undertaking within the frame of the SESAR
Programme co-financed by the EU and EUROCONTROL. Reprint with approval of publisher and the source properly acknowledged.
Term Definition
Level 2 – Pre-Tactical ASM
The act of conducting operational management within the framework of the pre-determined existing ATM structure and procedures defined in ASM Level 1 and of reaching specific agreement between civil and military authorities involved.
Level 3 - Tactical ASM
The act, on the day of operation, of activating, deactivating or real time reallocating of airspace allocated in ASM Level 2, and of solving specific airspace problems and/or of individual Operational Air Traffic (OAT)/General Air Traffic (GAT) traffic situations in real time between civil and military ATS units and/or controlling military units and/or controllers, as appropriate. This coordination can take place either in active or passive mode with or without action by the controller.
Non User Preferred Routing Flight Plan (UPR FPL)
The flight plan created not using the UPR concept i.e. Fixed Route
Non User Preferred Routing Flight Plan (UPR FPL) that was flown
The flight plan not created by the UPR concept that was actually flown.
Restricted Area (R)
Airspace of defined dimensions, above the land areas or territorial waters of a State, within which the flight of aircraft is restricted in accordance with certain specified conditions.
In the context of the Flexible Use of Airspace Concept (FUA) Concept, some Restricted Areas are subject to management and allocation at ASM Level 2 are established at ASM Level 1 as “AMC-Manageable Areas” and identified as such in AIP.
User Preferred Routing (UPR) Concept
The ability for an Airspace User (AU) to plan a FPL with at least a significant part of the intended route which is not defined according to published route segments but specified by the AU’s.
User Preferred Routing Flight Plan (UPR FPL)
The flight plan created using the UPR concept.
User Preferred Routing Flight Plan (UPR FPL) that was flown
The flight plan created by the UPR concept that was actually flown.
1.5 Acronyms and Terminology
Term Definition
ABI Advanced Boundary Information
ACC Area Control Centre
ACT Aircraft Co-ordination Time
ADS Automatic Detection and Surveillance contract

Project Number 07.05.03 Edition 00.00.03 D06 - Validation Report
12 of 128
©SESAR JOINT UNDERTAKING, 2011. Created by AVINOR for the SESAR Joint Undertaking within the frame of the SESAR
Programme co-financed by the EU and EUROCONTROL. Reprint with approval of publisher and the source properly acknowledged.
AIP Aeronautical Information Publication
AIS Aeronautical Information Service
AMC Airspace Management Cell
ANSP Air Navigation Service Provider
ARN ATS Route Network
ASM Airspace Management
ATC Air Traffic Control
ATCC Air Traffic Control Centre
ATCO Air Traffic Control Officer
ATFCM Air Traffic Flow and Capacity Management
ATM Air Traffic Management
ATMS Air Traffic Management Service
ATS Air Traffic Service
CFMU Central Flow Management Unit
CMD Control and Monitoring Display
CPDLC Controller Pilot Data Link Communication
CTR Control Zone
CWP Controller Working Position
D02, D03, D07 etc. Deliverable ID
DCT Direct Routing
DLCS Data Link Communication Service.
DOD Detailed Operational Description
ECAC European Civil Aviation Conference
EEC EUROCONTROL Experimental Centre
ENAV Italian air traffic control service
ESHI ICAO Code: Kristianstad Airport
ESSA ICAO Code: Stockholm Airport
ETFMS Enhanced Tactical Flow Management System
Project Number 07.05.03 Edition 00.00.03 D06 - Validation Report
13 of 128
©SESAR JOINT UNDERTAKING, 2011. Created by AVINOR for the SESAR Joint Undertaking within the frame of the SESAR
Programme co-financed by the EU and EUROCONTROL. Reprint with approval of publisher and the source properly acknowledged.
EXE Exercise
FAB Functional Airspace Block
FABEC Functional Airspace Block Europe Central
FDD Flight Data Display
FDP Flight Data Processor
FDPS Flight Data Processing System
FIR Flight Information Region
FMP Flow Management Position
FPL Flight Plan
FPS Flight Progress Strip
FRA Free Route Airspace
GAINS Global Air Navigation Industry Symposium
GCD Great Circle Distance
ICAO International Civil Aviation Organisation
IFPS Integrated Initial Flight Plan Processing System
IFR Instrument Flight Rules
ISDS Integrated Situation Display System
KPA Key Performance Area
KPI Key Performance Indicator
MTCD Medium Term Conflict Detection
MUAC Maastricht Upper Area Control Centre
NATCON Norwegian Air Traffic Control
NOP Network Operations Plan
NORACON North European and Austrian Consortium
NSA National Security Agency
OBJ Objective
OFA Operational Focus Area
OSED Operational Services and Environmental Description

Project Number 07.05.03 Edition 00.00.03 D06 - Validation Report
14 of 128
©SESAR JOINT UNDERTAKING, 2011. Created by AVINOR for the SESAR Joint Undertaking within the frame of the SESAR
Programme co-financed by the EU and EUROCONTROL. Reprint with approval of publisher and the source properly acknowledged.
PAC Sub Work Package
PARROT Position Adjustable Range Reference Orientation Transponder
PIR Project Initiation Report
PRU Performance Review Unit
RADAR Radio Detection and Ranging
RDPS Radar Data Processing System
RNDSG Route Network Development Subgroup
RNLAF The Royal Netherlands Air Force
SCN Scenario Identifier
SDD Situation Data Display
SES Single European Sky
SESAR Single European Sky ATM Research
SJU SESAR Joint Undertaking
SPR Safety and Performance Requirements
SRA Surveillance Radar Approach
SUT System under Test
SWP Sub Work Package
TAA Temporary Airspace Allocation Process
TRA Temporary Reserved Area
TSA Temporary Segregated Area
UIR Upper Information Route
UPR User Preferred Route
VALP Validation Plan
VALR Validation Report
VALS Validation Strategy
VCS Voice Communication System
VFR Visual Flight Rules
VP Verification Plan

Project Number 07.05.03 Edition 00.00.03 D06 - Validation Report
15 of 128
©SESAR JOINT UNDERTAKING, 2011. Created by AVINOR for the SESAR Joint Undertaking within the frame of the SESAR
Programme co-financed by the EU and EUROCONTROL. Reprint with approval of publisher and the source properly acknowledged.
VR Verification Report
VS Verification Strategy
WP Work Package
Project Number 07.05.03 Edition 00.00.03 D06 - Validation Report
16 of 128
©SESAR JOINT UNDERTAKING, 2011. Created by AVINOR for the SESAR Joint Undertaking within the frame of the SESAR
Programme co-financed by the EU and EUROCONTROL. Reprint with approval of publisher and the source properly acknowledged.
2 Context of the Validation
2.1 Concept Overview
Aircraft Operators and other stakeholders are subject to very demanding economic and environmental pressures. To respond to this, an increasing number of States and ANSPs started to implement Free Route operations within their airspace with the will to offer, to the greatest possible extent, user preferred trajectories without the need to rely on a fixed route network.
Current implementations of Free Routing typically involve pre-defined direct (DCT) routes operated at specified times. The extension that the User Preferred Routing (UPR) concept provides is additional flexibility by allowing the Airspace User (AU) to define routes with at least a significant part of the intended route which is not defined according to published route segments but specified by the AU. A user-preferred route is not necessarily a direct route between an entry point and an exit point of a specific airspace, but it’s expected that the flight is executed along direct segments between any waypoint published and/or specified by the AU. This allows the AU to adapt routes in finer detail on a day by day basis to optimise against wind, ATC charges etc. to meet business requirements. In addition UPR FPLs should be better adhered to in operation meaning better network predictability.
The validation exercises intend to validate the UPR concept by focusing on different airspace characteristics. Two validation exercises will be performed:
1. VP-571: A Real Time Simulation aiming to validate new direct routes between defined/published entry and exit points in a complex and busy airspace. Also a concept is developed to allow UPR to be used around or through restricted areas. Finally a cross-border UPR interface with Copenhagen Area Control Centre (ACC) is assessed.
2. VP-465: A Live Operational Trial taking place in airspace over Northern Europe. This will have less traffic density and complexity allowing an assessment to be made of improvements gained when using intermediate (published or not) way points.
This validation activity will quantify the impact of operating UPRs on Key Performance Areas (KPAs). It will also assess the effects of introducing free routing in a busy and complex airspace, system interoperability and flight planning procedures for UPR. The concepts direct contribution will primarily be linked to predictability, flexibility and efficiency (both environmental and airspace) gains. Table 1 and Table 2 present a summary of the planned validation exercises.
Validation Exercise ID and Title
EXE-07.05.03-VP-571: Free Routing via Direct Routings, MUAC Real Time Simulation
Leading organization EUROCONTROL
Validation exercise objectives
OBJ-07.05.03-VALP-A001.0001 OBJ-07.05.03-VALP-A003.0030 OBJ-07.05.03-VALP-A004.0040 OBJ-07.05.03-VALP-A005.0050 OBJ-07.05.03-VALP-A006.0060 OBJ-07.05.03-VALP-A007.0070 OBJ-07.05.03-VALP-A009.0080 OBJ-07.05.03-VALP-A009.0090 OBJ-07.05.03-VALP-A010.0100 OBJ-07.05.03-VALP-A011.0110 OBJ-07.05.03-VALP-A012.0120
Rationale This exercise will investigate and simulate specific UPR scenarios by using DCTs between published entry/exit way points for low military activity and all DCTs open.
Supporting DOD / Operational Scenario / Use Case
P07.02 DOD Network Operations: Long term network planning; Medium-short term planning; Network operations in the execution phase.

Project Number 07.05.03 Edition 00.00.03 D06 - Validation Report
17 of 128
©SESAR JOINT UNDERTAKING, 2011. Created by AVINOR for the SESAR Joint Undertaking within the frame of the SESAR
Programme co-financed by the EU and EUROCONTROL. Reprint with approval of publisher and the source properly acknowledged.
OFA addressed OFA 03.01.03: Free Routing.
OI steps addressed AOM-0501: Use of Free Routing for Flight in cruise and vertically evolving, inside FAB above a certain level, within low to medium traffic complexity areas.
Enablers addressed A/C-04 Flight management and guidance to improve lateral
navigation (2D RNP).
A/C-37 Downlink of trajectory data according to contract terms.
AAMS-06b Airspace management system enhanced to generate and distribute planned airspace usage information (SWIM).
AAMS-16a Airspace management functions equipped with tools able to deal with free-routing.
AIMS-22 Airspace management functions enhanced to provide airspace status information.
ER APP ATC 76 Enable systems to differentiate between different traffic type airspaces.
ER APP ATC 100a FDP modified to allow management of those aspects of 4D trajectories implemented in step1 (including clearances, RBT update proposal, constraints, Pilot request, CTA, etc.).
HUM-AOM-050 Initial training, competence and/or adaptation of new/active operational staff for the application and use of the enhancements and improvements included of the OI Step Use of Free Routing for Flight in Cruise Inside FAB above a certain level.
NIMS-21 Flight Planning management enhanced to support 4D.
PRO-085 ATC procedures to cover issues such as hand-off transfer of control, and for defining trajectory changes necessitated by changes in airspace availability, weather constraints and other non-nominal events.
Applicable Operational Context
En-Route (Network Operations)
Expected results per KPA
Safety – neutral impact.
Environmental sustainability – improved by reducing fuel burn.
Efficiency - improved by reducing the flown distance.
Cost-Effectiveness – improved by reducing the flown distance and the fuel burn.
Predictability – improved by increasing adherence to flight plan.
Flexibility – improved through increased AU control over route choice.
Validation Technique Real Time Simulation
Dependent Validation Exercises
N/A
Table 1: EXE-07.05.03-VP-571 Concept Overview
Validation Exercise ID and Title
EXE-07.05.03-VP-625: Live Trial in NORACON Airspace Addressing Free Route Operations Using Intermediate Waypoints
Leading organization EUROCONTROL
Validation exercise objectives
OBJ-07.05.03-VALP-A002.0020 OBJ-07.05.03-VALP-A005.0050 OBJ-07.05.03-VALP-A005.0060 OBJ-07.05.03-VALP-A007.0070 OBJ-07.05.03-VALP-A008.0080 OBJ-07.05.03-VALP-A009.0090 OBJ-07.05.03-VALP-A011.0100
Project Number 07.05.03 Edition 00.00.03 D06 - Validation Report
18 of 128
©SESAR JOINT UNDERTAKING, 2011. Created by AVINOR for the SESAR Joint Undertaking within the frame of the SESAR
Programme co-financed by the EU and EUROCONTROL. Reprint with approval of publisher and the source properly acknowledged.
OBJ-07.05.03-VALP-A011.0110
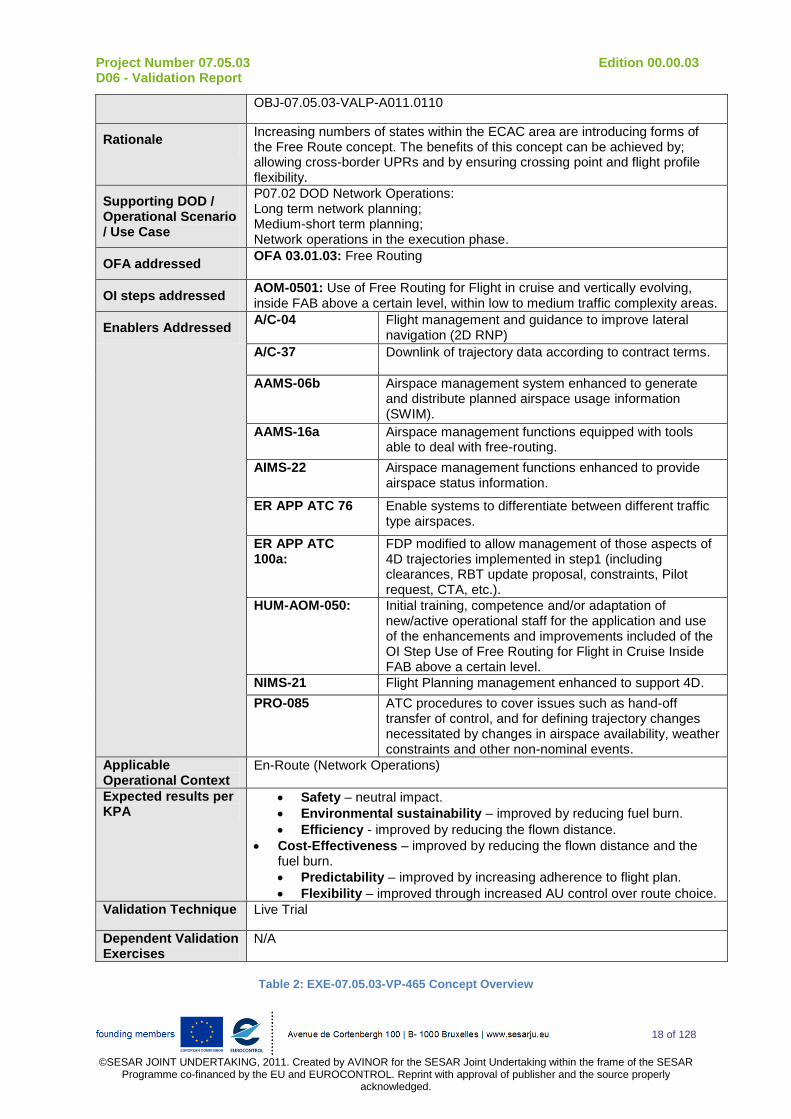
Rationale Increasing numbers of states within the ECAC area are introducing forms of the Free Route concept. The benefits of this concept can be achieved by; allowing cross-border UPRs and by ensuring crossing point and flight profile flexibility.
Supporting DOD / Operational Scenario / Use Case
P07.02 DOD Network Operations: Long term network planning; Medium-short term planning; Network operations in the execution phase.
OFA addressed OFA 03.01.03: Free Routing
OI steps addressed AOM-0501: Use of Free Routing for Flight in cruise and vertically evolving, inside FAB above a certain level, within low to medium traffic complexity areas.
Enablers Addressed A/C-04
Flight management and guidance to improve lateral navigation (2D RNP)
A/C-37
Downlink of trajectory data according to contract terms.
AAMS-06b
Airspace management system enhanced to generate and distribute planned airspace usage information (SWIM).
AAMS-16a
Airspace management functions equipped with tools able to deal with free-routing.
AIMS-22 Airspace management functions enhanced to provide airspace status information.
ER APP ATC 76
Enable systems to differentiate between different traffic type airspaces.
ER APP ATC 100a:
FDP modified to allow management of those aspects of 4D trajectories implemented in step1 (including clearances, RBT update proposal, constraints, Pilot request, CTA, etc.).
HUM-AOM-050: Initial training, competence and/or adaptation of new/active operational staff for the application and use of the enhancements and improvements included of the OI Step Use of Free Routing for Flight in Cruise Inside FAB above a certain level.
NIMS-21 Flight Planning management enhanced to support 4D.
PRO-085 ATC procedures to cover issues such as hand-off transfer of control, and for defining trajectory changes necessitated by changes in airspace availability, weather constraints and other non-nominal events.
Applicable Operational Context
En-Route (Network Operations)
Expected results per KPA
Safety – neutral impact.
Environmental sustainability – improved by reducing fuel burn.
Efficiency - improved by reducing the flown distance.
Cost-Effectiveness – improved by reducing the flown distance and the fuel burn.
Predictability – improved by increasing adherence to flight plan.
Flexibility – improved through increased AU control over route choice.
Validation Technique Live Trial
Dependent Validation Exercises
N/A
Table 2: EXE-07.05.03-VP-465 Concept Overview

Project Number 07.05.03 Edition 00.00.03 D06 - Validation Report
19 of 128
©SESAR JOINT UNDERTAKING, 2011. Created by AVINOR for the SESAR Joint Undertaking within the frame of the SESAR
Programme co-financed by the EU and EUROCONTROL. Reprint with approval of publisher and the source properly acknowledged.
2.2 Summary of Validation Exercises
2.2.1 Summary of Expected Exercise Outcomes
For Step 1, the only project contributing to OFA03.01.03 is P07.05.03.
The overall performance requirements for WP 07 Network Operations have been developed in the P07.02 Step 1 Validation Strategy (VALS) [12], which in turn has been broken down into targets for the individual OFAs in the document B4.1.16 Validation Target Allocation for Step 1 [13]. The validation objectives described in Section 2.2.3 will contribute to the validation targets described in Table 3.
Operational Package
Operational Sub-Package
(SPC) OFA
En
vir
on
men
t /
Fu
el
Eff
icie
ncy
Air
sp
ac
e
Ca
pa
cit
y
Pre
dic
tab
ilit
y
Co
st
Eff
ec
tiv
en
es
s
Sa
fety
PAC03 - Moving from Airspace to Trajectory
Management
4D Trajectory Management
OFA03.01.03 Free Routing
-0,2% 0,6% -0,1% -0,2% 0,6%
Table 3: Breakdown of OFA targets
The two validation exercises described in this document take place in two different environments with differences in traffic complexity and workload. Therefore they focus on different aspects of the UPR concept and are expected to complement each other with regards to OFA validation targets. These exercises will also validate data in different ways, as the lower traffic levels and complexity in Northern European airspace allow for a live trial to take place.
The combination of these two exercises will provide data to be analysed with reference to the relevant SESAR KPAs. No prototypes are required for validation and system development.
The relevant expectations per stakeholder group are identified in Table 4.
Stakeholder Stakeholder Validation Expectations
ANSPs. Collaborative planning to produce, on the whole, equitable solutions.
Effective cooperation between all the stakeholders.
Benefits from airspace used more flexibly on a day-to-day basis.
Civil Airspace Users:
Airlines;
General Aviation;
Pilots.
Effective cooperation between all the stakeholders.
Flexible use of airspace on a day-to-day basis.
To fly efficiently (to minimise fuel wastage).
Confidence that the most appropriate and efficient scenario will be used in any situation.
To depart and arrive at airports at the planned, agreed times.
Military Airspace Users. Flexible access to airspace.
Effective cooperation between all the stakeholders.
Regional Airspace & Network Managers.
Expect to enhance the use of available airspace by reducing the number of conflict points that have a positive impact on the controller workload.
Ground & Airborne Industry.
Expect to mitigate the effect of less predictability of conflicts and maintain safety through improved tools.
End-Customer
Environment sustainability.
Minimise the costs.
Decrease the flight duration as a result of more DCTs.
Table 4: Stakeholder Validation Expectations

Project Number 07.05.03 Edition 00.00.03 D06 - Validation Report
20 of 128
©SESAR JOINT UNDERTAKING, 2011. Created by AVINOR for the SESAR Joint Undertaking within the frame of the SESAR
Programme co-financed by the EU and EUROCONTROL. Reprint with approval of publisher and the source properly acknowledged.
2.2.2 Benefit Mechanisms Investigated
Figure 1: Benefit Mechanism Flexibility, Efficiency and Predictability
(1) The Airspace users will be able to file the most efficient trajectories through the airspace via a collection of defined entry and exit points. Depending on the airspace, they will file direct from entry to exit point, or via intermediate points they choose themselves
(2a) Aircraft on user preferred routes will require less intervention from ATC in order to navigate the airspace and hence aircraft will not require manual intervention of their trajectories as often.
(3a) The Airspace Users can use this option to file the shortest trajectory within the defined airspace, which will reduce flight distance compared to the actual distance that would have been flown if using the fixed route network.
(4a) The Airspace Users can use this option to file the shortest trajectory within the defined airspace, which will reduce flight distance compared to the actual distance that would have been flown if using the fixed route network. If conditions do not change then the time to cross a sector of airspace will also reduce.
(5a) Aircraft will file UPR FPLs, this prior knowledge of the user preferred routed to be flown will enable ATFCM to co-ordinate with the network. The amount of time taken to do this should not be impacted by the concept as co-ordinates can be given for intermediate points. Co-ordination at aerodrome level should become more accurate as more flights stick to their flight planned times, resulting in less time spent re-evaluating schedules. ATCO co-ordination of aircraft may increase as more time is spent identifying conflicts.
Project Number 07.05.03 Edition 00.00.03 D06 - Validation Report
21 of 128
©SESAR JOINT UNDERTAKING, 2011. Created by AVINOR for the SESAR Joint Undertaking within the frame of the SESAR
Programme co-financed by the EU and EUROCONTROL. Reprint with approval of publisher and the source properly acknowledged.
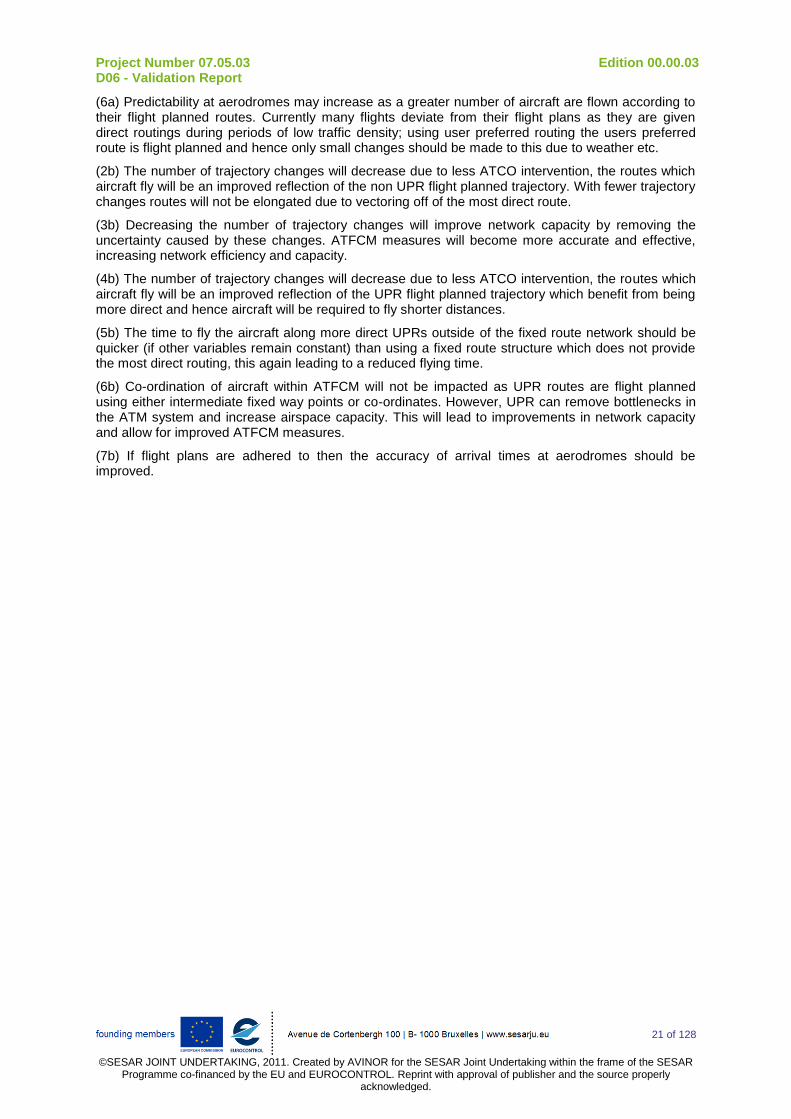
(6a) Predictability at aerodromes may increase as a greater number of aircraft are flown according to their flight planned routes. Currently many flights deviate from their flight plans as they are given direct routings during periods of low traffic density; using user preferred routing the users preferred route is flight planned and hence only small changes should be made to this due to weather etc.
(2b) The number of trajectory changes will decrease due to less ATCO intervention, the routes which aircraft fly will be an improved reflection of the non UPR flight planned trajectory. With fewer trajectory changes routes will not be elongated due to vectoring off of the most direct route.
(3b) Decreasing the number of trajectory changes will improve network capacity by removing the uncertainty caused by these changes. ATFCM measures will become more accurate and effective, increasing network efficiency and capacity.
(4b) The number of trajectory changes will decrease due to less ATCO intervention, the routes which aircraft fly will be an improved reflection of the UPR flight planned trajectory which benefit from being more direct and hence aircraft will be required to fly shorter distances.
(5b) The time to fly the aircraft along more direct UPRs outside of the fixed route network should be quicker (if other variables remain constant) than using a fixed route structure which does not provide the most direct routing, this again leading to a reduced flying time.
(6b) Co-ordination of aircraft within ATFCM will not be impacted as UPR routes are flight planned using either intermediate fixed way points or co-ordinates. However, UPR can remove bottlenecks in the ATM system and increase airspace capacity. This will lead to improvements in network capacity and allow for improved ATFCM measures.
(7b) If flight plans are adhered to then the accuracy of arrival times at aerodromes should be improved.
Project Number 07.05.03 Edition 00.00.03 D06 - Validation Report
22 of 128
©SESAR JOINT UNDERTAKING, 2011. Created by AVINOR for the SESAR Joint Undertaking within the frame of the SESAR
Programme co-financed by the EU and EUROCONTROL. Reprint with approval of publisher and the source properly acknowledged.
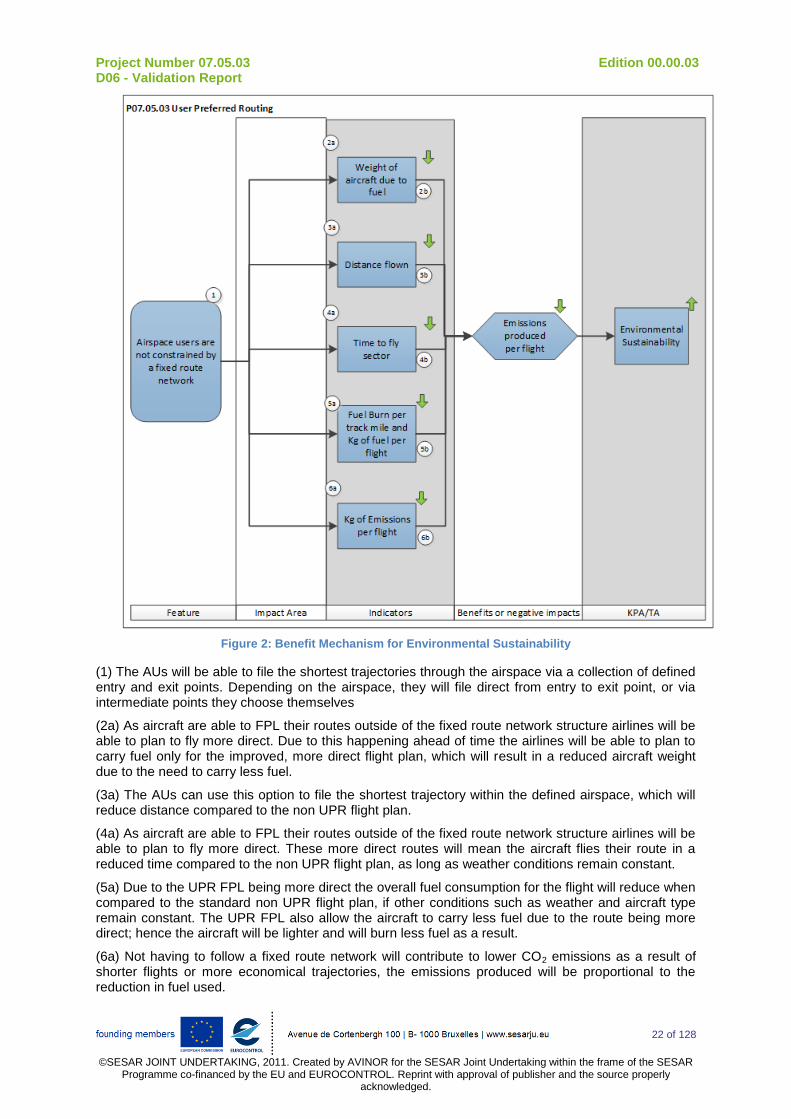
Figure 2: Benefit Mechanism for Environmental Sustainability
(1) The AUs will be able to file the shortest trajectories through the airspace via a collection of defined entry and exit points. Depending on the airspace, they will file direct from entry to exit point, or via intermediate points they choose themselves
(2a) As aircraft are able to FPL their routes outside of the fixed route network structure airlines will be able to plan to fly more direct. Due to this happening ahead of time the airlines will be able to plan to carry fuel only for the improved, more direct flight plan, which will result in a reduced aircraft weight due to the need to carry less fuel.
(3a) The AUs can use this option to file the shortest trajectory within the defined airspace, which will reduce distance compared to the non UPR flight plan.
(4a) As aircraft are able to FPL their routes outside of the fixed route network structure airlines will be able to plan to fly more direct. These more direct routes will mean the aircraft flies their route in a reduced time compared to the non UPR flight plan, as long as weather conditions remain constant.
(5a) Due to the UPR FPL being more direct the overall fuel consumption for the flight will reduce when compared to the standard non UPR flight plan, if other conditions such as weather and aircraft type remain constant. The UPR FPL also allow the aircraft to carry less fuel due to the route being more direct; hence the aircraft will be lighter and will burn less fuel as a result.
(6a) Not having to follow a fixed route network will contribute to lower CO2 emissions as a result of shorter flights or more economical trajectories, the emissions produced will be proportional to the reduction in fuel used.
Project Number 07.05.03 Edition 00.00.03 D06 - Validation Report
23 of 128
©SESAR JOINT UNDERTAKING, 2011. Created by AVINOR for the SESAR Joint Undertaking within the frame of the SESAR
Programme co-financed by the EU and EUROCONTROL. Reprint with approval of publisher and the source properly acknowledged.
(2b) If the weight of the aircraft is reduced due to the need to carry less fuel, the aircraft becomes lighter and hence will need to consume less fuel and will produce fewer emissions to power the aircraft compared to the same aircraft carrying more fuel mass.
(3b) The aircraft has to fly a reduced distance hence will burn less fuel and produce fewer emissions.
(4b) Keeping other variables such as aircraft speed constant, the aircraft is able to fly the sector in a shorter time due to a reduction in track miles. It is this reduction in track miles that results in a reduced emissions footprint.
(5b) Fuel burn produces emissions such as CO2, NOx and water vapour. The less fuel burnt the fewer emissions produced.
(6b) Refer to (5b).
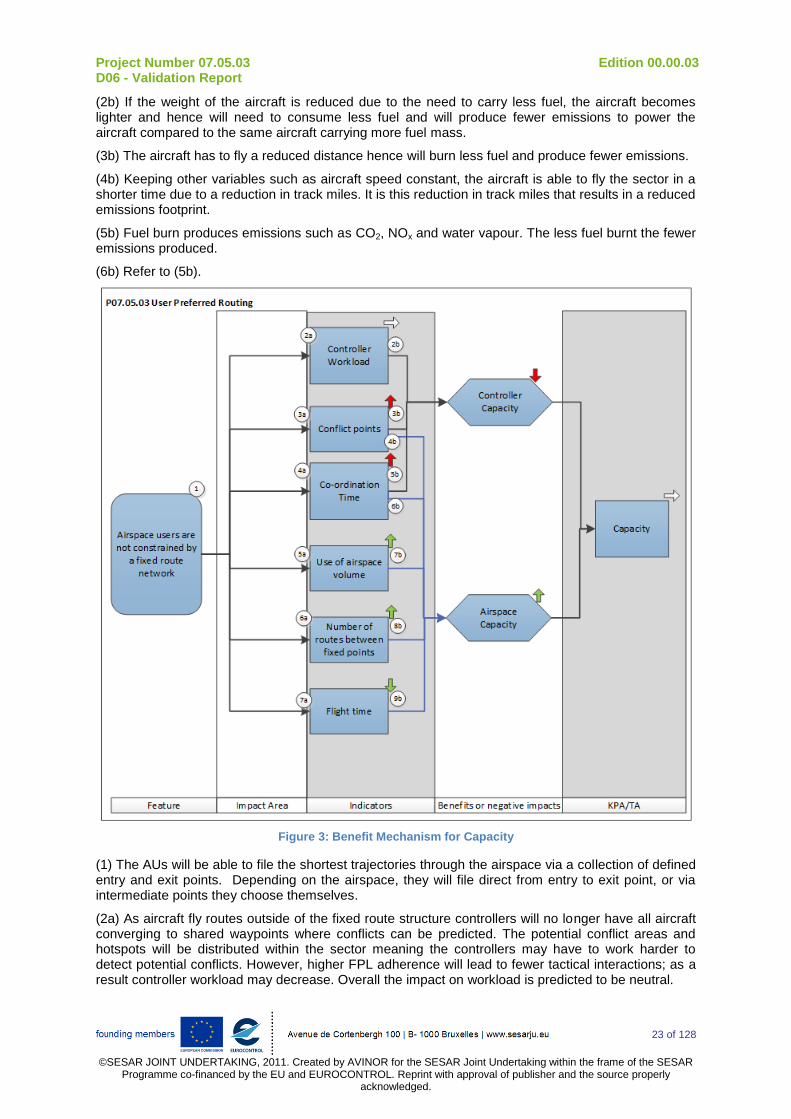
Figure 3: Benefit Mechanism for Capacity
(1) The AUs will be able to file the shortest trajectories through the airspace via a collection of defined entry and exit points. Depending on the airspace, they will file direct from entry to exit point, or via intermediate points they choose themselves.
(2a) As aircraft fly routes outside of the fixed route structure controllers will no longer have all aircraft converging to shared waypoints where conflicts can be predicted. The potential conflict areas and hotspots will be distributed within the sector meaning the controllers may have to work harder to detect potential conflicts. However, higher FPL adherence will lead to fewer tactical interactions; as a result controller workload may decrease. Overall the impact on workload is predicted to be neutral.

Project Number 07.05.03 Edition 00.00.03 D06 - Validation Report
24 of 128
©SESAR JOINT UNDERTAKING, 2011. Created by AVINOR for the SESAR Joint Undertaking within the frame of the SESAR
Programme co-financed by the EU and EUROCONTROL. Reprint with approval of publisher and the source properly acknowledged.
(3a) Refer to (2a).
(4a) The time the controller spends co-ordinating aircraft may increase due to the lack of shared. The reduced direct control ATCOs have over flights means they have to co-ordinate activity more in order to avoid potential conflicts.
(5a) Operating to a UPR will allow airlines to operate throughout the airspace, this could potentially lead to more of the airspace volume being used and will certainly increase the amount of controller airspace volume what aircraft are able to operating within.
(6a) Aircraft are able to take any route between aerodromes as they are no longer operating within a predefined route structure.
(7a) Flight time will reduce if UPR FPLs chosen by airlines are more direct.
(2b) The ability of the controller to handle a higher capacity of work/flights depends on multiple factors. If the workload of the controller remains constant then this should not influence controller capacity in a negative way.
(3b) With a greater number of conflict points controllers will have more areas of the radar to focus their attention on and a wider range of potential conflict scenarios. This may potentially reduce the capacity of the controller to handle aircraft.
(4b) The number of conflict points increases because they are more dispersed throughout the airspace as aircraft fly varying routes. These trajectories can lead to decreased predictability of conflicts, which in turn can have a detrimental effect on sector capacity which needs to be mitigated by tools or procedures.
(5b) ATCO co-ordination of aircraft may increase as more time is spent identifying conflicts.
(6b) Increased controller co-ordination time may negatively impact upon airspace capacity if measures are not taken to combat any negative impacts on the ATCO that may exist.
(7b) If more of the airspace is used the same volume of airspace will be able to handle an increased number of aircraft.
(8b) If flight times are improved due to a decrease in the distances travelled by aircraft, then the airspace capacity per hour will increase, as aircraft transit the area faster. Aircraft will also fly varying trajectories, thus UPR flights can remove bottlenecks in the ATM system and increase airspace capacity. This will lead to improvements in network capacity and allow for improved ATFCM measures.
Project Number 07.05.03 Edition 00.00.03 D06 - Validation Report
25 of 128
©SESAR JOINT UNDERTAKING, 2011. Created by AVINOR for the SESAR Joint Undertaking within the frame of the SESAR
Programme co-financed by the EU and EUROCONTROL. Reprint with approval of publisher and the source properly acknowledged.
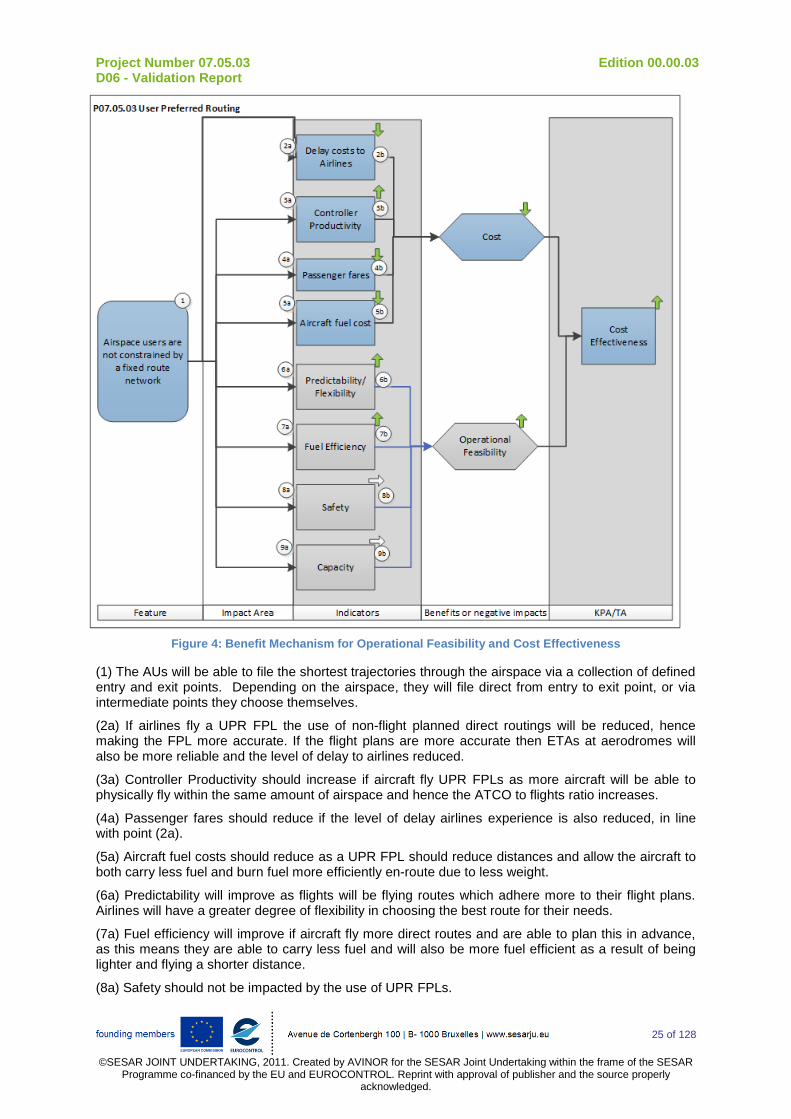
Figure 4: Benefit Mechanism for Operational Feasibility and Cost Effectiveness
(1) The AUs will be able to file the shortest trajectories through the airspace via a collection of defined entry and exit points. Depending on the airspace, they will file direct from entry to exit point, or via intermediate points they choose themselves.
(2a) If airlines fly a UPR FPL the use of non-flight planned direct routings will be reduced, hence making the FPL more accurate. If the flight plans are more accurate then ETAs at aerodromes will also be more reliable and the level of delay to airlines reduced.
(3a) Controller Productivity should increase if aircraft fly UPR FPLs as more aircraft will be able to physically fly within the same amount of airspace and hence the ATCO to flights ratio increases.
(4a) Passenger fares should reduce if the level of delay airlines experience is also reduced, in line with point (2a).
(5a) Aircraft fuel costs should reduce as a UPR FPL should reduce distances and allow the aircraft to both carry less fuel and burn fuel more efficiently en-route due to less weight.
(6a) Predictability will improve as flights will be flying routes which adhere more to their flight plans. Airlines will have a greater degree of flexibility in choosing the best route for their needs.
(7a) Fuel efficiency will improve if aircraft fly more direct routes and are able to plan this in advance, as this means they are able to carry less fuel and will also be more fuel efficient as a result of being lighter and flying a shorter distance.
(8a) Safety should not be impacted by the use of UPR FPLs.

Project Number 07.05.03 Edition 00.00.03 D06 - Validation Report
26 of 128
©SESAR JOINT UNDERTAKING, 2011. Created by AVINOR for the SESAR Joint Undertaking within the frame of the SESAR
Programme co-financed by the EU and EUROCONTROL. Reprint with approval of publisher and the source properly acknowledged.
(9a) Capacity should not be impacted by the use of UPR FPLs due to a balancing of negative and positive influences. ATCO workload may increase hence ATCO capacity to handle traffic may reduce due to an increase in potential conflict points. But there will be an increase in numbers of flights per hour able to fly through the airspace volume due to more route options hence will have a positive effect on capacity. Overall a neutral impact is expected on capacity.
(2b) Delays cost airlines as it impacts their whole route network; with fewer delays the airlines will save money.
(3b) If more aircraft are able to travel through the same volume of airspace per hour then ATCOs will be handling more flights, hence their productivity has the potential to increase (if workload does not constrain how many aircraft ATCOs can control).
(4b) Passenger fares should decrease in line with point (2b).
(5b) Aircraft fuel is the largest airline expense, any reduction in the amount of fuel consume will result in a cost benefit.
(6b) If the concept of UPR gives predictability and flexibility benefits then the operational feasibility of the concept gains strength.
(7b) If the concept of UPR gives fuel efficiency benefits then the operational feasibility of the concept gains strength.
(8b) If the concept of UPR is deemed to not impact safety in a negative way then the concepts operational feasibility gains strength.
(9b) If the concept of UPR is deemed to not impact capacity in a negative way then the concepts operational feasibility gains strength.
2.2.3 Summary of Validation Objectives and Success Criteria [OBJ] Identifier OBJ-07.05.03-VALP-A001-0010
Objective Assess if the UPR concept is operationally feasible during times of reduced traffic activity: - during night conditions; - during near-night conditions; - during weekend operations.
Title Operationally feasibility of concept in low traffic Status <In Progress>
[OBJ Trace] Relationship Linked Element Type Identifier Compliance
<SATISFIES> <V&V Objective> OBJ-07.02-VALS-0103.3011 <Full>
<SATISFIES> <V&V Objective> OBJ-07.02-VALS-0103.3074 <Full>
<COVERS> <ATMS Requirement> REQ-07.05.03-OSED-0001.0007 N/A
<COVERS> <ATMS Requirement> REQ-07.05.03-OSED-0001.0011 N/A
<COVERS> <ATMS Requirement> REQ-07.05.03-OSED-0001.0012 N/A
<COVERS> <ATMS Requirement> REQ-07.05.03-OSED-0001.0014 N/A
<COVERS> <ATMS Requirement> REQ-07.05.03-OSED-0001.0015 N/A
<COVERS> <V&V SUT Requirement> V&V SUT Requirement Identifier N/A
<COVERS> <OI Step> AOM-0502 N/A
<ALLOCATED_TO> <Operational Focus Area> OFA03.01.03 N/A
<ALLOCATED_TO> <Project> P07.05.03 N/A
<CHANGED_BECAUSE_OF> <Change Order> Change Reference N/A
[OBJ Suc] Identifier Success Criterion
CRT-07.05.03-VALP-A001-0010
Results indicate that ATS can be safely provided to the airspace when users implement the UPR concept in low traffic conditions. Assessing the number of new direct routes.

Project Number 07.05.03 Edition 00.00.03 D06 - Validation Report
27 of 128
©SESAR JOINT UNDERTAKING, 2011. Created by AVINOR for the SESAR Joint Undertaking within the frame of the SESAR
Programme co-financed by the EU and EUROCONTROL. Reprint with approval of publisher and the source properly acknowledged.
[OBJ] Identifier OBJ-07.05.03-VALP-A002.0020 Objective Assess if the concept of UPR is operationally feasible during different times of
day and conditions.
Title UPR feasibility.
Status <In Progress>
[OBJ Trace] Relationship Linked Element Type Identifier Compliance
<SATISFIES> <V&V Objective> OBJ-07.02-VALS-0103.3011 <Full>
<SATISFIES> <V&V Objective> OBJ-07.02-VALS-0103.3074 <Full>
<COVERS> <ATMS Requirement> REQ-07.05.03-OSED-0001.0001 N/A
<COVERS> <ATMS Requirement> REQ-07.05.03-OSED-0001.0007 N/A
<COVERS> <ATMS Requirement> REQ-07.05.03-OSED-0001.0010 N/A
<COVERS> <ATMS Requirement> REQ-07.05.03-OSED-0001.0011 N/A
<COVERS> <ATMS Requirement> REQ-07.05.03-OSED-0001.0012 N/A
<COVERS> <ATMS Requirement> REQ-07.05.03-OSED-0001.0014 N/A
<COVERS> <ATMS Requirement> REQ-07.05.03-OSED-0001.0015 N/A
<COVERS> <V&V SUT Requirement> V&V SUT Requirement Identifier N/A
<COVERS> <OI Step> AOM-0502 N/A
<ALLOCATED_TO> <Operational Focus Area> OFA03.01.03 N/A
<ALLOCATED_TO> <Project> P07.05.03 N/A
<CHANGED_BECAUSE_OF> <Change Order> Change Reference N/A
[OBJ Suc] Identifier Success Criterion
CRT-07.05.03-VALP-A002.0002
Results indicate that ATS can be safely and acceptably provided to the airspace when users implement the UPR concept during any time of day and during varying traffic complexities.
[OBJ] Identifier OBJ-07.05.03-VALP-A003.0030
Objective Evaluate Airspace Management Cells and Airspace Restrictions to determine if FPLs should include DCTs through these areas or if they should use Anchor points.
Title Entry to Airspace Management Cells and Areas of Restriction.
Status <In Progress>
[OBJ Trace] Relationship Linked Element Type Identifier Compliance
<SATISFIES> <V&V Objective> OBJ-07.02-VALS-0103.3051 <Full>
<COVERS> <ATMS Requirement> REQ-07.05.03-OSED-0001.0001 N/A
<COVERS> <ATMS Requirement> REQ-07.05.03-OSED-0001.0006 N/A
<COVERS> <ATMS Requirement> REQ-07.05.03-OSED-0001.0009 N/A
<COVERS> <ATMS Requirement> REQ-07.05.03-OSED-0001.0011 N/A
<COVERS> <ATMS Requirement> REQ-07.05.03-OSED-0001.0013 N/A
<COVERS> <ATMS Requirement> REQ-07.05.03-OSED-0001.0014 N/A
<COVERS> <ATMS Requirement> REQ-07.05.03-OSED-0001.0015 N/A
<COVERS> <V&V SUT Requirement> V&V SUT Requirement Identifier N/A
<COVERS> <OI Step> AOM-0502 N/A
<ALLOCATED_TO> <Operational Focus Area> OFA03.01.03 N/A
<ALLOCATED_TO> <Project> P07.05.03 N/A
<CHANGED_BECAUSE_OF> <Change Order> Change Reference N/A
[OBJ Suc] Identifier Success Criterion
CRT-07.05.03-VALP-A003.0001
Results indicate the use of anchor points to avoid active AMCs is operational feasible and the preferred method of operations for ATCOs, compared to tactical intervention to divert flights with FPLs filing through active AMC areas.
Project Number 07.05.03 Edition 00.00.03 D06 - Validation Report
28 of 128
©SESAR JOINT UNDERTAKING, 2011. Created by AVINOR for the SESAR Joint Undertaking within the frame of the SESAR
Programme co-financed by the EU and EUROCONTROL. Reprint with approval of publisher and the source properly acknowledged.
[OBJ] Identifier OBJ-07.05.03-VALP-A004.0040
Objective Assess whether UPR is operationally feasible in a cross-border environment.
Title Operational Feasibility of concept in cross-border environments. Status <In Progress>
[OBJ Trace] Relationship Linked Element Type Identifier Compliance
<SATISFIES> <V&V Objective> OBJ-07.02-VALS-0103.3011 <Full>
<SATISFIES> <V&V Objective> OBJ-07.02-VALS-0103.3061 <Full>
<SATISFIES> <V&V Objective> OBJ-07.02-VALS-0103.3041 <Partial>
<SATISFIES> <V&V Objective> OBJ-07.02-VALS-0103.3074 <Partial>
<COVERS> <ATMS Requirement> REQ-07.05.03-OSED-0001.0004 N/A
<COVERS> <ATMS Requirement> REQ-07.05.03-OSED-0001.0005 N/A
<COVERS> <V&V SUT Requirement> V&V SUT Requirement Identifier N/A
<COVERS> <OI Step> AOM-0502 N/A
<ALLOCATED_TO> <Operational Focus Area> OFA03.01.03 N/A
<ALLOCATED_TO> <Project> P07.05.03 N/A
<CHANGED_BECAUSE_OF> <Change Order> Change Reference N/A
[OBJ Suc] Identifier Success Criterion
CRT-07.05.03-VALP-A004.0001
Results indicate that ATS can be provided to the airspace when users implement the UPR concept for crossing airspace borders. The concept is acceptable and does not reduce performance.
[OBJ] Identifier OBJ-07.05.03-VALP-A005.0050
Objective Assess if there is any difference in the level of fuel use between aircraft flying on a fixed ATS route and aircraft flying on a UPR FPL.
Title Fuel Usage between fixed ATS routes and UPR FPLs.
Status <In Progress>
[OBJ Trace] Relationship Linked Element Type Identifier Compliance
<SATISFIES> <V&V Objective> OBJ-07.02-VALS-0103.3044 <Full>
<SATISFIES> <V&V Objective> OBJ-07.02-VALS-0103.3064 <Full>
<SATISFIES> <V&V Objective> OBJ-07.02-VALS-0103.3074 <Partial>
<COVERS> <ATMS Requirement> REQ-07.05.03-OSED-0001.0000 N/A
<COVERS> <ATMS Requirement> REQ-07.05.03-OSED-0001.0002 N/A
<COVERS> <ATMS Requirement> REQ-07.05.03-OSED-0001.0012 N/A
<COVERS> <V&V SUT Requirement> V&V SUT Requirement Identifier N/A
<COVERS> <OI Step> AOM-0502 N/A
<ALLOCATED_TO> <Operational Focus Area> OFA03.01.03 N/A
<ALLOCATED_TO> <Project> P07.05.03 N/A
<CHANGED_BECAUSE_OF> <Change Order> Change Reference N/A
[OBJ Suc] Identifier Success Criterion
CRT-07.05.03-VALP-A005.0001
Results indicate fuel savings when aircraft implement the UPR concept. In terms of: - kg of fuel used per flight; - average fuel burn per flight; - compared to the standard FPL reference trajectory.
Project Number 07.05.03 Edition 00.00.03 D06 - Validation Report
29 of 128
©SESAR JOINT UNDERTAKING, 2011. Created by AVINOR for the SESAR Joint Undertaking within the frame of the SESAR
Programme co-financed by the EU and EUROCONTROL. Reprint with approval of publisher and the source properly acknowledged.
[OBJ] Identifier OBJ-07.05.03-VALP-A006.0060
Objective Assess if safety is impacted by the use of the UPR concept.
Title Safety impact of implementing UPR concept.
Status <In Progress>
[OBJ Trace] Relationship Linked Element Type Identifier Compliance
<SATISFIES> <V&V Objective> OBJ-07.02-VALS-0103.3024 <Full>
<SATISFIES> <V&V Objective> OBJ-07.02-VALS-0103.3074 <Partial>
<COVERS> <ATMS Requirement> REQ-07.05.03-OSED-0001.0005 N/A
<COVERS> <ATMS Requirement> REQ-07.05.03-OSED-0001.0006 N/A
<COVERS> <V&V SUT Requirement> V&V SUT Requirement Identifier N/A
<COVERS> <OI Step> AOM-0502 N/A
<ALLOCATED_TO> <Operational Focus Area> OFA03.01.03 N/A
<ALLOCATED_TO> <Project> P07.05.03 N/A
<CHANGED_BECAUSE_OF> <Change Order> Change Reference N/A
[OBJ Suc] Identifier Success Criterion
CRT-07.05.03-VALP-A006.0001
Demonstrate that Safety levels will not be adversely affected by implementing the UPR concept.
[OBJ] Identifier OBJ-07.05.03-VALP-A007.0070
Objective Assess if there are any environmental impacts due to implementing the UPR concept, investigating the extent of any impacts.
Title Environmental Impact of implementing UPR concept.
Status <In Progress>
[OBJ Trace] Relationship Linked Element Type Identifier Compliance
<SATISFIES> <V&V Objective> OBJ-07.02-VALS-0103.3064 <Full>
<COVERS> <ATMS Requirement> REQ-07.05.03-OSED-0001.0000 N/A
<COVERS> <ATMS Requirement> REQ-07.05.03-OSED-0001.0002 N/A
<COVERS> <V&V SUT Requirement> V&V SUT Requirement Identifier
<COVERS> <OI Step> AOM-0502
<ALLOCATED_TO> <Operational Focus Area> OFA03.01.03 N/A
<ALLOCATED_TO> <Project> P07.05.03 N/A
<CHANGED_BECAUSE_OF> <Change Order> Change Reference N/A
[OBJ Suc] Identifier Success Criterion
CRT-07.05.03-VALP-A007.0001
Results indicate no negative impact on the environment, in terms of: - kg of CO2, NOx, H2O and Particulates; - Difference in emissions between fixed route FPL and UPR FPL; - Average fuel consumption per flight.
[OBJ] Identifier OBJ-07.05.03-VALP-A008.0080
Objective Assess if the concept of UPR via direct routings and/or using intermediate way points is acceptable.
Title Acceptability of UPR concept via direct routings and/or using intermediate way points.
Status <In Progress>
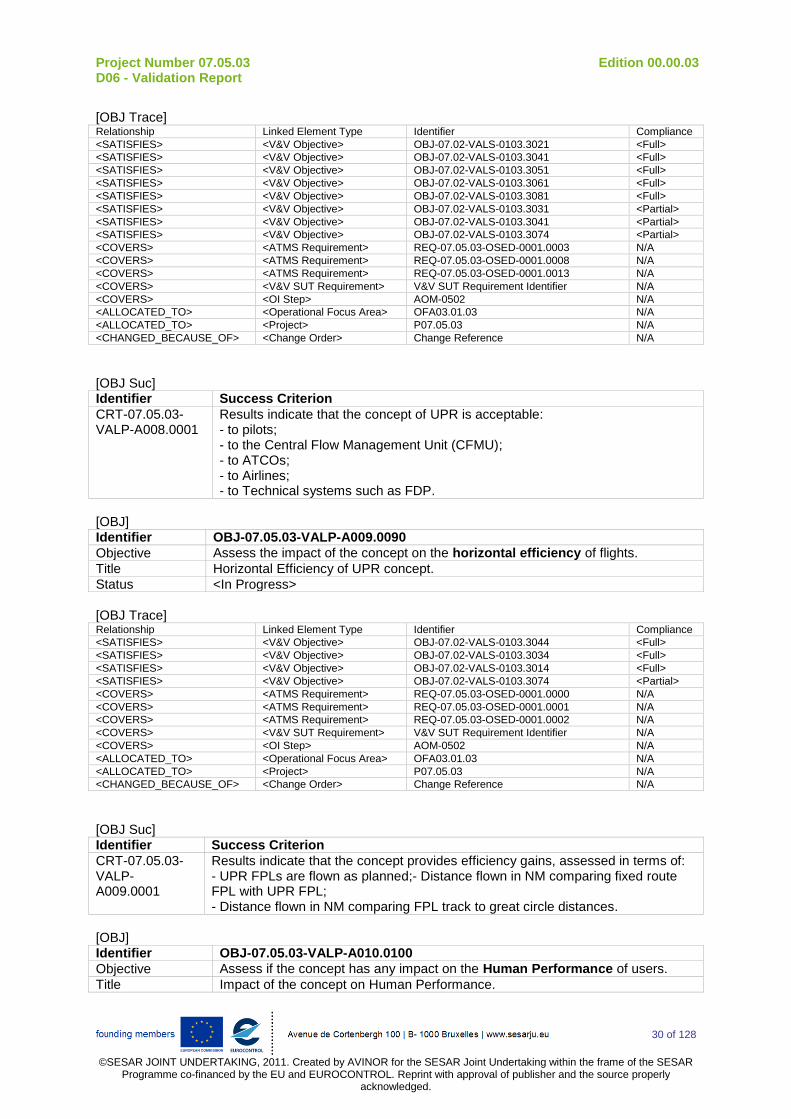
Project Number 07.05.03 Edition 00.00.03 D06 - Validation Report
30 of 128
©SESAR JOINT UNDERTAKING, 2011. Created by AVINOR for the SESAR Joint Undertaking within the frame of the SESAR
Programme co-financed by the EU and EUROCONTROL. Reprint with approval of publisher and the source properly acknowledged.
[OBJ Trace] Relationship Linked Element Type Identifier Compliance
<SATISFIES> <V&V Objective> OBJ-07.02-VALS-0103.3021 <Full>
<SATISFIES> <V&V Objective> OBJ-07.02-VALS-0103.3041 <Full>
<SATISFIES> <V&V Objective> OBJ-07.02-VALS-0103.3051 <Full>
<SATISFIES> <V&V Objective> OBJ-07.02-VALS-0103.3061 <Full>
<SATISFIES> <V&V Objective> OBJ-07.02-VALS-0103.3081 <Full>
<SATISFIES> <V&V Objective> OBJ-07.02-VALS-0103.3031 <Partial>
<SATISFIES> <V&V Objective> OBJ-07.02-VALS-0103.3041 <Partial>
<SATISFIES> <V&V Objective> OBJ-07.02-VALS-0103.3074 <Partial>
<COVERS> <ATMS Requirement> REQ-07.05.03-OSED-0001.0003 N/A
<COVERS> <ATMS Requirement> REQ-07.05.03-OSED-0001.0008 N/A
<COVERS> <ATMS Requirement> REQ-07.05.03-OSED-0001.0013 N/A
<COVERS> <V&V SUT Requirement> V&V SUT Requirement Identifier N/A
<COVERS> <OI Step> AOM-0502 N/A
<ALLOCATED_TO> <Operational Focus Area> OFA03.01.03 N/A
<ALLOCATED_TO> <Project> P07.05.03 N/A
<CHANGED_BECAUSE_OF> <Change Order> Change Reference N/A
[OBJ Suc] Identifier Success Criterion
CRT-07.05.03-VALP-A008.0001
Results indicate that the concept of UPR is acceptable: - to pilots; - to the Central Flow Management Unit (CFMU); - to ATCOs; - to Airlines; - to Technical systems such as FDP.
[OBJ] Identifier OBJ-07.05.03-VALP-A009.0090
Objective Assess the impact of the concept on the horizontal efficiency of flights.
Title Horizontal Efficiency of UPR concept.
Status <In Progress>
[OBJ Trace] Relationship Linked Element Type Identifier Compliance
<SATISFIES> <V&V Objective> OBJ-07.02-VALS-0103.3044 <Full>
<SATISFIES> <V&V Objective> OBJ-07.02-VALS-0103.3034 <Full>
<SATISFIES> <V&V Objective> OBJ-07.02-VALS-0103.3014 <Full>
<SATISFIES> <V&V Objective> OBJ-07.02-VALS-0103.3074 <Partial>
<COVERS> <ATMS Requirement> REQ-07.05.03-OSED-0001.0000 N/A
<COVERS> <ATMS Requirement> REQ-07.05.03-OSED-0001.0001 N/A
<COVERS> <ATMS Requirement> REQ-07.05.03-OSED-0001.0002 N/A
<COVERS> <V&V SUT Requirement> V&V SUT Requirement Identifier N/A
<COVERS> <OI Step> AOM-0502 N/A
<ALLOCATED_TO> <Operational Focus Area> OFA03.01.03 N/A
<ALLOCATED_TO> <Project> P07.05.03 N/A
<CHANGED_BECAUSE_OF> <Change Order> Change Reference N/A
[OBJ Suc] Identifier Success Criterion
CRT-07.05.03-VALP-A009.0001
Results indicate that the concept provides efficiency gains, assessed in terms of: - UPR FPLs are flown as planned;- Distance flown in NM comparing fixed route FPL with UPR FPL; - Distance flown in NM comparing FPL track to great circle distances.
[OBJ] Identifier OBJ-07.05.03-VALP-A010.0100
Objective Assess if the concept has any impact on the Human Performance of users.
Title Impact of the concept on Human Performance.
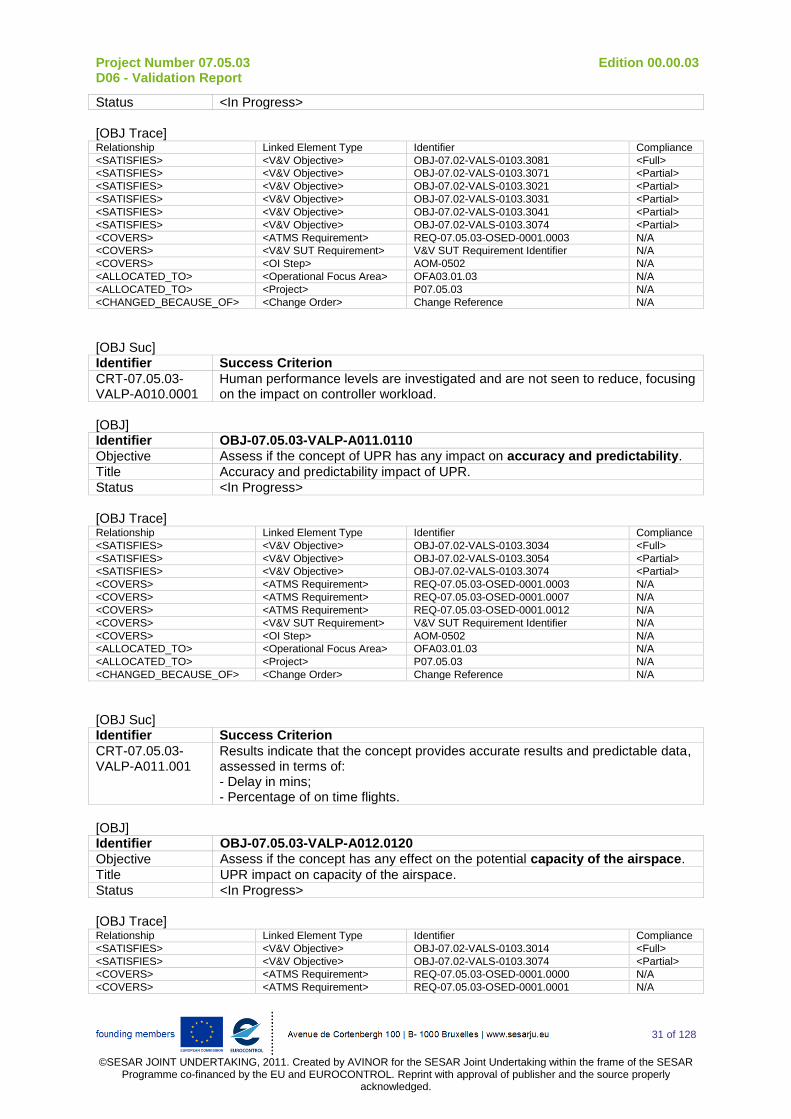
Project Number 07.05.03 Edition 00.00.03 D06 - Validation Report
31 of 128
©SESAR JOINT UNDERTAKING, 2011. Created by AVINOR for the SESAR Joint Undertaking within the frame of the SESAR
Programme co-financed by the EU and EUROCONTROL. Reprint with approval of publisher and the source properly acknowledged.
Status <In Progress>
[OBJ Trace] Relationship Linked Element Type Identifier Compliance
<SATISFIES> <V&V Objective> OBJ-07.02-VALS-0103.3081 <Full>
<SATISFIES> <V&V Objective> OBJ-07.02-VALS-0103.3071 <Partial>
<SATISFIES> <V&V Objective> OBJ-07.02-VALS-0103.3021 <Partial>
<SATISFIES> <V&V Objective> OBJ-07.02-VALS-0103.3031 <Partial>
<SATISFIES> <V&V Objective> OBJ-07.02-VALS-0103.3041 <Partial>
<SATISFIES> <V&V Objective> OBJ-07.02-VALS-0103.3074 <Partial>
<COVERS> <ATMS Requirement> REQ-07.05.03-OSED-0001.0003 N/A
<COVERS> <V&V SUT Requirement> V&V SUT Requirement Identifier N/A
<COVERS> <OI Step> AOM-0502 N/A
<ALLOCATED_TO> <Operational Focus Area> OFA03.01.03 N/A
<ALLOCATED_TO> <Project> P07.05.03 N/A
<CHANGED_BECAUSE_OF> <Change Order> Change Reference N/A
[OBJ Suc] Identifier Success Criterion
CRT-07.05.03-VALP-A010.0001
Human performance levels are investigated and are not seen to reduce, focusing on the impact on controller workload.
[OBJ] Identifier OBJ-07.05.03-VALP-A011.0110
Objective Assess if the concept of UPR has any impact on accuracy and predictability.
Title Accuracy and predictability impact of UPR.
Status <In Progress>
[OBJ Trace] Relationship Linked Element Type Identifier Compliance
<SATISFIES> <V&V Objective> OBJ-07.02-VALS-0103.3034 <Full>
<SATISFIES> <V&V Objective> OBJ-07.02-VALS-0103.3054 <Partial>
<SATISFIES> <V&V Objective> OBJ-07.02-VALS-0103.3074 <Partial>
<COVERS> <ATMS Requirement> REQ-07.05.03-OSED-0001.0003 N/A
<COVERS> <ATMS Requirement> REQ-07.05.03-OSED-0001.0007 N/A
<COVERS> <ATMS Requirement> REQ-07.05.03-OSED-0001.0012 N/A
<COVERS> <V&V SUT Requirement> V&V SUT Requirement Identifier N/A
<COVERS> <OI Step> AOM-0502 N/A
<ALLOCATED_TO> <Operational Focus Area> OFA03.01.03 N/A
<ALLOCATED_TO> <Project> P07.05.03 N/A
<CHANGED_BECAUSE_OF> <Change Order> Change Reference N/A
[OBJ Suc] Identifier Success Criterion
CRT-07.05.03-VALP-A011.001
Results indicate that the concept provides accurate results and predictable data, assessed in terms of: - Delay in mins; - Percentage of on time flights.
[OBJ] Identifier OBJ-07.05.03-VALP-A012.0120
Objective Assess if the concept has any effect on the potential capacity of the airspace.
Title UPR impact on capacity of the airspace.
Status <In Progress>
[OBJ Trace] Relationship Linked Element Type Identifier Compliance
<SATISFIES> <V&V Objective> OBJ-07.02-VALS-0103.3014 <Full>
<SATISFIES> <V&V Objective> OBJ-07.02-VALS-0103.3074 <Partial>
<COVERS> <ATMS Requirement> REQ-07.05.03-OSED-0001.0000 N/A
<COVERS> <ATMS Requirement> REQ-07.05.03-OSED-0001.0001 N/A
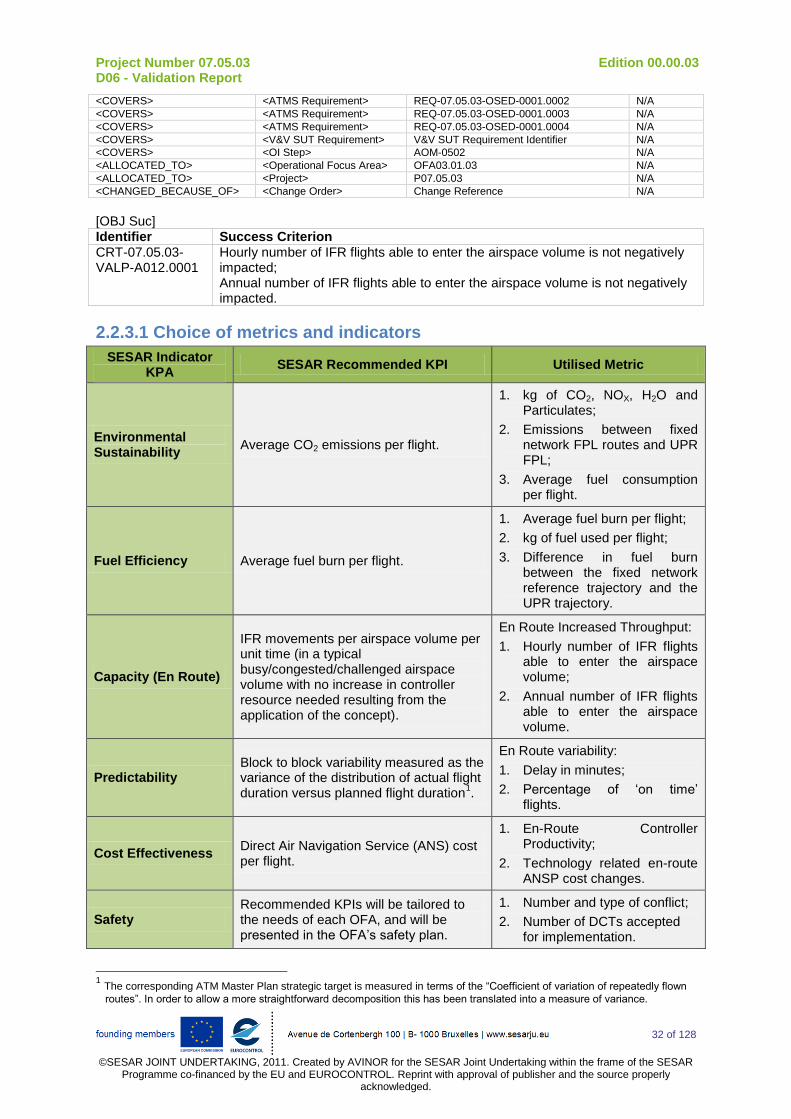
Project Number 07.05.03 Edition 00.00.03 D06 - Validation Report
32 of 128
©SESAR JOINT UNDERTAKING, 2011. Created by AVINOR for the SESAR Joint Undertaking within the frame of the SESAR
Programme co-financed by the EU and EUROCONTROL. Reprint with approval of publisher and the source properly acknowledged.
<COVERS> <ATMS Requirement> REQ-07.05.03-OSED-0001.0002 N/A
<COVERS> <ATMS Requirement> REQ-07.05.03-OSED-0001.0003 N/A
<COVERS> <ATMS Requirement> REQ-07.05.03-OSED-0001.0004 N/A
<COVERS> <V&V SUT Requirement> V&V SUT Requirement Identifier N/A
<COVERS> <OI Step> AOM-0502 N/A
<ALLOCATED_TO> <Operational Focus Area> OFA03.01.03 N/A
<ALLOCATED_TO> <Project> P07.05.03 N/A
<CHANGED_BECAUSE_OF> <Change Order> Change Reference N/A
[OBJ Suc] Identifier Success Criterion
CRT-07.05.03-VALP-A012.0001
Hourly number of IFR flights able to enter the airspace volume is not negatively impacted; Annual number of IFR flights able to enter the airspace volume is not negatively impacted.
2.2.3.1 Choice of metrics and indicators
SESAR Indicator KPA
SESAR Recommended KPI Utilised Metric
Environmental Sustainability
Average CO2 emissions per flight.
1. kg of CO2, NOX, H2O and Particulates;
2. Emissions between fixed network FPL routes and UPR FPL;
3. Average fuel consumption per flight.
Fuel Efficiency Average fuel burn per flight.
1. Average fuel burn per flight;
2. kg of fuel used per flight;
3. Difference in fuel burn between the fixed network reference trajectory and the UPR trajectory.
Capacity (En Route)
IFR movements per airspace volume per unit time (in a typical busy/congested/challenged airspace volume with no increase in controller resource needed resulting from the application of the concept).
En Route Increased Throughput:
1. Hourly number of IFR flights able to enter the airspace volume;
2. Annual number of IFR flights able to enter the airspace volume.
Predictability Block to block variability measured as the variance of the distribution of actual flight duration versus planned flight duration
1.
En Route variability:
1. Delay in minutes;
2. Percentage of ‘on time’ flights.
Cost Effectiveness Direct Air Navigation Service (ANS) cost per flight.
1. En-Route Controller Productivity;
2. Technology related en-route ANSP cost changes.
Safety Recommended KPIs will be tailored to the needs of each OFA, and will be presented in the OFA’s safety plan.
1. Number and type of conflict;
2. Number of DCTs accepted for implementation.
1 The corresponding ATM Master Plan strategic target is measured in terms of the “Coefficient of variation of repeatedly flown
routes”. In order to allow a more straightforward decomposition this has been translated into a measure of variance.
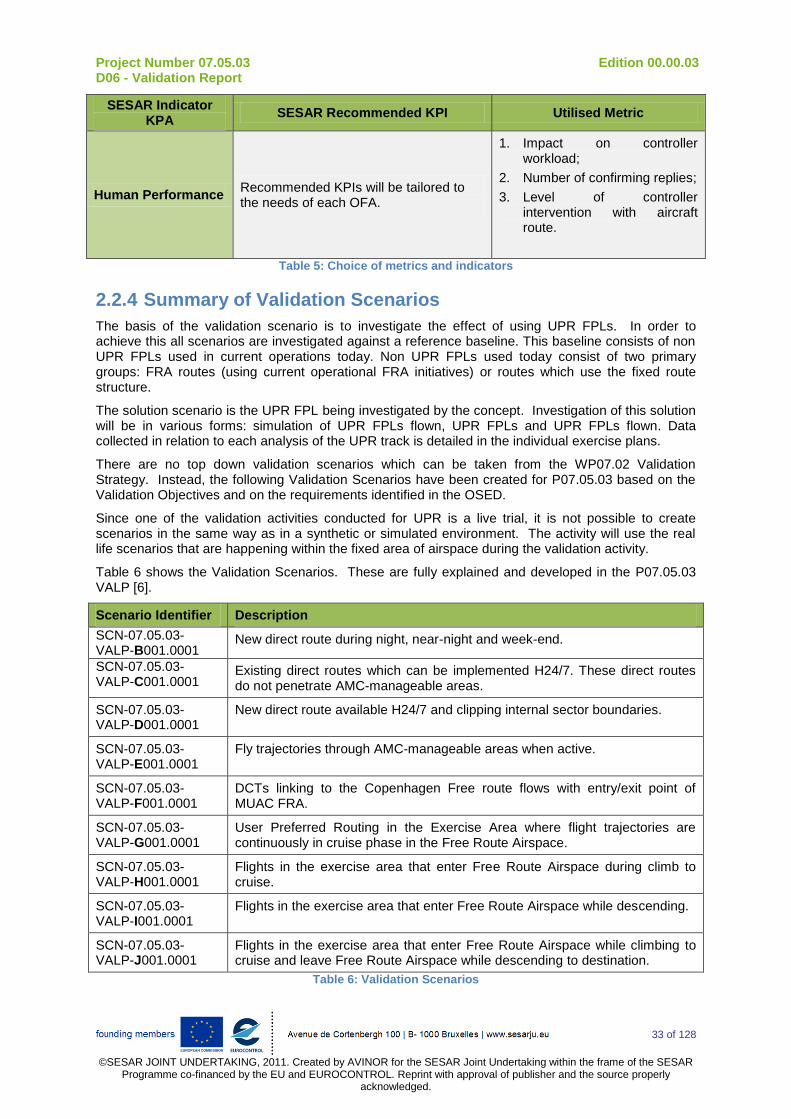
Project Number 07.05.03 Edition 00.00.03 D06 - Validation Report
33 of 128
©SESAR JOINT UNDERTAKING, 2011. Created by AVINOR for the SESAR Joint Undertaking within the frame of the SESAR
Programme co-financed by the EU and EUROCONTROL. Reprint with approval of publisher and the source properly acknowledged.
SESAR Indicator KPA
SESAR Recommended KPI Utilised Metric
Human Performance Recommended KPIs will be tailored to the needs of each OFA.
1. Impact on controller workload;
2. Number of confirming replies;
3. Level of controller intervention with aircraft route.
Table 5: Choice of metrics and indicators
2.2.4 Summary of Validation Scenarios
The basis of the validation scenario is to investigate the effect of using UPR FPLs. In order to achieve this all scenarios are investigated against a reference baseline. This baseline consists of non UPR FPLs used in current operations today. Non UPR FPLs used today consist of two primary groups: FRA routes (using current operational FRA initiatives) or routes which use the fixed route structure.
The solution scenario is the UPR FPL being investigated by the concept. Investigation of this solution will be in various forms: simulation of UPR FPLs flown, UPR FPLs and UPR FPLs flown. Data collected in relation to each analysis of the UPR track is detailed in the individual exercise plans.
There are no top down validation scenarios which can be taken from the WP07.02 Validation Strategy. Instead, the following Validation Scenarios have been created for P07.05.03 based on the Validation Objectives and on the requirements identified in the OSED.
Since one of the validation activities conducted for UPR is a live trial, it is not possible to create scenarios in the same way as in a synthetic or simulated environment. The activity will use the real life scenarios that are happening within the fixed area of airspace during the validation activity.
Table 6 shows the Validation Scenarios. These are fully explained and developed in the P07.05.03 VALP [6].
Scenario Identifier Description
SCN-07.05.03-VALP-B001.0001
New direct route during night, near-night and week-end.
SCN-07.05.03-VALP-C001.0001
Existing direct routes which can be implemented H24/7. These direct routes do not penetrate AMC-manageable areas.
SCN-07.05.03-VALP-D001.0001
New direct route available H24/7 and clipping internal sector boundaries.
SCN-07.05.03-VALP-E001.0001
Fly trajectories through AMC-manageable areas when active.
SCN-07.05.03-VALP-F001.0001
DCTs linking to the Copenhagen Free route flows with entry/exit point of MUAC FRA.
SCN-07.05.03-VALP-G001.0001
User Preferred Routing in the Exercise Area where flight trajectories are continuously in cruise phase in the Free Route Airspace.
SCN-07.05.03-VALP-H001.0001
Flights in the exercise area that enter Free Route Airspace during climb to cruise.
SCN-07.05.03-VALP-I001.0001
Flights in the exercise area that enter Free Route Airspace while descending.
SCN-07.05.03-VALP-J001.0001
Flights in the exercise area that enter Free Route Airspace while climbing to cruise and leave Free Route Airspace while descending to destination.
Table 6: Validation Scenarios
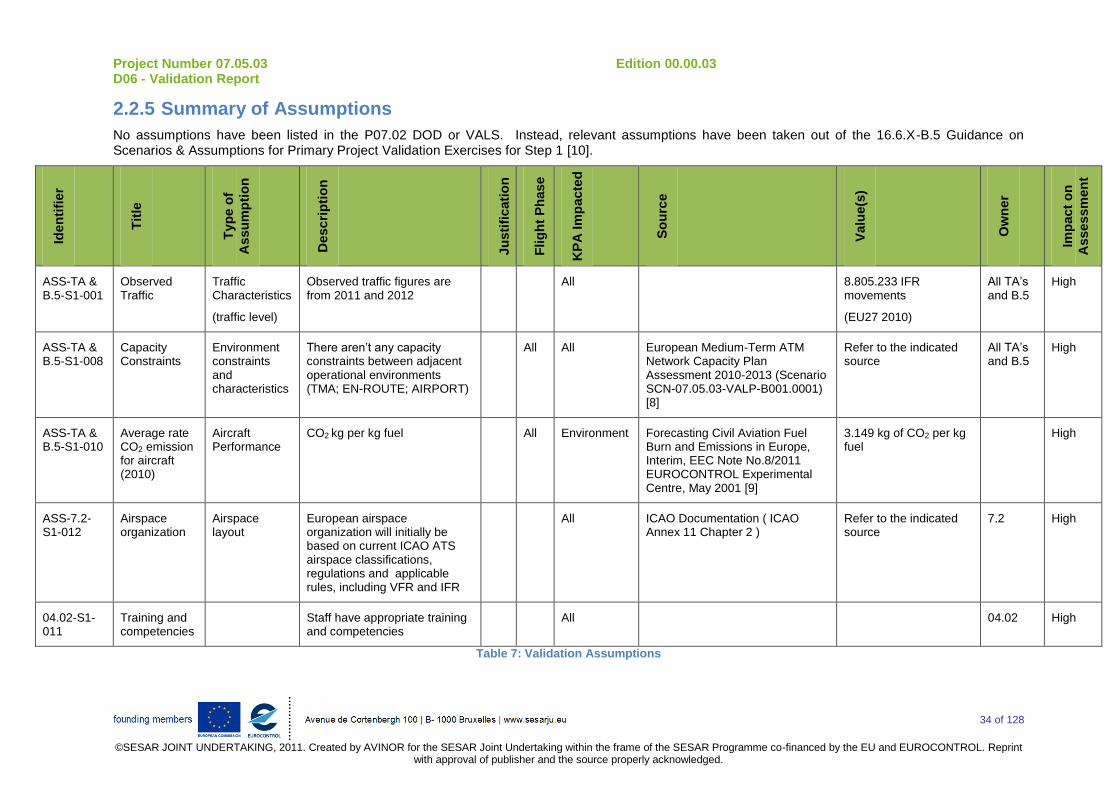
Project Number 07.05.03 Edition 00.00.03 D06 - Validation Report
34 of 128
©SESAR JOINT UNDERTAKING, 2011. Created by AVINOR for the SESAR Joint Undertaking within the frame of the SESAR Programme co-financed by the EU and EUROCONTROL. Reprint
with approval of publisher and the source properly acknowledged.
2.2.5 Summary of Assumptions
No assumptions have been listed in the P07.02 DOD or VALS. Instead, relevant assumptions have been taken out of the 16.6.X-B.5 Guidance on Scenarios & Assumptions for Primary Project Validation Exercises for Step 1 [10].
Iden
tifi
er
Tit
le
Typ
e o
f
Assu
mp
tio
n
Desc
rip
tio
n
Ju
sti
ficati
on
Flig
ht
Ph
ase
KP
A Im
pacte
d
So
urc
e
Valu
e(s
)
Ow
ner
Imp
act
on
Asse
ssm
en
t
ASS-TA & B.5-S1-001
Observed Traffic
Traffic Characteristics
(traffic level)
Observed traffic figures are from 2011 and 2012
l All 8.805.233 IFR movements
(EU27 2010)
All TA’s and B.5
High
ASS-TA & B.5-S1-008
Capacity Constraints
Environment constraints and characteristics
There aren’t any capacity constraints between adjacent operational environments (TMA; EN-ROUTE; AIRPORT)
All All European Medium-Term ATM Network Capacity Plan Assessment 2010-2013 (Scenario SCN-07.05.03-VALP-B001.0001) [8]
Refer to the indicated source
All TA’s and B.5
High
ASS-TA & B.5-S1-010
Average rate CO2 emission for aircraft (2010)
Aircraft Performance
CO2 kg per kg fuel All Environment Forecasting Civil Aviation Fuel Burn and Emissions in Europe, Interim, EEC Note No.8/2011 EUROCONTROL Experimental Centre, May 2001 [9]
3.149 kg of CO2 per kg fuel
High
ASS-7.2-S1-012
Airspace organization
Airspace layout
European airspace organization will initially be based on current ICAO ATS airspace classifications, regulations and applicable rules, including VFR and IFR
All
All ICAO Documentation ( ICAO Annex 11 Chapter 2 )
Refer to the indicated source
7.2 High
04.02-S1-011
Training and competencies
Staff have appropriate training and competencies
All 04.02 High
Table 7: Validation Assumptions
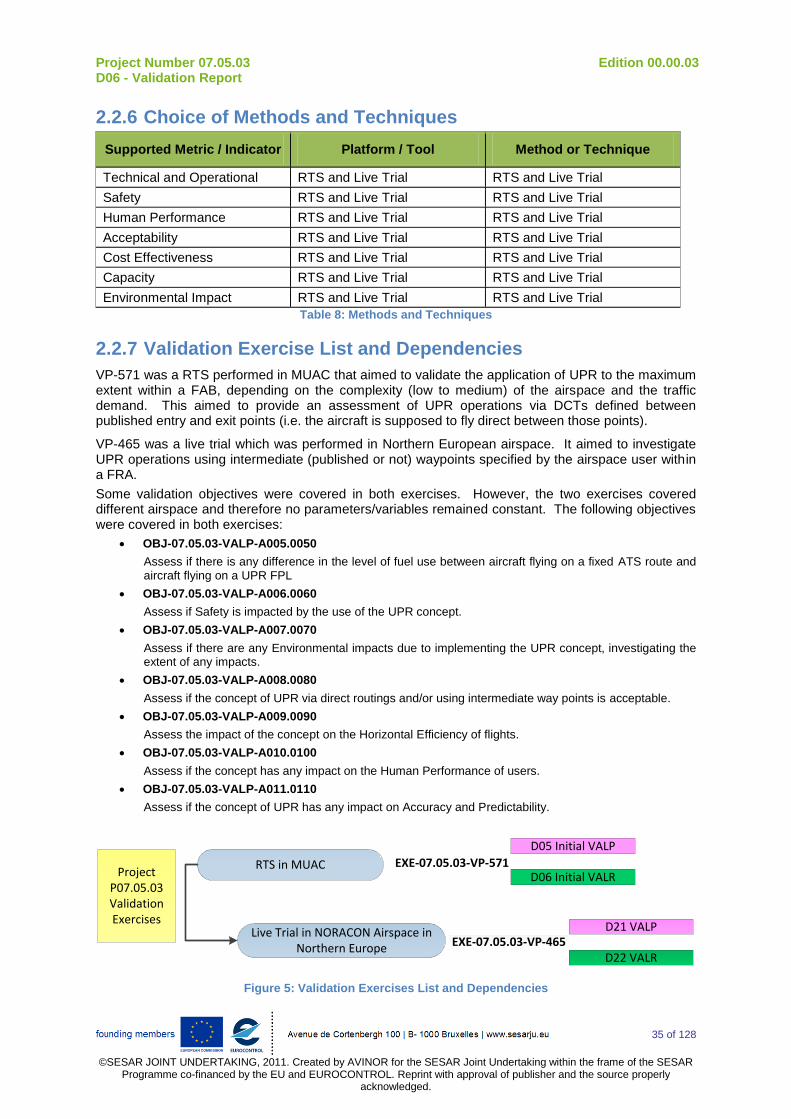
Project Number 07.05.03 Edition 00.00.03 D06 - Validation Report
35 of 128
©SESAR JOINT UNDERTAKING, 2011. Created by AVINOR for the SESAR Joint Undertaking within the frame of the SESAR
Programme co-financed by the EU and EUROCONTROL. Reprint with approval of publisher and the source properly acknowledged.
2.2.6 Choice of Methods and Techniques
Supported Metric / Indicator Platform / Tool Method or Technique
Technical and Operational RTS and Live Trial RTS and Live Trial
Safety RTS and Live Trial RTS and Live Trial
Human Performance RTS and Live Trial RTS and Live Trial
Acceptability RTS and Live Trial RTS and Live Trial
Cost Effectiveness RTS and Live Trial RTS and Live Trial
Capacity RTS and Live Trial RTS and Live Trial
Environmental Impact RTS and Live Trial RTS and Live Trial
Table 8: Methods and Techniques
2.2.7 Validation Exercise List and Dependencies
VP-571 was a RTS performed in MUAC that aimed to validate the application of UPR to the maximum extent within a FAB, depending on the complexity (low to medium) of the airspace and the traffic demand. This aimed to provide an assessment of UPR operations via DCTs defined between published entry and exit points (i.e. the aircraft is supposed to fly direct between those points).
VP-465 was a live trial which was performed in Northern European airspace. It aimed to investigate UPR operations using intermediate (published or not) waypoints specified by the airspace user within a FRA.
Some validation objectives were covered in both exercises. However, the two exercises covered different airspace and therefore no parameters/variables remained constant. The following objectives were covered in both exercises:
OBJ-07.05.03-VALP-A005.0050
Assess if there is any difference in the level of fuel use between aircraft flying on a fixed ATS route and aircraft flying on a UPR FPL
OBJ-07.05.03-VALP-A006.0060
Assess if Safety is impacted by the use of the UPR concept.
OBJ-07.05.03-VALP-A007.0070
Assess if there are any Environmental impacts due to implementing the UPR concept, investigating the extent of any impacts.
OBJ-07.05.03-VALP-A008.0080
Assess if the concept of UPR via direct routings and/or using intermediate way points is acceptable.
OBJ-07.05.03-VALP-A009.0090
Assess the impact of the concept on the Horizontal Efficiency of flights.
OBJ-07.05.03-VALP-A010.0100
Assess if the concept has any impact on the Human Performance of users.
OBJ-07.05.03-VALP-A011.0110
Assess if the concept of UPR has any impact on Accuracy and Predictability.
Project P07.05.03 Validation Exercises
RTS in MUAC
Live Trial in NORACON Airspace in Northern Europe
EXE-07.05.03-VP-571
EXE-07.05.03-VP-465
D05 Initial VALP
D06 Initial VALR
D21 VALP
D22 VALR
Figure 5: Validation Exercises List and Dependencies
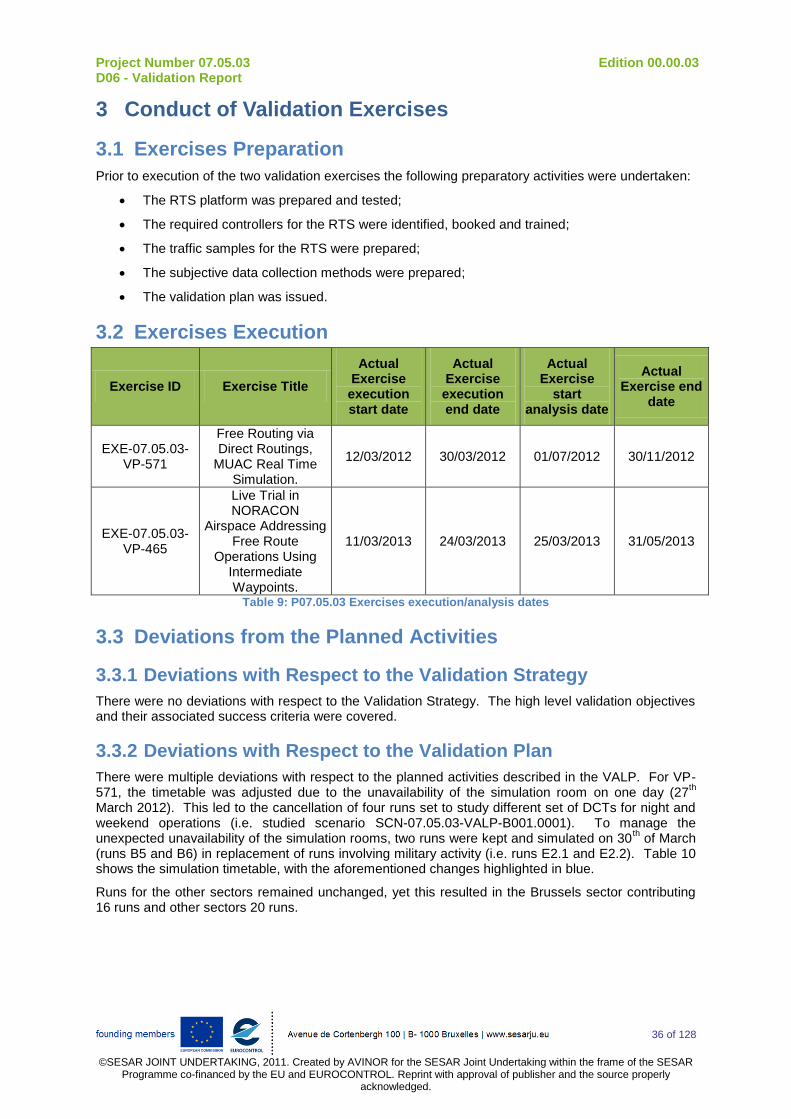
Project Number 07.05.03 Edition 00.00.03 D06 - Validation Report
36 of 128
©SESAR JOINT UNDERTAKING, 2011. Created by AVINOR for the SESAR Joint Undertaking within the frame of the SESAR
Programme co-financed by the EU and EUROCONTROL. Reprint with approval of publisher and the source properly acknowledged.
3 Conduct of Validation Exercises
3.1 Exercises Preparation
Prior to execution of the two validation exercises the following preparatory activities were undertaken:
The RTS platform was prepared and tested;
The required controllers for the RTS were identified, booked and trained;
The traffic samples for the RTS were prepared;
The subjective data collection methods were prepared;
The validation plan was issued.
3.2 Exercises Execution
Exercise ID Exercise Title
Actual Exercise execution start date
Actual Exercise execution end date
Actual Exercise
start analysis date
Actual Exercise end
date
EXE-07.05.03-VP-571
Free Routing via Direct Routings,
MUAC Real Time Simulation.
12/03/2012 30/03/2012 01/07/2012 30/11/2012
EXE-07.05.03-VP-465
Live Trial in NORACON
Airspace Addressing Free Route
Operations Using Intermediate Waypoints.
11/03/2013 24/03/2013 25/03/2013 31/05/2013
Table 9: P07.05.03 Exercises execution/analysis dates
3.3 Deviations from the Planned Activities
3.3.1 Deviations with Respect to the Validation Strategy
There were no deviations with respect to the Validation Strategy. The high level validation objectives and their associated success criteria were covered.
3.3.2 Deviations with Respect to the Validation Plan
There were multiple deviations with respect to the planned activities described in the VALP. For VP-571, the timetable was adjusted due to the unavailability of the simulation room on one day (27
th
March 2012). This led to the cancellation of four runs set to study different set of DCTs for night and weekend operations (i.e. studied scenario SCN-07.05.03-VALP-B001.0001). To manage the unexpected unavailability of the simulation rooms, two runs were kept and simulated on 30
th of March
(runs B5 and B6) in replacement of runs involving military activity (i.e. runs E2.1 and E2.2). Table 10 shows the simulation timetable, with the aforementioned changes highlighted in blue.
Runs for the other sectors remained unchanged, yet this resulted in the Brussels sector contributing 16 runs and other sectors 20 runs.
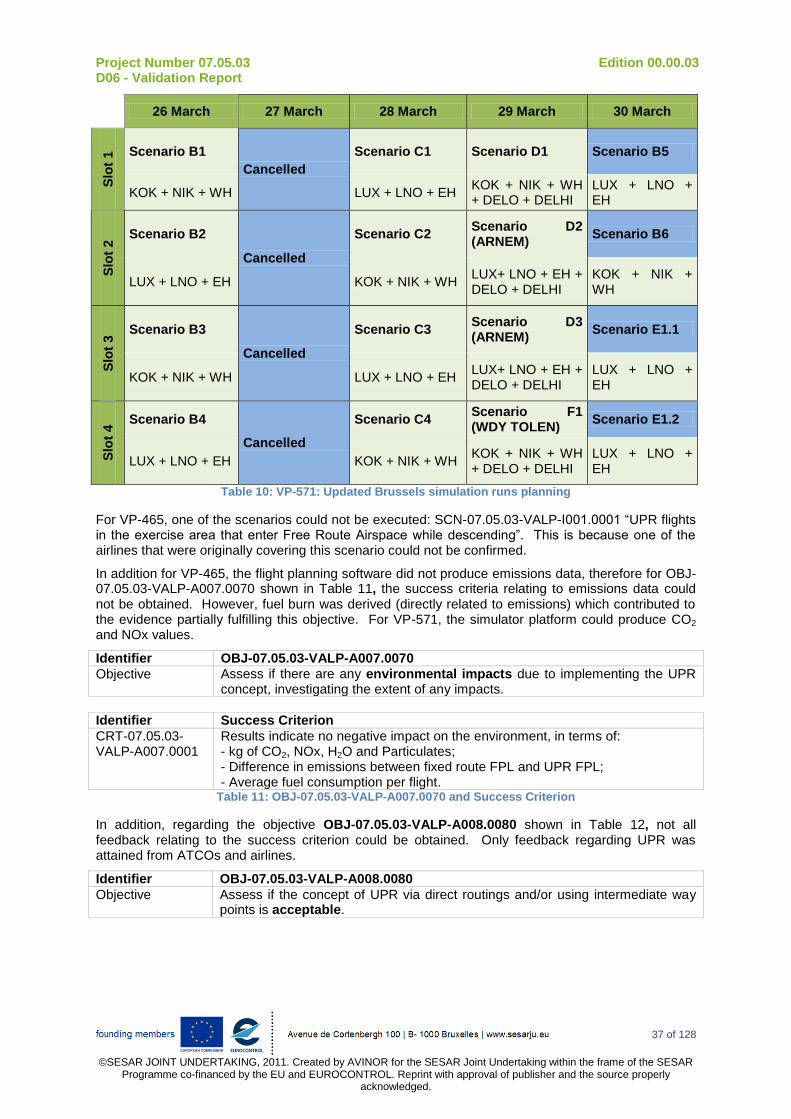
Project Number 07.05.03 Edition 00.00.03 D06 - Validation Report
37 of 128
©SESAR JOINT UNDERTAKING, 2011. Created by AVINOR for the SESAR Joint Undertaking within the frame of the SESAR
Programme co-financed by the EU and EUROCONTROL. Reprint with approval of publisher and the source properly acknowledged.
26 March 27 March 28 March 29 March 30 March S
lot
1 Scenario B1
Cancelled
Scenario C1 Scenario D1 Scenario B5
KOK + NIK + WH LUX + LNO + EH KOK + NIK + WH + DELO + DELHI
LUX + LNO + EH
Slo
t 2
Scenario B2
Cancelled
Scenario C2 Scenario D2 (ARNEM)
Scenario B6
LUX + LNO + EH KOK + NIK + WH LUX+ LNO + EH + DELO + DELHI
KOK + NIK + WH
Slo
t 3
Scenario B3
Cancelled
Scenario C3 Scenario D3 (ARNEM)
Scenario E1.1
KOK + NIK + WH LUX + LNO + EH LUX+ LNO + EH + DELO + DELHI
LUX + LNO + EH
Slo
t 4
Scenario B4
Cancelled
Scenario C4 Scenario F1 (WDY TOLEN)
Scenario E1.2
LUX + LNO + EH KOK + NIK + WH KOK + NIK + WH + DELO + DELHI
LUX + LNO + EH
Table 10: VP-571: Updated Brussels simulation runs planning
For VP-465, one of the scenarios could not be executed: SCN-07.05.03-VALP-I001.0001 “UPR flights in the exercise area that enter Free Route Airspace while descending”. This is because one of the airlines that were originally covering this scenario could not be confirmed.
In addition for VP-465, the flight planning software did not produce emissions data, therefore for OBJ-07.05.03-VALP-A007.0070 shown in Table 11, the success criteria relating to emissions data could not be obtained. However, fuel burn was derived (directly related to emissions) which contributed to the evidence partially fulfilling this objective. For VP-571, the simulator platform could produce CO2 and NOx values.
Identifier OBJ-07.05.03-VALP-A007.0070
Objective Assess if there are any environmental impacts due to implementing the UPR concept, investigating the extent of any impacts.
Identifier Success Criterion
CRT-07.05.03-VALP-A007.0001
Results indicate no negative impact on the environment, in terms of: - kg of CO2, NOx, H2O and Particulates; - Difference in emissions between fixed route FPL and UPR FPL; - Average fuel consumption per flight.
Table 11: OBJ-07.05.03-VALP-A007.0070 and Success Criterion
In addition, regarding the objective OBJ-07.05.03-VALP-A008.0080 shown in Table 12, not all feedback relating to the success criterion could be obtained. Only feedback regarding UPR was attained from ATCOs and airlines.
Identifier OBJ-07.05.03-VALP-A008.0080
Objective Assess if the concept of UPR via direct routings and/or using intermediate way points is acceptable.

Project Number 07.05.03 Edition 00.00.03 D06 - Validation Report
38 of 128
©SESAR JOINT UNDERTAKING, 2011. Created by AVINOR for the SESAR Joint Undertaking within the frame of the SESAR
Programme co-financed by the EU and EUROCONTROL. Reprint with approval of publisher and the source properly acknowledged.
Identifier Success Criterion
CRT-07.05.03-VALP-A008.0001
Results indicate that the concept of UPR is acceptable: - to pilots; - to the Central Flow Management Unit (CFMU); - to ATCOs; - to Airlines; - to Technical systems such as FDP. Table 12: OBJ-07.05.03-VALP-A008.0080 and Success Criterion
For VP-465, Emirates experienced technical issues at the beginning of the trial lasting for five days leading to them being unable to submit UPR FPLs. Also not all Emirates flights which were on routes from Dubai – New York or Dubai - Washington passed through the exercise area due to operational decisions to route elsewhere.
Originally the trial was scheduled from 8th – 21
st April 2013 but was later extended until the 26
th April
to obtain more data. Iceland Air participation extended to this new date resulting in a total of 42 flights, SAS participation did not extend resulting in 28 flights and Emirates did extend resulting in four flights.
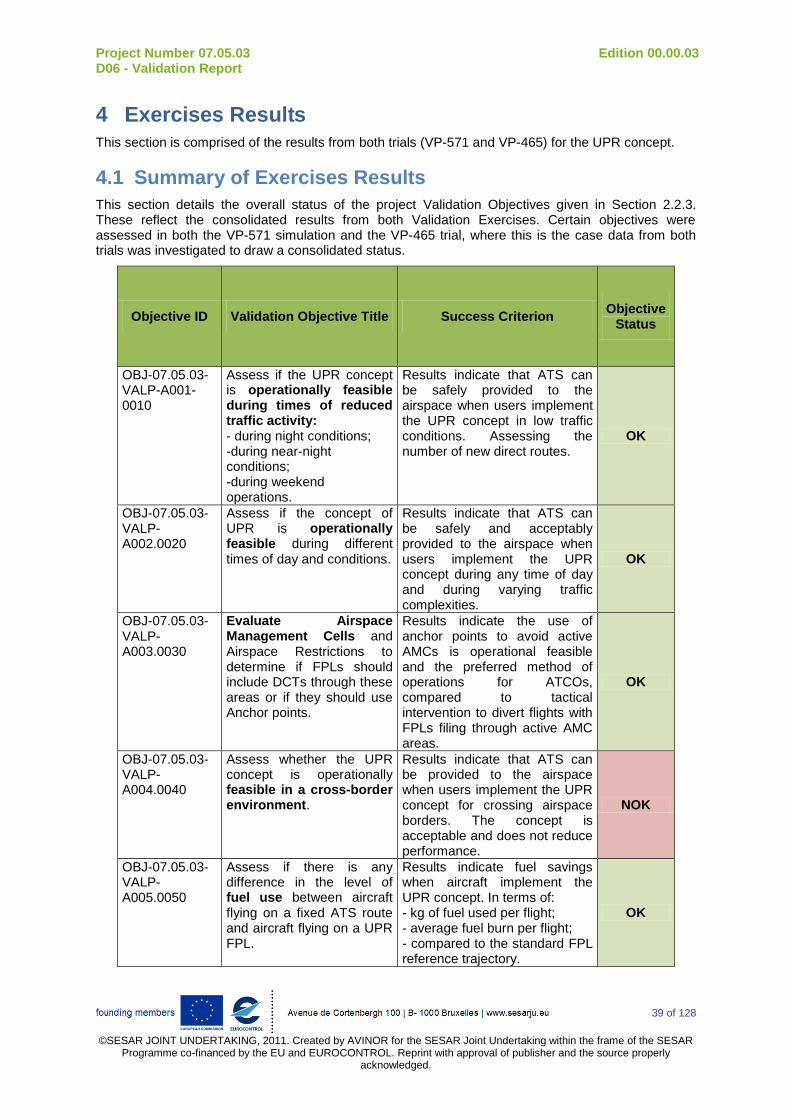
Project Number 07.05.03 Edition 00.00.03 D06 - Validation Report
39 of 128
©SESAR JOINT UNDERTAKING, 2011. Created by AVINOR for the SESAR Joint Undertaking within the frame of the SESAR
Programme co-financed by the EU and EUROCONTROL. Reprint with approval of publisher and the source properly acknowledged.
4 Exercises Results
This section is comprised of the results from both trials (VP-571 and VP-465) for the UPR concept.
4.1 Summary of Exercises Results
This section details the overall status of the project Validation Objectives given in Section 2.2.3. These reflect the consolidated results from both Validation Exercises. Certain objectives were assessed in both the VP-571 simulation and the VP-465 trial, where this is the case data from both trials was investigated to draw a consolidated status.
Objective ID Validation Objective Title Success Criterion Objective
Status
OBJ-07.05.03-VALP-A001-0010
Assess if the UPR concept is operationally feasible during times of reduced traffic activity: - during night conditions; -during near-night conditions; -during weekend operations.
Results indicate that ATS can be safely provided to the airspace when users implement the UPR concept in low traffic conditions. Assessing the number of new direct routes.
OK
OBJ-07.05.03-VALP-A002.0020
Assess if the concept of UPR is operationally feasible during different times of day and conditions.
Results indicate that ATS can be safely and acceptably provided to the airspace when users implement the UPR concept during any time of day and during varying traffic complexities.
OK
OBJ-07.05.03-VALP-A003.0030
Evaluate Airspace Management Cells and Airspace Restrictions to determine if FPLs should include DCTs through these areas or if they should use Anchor points.
Results indicate the use of anchor points to avoid active AMCs is operational feasible and the preferred method of operations for ATCOs, compared to tactical intervention to divert flights with FPLs filing through active AMC areas.
OK
OBJ-07.05.03-VALP-A004.0040
Assess whether the UPR concept is operationally feasible in a cross-border environment.
Results indicate that ATS can be provided to the airspace when users implement the UPR concept for crossing airspace borders. The concept is acceptable and does not reduce performance.
NOK
OBJ-07.05.03-VALP-A005.0050
Assess if there is any difference in the level of fuel use between aircraft flying on a fixed ATS route and aircraft flying on a UPR FPL.
Results indicate fuel savings when aircraft implement the UPR concept. In terms of: - kg of fuel used per flight; - average fuel burn per flight; - compared to the standard FPL reference trajectory.
OK
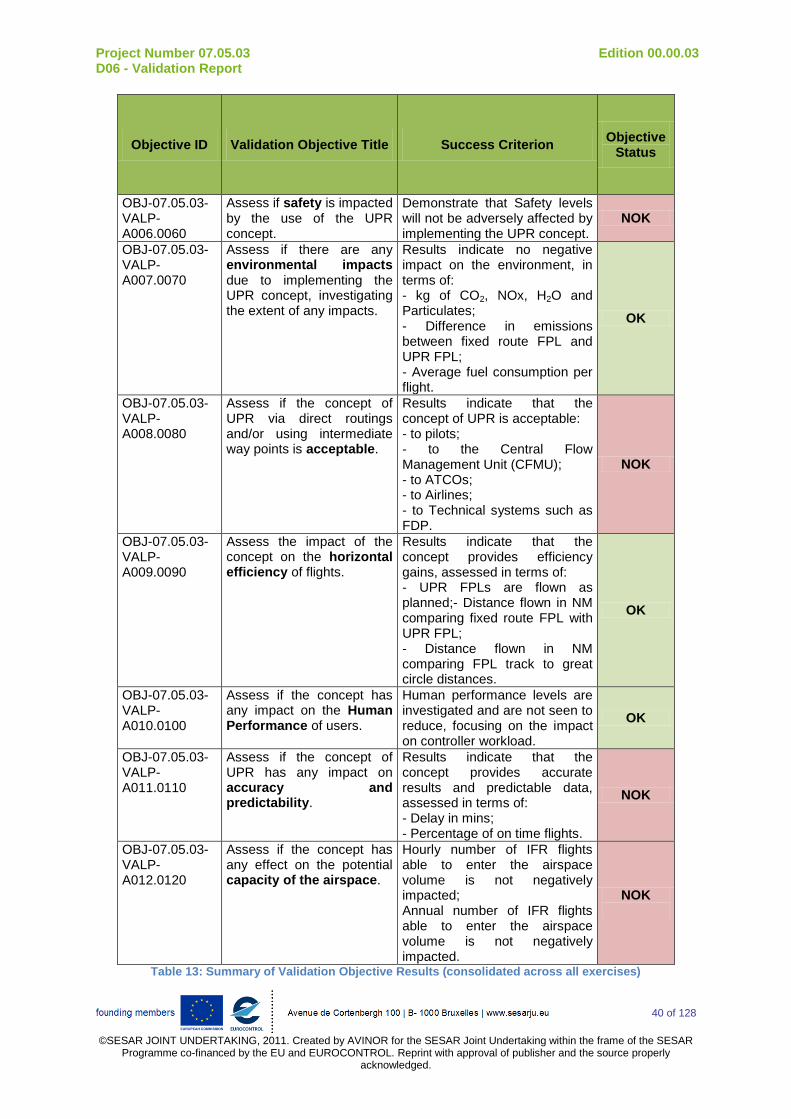
Project Number 07.05.03 Edition 00.00.03 D06 - Validation Report
40 of 128
©SESAR JOINT UNDERTAKING, 2011. Created by AVINOR for the SESAR Joint Undertaking within the frame of the SESAR
Programme co-financed by the EU and EUROCONTROL. Reprint with approval of publisher and the source properly acknowledged.
Objective ID Validation Objective Title Success Criterion Objective
Status
OBJ-07.05.03-VALP-A006.0060
Assess if safety is impacted by the use of the UPR concept.
Demonstrate that Safety levels will not be adversely affected by implementing the UPR concept.
NOK
OBJ-07.05.03-VALP-A007.0070
Assess if there are any environmental impacts due to implementing the UPR concept, investigating the extent of any impacts.
Results indicate no negative impact on the environment, in terms of: - kg of CO2, NOx, H2O and Particulates; - Difference in emissions between fixed route FPL and UPR FPL; - Average fuel consumption per flight.
OK
OBJ-07.05.03-VALP-A008.0080
Assess if the concept of UPR via direct routings and/or using intermediate way points is acceptable.
Results indicate that the concept of UPR is acceptable: - to pilots; - to the Central Flow Management Unit (CFMU); - to ATCOs; - to Airlines; - to Technical systems such as FDP.
NOK
OBJ-07.05.03-VALP-A009.0090
Assess the impact of the concept on the horizontal efficiency of flights.
Results indicate that the concept provides efficiency gains, assessed in terms of: - UPR FPLs are flown as planned;- Distance flown in NM comparing fixed route FPL with UPR FPL; - Distance flown in NM comparing FPL track to great circle distances.
OK
OBJ-07.05.03-VALP-A010.0100
Assess if the concept has any impact on the Human Performance of users.
Human performance levels are investigated and are not seen to reduce, focusing on the impact on controller workload.
OK
OBJ-07.05.03-VALP-A011.0110
Assess if the concept of UPR has any impact on accuracy and predictability.
Results indicate that the concept provides accurate results and predictable data, assessed in terms of: - Delay in mins; - Percentage of on time flights.
NOK
OBJ-07.05.03-VALP-A012.0120
Assess if the concept has any effect on the potential capacity of the airspace.
Hourly number of IFR flights able to enter the airspace volume is not negatively impacted; Annual number of IFR flights able to enter the airspace volume is not negatively impacted.
NOK
Table 13: Summary of Validation Objective Results (consolidated across all exercises)
Project Number 07.05.03 Edition 00.00.03 D06 - Validation Report
41 of 128
©SESAR JOINT UNDERTAKING, 2011. Created by AVINOR for the SESAR Joint Undertaking within the frame of the SESAR
Programme co-financed by the EU and EUROCONTROL. Reprint with approval of publisher and the source properly acknowledged.
4.1.1 Results on Concept Clarification
4.1.1.1 Operational Feasibility
The feasibility of the concept is largely based upon theoretical FPL and simulation data, with the exception of the subjective questionnaire data from ATCOs based on UPR FPLs that were flown. The validation exercises assessed the feasibility of different aspects of the UPR concept, with VP-465 validating the core concept and VP-571 validating the feasibility of certain aspects and only implementing DCT routes. Both methods of implementing the UPR concept were accepted with the proviso that traffic numbers and traffic complexity were low. The method of using DCT routing resulted in 79% of routes being implemented in low traffic conditions. When more route flexibility was introduced by allowing the use of intermediate way points (e.g. UPR FPLs), airlines were able to successfully adhere to their preferred routes on 91% of occasions.
Findings from VP-571 suggest that the concept is not feasible within a cross border environment, this being due to a negative perceived impact on controller performance (when considering the MUAC-Copenhagen border) which reduced their ability to react to unusual events. There would also be increased workload and time spent on the coordination of traffic across borders. However within VP-465 the UPR concept was applied across FIRs (although UPR FPLs that were flown did require to use a published FIR border waypoint) and ATCOs did not indicate any issues with elevated workloads, although this may have been due to the low number of UPR FPLs that were flown per sector.
The concept is reliant on the use of flight planned anchor points to navigate around active AMC-manageable areas. FPLs which included DCTs through restricted areas relied upon ATCO tactical intervention to navigate around such areas when they became active. Controller tactical intervention increased ATCO workload above levels deemed acceptable by the controllers, due to increased airspace complexity. Without the use of anchor points predicted conflicts increased and safety was not guaranteed.
ATCOs within VP-571 highlighted that the use of DCTs may increase workload due to changes in the traffic pattern. ATCOs also commented that conflict detection time may reduce. Using the UPR concept with intermediate waypoints ATCOs did not feel performance would be negatively impacted. However they did highlight that technical integration and interoperability would be paramount to maintain airspace capacity. Technical issues surfaced when handling the UPR concept, these involved issues coordinating with custom latitude and longitude points. These technical issues have the potential to reduce controller’s capacity to handle the same level of traffic, due to increased workload.
Airlines partaking in the VP-465 trial found the concept to be operationally feasible as they were able to make cost efficiency gains between 73% and 100% of the time compared to using non UPR FPLs (dependent on the airlines method of creating UPR FPLs). UPR FPLs were able to be implemented 91% of the time highlighting the concept is operationally feasible at the traffic level and complexities found within VP-465.
Developing UPR FPLs so they are as flexible as possible has been seen to be the most operationally feasible method of implementing the concept. The use of intermediate (including unpublished) waypoints provides the largest flexibility compared to existing operations using non UPR FPLs or DCT FPLs. This extra flexibility was only fully implemented by Emirates within VP-465 but was shown to enable the airline to optimise their UPR FPLs.
4.1.1.2 Acceptability
The acceptability of the concept to ATCOs and Airlines was investigated.
The UPR concept was deemed acceptable by airlines, due to improved route optimisation and flexibility. ATCOs accepted the concept in VP-465 as it was not seen to have a negative impact on performance or airspace safety.
Overall the concept is deemed to be acceptable by ATCOs for low traffic situations and low traffic complexity. However if this is not the case then the use of the UPR concept by airlines should be kept to a reduced level. Currently results provide no evidence that workload will remain acceptable and

Project Number 07.05.03 Edition 00.00.03 D06 - Validation Report
42 of 128
©SESAR JOINT UNDERTAKING, 2011. Created by AVINOR for the SESAR Joint Undertaking within the frame of the SESAR
Programme co-financed by the EU and EUROCONTROL. Reprint with approval of publisher and the source properly acknowledged.
safety standards will be met if a high UPR concept usage is implemented in more complex/busy airspace.
Acceptance of other actors was not directly collected, this included pilots responsible for aircraft participating in VP-465. CFMU was also not directly questioned regarding their acceptance of the concept and its impact on their centralised management of the airspace; however UPR FPLs within VP-465 were accepted by CFMU. More information would be needed to assess details of any issues that may have arisen with technical systems
4.1.2 Results per KPA
4.1.2.1 Efficiency
Efficiency is a primary driver for the UPR concept, with environmental and cost efficiency being paramount for multiple stakeholders such as aircraft operators, airlines and governments wishing to reduce the carbon footprint of aviation. This was assessed by comparing distance, time and fuel burn savings provided by the best UPR FPL compared with the best non UPR FPL for each flight. In addition, the distance flown calculated from the UPR FPL and non UPR FPLs were compared to the great circle distance to investigate how much airlines were able to optimise distance against the shortest possible route.
The variable that is optimised for the UPR FPL was under control of airlines.. The more flexible the method used to create UPR FPLs, potentially the more efficient the FPL became. The most optimal UPR FPLs were selected on the day of flight by making adjustments to accommodate for weather and ATC charges etc.
When using DCT routings within the MUAC RTS exercise area there was an average flown distance reduction of 7% between non UPR FPLs and DCT FPLs. Fuel savings within the exercise area ranged from 6% to 12%, with results indicating that increased distance saving does not always equate to increased fuel saving. Expanding the concept to cover UPR FPLs the saving for the whole flight was 0.15% to 0.3% of distance and 0.1% to 0.2% of fuel compared to non UPR FPLs.
Results indicate that airlines consistently produced UPR FPLs that had an equal or reduced flight time compared to non UPR FPLs. Emirates UPR FPLs producing the most time efficient routes, it is interesting to note that these UPR FPLs did not save the most distance. The average flight time saving for an entire FPL within VP-465 was 0.0% to 0.8% saving. Within the MUAC RTS exercise area the average flight time reduction amounted to 2 minutes or 5% reduction.
Average fuel savings experienced based on UPR FPLs show: Emirates experienced a saving of 0.21%, Iceland Air 0.11% and SAS 0.17%. For both SAS and Iceland Air, some flights did not save fuel as a result of the UPR concept. Emirates only submitted a small data set hence detailed conclusions could not be drawn. One could speculatively note that Emirates made more use of the flexibility of this concept than the other airlines by using intermediate waypoints as part of their UPR FPLs. SAS were restricted by only looking at using DCT routings from start to end. While Iceland Air designed UPR FPLs before the trial which could mean there were better alternative UPR FPLs that could have been designed on a day by day basis.
UPR flight planners have the potential to use the flexibility provided by the concept to optimise route efficiency for distance, wind, weather, ATC charges etc. hence produce consistent fuel savings.
Within VP-465 UPR FPL distances within the exercise area were compared to the great circle distances to judge route efficiency. Results showed that Emirates non UPR FPLs were the least optimised for distance (although already had a good level of efficiency) and SAS had the most optimised non UPR FPLs due to their use of the DK/SE FAB DCTs which provided route optimisation for part of the exercise area (VP-465-Baseline 2). Adherence to the great circle route increased under the UPR concept, although it should be noted that FPLs under current operations are already between 98.2% and 98.8% efficient to the great circle.
The efficiency savings detailed above would translate into cost benefits to airlines.
Project Number 07.05.03 Edition 00.00.03 D06 - Validation Report
43 of 128
©SESAR JOINT UNDERTAKING, 2011. Created by AVINOR for the SESAR Joint Undertaking within the frame of the SESAR
Programme co-financed by the EU and EUROCONTROL. Reprint with approval of publisher and the source properly acknowledged.
4.1.2.2 Cost Effectiveness
Fuel is a primary component of airline cost and hence any fuel efficiency gains translate into cost savings. If the UPR concept is used throughout an increased percentage of the overall flight then efficiencies and cost savings are maximised. Within Europe airlines may also benefit from reduced expense under the EU ETS due to reduced carbon emissions.
Total cost per flight ranged from -0.32% loss to 0.62% saving. Results show that for every 1% of fuel saving there is a 0.75% of cost saving. This indicates fuel is highly correlated to flight cost but is not the only contributing factor. For example, changes to route could have an impact on which en-route charging zones are flown through and hence increase/reduced ATC charges.
4.1.2.3 Environmental Sustainability
The use of UPR FPLs in VP-465 and DCT routings in VP-571 produced fuel savings; hence emissions produced due to fuel burnt would therefore be reduced by a proportional amount.
Aircraft utilising a more flexible route and approach to UPR flight planning were seen to maximise fuel saving and hence environmental efficiencies. Detailed emission data was not gathered as the flight planning software from each airline did not calculate this metric.
4.1.2.4 Predictability
Initial qualitative insights into the impact of the concept on predictability are positive. Results from controllers are based upon the UPR FPLs that were flown. Results from the VP-465 live trial indicate that airlines adhered to their UPR FPLs 91% of the time compared to 78% of the time when flying non UPR FPLs.
VP-571 did not assess predictability directly but results do show that flight time reduced by an average of 2 minutes per flight. With adherence to FPLs being high and flight time reductions achieved compared to non UPR FPLs; the concept would increase arrival predictability at aerodromes and hence improve the predictability of airlines network operations at hub airports. However, comparing actual flight data to FPL data would be required to confirm the conclusion on whether UPR FPLs are flown more accurately than non UPR FPLs.
4.1.2.5 Safety
The safety of the concept is dependent on the number of flights using the UPR concept in the airspace, the complexity of the airspace and the traffic level. When any of these elements is raised then a level of risk is introduced. The average safety feedback from ATCOs in VP-571 indicated 55% felt scenarios were safe. However it is unknown how this safety feedback is distributed across scenarios.
When the use of the UPR concept was kept low (as in VP-465) 91% of ATCOs felt safety was maintained and felt other traffic would not be impacted by the UPR concept when used for en-route flights. 86% of ATCOs felt the concept was safe and would not impact traffic when used for vertically evolving flights.
If UPR FPLs are to include transit through AMC-manageable areas during times when they are active, then anchor points should be included in FPLs to enable aircraft to navigate around. If this is not done then ATCO workload increases to unacceptable levels, due to increased traffic density and complexity.
Safety under objective OBJ-07.05.03-VALP-A006.0060 has been deemed not to have been successfully fulfilled. Despite initial indications that the concept is safe further detail is needed from the VP-571 safety results before the success criterion can be fully satisfied.
4.1.2.6 Human Performance
Human performance within VP-571 generally was not significantly impacted. Also within VP-465 the majority of ATCOs did not feel the concept had any impact on their performance.
Results indicate that in the MUAC RTS using DCTs increased controller workload, however 92% of the ATCOs indicated that workload still remained at an acceptable level. Averaged results for VP-571
Project Number 07.05.03 Edition 00.00.03 D06 - Validation Report
44 of 128
©SESAR JOINT UNDERTAKING, 2011. Created by AVINOR for the SESAR Joint Undertaking within the frame of the SESAR
Programme co-financed by the EU and EUROCONTROL. Reprint with approval of publisher and the source properly acknowledged.
indicate the majority of controllers felt the concept had no impact on controller tasks. However over 20% of ATCOs rated conflict detection and scanning as being worse under the concept than in current operations.
In VP-465 results regarding UPR FPLs that were flown indicate that vertically evolving flights within the exercise area had a higher percentage of negative responses than en-route flights. This indicates controllers felt their workload was less impacted if the flights were only cruising.
Factors that negatively impacted controller workload include a lack of information about the UPR FPLs that were flown and technical issues. One negative response stated they had to coordinate a release from Bodø which had not received a FPL/ACT message. Comments also stated that the equipment did not allow Advanced Boundary Information (ABI)/ Aircraft Coordination Time (ACT) messages to be a customised latitude and longitude waypoint and could only use pre-defined points.
4.1.2.7 Flexibility
The use of the UPR concept was seen to increase the flexibility for the AU. Airlines benefited from being able to choose which route to fly through the airspace and hence efficiency gains were recorded. Limitations to the concept, such as having fixed FIR border crossing points, reduced the flexibility benefits.
Other KPAs are maximised when flexibility is fully incorporated within the planning and execution of the UPR FPL. With flight planners influencing the outcome of other KPAs by the level of flexibility they introduce into the UPR FPL.
Using DCTs do not bring about as many gains in other KPAs as DCTs are a less flexible option within the UPR concept.
4.1.2.8 Capacity
Airspace capacity has the potential to decrease under the UPR concept, during low traffic and during 24/7 operations. This estimation was made in VP-571 as DCTs increased the traffic complexity and this resulted in an increase in the severity of potential conflict types. Capacity may also be reduced if the concept is not used in low traffic/complexity situations due to increases in controller workload. Despite this finding, VP-571 indicated that switching from the standard route network to DCTs resulted in fewer or the same amount of predicted conflicts (with the exception of DECO which showed an increase), yet as the severity of these conflicts changes capacity may still be forced to reduce.
The time that flights remain with an airspace sector was seen to reduce when using the UPR concept, in theory this will increase airspace capacity as a single sector will be able to handle an increased number of aircraft per hour compared to current operations. Another way the concept may potentially increase airspace capacity, that was not fully validated, is by using the airspace more efficiently, due to the distribution of routes outside of the fixed route network.
4.1.3 Results impacting Regulation and Standardisation Initiatives
N/A

Project Number 07.05.03 Edition 00.00.03 D06 - Validation Report
45 of 128
©SESAR JOINT UNDERTAKING, 2011. Created by AVINOR for the SESAR Joint Undertaking within the frame of the SESAR Programme co-financed by the EU and EUROCONTROL. Reprint
with approval of publisher and the source properly acknowledged.
4.2 Analysis of Exercises Results
The following presents a summary of collated results per Validation Objective, measured against relevant success criterion.
Exercise ID
Validation Objective
ID
Validation Objective Title
Success Criterion Exercise Result Validation Objective
Status
VP-571
OBJ-07.05.03-VALP-A001-0010
Assess if the concept of UPR is operationally feasible during times of reduced traffic activity: - during night conditions; - during near-night conditions; - during weekend operations.
Results indicate that ATS can be safely provided to the airspace when users implement the UPR concept in low traffic conditions. Assessing the number of new direct routes.
Results indicate free routing via DCTs can be implemented in low traffic conditions.
79% of DCTs tested were approved for implementation.
ATCOs did highlight the possibility of increased confusion and workload due to changes in the traffic pattern/behaviour (e.g. increased turning angles and reduced time to detect conflicts).
DCTs rejected consisted of those creating opposite flows of traffic and severely reducing controller performance.
ATCOs determined that the concept could also be implemented H24 if DCTs did not enter AMC manageable areas. 98 new DCTs were approved.
OK
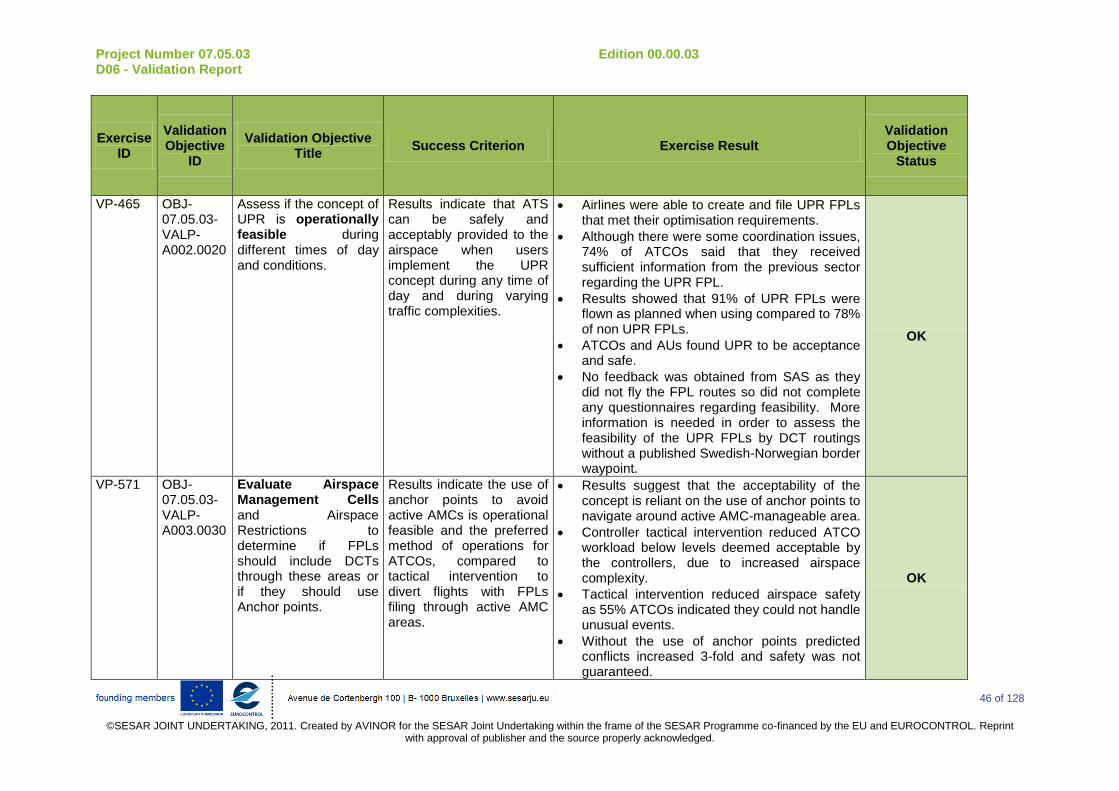
Project Number 07.05.03 Edition 00.00.03 D06 - Validation Report
46 of 128
©SESAR JOINT UNDERTAKING, 2011. Created by AVINOR for the SESAR Joint Undertaking within the frame of the SESAR Programme co-financed by the EU and EUROCONTROL. Reprint
with approval of publisher and the source properly acknowledged.
Exercise ID
Validation Objective
ID
Validation Objective Title
Success Criterion Exercise Result Validation Objective
Status
VP-465 OBJ-07.05.03-VALP-A002.0020
Assess if the concept of UPR is operationally feasible during different times of day and conditions.
Results indicate that ATS can be safely and acceptably provided to the airspace when users implement the UPR concept during any time of day and during varying traffic complexities.
Airlines were able to create and file UPR FPLs that met their optimisation requirements.
Although there were some coordination issues, 74% of ATCOs said that they received sufficient information from the previous sector regarding the UPR FPL.
Results showed that 91% of UPR FPLs were flown as planned when using compared to 78% of non UPR FPLs.
ATCOs and AUs found UPR to be acceptance and safe.
No feedback was obtained from SAS as they did not fly the FPL routes so did not complete any questionnaires regarding feasibility. More information is needed in order to assess the feasibility of the UPR FPLs by DCT routings without a published Swedish-Norwegian border waypoint.
OK
VP-571 OBJ-07.05.03-VALP-A003.0030
Evaluate Airspace Management Cells and Airspace Restrictions to determine if FPLs should include DCTs through these areas or if they should use Anchor points.
Results indicate the use of anchor points to avoid active AMCs is operational feasible and the preferred method of operations for ATCOs, compared to tactical intervention to divert flights with FPLs filing through active AMC areas.
Results suggest that the acceptability of the concept is reliant on the use of anchor points to navigate around active AMC-manageable area.
Controller tactical intervention reduced ATCO workload below levels deemed acceptable by the controllers, due to increased airspace complexity.
Tactical intervention reduced airspace safety as 55% ATCOs indicated they could not handle unusual events.
Without the use of anchor points predicted conflicts increased 3-fold and safety was not guaranteed.
OK
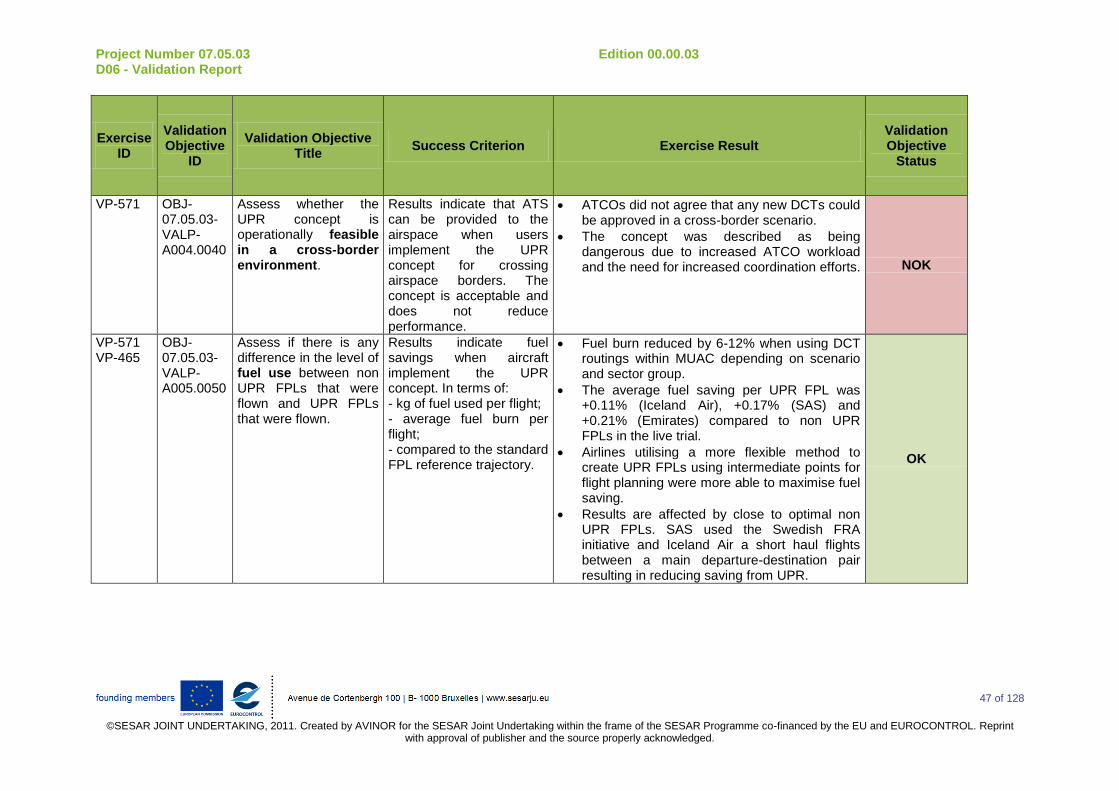
Project Number 07.05.03 Edition 00.00.03 D06 - Validation Report
47 of 128
©SESAR JOINT UNDERTAKING, 2011. Created by AVINOR for the SESAR Joint Undertaking within the frame of the SESAR Programme co-financed by the EU and EUROCONTROL. Reprint
with approval of publisher and the source properly acknowledged.
Exercise ID
Validation Objective
ID
Validation Objective Title
Success Criterion Exercise Result Validation Objective
Status
VP-571 OBJ-07.05.03-VALP-A004.0040
Assess whether the UPR concept is operationally feasible in a cross-border environment.
Results indicate that ATS can be provided to the airspace when users implement the UPR concept for crossing airspace borders. The concept is acceptable and does not reduce performance.
ATCOs did not agree that any new DCTs could be approved in a cross-border scenario.
The concept was described as being dangerous due to increased ATCO workload and the need for increased coordination efforts. NOK
VP-571 VP-465
OBJ-07.05.03-VALP-A005.0050
Assess if there is any difference in the level of fuel use between non UPR FPLs that were flown and UPR FPLs that were flown.
Results indicate fuel savings when aircraft implement the UPR concept. In terms of: - kg of fuel used per flight; - average fuel burn per flight; - compared to the standard FPL reference trajectory.
Fuel burn reduced by 6-12% when using DCT routings within MUAC depending on scenario and sector group.
The average fuel saving per UPR FPL was +0.11% (Iceland Air), +0.17% (SAS) and +0.21% (Emirates) compared to non UPR FPLs in the live trial.
Airlines utilising a more flexible method to create UPR FPLs using intermediate points for flight planning were more able to maximise fuel saving.
Results are affected by close to optimal non UPR FPLs. SAS used the Swedish FRA initiative and Iceland Air a short haul flights between a main departure-destination pair resulting in reducing saving from UPR.
OK
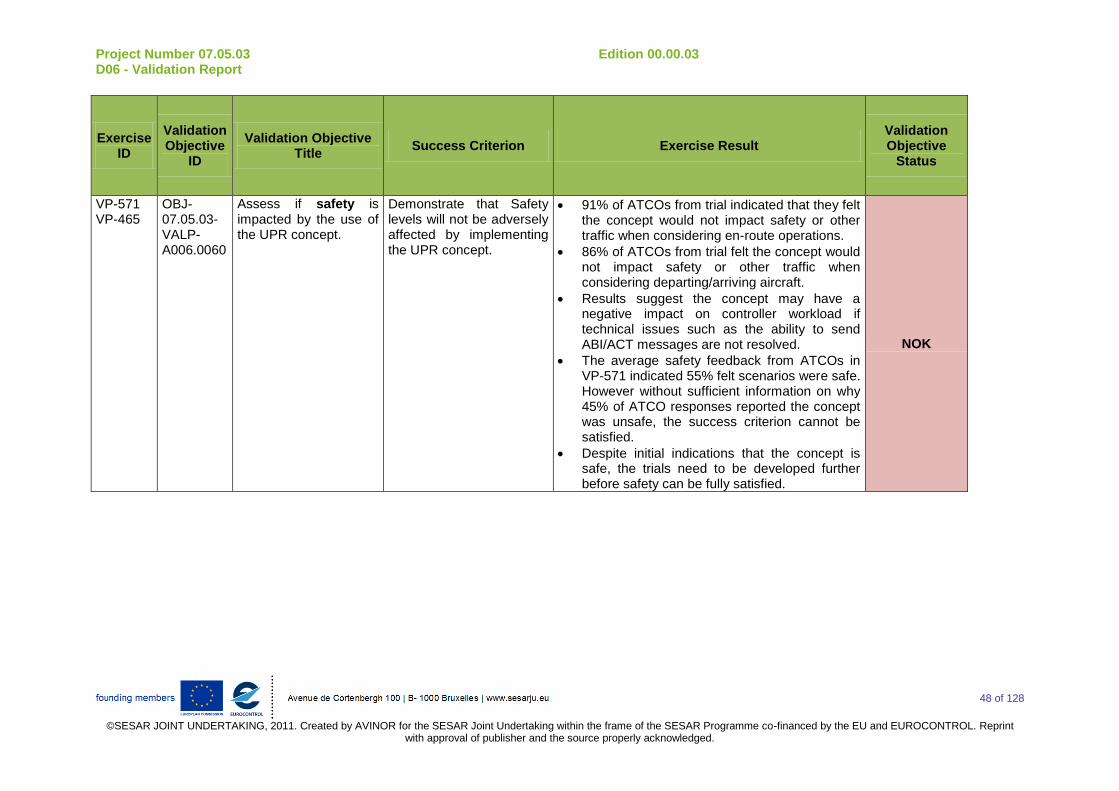
Project Number 07.05.03 Edition 00.00.03 D06 - Validation Report
48 of 128
©SESAR JOINT UNDERTAKING, 2011. Created by AVINOR for the SESAR Joint Undertaking within the frame of the SESAR Programme co-financed by the EU and EUROCONTROL. Reprint
with approval of publisher and the source properly acknowledged.
Exercise ID
Validation Objective
ID
Validation Objective Title
Success Criterion Exercise Result Validation Objective
Status
VP-571 VP-465
OBJ-07.05.03-VALP-A006.0060
Assess if safety is impacted by the use of the UPR concept.
Demonstrate that Safety levels will not be adversely affected by implementing the UPR concept.
91% of ATCOs from trial indicated that they felt the concept would not impact safety or other traffic when considering en-route operations.
86% of ATCOs from trial felt the concept would not impact safety or other traffic when considering departing/arriving aircraft.
Results suggest the concept may have a negative impact on controller workload if technical issues such as the ability to send ABI/ACT messages are not resolved.
The average safety feedback from ATCOs in VP-571 indicated 55% felt scenarios were safe. However without sufficient information on why 45% of ATCO responses reported the concept was unsafe, the success criterion cannot be satisfied.
Despite initial indications that the concept is safe, the trials need to be developed further before safety can be fully satisfied.
NOK
Project Number 07.05.03 Edition 00.00.03 D06 - Validation Report
49 of 128
©SESAR JOINT UNDERTAKING, 2011. Created by AVINOR for the SESAR Joint Undertaking within the frame of the SESAR Programme co-financed by the EU and EUROCONTROL. Reprint
with approval of publisher and the source properly acknowledged.
Exercise ID
Validation Objective
ID
Validation Objective Title
Success Criterion Exercise Result Validation Objective
Status
VP-571 VP-465
OBJ-07.05.03-VALP-A007.0070
Assess if there are any environmental impacts due to implementing the UPR concept, investigating the extent of any impacts.
Results indicate no negative impact on the environment, in terms of: - kg of CO2, NOX, H2O and Particulates; - Difference in emissions between non UPR FPL and UPR FPL; - Average fuel consumption per flight.
Results show the concept produced a fuel saving in participating airlines hence emissions produced would be reduced by a proportional amount (between +0.11% and +0.21%).
UPR FPLs have the potential to use the flexibility provided by the concept to optimise for distance, wind, weather, ATC costs etc. hence produce consistent fuel savings (as results from Emirates indicate).
Average reduction in emissions ranged from 6% to 12% within MUAC when using DCTs depending on the scenario and the sector group.
OK
Project Number 07.05.03 Edition 00.00.03 D06 - Validation Report
50 of 128
©SESAR JOINT UNDERTAKING, 2011. Created by AVINOR for the SESAR Joint Undertaking within the frame of the SESAR Programme co-financed by the EU and EUROCONTROL. Reprint
with approval of publisher and the source properly acknowledged.
Exercise ID
Validation Objective
ID
Validation Objective Title
Success Criterion Exercise Result Validation Objective
Status
VP-571 VP-465
OBJ-07.05.03-VALP-A008.0080
Assess if the concept of UPR via direct routings and/or using intermediate way points is acceptable.
Results indicate that the concept of UPR is acceptable: - to pilots; - to the Central Flow Management Unit (CFMU); - to ATCOs; - to Airlines; - to Technical systems such as FDP.
MUAC results showed ATCOs felt the concept using DCT routings was acceptable during low traffic periods.
The UPR concept was deemed acceptable by airlines, due to gains in flight cost optimisation and flexibility.
ATCOs accepted the concept as it was not seen to have a negative impact on Human Performance or airspace safety.
UPR FPLs were successfully filed through the CFMU however more information would be needed to confirm detail of any issues.
No feedback was obtained from pilots.
Technical issues were reported due to not being able to send ABI/ACT messages with custom points.
The data provided is overwhelmingly positive and shows no signs of being unsafe but there is a lack of data from the remaining stakeholders i.e. pilots and information with respect to the FDP and CFMU. This feedback is essential in order to fully assess the acceptability of the concept.
NOK
Project Number 07.05.03 Edition 00.00.03 D06 - Validation Report
51 of 128
©SESAR JOINT UNDERTAKING, 2011. Created by AVINOR for the SESAR Joint Undertaking within the frame of the SESAR Programme co-financed by the EU and EUROCONTROL. Reprint
with approval of publisher and the source properly acknowledged.
Exercise ID
Validation Objective
ID
Validation Objective Title
Success Criterion Exercise Result Validation Objective
Status
VP-571 VP-465
OBJ-07.05.03-VALP-A009.0090
Assess the impact of the concept on the horizontal efficiency of flights.
Results indicate that the concept provides efficiency gains, assessed in terms of: - UPR FPLs are flown as planned; - Distance flown in NM comparing non UPR FPL with UPR FPL; - Distance flown in NM comparing FPL track to great circle distances.
Results show an average distance reduction of between +0.15% and +0.26% during the live trial.
Results and airline feedback indicate the level of horizontal efficiency savings is affected by methods used to create UPR FPLs and the pre-existing conditions (such as close to optimal route network or current FRA initiatives).
The RTS found the average flown distance saving was 7% between non UPR flights and DCT flights, for the whole MUAC area, which represents 13NM gained per flight.
Time efficiency improved by 5% within the MUAC area when using DCTs.
OK

Project Number 07.05.03 Edition 00.00.03 D06 - Validation Report
52 of 128
©SESAR JOINT UNDERTAKING, 2011. Created by AVINOR for the SESAR Joint Undertaking within the frame of the SESAR Programme co-financed by the EU and EUROCONTROL. Reprint
with approval of publisher and the source properly acknowledged.
Exercise ID
Validation Objective
ID
Validation Objective Title
Success Criterion Exercise Result Validation Objective
Status
VP-571 VP-465
OBJ-07.05.03-VALP-A010.0100
Assess if the concept has any impact on the Human Performance of users.
Human performance levels are investigated and are not seen to reduce, focusing on the impact on controller workload.
Results from the RTS indicate that using DCTs does increase ATCO workload although 92% of ATCOs said that the workload was still at an acceptable level.
Traffic complexity negatively impacted performance yet the ATCOs still approved low traffic and 24 hour operational routes for implementation.
Averaged results for all scenarios in VP-571 indicate the majority of controllers felt the concept had no impact on controller tasks. However over 20% of ATCOs rated conflict detection and scanning as being worse under the concept than in current operations.
When using tactical intervention to reroute flights around active AMC-manageable areas workload increased and safety could not be guaranteed.
ATCO comments indicate an increase in co-ordination may increase workload.
Technical systems negatively impacted performance as at times the systems were unable to handle UPR FPLs.
No feedback was obtained from SAS as they did not fly the FPL routes so did not complete any questionnaires regarding human performance. More information is needed in order to assess the human performance of the UPR FPLs by DCT routings without a published cross border waypoint.
OK
Project Number 07.05.03 Edition 00.00.03 D06 - Validation Report
53 of 128
©SESAR JOINT UNDERTAKING, 2011. Created by AVINOR for the SESAR Joint Undertaking within the frame of the SESAR Programme co-financed by the EU and EUROCONTROL. Reprint
with approval of publisher and the source properly acknowledged.
Exercise ID
Validation Objective
ID
Validation Objective Title
Success Criterion Exercise Result Validation Objective
Status
VP-571 VP-465
OBJ-07.05.03-VALP-A011.0110
Assess if the concept of UPR has any impact on accuracy and predictability.
Results indicate that the concept provides accurate results and predictable data, assessed in terms of: - Delay in minutes; -Percentage of on time flights.
Throughout all scenarios in VP-571 results showed a reduction in flight time of 2 minutes per flight, this corresponded to a 5% reduction in flight time within the exercise area.
ATCOs indicated a 91% UPR FPL adherence in VP-465.
Data quality in VP-465 reduced the significance of results due to being purely subjective and including gaps in data. The questionnaire data was incomplete (ATCOs were unable to complete questionnaires for all flight stages).
Initial indications are positive but confidence in results needs to be improved.
NOK
VP-571
OBJ-07.05.03-VALP-A012.0120
Assess if the concept has any effect on the potential capacity of the airspace.
Hourly number of IFR flights able to enter the airspace volume is not negatively impacted; Annual number of IFR flights able to enter the airspace volume is not negatively impacted.
DCTs increased traffic complexity and this resulted in an increase in the severity of potential conflict types.
The number of potential conflicts either remained the same or decreased compared to current operations (apart from in DECO which showed an increase).
As a result it was not thought possible for capacity to be increased under the concept if safety is not to be negatively impacted.
ATCO comments indicated that workload was reduced under certain scenarios of VP-571 but remained within acceptable levels.
As traffic complexity increased controller performance and acceptance of new DCTs decreased.
NOK
Table 14: Summary of Validation Objective Results for all exercises

Project Number 07.05.03 Edition 00.00.03 D06 - Validation Report
54 of 128
©SESAR JOINT UNDERTAKING, 2011. Created by AVINOR for the SESAR Joint Undertaking within the frame of the SESAR
Programme co-financed by the EU and EUROCONTROL. Reprint with approval of publisher and the source properly acknowledged.
4.2.1 Unexpected Behaviours/Results
Results have shown that DCTs are not always the most cost effective route. Although this result is a not unusual it had not been expected or detailed within the VALP [6]. The dominant influences over flight efficiency require further investigation, however these results indicate that track mileage reduction is not always the most effective method of fuel saving.
4.3 Confidence in Results of Validation Exercises
4.3.1 Quality of Validation Exercise Results
Several issues impacted the quality of the validation exercise results as detailed below:
1. Results from VP-465 were constrained due to this exercise being conducted in a live operational environment where variables could not be fixed. This makes comparison and repeatability difficult as well as statistical comparison irrelevant in many areas.
2. Airlines with VP-465 used different criteria to select routes. SAS only implemented DCT routes with no Swedish-Norwegian border waypoints. Iceland Air planned a mixture of DCT routes between SID/STAR and Swedish-Norwegian border waypoints. Emirates operated UPR FPLs based upon best business trajectory.
3. Only two of the three airlines operated flights that actually executed their UPR FPLs, this limits confidence in results regarding safety, human performance and predictability which relied on the flights taking place.
4. Results for Emirates airlines operating under SCN-07.05.03-VALP-G001.0001 only included four flights, this reduce the representative and significance of these results.
5. The number of ATCOs who participated by filling in End of Shift questionnaires for this trial is unknown. Although 149 individual questionnaires were completed each questionnaire was anonymous and hence it is not possible to see if the responses come from one or multiple controllers.
4.3.2 Significance of Validation Exercise Results
Results related to predictability under Objective OBJ-07.05.03-VALP-A011.0110 were formed using a detailed qualitative assessment based on controller questionnaires (VP-465). Although these results are important, the use of quantitative data based on radar measurements would provide more accurate results where confidence can be assessed.
The number of independent variables within VP-465 was high due to airlines implementing the UPR concept in different ways, flights taking place at different times of day, using different aircraft types and in varying weather conditions. This resulted in there being no possibility of performing a reliable statistically analysis of results to find causal effects. It has been highlighted as a recommendation that statistical analysis and increased sample sizes be used in subsequent trials.
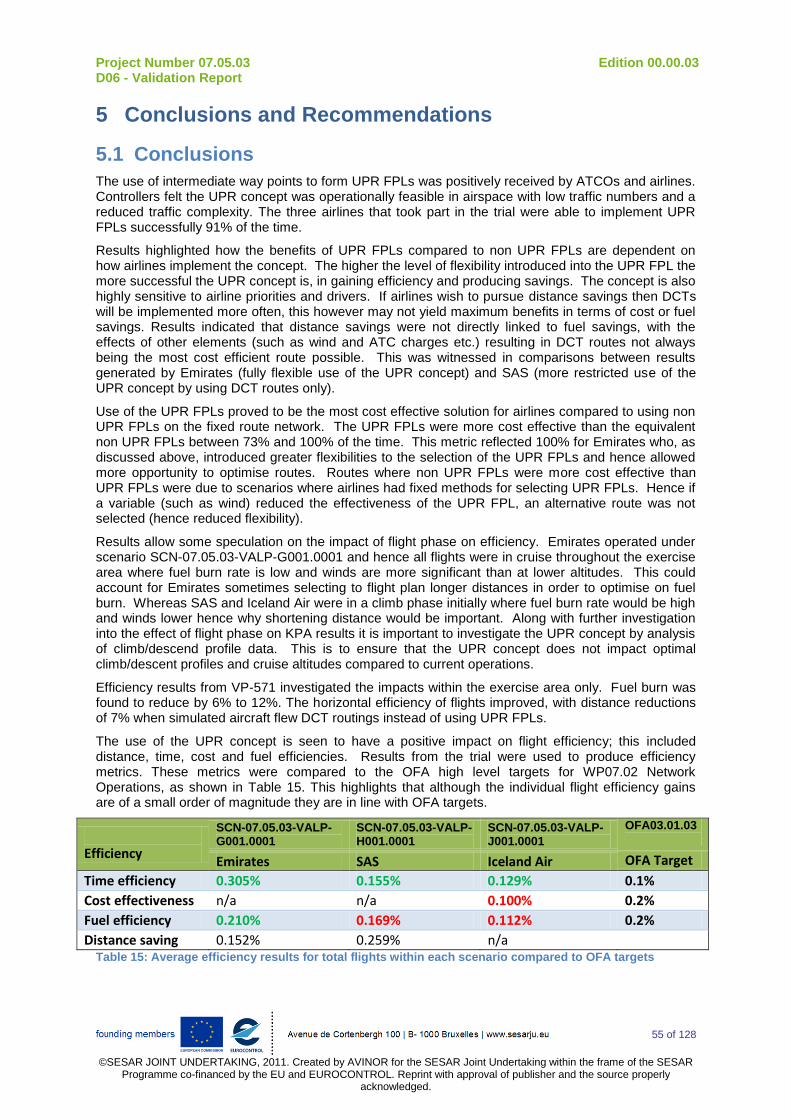
Project Number 07.05.03 Edition 00.00.03 D06 - Validation Report
55 of 128
©SESAR JOINT UNDERTAKING, 2011. Created by AVINOR for the SESAR Joint Undertaking within the frame of the SESAR
Programme co-financed by the EU and EUROCONTROL. Reprint with approval of publisher and the source properly acknowledged.
5 Conclusions and Recommendations
5.1 Conclusions
The use of intermediate way points to form UPR FPLs was positively received by ATCOs and airlines. Controllers felt the UPR concept was operationally feasible in airspace with low traffic numbers and a reduced traffic complexity. The three airlines that took part in the trial were able to implement UPR FPLs successfully 91% of the time.
Results highlighted how the benefits of UPR FPLs compared to non UPR FPLs are dependent on how airlines implement the concept. The higher the level of flexibility introduced into the UPR FPL the more successful the UPR concept is, in gaining efficiency and producing savings. The concept is also highly sensitive to airline priorities and drivers. If airlines wish to pursue distance savings then DCTs will be implemented more often, this however may not yield maximum benefits in terms of cost or fuel savings. Results indicated that distance savings were not directly linked to fuel savings, with the effects of other elements (such as wind and ATC charges etc.) resulting in DCT routes not always being the most cost efficient route possible. This was witnessed in comparisons between results generated by Emirates (fully flexible use of the UPR concept) and SAS (more restricted use of the UPR concept by using DCT routes only).
Use of the UPR FPLs proved to be the most cost effective solution for airlines compared to using non UPR FPLs on the fixed route network. The UPR FPLs were more cost effective than the equivalent non UPR FPLs between 73% and 100% of the time. This metric reflected 100% for Emirates who, as discussed above, introduced greater flexibilities to the selection of the UPR FPLs and hence allowed more opportunity to optimise routes. Routes where non UPR FPLs were more cost effective than UPR FPLs were due to scenarios where airlines had fixed methods for selecting UPR FPLs. Hence if a variable (such as wind) reduced the effectiveness of the UPR FPL, an alternative route was not selected (hence reduced flexibility).
Results allow some speculation on the impact of flight phase on efficiency. Emirates operated under scenario SCN-07.05.03-VALP-G001.0001 and hence all flights were in cruise throughout the exercise area where fuel burn rate is low and winds are more significant than at lower altitudes. This could account for Emirates sometimes selecting to flight plan longer distances in order to optimise on fuel burn. Whereas SAS and Iceland Air were in a climb phase initially where fuel burn rate would be high and winds lower hence why shortening distance would be important. Along with further investigation into the effect of flight phase on KPA results it is important to investigate the UPR concept by analysis of climb/descend profile data. This is to ensure that the UPR concept does not impact optimal climb/descent profiles and cruise altitudes compared to current operations.
Efficiency results from VP-571 investigated the impacts within the exercise area only. Fuel burn was found to reduce by 6% to 12%. The horizontal efficiency of flights improved, with distance reductions of 7% when simulated aircraft flew DCT routings instead of using UPR FPLs.
The use of the UPR concept is seen to have a positive impact on flight efficiency; this included distance, time, cost and fuel efficiencies. Results from the trial were used to produce efficiency metrics. These metrics were compared to the OFA high level targets for WP07.02 Network Operations, as shown in Table 15. This highlights that although the individual flight efficiency gains are of a small order of magnitude they are in line with OFA targets.
Efficiency
SCN-07.05.03-VALP-G001.0001
SCN-07.05.03-VALP-H001.0001
SCN-07.05.03-VALP-J001.0001
OFA03.01.03
Emirates SAS Iceland Air OFA Target
Time efficiency 0.305% 0.155% 0.129% 0.1%
Cost effectiveness n/a n/a 0.100% 0.2%
Fuel efficiency 0.210% 0.169% 0.112% 0.2%
Distance saving 0.152% 0.259% n/a Table 15: Average efficiency results for total flights within each scenario compared to OFA targets
Project Number 07.05.03 Edition 00.00.03 D06 - Validation Report
56 of 128
©SESAR JOINT UNDERTAKING, 2011. Created by AVINOR for the SESAR Joint Undertaking within the frame of the SESAR
Programme co-financed by the EU and EUROCONTROL. Reprint with approval of publisher and the source properly acknowledged.
Time efficiency targets were exceeded within every scenario by every airline within VP-465, with results from Emirates exceeding the OFA target of 0.1% by a factor of 3.
Fuel efficiency targets were only met by Emirates. Results for SAS airlines were approaching OFA targets and Iceland Air need to double fuel efficiency performance before targets can be met. The environmental implications of the UPR concept are in correlation to the increased fuel efficiencies recorded. The various approaches taken by these airlines in relation to flight planning priorities and phase of flight help to explain these results. However, further trials with a higher degree of fixed variables and validation control are required to attribute cause and effect.
Iceland Air was the only airline able to report on cost, with an average cost saving of 0.1% the trial has achieved 50% of the OFA target for cost effectiveness. As fuel is currently a primary component of airline cost, any fuel efficiency gains would translate into cost savings. Results show that for every 1% of fuel saving there is a 0.75% of cost saving. Within Europe, airlines may also benefit from reduced expense under the EU ETS due to reduced carbon emissions.
In addition to OFA targets horizontal efficiencies were gained within the trial in the region of 0.1% to 0.2% of the overall flight. If routes are also optimised for weather and wind conditions these gains should help to contribute to time and fuel efficiencies.
Safety of the concept requires further validation to test sensitivity to usage level. VP-465 gained positive controller feedback with regards to safety; however this trial only consisted of a limited number of flights, none of which were known to be simultaneously active within the airspace. ATCOs indicated they felt that at higher traffic levels and complexity the concept may not meet safety standards due to the negative impact it would have on controller workload.
Subjective results from VP-465 indicate several negative impacts on ATCO workload; however they do not appear to be caused by a flaw in the UPR concept. Rather the reasons are either that the controller was not expecting a flight with a UPR FPL or due to a limitation in the equipment to handle custom latitude and longitude boundary points.
Overall the workload results are promising and show the controllers were still able to operate while implementing the UPR concept in the traffic conditions of the VP-465 trial. On average in VP-571 ATCOs did not feel the concept had any impact on their ability to perform tasks however comments did indicate that workload would be impacted especially at increased traffic level and complexity.
If aircraft flight plan through an active AMC area but have to be tactically re-routed around active restricted areas then the workload increases beyond a level deemed safe by the controllers. The use of anchor points to achieve navigation around active restricted areas was viewed as a vital feature for ATCOs to complement the UPR concept despite reduced efficiency.
The concept did not improve capacity within VP-571. With the exception of Deco the amount of conflicts either remained the same or decreased. However the severity of conflict type was seen to increase when using the concept; however the number of conflicts was largely unaffected. This may result in capacity reductions if the severity of conflicts increased controller workload too much.
Flights saved 5% flight time within the exercise area of VP-571 on average, which amounted to two minutes per flight. Reductions in sector flight time have the potential to increase the number of flights per minute able to enter each sector, however due to the increased traffic complexity potentially reducing controller capacity this is unlikely.
Within these exercises quantitative actual track data was not collected, this imposed restrictions on the level of analysis that could be performed. By not assessing the actual track information from UPR FPLs that were flown it was not possible for efficiency gains to be considered in actual terms.
It is already considered by the concept that in current operations non UPR FPLs are not always adhered to when flown, due to pilot requesting/ATCOs giving DCTs to provide more efficient routes when possible. Results found in VP-465 corroborate this as non UPR FPL adherence was less than UPR FPL adherence. The UPR concept must be able to validate the efficiency findings against actual track data for flights using a non UPR FPL that may apply DCT routings. It is theorised that the efficiency gains seen when comparing FPL data will be reduced when comparing actual track data.
In order to implement an effective validation in subsequent iterations the operational constraints should be tackled. Co-ordination issues that surfaced require further investigation and the impact of altitude and flight phase also require evaluation to establish their impact on fuel efficiency.
Project Number 07.05.03 Edition 00.00.03 D06 - Validation Report
57 of 128
©SESAR JOINT UNDERTAKING, 2011. Created by AVINOR for the SESAR Joint Undertaking within the frame of the SESAR
Programme co-financed by the EU and EUROCONTROL. Reprint with approval of publisher and the source properly acknowledged.
It is recommended that this concept should undergo another iteration of V3 validation before maturing to V4. Despite the successful completion of the majority of Validation Objectives, the concepts scope needs to be focused and exercises adapted to address the concept with a higher degree of relevance. This is so that fitness for purpose in a range of operational scenarios can be established. The quality of data needs to be more controlled so that the confidence in results can be improved. Please see section 5.2 for recommendations.
Project Number 07.05.03 Edition 00.00.03 D06 - Validation Report
58 of 128
©SESAR JOINT UNDERTAKING, 2011. Created by AVINOR for the SESAR Joint Undertaking within the frame of the SESAR
Programme co-financed by the EU and EUROCONTROL. Reprint with approval of publisher and the source properly acknowledged.
5.2 Recommendations
Recommendations for the Validation Exercises VP-571 and VP-465 include the following:
5.2.1 Recommendations on Concept and Procedures
With regards to the concept and associated procedures, the following points are recommended:
Investigate the feasibility of implementing cross border UPR FPLs which do not require an FIR border point;
Focus on CFMU and FDP system to ensure they adequately support implementation of the UPR concept;
Regarding vertically evolving flights that filed UPR FPLs, investigate transition between fixed route network at lower levels and the FRA above;
Using actual track data investigate the impact of the concept on the vertical efficiency of UPR FPLs that are flown as well as the horizontal efficiency (already obtained). This would ensure that the UPR concept provides climb/descent profiles and cruise altitudes that are at least as good as equivalent non UPR FPLs;
The concept of anchor points should be assessed by the regulator and standard procedures developed;
Investigate modifications to the method of crossing the MUAC-Copenhagen border;
Better understanding needed about achieved fuel burn savings to attribute such savings to distance reductions and less fuel mass on aircraft.
5.2.2 Recommendations on Key Performance Areas
In order to improve the analysis of KPAs the following is recommended:
To extend safety analysis an increased number of UPR FPLs that are flown is needed to generate scenarios where multiple aircraft are using the UPR concept in an airspace volume;
Potential coordination issues and changes in amount of phone calls which could impact workload need further investigation to determine if they occur due to the UPR concept;
Investigate the number and type of conflicts comparing different phases of flight within FRA;
Predictability needs to be assessed by comparing UPR FPLs against actual track data to improve fidelity;
Measure differences in number of tactical instructions given to flights filing UPR and non UPR FPLs to assess if concept results in less ATCO intervention due to AUs optimising routes at the planning stage;
Assess how much efficiency improvements are affected by errors in the forecasted weather as current efficiency gains are small;
Gain more understanding in how vertically evolving flights affects fuel efficiency;
Assess impact of tactical DCTs on UPR concept efficiency gains using actual track and fuel burn information.
5.2.3 Recommendations for Future Validation Exercises/Planning
With regards to the future validation exercises, the following points are recommended:
Another iteration at V3 maturity is needed to successfully validate the UPR concept by using another live trial. This should still be within Northern European airspace due to low airspace/traffic complexity but will require a greater number of flights;

Project Number 07.05.03 Edition 00.00.03 D06 - Validation Report
59 of 128
©SESAR JOINT UNDERTAKING, 2011. Created by AVINOR for the SESAR Joint Undertaking within the frame of the SESAR
Programme co-financed by the EU and EUROCONTROL. Reprint with approval of publisher and the source properly acknowledged.
The methods that airlines use to create UPR FPLs needs to be consistent between each scenario to enable more reliable comparisons;
Actual track data will be required as well as FPL data to ensure the concept is being assessed sufficiently at V3 maturity.
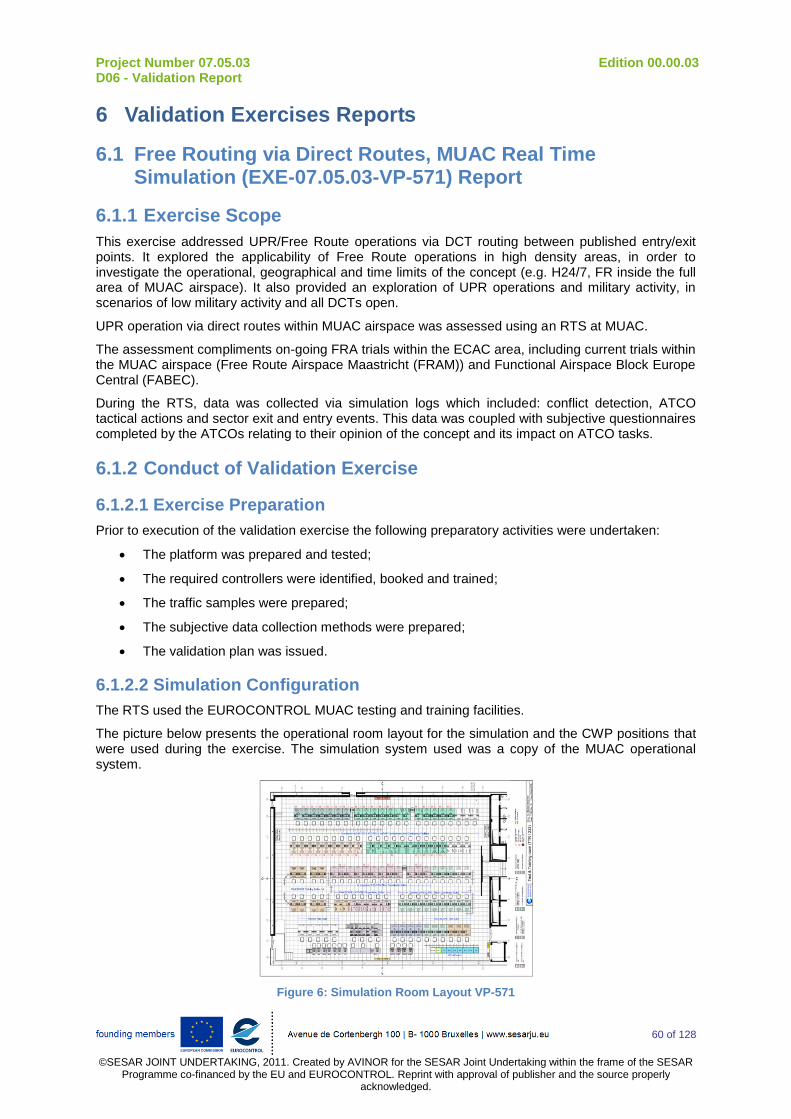
Project Number 07.05.03 Edition 00.00.03 D06 - Validation Report
60 of 128
©SESAR JOINT UNDERTAKING, 2011. Created by AVINOR for the SESAR Joint Undertaking within the frame of the SESAR
Programme co-financed by the EU and EUROCONTROL. Reprint with approval of publisher and the source properly acknowledged.
6 Validation Exercises Reports
6.1 Free Routing via Direct Routes, MUAC Real Time Simulation (EXE-07.05.03-VP-571) Report
6.1.1 Exercise Scope
This exercise addressed UPR/Free Route operations via DCT routing between published entry/exit points. It explored the applicability of Free Route operations in high density areas, in order to investigate the operational, geographical and time limits of the concept (e.g. H24/7, FR inside the full area of MUAC airspace). It also provided an exploration of UPR operations and military activity, in scenarios of low military activity and all DCTs open.
UPR operation via direct routes within MUAC airspace was assessed using an RTS at MUAC.
The assessment compliments on-going FRA trials within the ECAC area, including current trials within the MUAC airspace (Free Route Airspace Maastricht (FRAM)) and Functional Airspace Block Europe Central (FABEC).
During the RTS, data was collected via simulation logs which included: conflict detection, ATCO tactical actions and sector exit and entry events. This data was coupled with subjective questionnaires completed by the ATCOs relating to their opinion of the concept and its impact on ATCO tasks.
6.1.2 Conduct of Validation Exercise
6.1.2.1 Exercise Preparation
Prior to execution of the validation exercise the following preparatory activities were undertaken:
The platform was prepared and tested;
The required controllers were identified, booked and trained;
The traffic samples were prepared;
The subjective data collection methods were prepared;
The validation plan was issued.
6.1.2.2 Simulation Configuration
The RTS used the EUROCONTROL MUAC testing and training facilities.
The picture below presents the operational room layout for the simulation and the CWP positions that were used during the exercise. The simulation system used was a copy of the MUAC operational system.
Figure 6: Simulation Room Layout VP-571
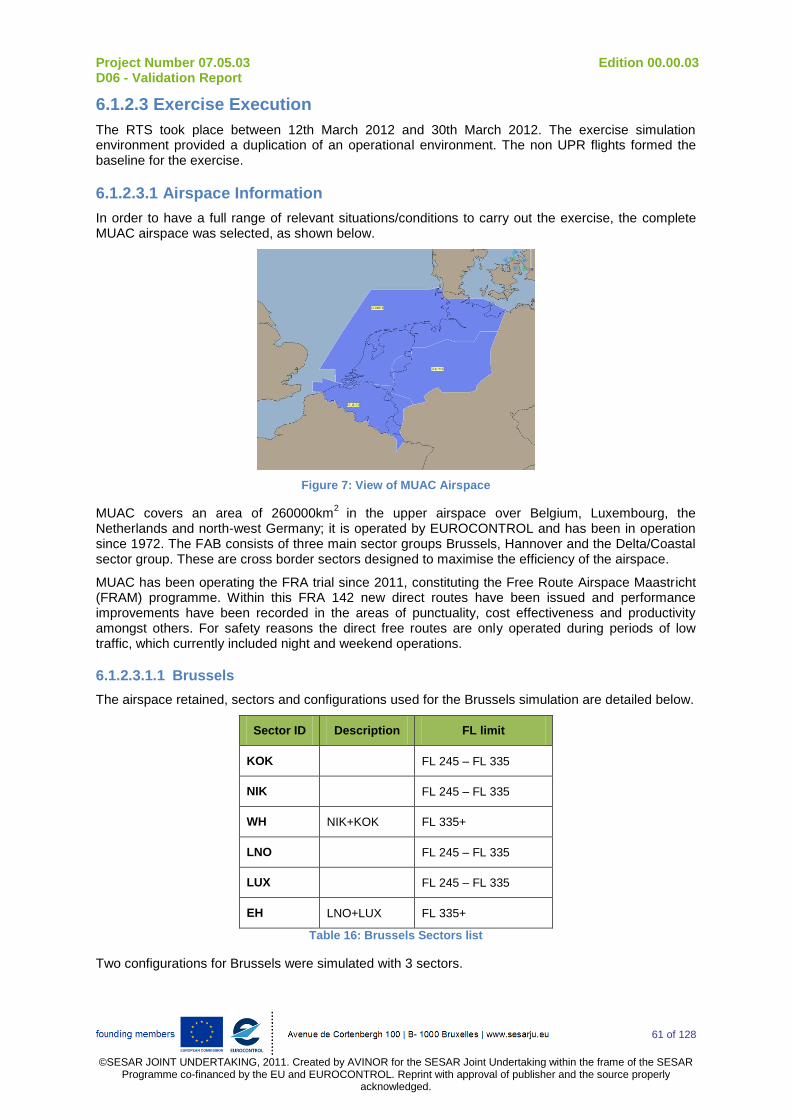
Project Number 07.05.03 Edition 00.00.03 D06 - Validation Report
61 of 128
©SESAR JOINT UNDERTAKING, 2011. Created by AVINOR for the SESAR Joint Undertaking within the frame of the SESAR
Programme co-financed by the EU and EUROCONTROL. Reprint with approval of publisher and the source properly acknowledged.
6.1.2.3 Exercise Execution
The RTS took place between 12th March 2012 and 30th March 2012. The exercise simulation environment provided a duplication of an operational environment. The non UPR flights formed the baseline for the exercise.
6.1.2.3.1 Airspace Information
In order to have a full range of relevant situations/conditions to carry out the exercise, the complete MUAC airspace was selected, as shown below.
Figure 7: View of MUAC Airspace
MUAC covers an area of 260000km2
in the upper airspace over Belgium, Luxembourg, the Netherlands and north-west Germany; it is operated by EUROCONTROL and has been in operation since 1972. The FAB consists of three main sector groups Brussels, Hannover and the Delta/Coastal sector group. These are cross border sectors designed to maximise the efficiency of the airspace.
MUAC has been operating the FRA trial since 2011, constituting the Free Route Airspace Maastricht (FRAM) programme. Within this FRA 142 new direct routes have been issued and performance improvements have been recorded in the areas of punctuality, cost effectiveness and productivity amongst others. For safety reasons the direct free routes are only operated during periods of low traffic, which currently included night and weekend operations.
6.1.2.3.1.1 Brussels
The airspace retained, sectors and configurations used for the Brussels simulation are detailed below.
Sector ID Description FL limit
KOK FL 245 – FL 335
NIK FL 245 – FL 335
WH NIK+KOK FL 335+
LNO FL 245 – FL 335
LUX FL 245 – FL 335
EH LNO+LUX FL 335+
Table 16: Brussels Sectors list
Two configurations for Brussels were simulated with 3 sectors.

Project Number 07.05.03 Edition 00.00.03 D06 - Validation Report
62 of 128
©SESAR JOINT UNDERTAKING, 2011. Created by AVINOR for the SESAR Joint Undertaking within the frame of the SESAR
Programme co-financed by the EU and EUROCONTROL. Reprint with approval of publisher and the source properly acknowledged.
Configuration Description
3 Sectors
3 Sectors
Figure 8: Brussels sector configurations
6.1.2.3.1.2 Hannover
The airspace retained, sectors and configurations used for the Hanover simulation are detailed below.
Sector ID Description FL limit
RUHR/MUN MUN+RHR FL 245+
HHW MUN+RHR FL 335+
RHLO RHR low FL 245 - FL 335
MNLO MUN low FL 245 - FL 335
ESHI CEL+SOL high FL 335+
SOLO SOLINGEN FL 245 - FL 335
CELO CELLE FL 245 - FL 335
SOL SOL FL 245+
MNS MUNSTER FL 245+
CEL CEL FL 245+
RHR RHR FL 245+
Table 17: Hannover Sector list
WH
KOK NIK
EH
LNO LUX

Project Number 07.05.03 Edition 00.00.03 D06 - Validation Report
63 of 128
©SESAR JOINT UNDERTAKING, 2011. Created by AVINOR for the SESAR Joint Undertaking within the frame of the SESAR
Programme co-financed by the EU and EUROCONTROL. Reprint with approval of publisher and the source properly acknowledged.
Five configurations for Hannover were simulated, one with 2 sectors, three with 3 sectors and the last with five sectors.
Configuration Description
2 Sectors
3 Sectors
3 Sectors
3 Sectors
MNS RHR
HHW
RHLO MNLO
ESHI
SOLO CELO
RUHR/
MUN SOL
CELO
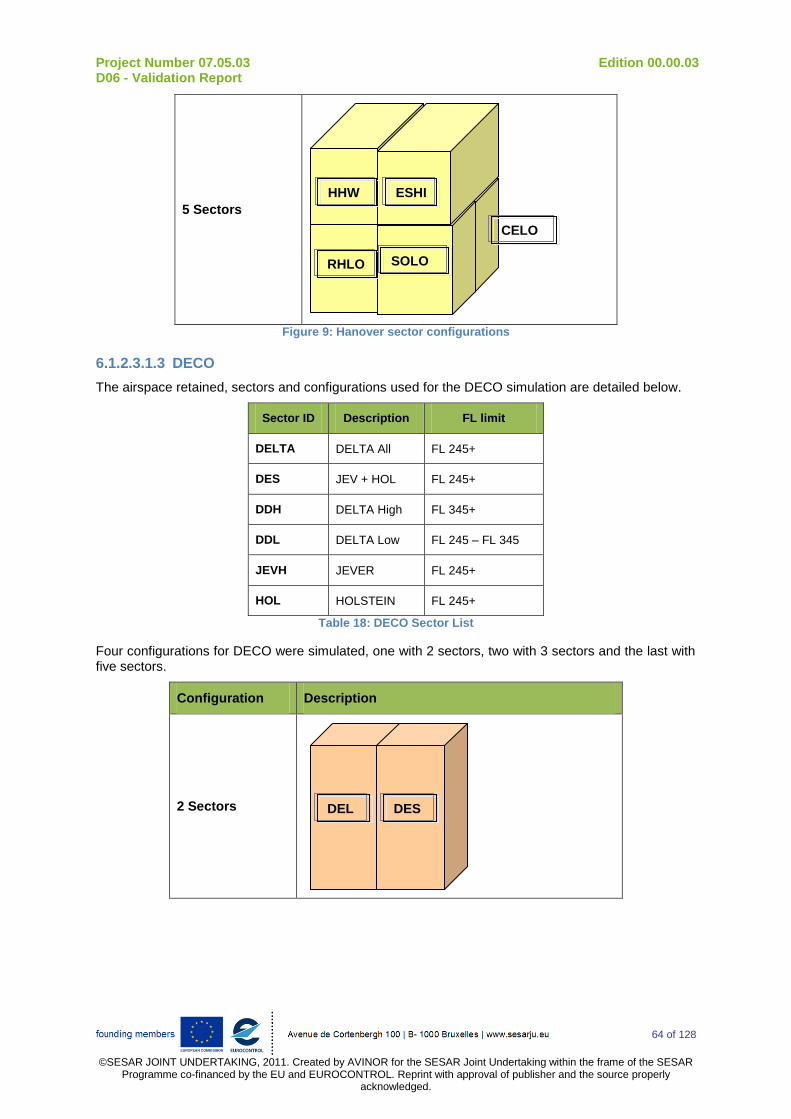
Project Number 07.05.03 Edition 00.00.03 D06 - Validation Report
64 of 128
©SESAR JOINT UNDERTAKING, 2011. Created by AVINOR for the SESAR Joint Undertaking within the frame of the SESAR
Programme co-financed by the EU and EUROCONTROL. Reprint with approval of publisher and the source properly acknowledged.
5 Sectors
Figure 9: Hanover sector configurations
6.1.2.3.1.3 DECO
The airspace retained, sectors and configurations used for the DECO simulation are detailed below.
Sector ID Description FL limit
DELTA DELTA All FL 245+
DES JEV + HOL FL 245+
DDH DELTA High FL 345+
DDL DELTA Low FL 245 – FL 345
JEVH JEVER FL 245+
HOL HOLSTEIN FL 245+
Table 18: DECO Sector List
Four configurations for DECO were simulated, one with 2 sectors, two with 3 sectors and the last with five sectors.
Configuration Description
2 Sectors
RHLO SOLO
CELO
HHW ESHI
DEL DES

Project Number 07.05.03 Edition 00.00.03 D06 - Validation Report
65 of 128
©SESAR JOINT UNDERTAKING, 2011. Created by AVINOR for the SESAR Joint Undertaking within the frame of the SESAR
Programme co-financed by the EU and EUROCONTROL. Reprint with approval of publisher and the source properly acknowledged.
3 Sectors
3 Sectors
5 Sectors
Figure 10: DECO sector configurations
6.1.2.3.1.4 Identification of Military Areas
The table below presents the list of military areas that were used during the validation exercise for scenario SCN-07.05.03-VALP-E001.0001.
AREA ANCHOR POINTS ACTIVATION TIMES
ED-R302A EEL
WSR
ON : 09.30 – 10.00z
DHI
DELMD
DES
DELTA
JEV
HOL
DDL
JEVH
DDH
HOL
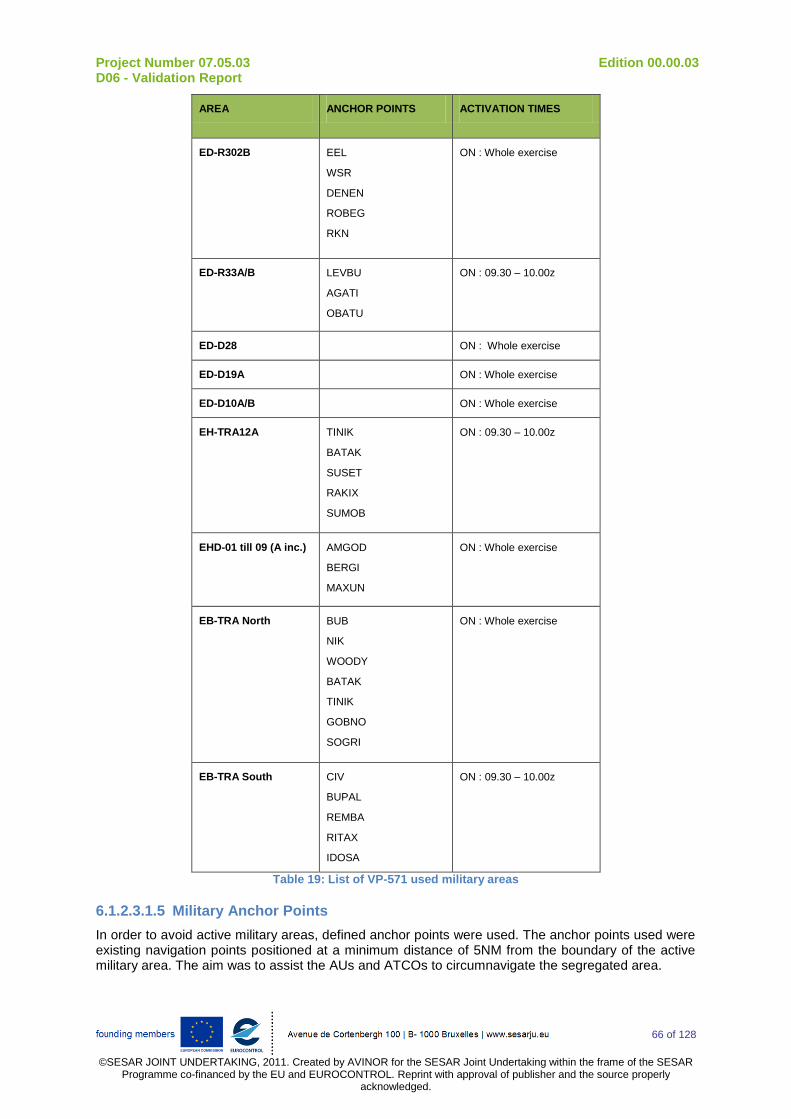
Project Number 07.05.03 Edition 00.00.03 D06 - Validation Report
66 of 128
©SESAR JOINT UNDERTAKING, 2011. Created by AVINOR for the SESAR Joint Undertaking within the frame of the SESAR
Programme co-financed by the EU and EUROCONTROL. Reprint with approval of publisher and the source properly acknowledged.
AREA ANCHOR POINTS ACTIVATION TIMES
ED-R302B EEL
WSR
DENEN
ROBEG
RKN
ON : Whole exercise
ED-R33A/B LEVBU
AGATI
OBATU
ON : 09.30 – 10.00z
ED-D28 ON : Whole exercise
ED-D19A ON : Whole exercise
ED-D10A/B ON : Whole exercise
EH-TRA12A TINIK
BATAK
SUSET
RAKIX
SUMOB
ON : 09.30 – 10.00z
EHD-01 till 09 (A inc.) AMGOD
BERGI
MAXUN
ON : Whole exercise
EB-TRA North BUB
NIK
WOODY
BATAK
TINIK
GOBNO
SOGRI
ON : Whole exercise
EB-TRA South CIV
BUPAL
REMBA
RITAX
IDOSA
ON : 09.30 – 10.00z
Table 19: List of VP-571 used military areas
6.1.2.3.1.5 Military Anchor Points
In order to avoid active military areas, defined anchor points were used. The anchor points used were existing navigation points positioned at a minimum distance of 5NM from the boundary of the active military area. The aim was to assist the AUs and ATCOs to circumnavigate the segregated area.

Project Number 07.05.03 Edition 00.00.03 D06 - Validation Report
67 of 128
©SESAR JOINT UNDERTAKING, 2011. Created by AVINOR for the SESAR Joint Undertaking within the frame of the SESAR
Programme co-financed by the EU and EUROCONTROL. Reprint with approval of publisher and the source properly acknowledged.
Validation scenario SCN-07.05.03-VALP-E001.0001 studied which active military areas can be filed through. The following maps present the simulated military areas and the corresponding anchor points.
Figure 11: Military Anchor Points 1
Figure 12: Military Anchor Points 2
6.1.2.3.2 Trial Scenarios
The 5 scenarios were identified for validation in VP-571:
Scenario Scenario ID Scenario Title
B SCN-07.05.03-VALP-B001.0001 New DCTs during night, near-night and weekend.
C SCN-07.05.03-VALP-C001.0001 Existing DCTs which can be implemented H24/7. These DCTs do not penetrate Airspace Management Cell (AMC) Active Segregated Areas (ARES) manageable areas.
D SCN-07.05.03-VALP-D001.0001 New DCTs available H24/7 and clipping internal sector boundaries.
E SCN-07.05.03-VALP-E001.0001 Fly trajectories through AMC-manageable areas when active.
F SCN-07.05.03-VALP-F001.0001 DCTs linking to the Copenhagen Free route flows with entry/exit point of MUAC FRA.
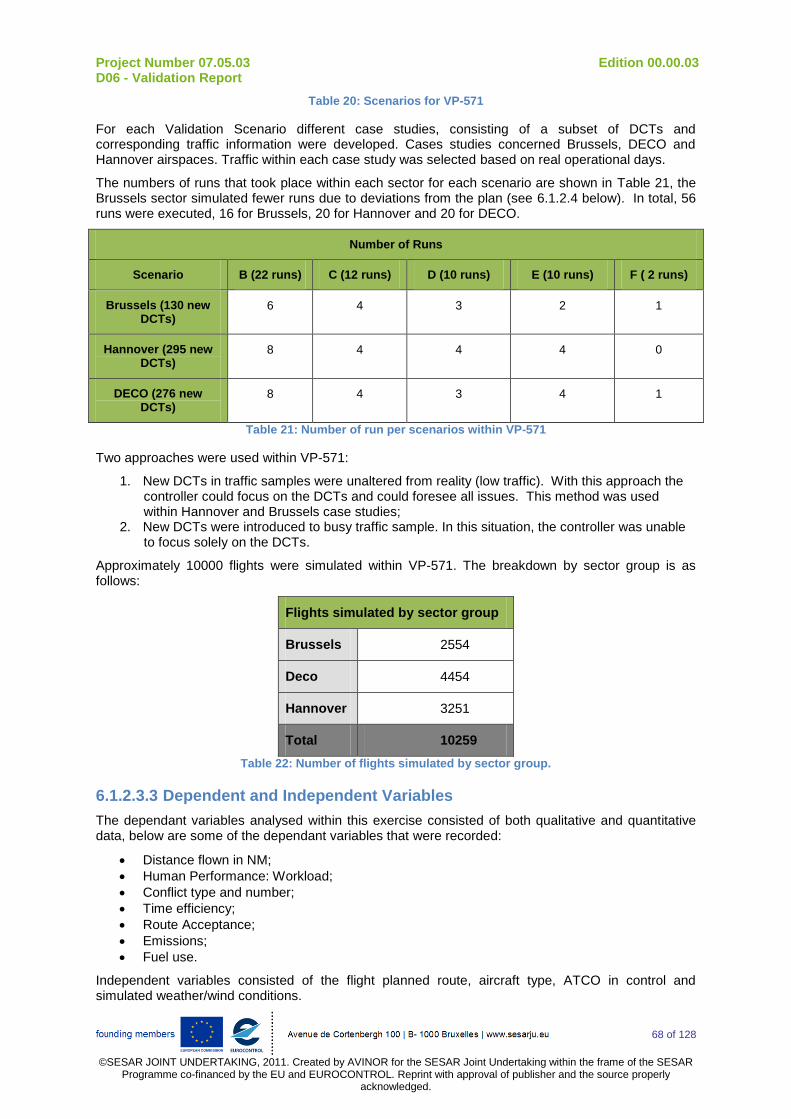
Project Number 07.05.03 Edition 00.00.03 D06 - Validation Report
68 of 128
©SESAR JOINT UNDERTAKING, 2011. Created by AVINOR for the SESAR Joint Undertaking within the frame of the SESAR
Programme co-financed by the EU and EUROCONTROL. Reprint with approval of publisher and the source properly acknowledged.
Table 20: Scenarios for VP-571
For each Validation Scenario different case studies, consisting of a subset of DCTs and corresponding traffic information were developed. Cases studies concerned Brussels, DECO and Hannover airspaces. Traffic within each case study was selected based on real operational days.
The numbers of runs that took place within each sector for each scenario are shown in Table 21, the Brussels sector simulated fewer runs due to deviations from the plan (see 6.1.2.4 below). In total, 56 runs were executed, 16 for Brussels, 20 for Hannover and 20 for DECO.
Number of Runs
Scenario B (22 runs) C (12 runs) D (10 runs) E (10 runs) F ( 2 runs)
Brussels (130 new DCTs)
6 4 3 2 1
Hannover (295 new DCTs)
8 4 4 4 0
DECO (276 new DCTs)
8 4 3 4 1
Table 21: Number of run per scenarios within VP-571
Two approaches were used within VP-571:
1. New DCTs in traffic samples were unaltered from reality (low traffic). With this approach the controller could focus on the DCTs and could foresee all issues. This method was used within Hannover and Brussels case studies;
2. New DCTs were introduced to busy traffic sample. In this situation, the controller was unable to focus solely on the DCTs.
Approximately 10000 flights were simulated within VP-571. The breakdown by sector group is as follows:
Flights simulated by sector group
Brussels 2554
Deco 4454
Hannover 3251
Total 10259
Table 22: Number of flights simulated by sector group.
6.1.2.3.3 Dependent and Independent Variables
The dependant variables analysed within this exercise consisted of both qualitative and quantitative data, below are some of the dependant variables that were recorded:
Distance flown in NM;
Human Performance: Workload;
Conflict type and number;
Time efficiency;
Route Acceptance;
Emissions;
Fuel use.
Independent variables consisted of the flight planned route, aircraft type, ATCO in control and simulated weather/wind conditions.

Project Number 07.05.03 Edition 00.00.03 D06 - Validation Report
69 of 128
©SESAR JOINT UNDERTAKING, 2011. Created by AVINOR for the SESAR Joint Undertaking within the frame of the SESAR
Programme co-financed by the EU and EUROCONTROL. Reprint with approval of publisher and the source properly acknowledged.
6.1.2.3.4 Time Planning
The timetable for the trial scenarios was as follows:
12-march 13-march 14-march 15-march 16-march
DECO
Slo
t 1
Scenario B1 Scenario B5 Scenario C1 Scenario D1 (ARNEM) Scenario E1.1
DELO + DELHI + DES
DELO + DELHI + DES
DELO + DELHI + DES DELO + DELHI + RHR + MNS
DELTA + JEV + HOL
Slo
t 2 Scenario B2 Scenario B6 Scenario C2 Scenario D2 (ARNEM) Scenario E1.2
DELTA + JEV + HOL
DELTA + JEV + HOL
DELTA + JEV + HOL DELO + DELHI + RHR + MNS
DELO + DELHI + DES
Slo
t 3
Scenario B3 Scenario B7 Scenario C3 Scenario D3 (ARNEM) Scenario E2.1
DELTA + JEV + HOL
DELTA + JEV + HOL
DELTA + JEV + HOL DELO + DELHI + RHR + MNS
DELTA + JEV + HOL
Slo
t 4
Scenario B4 Scenario B8 Scenario
C4 Scenario F1 (ARNEM) Scenario E2.2
ALL 5 SECTORS
ALL 5 SECTORS ALL 5 SECTORS DELO + DELHI + RHR + MNS
DELO + DELHI + DES
Hanover
Slo
t 1
Scenario B2 Scenario B Scenario C1 Scenario D1.1 (NOR) Scenario E8.1
CELO + SOLO + ESHI
RUHR/MUN + SOL + CEL
RUHR/MUN + SOL + CEL LUX + LNO + RHR + MNS
RUHR/MUN + SOL + CEL
Slo
t 2
Scenario B1 Scenario B6 Scenario C2 Scenario D2.1 (ARNE Scenario E8.2 (ACTIVE FPL THROUGH)
RHLO + MNLO + HHW
CELO + SOLO + ESHI
CELO + SOLO + ESHI LUX + LNO + RHR + MNS
RUHR/MUN + SOL + CEL 4?)
Slo
t 3
Scenario B4 Scenario B5 Scenario C3 Scenario D1.2 (NOR) Scenario E7.1 (ACTIVE FPL AROUND)
CELO + SOLO + ESHI
RHLO + MNLO + HHW
RHLO + MNLO + HHW LUX + LNO + RHR + MNS
RUHR/MUN + SOL + CEL
Slo
t 4
Scenario B3 Scenario B8 Scenario C4 Scenario D2.2 (ARNEM)
Scenario E7.2 (ACTIVE FPL THROUGH)
RHLO + MNLO + HHW
ALL 6 SECTORS ALL 6 SECTORS
LUX +LNO + RHR + MNS
RUHR/MUN + SOL + CEL
Brussels
Slo
t 1 Scenario B1 Cancelled Scenario C1 Scenario D1 Scenario B5
KOK + NIK + WH
LUX + LNO + EH KOK + NIK + WH + DELO + DELHI
LUX + LNO + EH
Slo
t 2
Scenario B2 Cancelled Scenario C2 Scenario D2 (ARNEM) Scenario B6
LUX + LNO + EH
KOK + NIK + WH LUX+ LNO + EH + DELO + DELHI
KOK + NIK + WH

Project Number 07.05.03 Edition 00.00.03 D06 - Validation Report
70 of 128
©SESAR JOINT UNDERTAKING, 2011. Created by AVINOR for the SESAR Joint Undertaking within the frame of the SESAR
Programme co-financed by the EU and EUROCONTROL. Reprint with approval of publisher and the source properly acknowledged.
Slo
t 3 Scenario B3 Cancelled Scenario C3 Scenario D3 (ARNEM) Scenario E1.1
KOK + NIK + WH LUX + LNO + EH LUX+ LNO + EH + DELO + DELHI
LUX + LNO + EH
Slo
t 4 Scenario B4 Cancelled Scenario C4
Scenario F1 (WDY TOLEN)
Scenario E1.2
LUX + LNO + EH KOK + NIK + WH KOK + NIK + WH + DELO + DELHI
LUX + LNO + EH
Table 23 - Simulation Timetable
6.1.2.3.5 Data Collection Methods
Data collection consisted of qualitative and quantitative data. The analysis within this report produced various metrics to aid analysis.
The following methods were used to collect the required data:
Simulation Logs;
ATCO Tactical Actions;
Conflict Detection;
Sector Exit and Entry Events;
ATCO Questionnaires.
6.1.2.3.6 Additional Analysis Comparisons
N/A
6.1.2.4 Deviation from the Planned Activities
The preparation, execution and analysis of the VP-571 exercise progressed in line with the Validation Plan with some deviations.
The planned simulation runs for the Brussels sector group needed to be modified due to the unavailability of the simulation room on one day (27
th march 2012). This led to the cancellation of four
runs set to study different set of DCTs for night and weekend operations (i.e. studied scenario SCN-07.05.03-VALP-B001.0001).
To manage the unexpected unavailability of the simulation rooms, two runs were kept and simulated on 30
th of March (runs B5 and B6) in replacement of runs involving military activity (i.e. runs E2.1 and
E2.2). Table 24 shows the simulation timetable, with the aforementioned changes highlighted in blue.
Runs for the other sectors remained unchanged, yet this resulted in the Brussels sector contributing sixteen runs and the other sectors contributing twenty runs.
26 March 27 March 28 March 29 March 30 March
Slo
t 1 Scenario B1
Cancelled
Scenario C1 Scenario D1 Scenario B5
KOK + NIK + WH LUX + LNO + EH KOK + NIK + WH + DELO + DELHI
LUX + LNO + EH
Slo
t 2
Scenario B2
Cancelled
Scenario C2 Scenario D2 (ARNEM)
Scenario B6
LUX + LNO + EH KOK + NIK + WH LUX+ LNO + EH + DELO + DELHI
KOK + NIK + WH
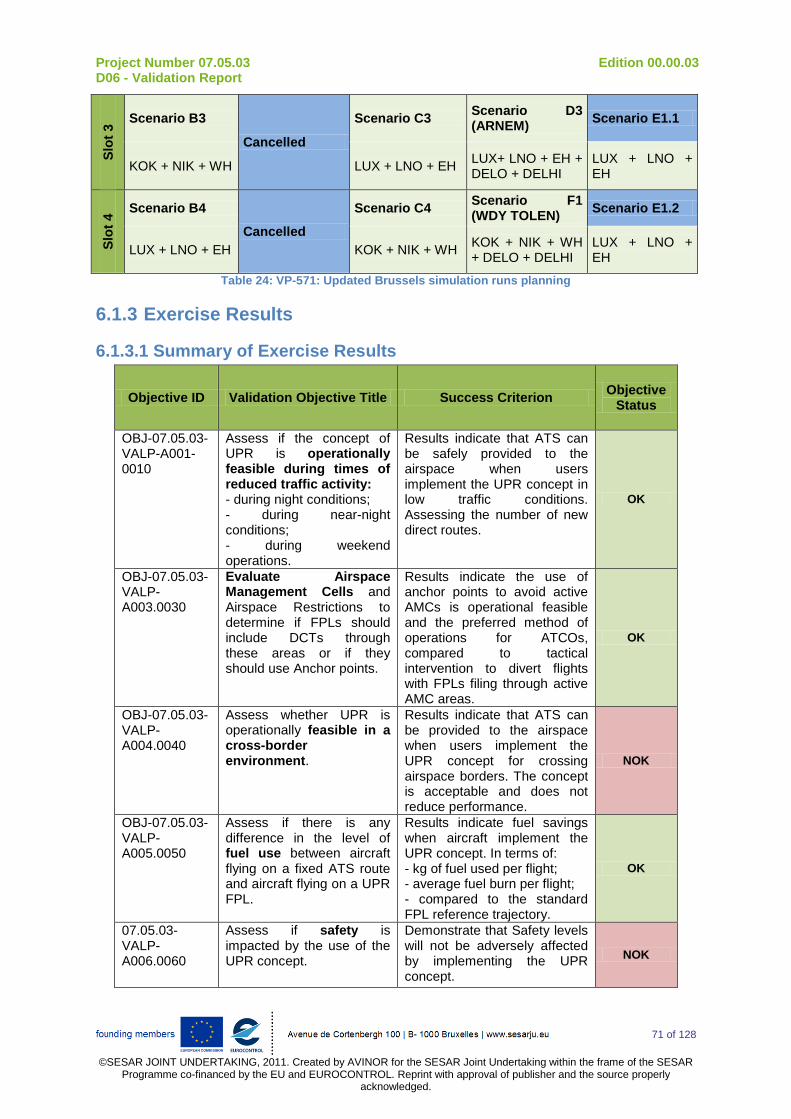
Project Number 07.05.03 Edition 00.00.03 D06 - Validation Report
71 of 128
©SESAR JOINT UNDERTAKING, 2011. Created by AVINOR for the SESAR Joint Undertaking within the frame of the SESAR
Programme co-financed by the EU and EUROCONTROL. Reprint with approval of publisher and the source properly acknowledged.
Slo
t 3
Scenario B3
Cancelled
Scenario C3 Scenario D3 (ARNEM)
Scenario E1.1
KOK + NIK + WH LUX + LNO + EH LUX+ LNO + EH + DELO + DELHI
LUX + LNO + EH
Slo
t 4
Scenario B4
Cancelled
Scenario C4 Scenario F1 (WDY TOLEN)
Scenario E1.2
LUX + LNO + EH KOK + NIK + WH KOK + NIK + WH + DELO + DELHI
LUX + LNO + EH
Table 24: VP-571: Updated Brussels simulation runs planning
6.1.3 Exercise Results
6.1.3.1 Summary of Exercise Results
Objective ID Validation Objective Title Success Criterion Objective
Status
OBJ-07.05.03-VALP-A001-0010
Assess if the concept of UPR is operationally feasible during times of reduced traffic activity: - during night conditions; - during near-night conditions; - during weekend operations.
Results indicate that ATS can be safely provided to the airspace when users implement the UPR concept in low traffic conditions. Assessing the number of new direct routes.
OK
OBJ-07.05.03-VALP-A003.0030
Evaluate Airspace Management Cells and Airspace Restrictions to determine if FPLs should include DCTs through these areas or if they should use Anchor points.
Results indicate the use of anchor points to avoid active AMCs is operational feasible and the preferred method of operations for ATCOs, compared to tactical intervention to divert flights with FPLs filing through active AMC areas.
OK
OBJ-07.05.03-VALP-A004.0040
Assess whether UPR is operationally feasible in a cross-border environment.
Results indicate that ATS can be provided to the airspace when users implement the UPR concept for crossing airspace borders. The concept is acceptable and does not reduce performance.
NOK
OBJ-07.05.03-VALP-A005.0050
Assess if there is any difference in the level of fuel use between aircraft flying on a fixed ATS route and aircraft flying on a UPR FPL.
Results indicate fuel savings when aircraft implement the UPR concept. In terms of: - kg of fuel used per flight; - average fuel burn per flight; - compared to the standard FPL reference trajectory.
OK
07.05.03-VALP-A006.0060
Assess if safety is impacted by the use of the UPR concept.
Demonstrate that Safety levels will not be adversely affected by implementing the UPR concept.
NOK
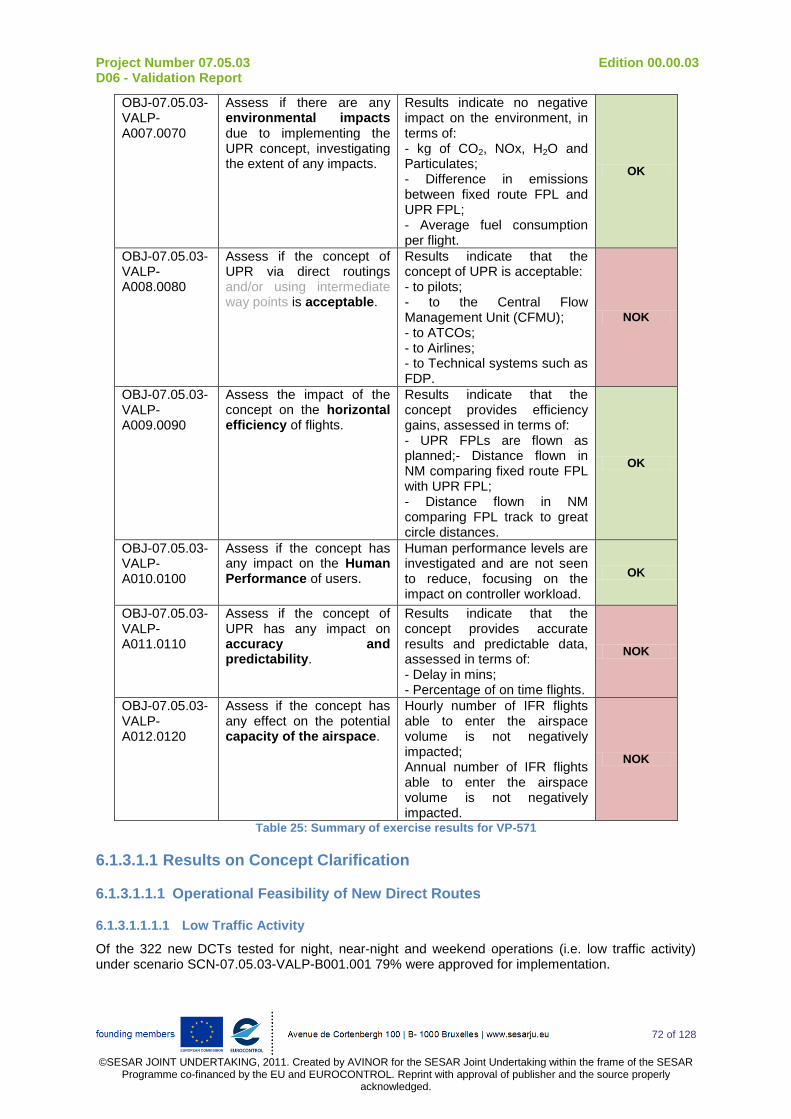
Project Number 07.05.03 Edition 00.00.03 D06 - Validation Report
72 of 128
©SESAR JOINT UNDERTAKING, 2011. Created by AVINOR for the SESAR Joint Undertaking within the frame of the SESAR
Programme co-financed by the EU and EUROCONTROL. Reprint with approval of publisher and the source properly acknowledged.
OBJ-07.05.03-VALP-A007.0070
Assess if there are any environmental impacts due to implementing the UPR concept, investigating the extent of any impacts.
Results indicate no negative impact on the environment, in terms of: - kg of CO2, NOx, H2O and Particulates; - Difference in emissions between fixed route FPL and UPR FPL; - Average fuel consumption per flight.
OK
OBJ-07.05.03-VALP-A008.0080
Assess if the concept of UPR via direct routings and/or using intermediate way points is acceptable.
Results indicate that the concept of UPR is acceptable: - to pilots; - to the Central Flow Management Unit (CFMU); - to ATCOs; - to Airlines; - to Technical systems such as FDP.
NOK
OBJ-07.05.03-VALP-A009.0090
Assess the impact of the concept on the horizontal efficiency of flights.
Results indicate that the concept provides efficiency gains, assessed in terms of: - UPR FPLs are flown as planned;- Distance flown in NM comparing fixed route FPL with UPR FPL; - Distance flown in NM comparing FPL track to great circle distances.
OK
OBJ-07.05.03-VALP-A010.0100
Assess if the concept has any impact on the Human Performance of users.
Human performance levels are investigated and are not seen to reduce, focusing on the impact on controller workload.
OK
OBJ-07.05.03-VALP-A011.0110
Assess if the concept of UPR has any impact on accuracy and predictability.
Results indicate that the concept provides accurate results and predictable data, assessed in terms of: - Delay in mins; - Percentage of on time flights.
NOK
OBJ-07.05.03-VALP-A012.0120
Assess if the concept has any effect on the potential capacity of the airspace.
Hourly number of IFR flights able to enter the airspace volume is not negatively impacted; Annual number of IFR flights able to enter the airspace volume is not negatively impacted.
NOK
Table 25: Summary of exercise results for VP-571
6.1.3.1.1 Results on Concept Clarification
6.1.3.1.1.1 Operational Feasibility of New Direct Routes
6.1.3.1.1.1.1 Low Traffic Activity
Of the 322 new DCTs tested for night, near-night and weekend operations (i.e. low traffic activity) under scenario SCN-07.05.03-VALP-B001.001 79% were approved for implementation.

Project Number 07.05.03 Edition 00.00.03 D06 - Validation Report
73 of 128
©SESAR JOINT UNDERTAKING, 2011. Created by AVINOR for the SESAR Joint Undertaking within the frame of the SESAR
Programme co-financed by the EU and EUROCONTROL. Reprint with approval of publisher and the source properly acknowledged.
Among the tested routes, 25 were considered not to be put into operation due to a negative impact on capacity and/or safety. A breakdown of the how many new DCTs were introduced per category is illustrated in the table below.
New DCTs
Weekends Near-night Night Cannot be
implemented
216 6 30 25
Table 26: Different Route Categories
However, the simulated low traffic activity runs within scenario SCN-07.05.03-VALP-B001.0001 raised some issues:
With an increased number of DCTs within a portion of airspace, the possibility for confusion regarding separation responsibility of a given flow increased as well;
In some parts of airspace, especially in Brussels sectors, the changes in traffic patterns (i.e. turning angle of trajectories) at the point of entry or in the middle of the sector created unnecessary additional workload for the controllers;
Some DCTs (like KOK-NOR) generated direct opposite flows and were rejected;
Some areas around significant points (ADUTO) were identified. Turns around ADUTO should be avoided; this was applicable to left as well as right turns. The left turns reduced the time for resolving conflicts from eastbound flows. The right affected the opposite south flow;
Other points, like NOR, may become conflict points;
Some new DCTs tested were rejected (i.e. SUTEB-MEDIL) due to the complexity of the conflicts generated and the significant increase in workload.
The following picture illustrates some issue areas identified during the exercise:
Figure 13: Night, near-night and weekend DCTs (Scenario SCN-07.05.03-VALP-B001.0001) issue areas
6.1.3.1.1.1.2 H24/7 Availability
Scenario SCN-07.05.03-VALP-C001.0001 explored the operational feasibility for existing and new DCTs to be open H24/7. With the condition these routes did not penetrate AMC-manageable area airspace.
Among the validated routes, 98 DCTs were identified for H24 activation (45 new and 53 already existing).
The picture below illustrates the DCTs identified for H24 activation within the MUAC area of responsibility.
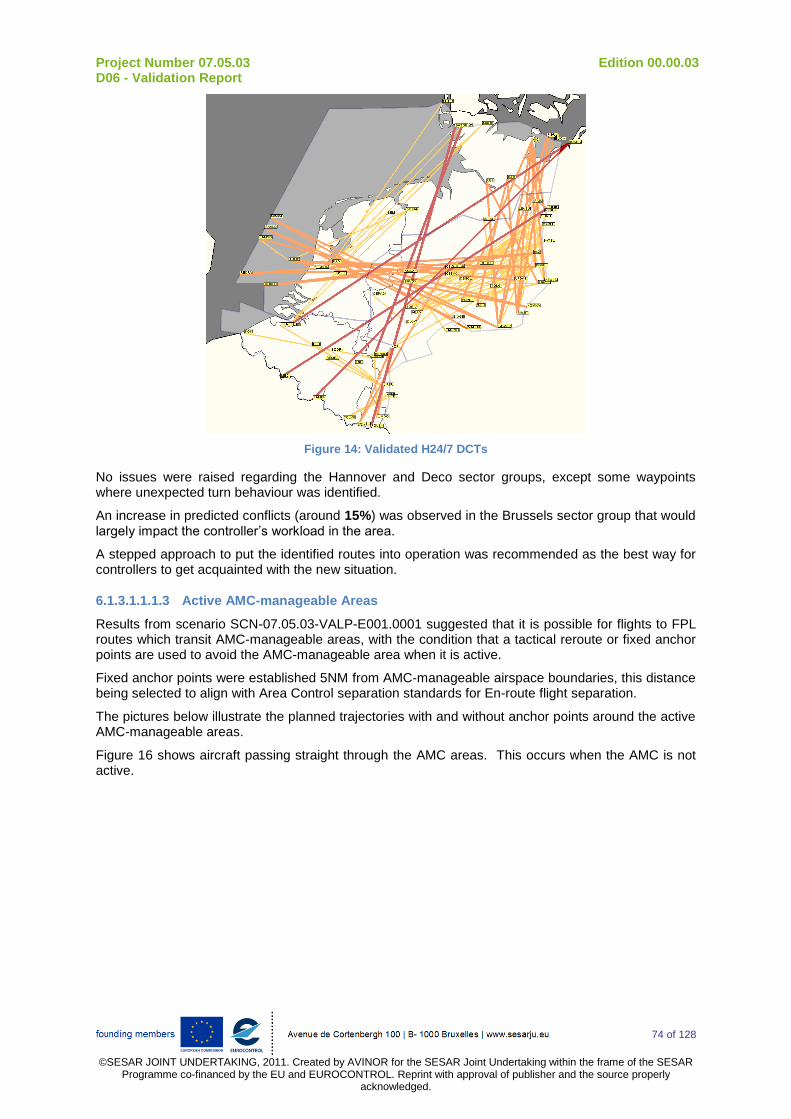
Project Number 07.05.03 Edition 00.00.03 D06 - Validation Report
74 of 128
©SESAR JOINT UNDERTAKING, 2011. Created by AVINOR for the SESAR Joint Undertaking within the frame of the SESAR
Programme co-financed by the EU and EUROCONTROL. Reprint with approval of publisher and the source properly acknowledged.
Figure 14: Validated H24/7 DCTs
No issues were raised regarding the Hannover and Deco sector groups, except some waypoints where unexpected turn behaviour was identified.
An increase in predicted conflicts (around 15%) was observed in the Brussels sector group that would largely impact the controller’s workload in the area.
A stepped approach to put the identified routes into operation was recommended as the best way for controllers to get acquainted with the new situation.
6.1.3.1.1.1.3 Active AMC-manageable Areas
Results from scenario SCN-07.05.03-VALP-E001.0001 suggested that it is possible for flights to FPL routes which transit AMC-manageable areas, with the condition that a tactical reroute or fixed anchor points are used to avoid the AMC-manageable area when it is active.
Fixed anchor points were established 5NM from AMC-manageable airspace boundaries, this distance being selected to align with Area Control separation standards for En-route flight separation.
The pictures below illustrate the planned trajectories with and without anchor points around the active AMC-manageable areas.
Figure 16 shows aircraft passing straight through the AMC areas. This occurs when the AMC is not active.
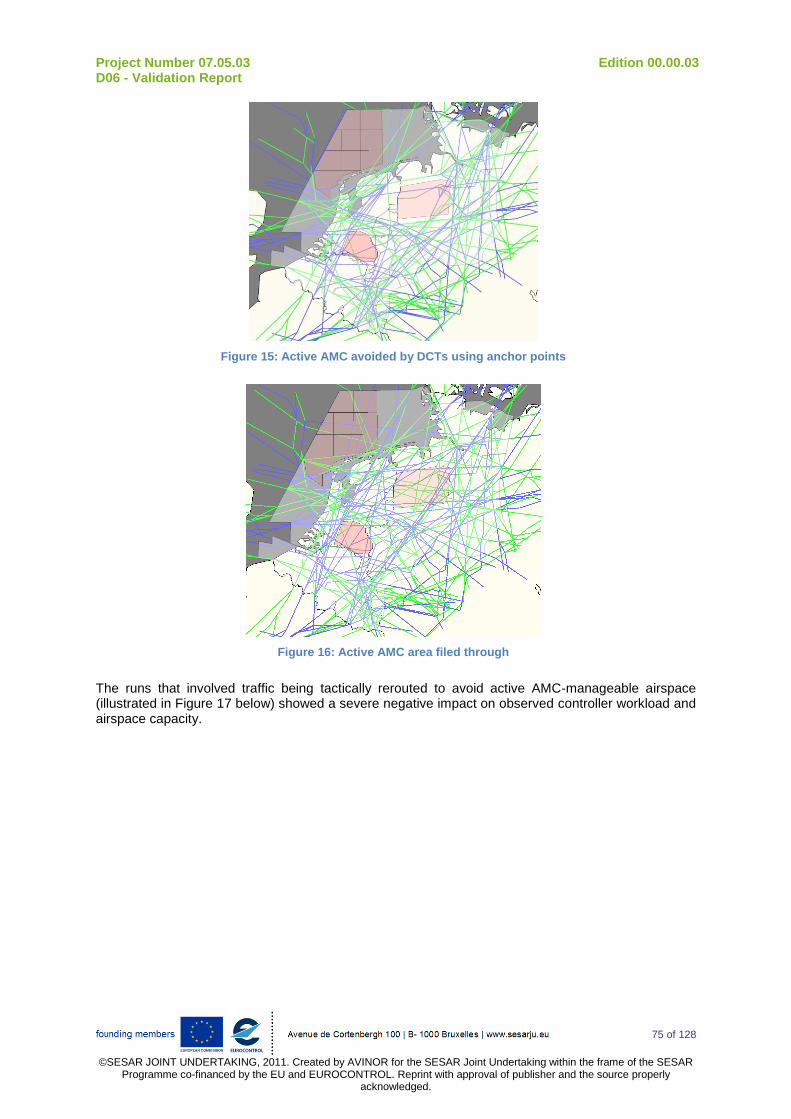
Project Number 07.05.03 Edition 00.00.03 D06 - Validation Report
75 of 128
©SESAR JOINT UNDERTAKING, 2011. Created by AVINOR for the SESAR Joint Undertaking within the frame of the SESAR
Programme co-financed by the EU and EUROCONTROL. Reprint with approval of publisher and the source properly acknowledged.
Figure 15: Active AMC avoided by DCTs using anchor points
Figure 16: Active AMC area filed through
The runs that involved traffic being tactically rerouted to avoid active AMC-manageable airspace (illustrated in Figure 17 below) showed a severe negative impact on observed controller workload and airspace capacity.
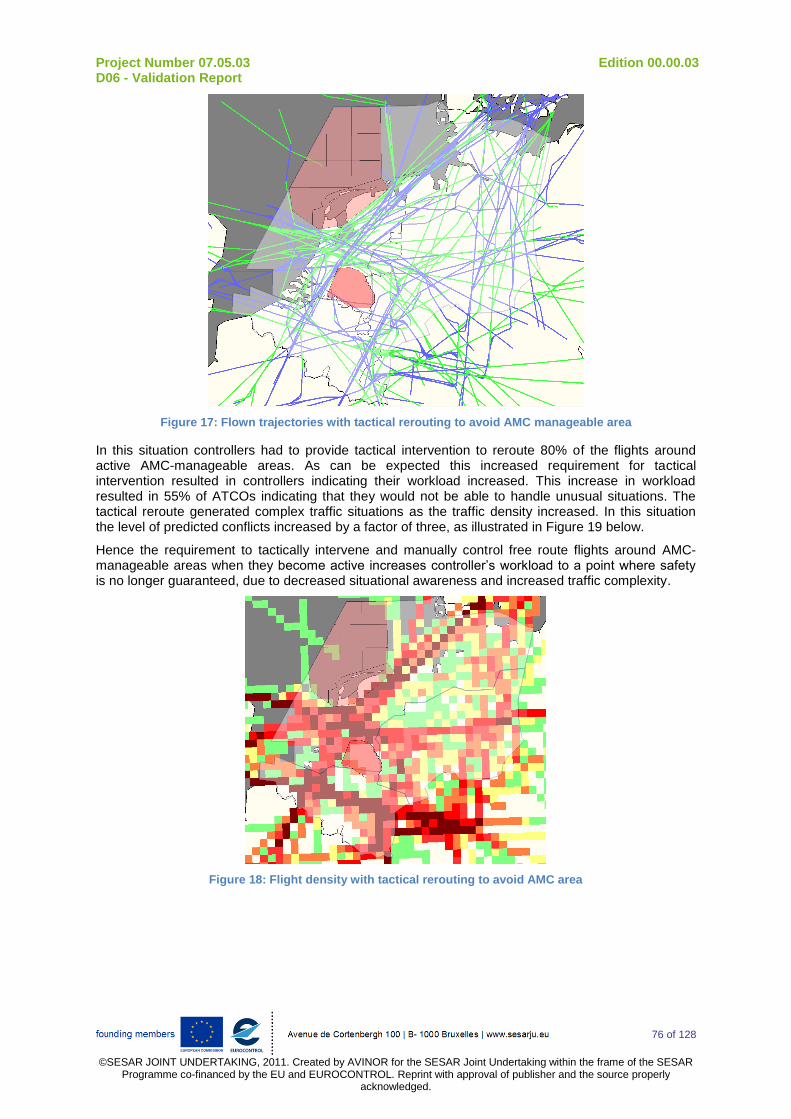
Project Number 07.05.03 Edition 00.00.03 D06 - Validation Report
76 of 128
©SESAR JOINT UNDERTAKING, 2011. Created by AVINOR for the SESAR Joint Undertaking within the frame of the SESAR
Programme co-financed by the EU and EUROCONTROL. Reprint with approval of publisher and the source properly acknowledged.
Figure 17: Flown trajectories with tactical rerouting to avoid AMC manageable area
In this situation controllers had to provide tactical intervention to reroute 80% of the flights around active AMC-manageable areas. As can be expected this increased requirement for tactical intervention resulted in controllers indicating their workload increased. This increase in workload resulted in 55% of ATCOs indicating that they would not be able to handle unusual situations. The tactical reroute generated complex traffic situations as the traffic density increased. In this situation the level of predicted conflicts increased by a factor of three, as illustrated in Figure 19 below.
Hence the requirement to tactically intervene and manually control free route flights around AMC-manageable areas when they become active increases controller’s workload to a point where safety is no longer guaranteed, due to decreased situational awareness and increased traffic complexity.
Figure 18: Flight density with tactical rerouting to avoid AMC area
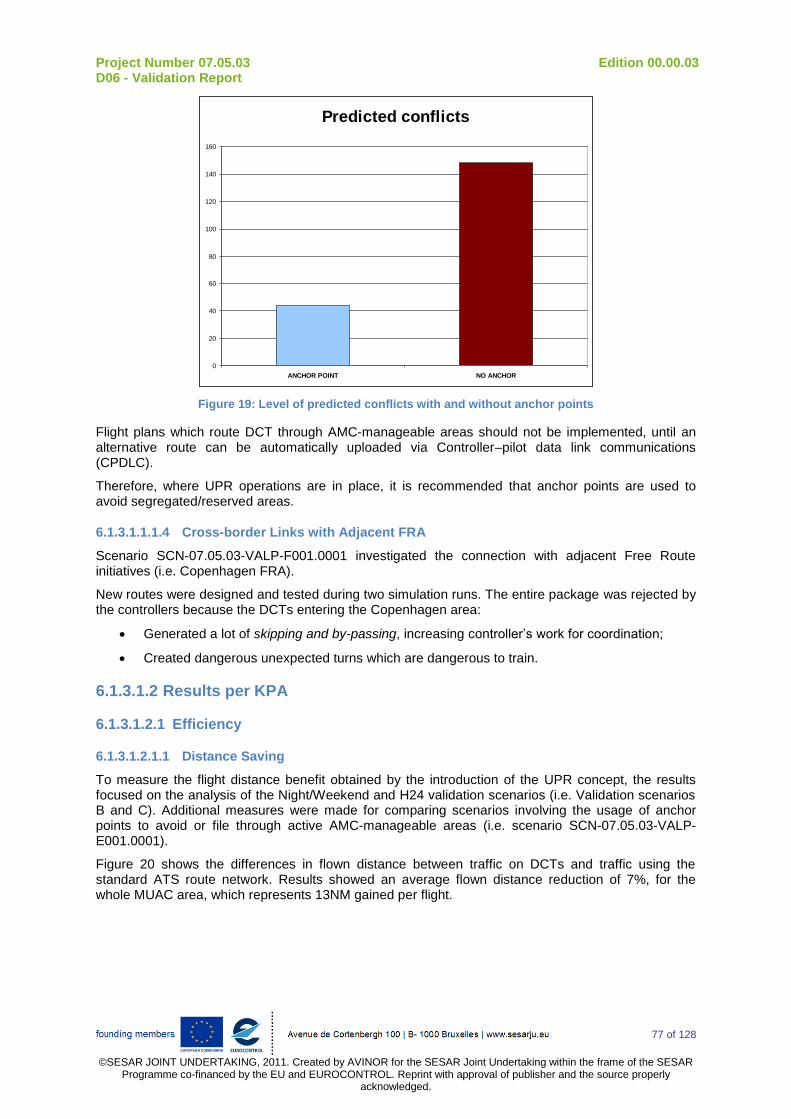
Project Number 07.05.03 Edition 00.00.03 D06 - Validation Report
77 of 128
©SESAR JOINT UNDERTAKING, 2011. Created by AVINOR for the SESAR Joint Undertaking within the frame of the SESAR
Programme co-financed by the EU and EUROCONTROL. Reprint with approval of publisher and the source properly acknowledged.
Predicted conflicts
0
20
40
60
80
100
120
140
160
ANCHOR POINT NO ANCHOR
Figure 19: Level of predicted conflicts with and without anchor points
Flight plans which route DCT through AMC-manageable areas should not be implemented, until an alternative route can be automatically uploaded via Controller–pilot data link communications (CPDLC).
Therefore, where UPR operations are in place, it is recommended that anchor points are used to avoid segregated/reserved areas.
6.1.3.1.1.1.4 Cross-border Links with Adjacent FRA
Scenario SCN-07.05.03-VALP-F001.0001 investigated the connection with adjacent Free Route initiatives (i.e. Copenhagen FRA).
New routes were designed and tested during two simulation runs. The entire package was rejected by the controllers because the DCTs entering the Copenhagen area:
Generated a lot of skipping and by-passing, increasing controller’s work for coordination;
Created dangerous unexpected turns which are dangerous to train.
6.1.3.1.2 Results per KPA
6.1.3.1.2.1 Efficiency
6.1.3.1.2.1.1 Distance Saving
To measure the flight distance benefit obtained by the introduction of the UPR concept, the results focused on the analysis of the Night/Weekend and H24 validation scenarios (i.e. Validation scenarios B and C). Additional measures were made for comparing scenarios involving the usage of anchor points to avoid or file through active AMC-manageable areas (i.e. scenario SCN-07.05.03-VALP-E001.0001).
Figure 20 shows the differences in flown distance between traffic on DCTs and traffic using the standard ATS route network. Results showed an average flown distance reduction of 7%, for the whole MUAC area, which represents 13NM gained per flight.
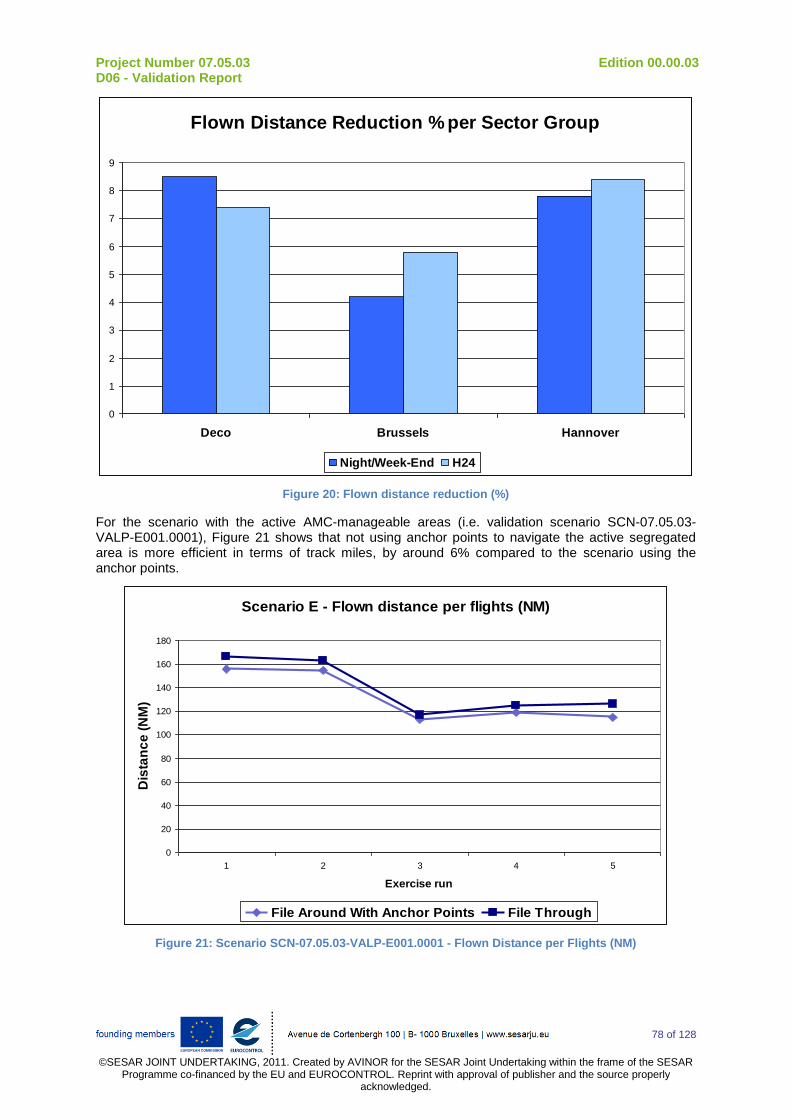
Project Number 07.05.03 Edition 00.00.03 D06 - Validation Report
78 of 128
©SESAR JOINT UNDERTAKING, 2011. Created by AVINOR for the SESAR Joint Undertaking within the frame of the SESAR
Programme co-financed by the EU and EUROCONTROL. Reprint with approval of publisher and the source properly acknowledged.
Flown Distance Reduction % per Sector Group
0
1
2
3
4
5
6
7
8
9
Deco Brussels Hannover
Night/Week-End H24
Figure 20: Flown distance reduction (%)
For the scenario with the active AMC-manageable areas (i.e. validation scenario SCN-07.05.03-VALP-E001.0001), Figure 21 shows that not using anchor points to navigate the active segregated area is more efficient in terms of track miles, by around 6% compared to the scenario using the anchor points.
Scenario E - Flown distance per flights (NM)
0
20
40
60
80
100
120
140
160
180
1 2 3 4 5
Exercise run
Dis
tan
ce
(N
M)
File Around With Anchor Points File Through
Figure 21: Scenario SCN-07.05.03-VALP-E001.0001 - Flown Distance per Flights (NM)
Project Number 07.05.03 Edition 00.00.03 D06 - Validation Report
79 of 128
©SESAR JOINT UNDERTAKING, 2011. Created by AVINOR for the SESAR Joint Undertaking within the frame of the SESAR
Programme co-financed by the EU and EUROCONTROL. Reprint with approval of publisher and the source properly acknowledged.
Difference in flown distance per flight with/without
anchor points
0
2
4
6
8
10
12
1 2 3 4 5
Exercise run
Dis
tan
ce
(N
M)
Additional flown distance
Figure 22: Difference in Distance Flown per Flight with/without anchor points
Filing FPLs which route DCT through AMC-manageable areas reduces track mileage and thus will have a positive impact on flight efficiency and overall fuel burn. Despite this observed benefit in track mile reduction, filing FPLs in this way increased the complexity of the traffic and ultimately reduced safety below acceptable levels (detailed in 6.1.3.1.1.1.3 above). Thus any efficiency gains are not operationally feasible, as when the restricted areas are activated a safe ATS cannot be provided. To avoid this is had been suggested that FPLs do not include AMC-manageable areas; despite the reduction in track miles this option offers AUs.
6.1.3.1.2.1.2 Time Saving
In conjunction with the flight distance efficiency, a reduction in flight time (i.e. inside MUAC area of responsibility) of 5% was observed. This represents a reduction of 2 minutes per flight.
6.1.3.1.2.2 Capacity
In order to assess the impact on the capacity KPA, the evolution of the predicted conflicts and their types (i.e. parallel, opposite or crossing) for all the simulation runs were analysed.
6.1.3.1.2.2.1 General
From the capacity perspective, the observation of the evolution of the predicted conflicts and the impact on controller’s workload, the simulated scenarios have shown a decrease for two sector groups (i.e. Brussels and Hannover) and an increase for the last one (i.e. Deco). At the level of the whole MUAC area of responsibility, the impact is not significant.
We learnt from the debriefing sessions and controller’s feedback that the level of workload remained acceptable despite the observed increase in complexity except for the simulations concerning the military activity (i.e. scenario SCN-07.05.03-VALP-E001.0001, determine which AMC can be filled through when active).
A capacity analysis was performed for each sector group, analysing results from low traffic and H24/7 operational scenarios. Results were also analysed to look into any differences between using DCTs and using the normal route structure (for both low traffic and H24/7 scenarios). The results per sector group are below.

Project Number 07.05.03 Edition 00.00.03 D06 - Validation Report
80 of 128
©SESAR JOINT UNDERTAKING, 2011. Created by AVINOR for the SESAR Joint Undertaking within the frame of the SESAR
Programme co-financed by the EU and EUROCONTROL. Reprint with approval of publisher and the source properly acknowledged.
6.1.3.1.2.2.2 Brussels
Scenario B – Night/weekend
Brussels (B) - Potential Conflicts per simulation runs
0
10
20
30
40
50
60
1 2 3 4 5 6
Exercise runs
Co
nfl
icts
User Preferred Routing Standard Routing
Standard Routing conflicts type breakdown
UPR conflicts type breakdown
Parallel Opposite Crossing
Parallel Opposite Crossing
Figure 23: Brussels Scenario SCN-07.05.03-VALP-B001.0001 - Standard Routing Vs. UPR for Night/Weekend
Using DCTs under the UPR concept reduced the overall number of potential conflicts within a low traffic scenario, as shown in Figure 23. A decrease in number of potential conflicts when using the concept was also observed in the case of the simulated H24/7 DCTs, as illustrated in Figure 24.
Project Number 07.05.03 Edition 00.00.03 D06 - Validation Report
81 of 128
©SESAR JOINT UNDERTAKING, 2011. Created by AVINOR for the SESAR Joint Undertaking within the frame of the SESAR
Programme co-financed by the EU and EUROCONTROL. Reprint with approval of publisher and the source properly acknowledged.
Scenario C – H24/7
Brussels (C) - Potential Conflicts per simulation runs
0
10
20
30
40
50
60
70
80
1 2 3 4
Exercise runs
Co
nfl
icts
User Preferred Routing Standard Routing
Standard Routing conflicts type breakdown
UPR conflicts type breakdown
Parallel Opposite Crossing
Parallel Opposite Crossing
Figure 24: Brussels Scenario SCN-07.05.03-VALP-C001.0001 Standard Routing Vs. UPR for H24/7
The H24/7 results take into account the same periods of time that the night/weekend scenarios investigate and so the results are not independent. However the results do highlight that increasing the operational hours of this concept within the Brussels sector would not cause an increased level of potential conflicts to occur within this sector.
Conflict levels stay constant whether operating during low traffic activity or H24/7. However, the introduction of H24/7 UPR operations was followed by an increase in opposite and parallel conflicts. This reflects an increase in the severity of conflict type, resulting in decreased safety. Decreased safety may lead to the requirement for a reduced airspace capacity to try to reduce risk.
Project Number 07.05.03 Edition 00.00.03 D06 - Validation Report
82 of 128
©SESAR JOINT UNDERTAKING, 2011. Created by AVINOR for the SESAR Joint Undertaking within the frame of the SESAR
Programme co-financed by the EU and EUROCONTROL. Reprint with approval of publisher and the source properly acknowledged.
6.1.3.1.2.2.3 Hannover
Scenario B – Night/weekend
Hannover (B) - Potential Conflicts per simulation runs
0
10
20
30
40
50
60
70
80
1 2 3 4 5 6 7 8
Exercise runs
Co
nfl
icts
User Preferred Routing Standard Routing
Standard Routing conflicts type breakdown
UPR conflicts type breakdown
Parallel Opposite Crossing
Parallel Opposite Crossing
Figure 25: Hannover Scenario SCN-07.05.03-VALP-B001.0001 - Standard Routing vs. UPR for Night/weekend

Project Number 07.05.03 Edition 00.00.03 D06 - Validation Report
83 of 128
©SESAR JOINT UNDERTAKING, 2011. Created by AVINOR for the SESAR Joint Undertaking within the frame of the SESAR
Programme co-financed by the EU and EUROCONTROL. Reprint with approval of publisher and the source properly acknowledged.
Scenario C – H24/7
Hannover (C) - Potential Conflicts per simulation runs
0
10
20
30
40
50
60
70
80
1 2 3 4
Exercise runs
Co
nfl
icts
User Preferred Routing Standard Routing
Standard Routing conflicts type breakdown
UPR conflicts type breakdown
Parallel Opposite Crossing
Parallel Opposite Crossing
Figure 26: Hannover Scenario SCN-07.05.03-VALP-C001.0001 - Standard Routing Vs. UPR for H24/7
With regards to the Hannover area, the introduction of the UPR concept changed the traffic pattern for both low traffic density (scenario SCN-07.05.03-VALP-B001.0001) and H24/7 (scenario SCN-07.05.03-VALP-C001.0001). Within the low traffic scenario (scenario SCN-07.05.03-VALP-B001.0001) the number of potential conflicts reduces when UPR flights are introduced. In a H24/7 scenario the introduction of UPR had a negligible impact on the number of potential conflicts.
The nature of the remaining conflict points was more demanding for the controller when using the UPR concept, with an increase in crossing conflict for both night/weekend and H24/7 runs.
Project Number 07.05.03 Edition 00.00.03 D06 - Validation Report
84 of 128
©SESAR JOINT UNDERTAKING, 2011. Created by AVINOR for the SESAR Joint Undertaking within the frame of the SESAR
Programme co-financed by the EU and EUROCONTROL. Reprint with approval of publisher and the source properly acknowledged.
The overall impact on the Hannover sector is that the airspace capacity is likely to either stay the same or reduce if UPR is introduced. There are small decreases in the overall numbers of potential conflicts, yet the severity of the types of conflict mean this does not translate to increases in capacity potential.
6.1.3.1.2.2.4 Deco
The Deco Area was negatively impacted by the introduction of UPR. As illustrated in Figure 27 an increase in number of potential conflicts was observed. The measured increase was approximately 24% for low traffic density (scenario SCN-07.05.03-VALP-B001.0001).
Scenario B – Night/weekend
Deco (B) - Potential Conflicts per simulation runs
0
10
20
30
40
50
60
70
80
1 2 3 4 5 6 7 8
Exercise runs
Co
nfl
icts
User Preferred Routing Standard Routing
Standard Routing conflicts type breakdown
UPR conflicts type breakdown
Parallel Opposite Crossing
Parallel Opposite Crossing
Figure 27: Deco Scenario SCN-07.05.03-VALP-B001.0001 - Standard Routing Vs. UPR for Night/Weekends

Project Number 07.05.03 Edition 00.00.03 D06 - Validation Report
85 of 128
©SESAR JOINT UNDERTAKING, 2011. Created by AVINOR for the SESAR Joint Undertaking within the frame of the SESAR
Programme co-financed by the EU and EUROCONTROL. Reprint with approval of publisher and the source properly acknowledged.
The increase in the number of potential conflicts had a negative impact on Deco sectors group capacity. In addition, the breakdown in potential conflict’s category changed as well. Importantly an increase in the numbers of crossing conflicts was seen when UPR was used, as illustrated in Figure 27. This increase translates to higher severity of conflicts, which in turn can negatively impact upon controller workload and stress. This intensifies the finding that the introduction of UPR would have a negative impact on sector capacity within DECO.
The same observations were made for the H24/7 scenario in Deco area as shown in Figure 28.
Scenario C – H24/7
Deco (C) - Potential Conflicts per simulation runs
0
10
20
30
40
50
60
70
80
1 2 3 4
Exercise runs
Co
nfl
icts
User Preferred Routing Standard Routing
Standard Routing conflicts type breakdown
UPR conflicts type breakdown
Parallel Opposite Crossing
Parallel Opposite Crossing
Figure 28: Deco Scenario SCN-07.05.03-VALP-C001.0001 - Standard Routing Vs. UPR for H24/7
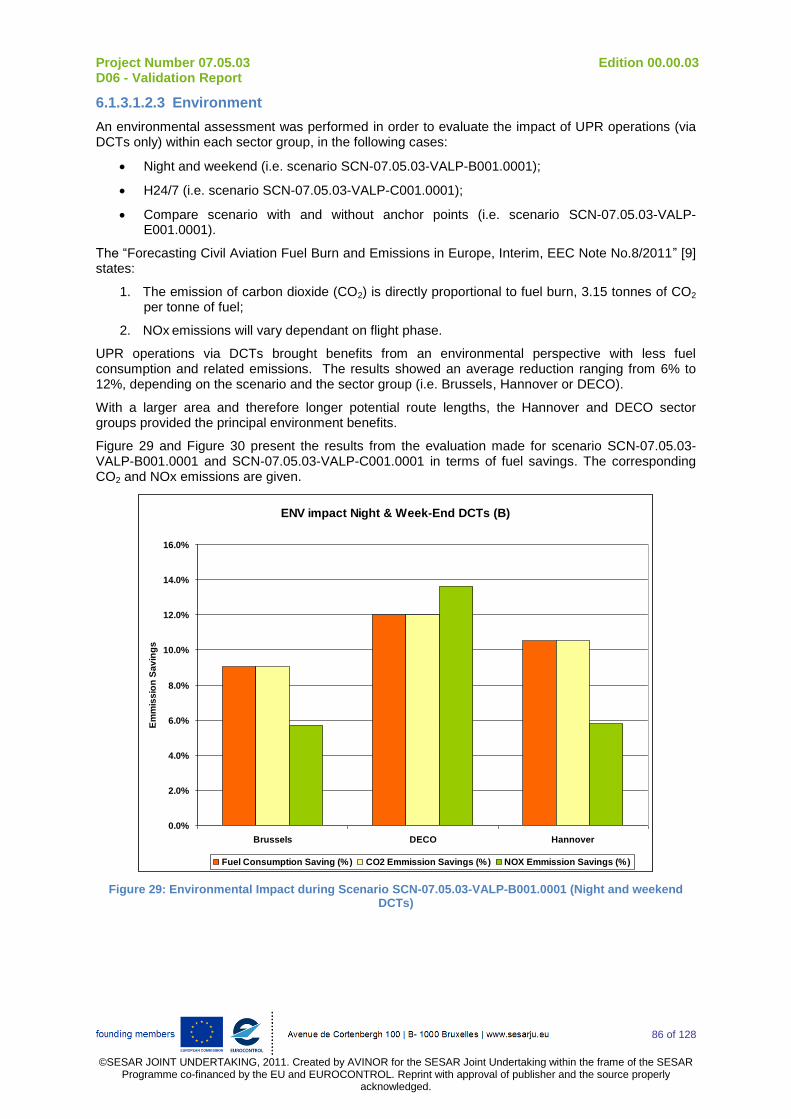
Project Number 07.05.03 Edition 00.00.03 D06 - Validation Report
86 of 128
©SESAR JOINT UNDERTAKING, 2011. Created by AVINOR for the SESAR Joint Undertaking within the frame of the SESAR
Programme co-financed by the EU and EUROCONTROL. Reprint with approval of publisher and the source properly acknowledged.
6.1.3.1.2.3 Environment
An environmental assessment was performed in order to evaluate the impact of UPR operations (via DCTs only) within each sector group, in the following cases:
Night and weekend (i.e. scenario SCN-07.05.03-VALP-B001.0001);
H24/7 (i.e. scenario SCN-07.05.03-VALP-C001.0001);
Compare scenario with and without anchor points (i.e. scenario SCN-07.05.03-VALP-E001.0001).
The “Forecasting Civil Aviation Fuel Burn and Emissions in Europe, Interim, EEC Note No.8/2011” [9] states:
1. The emission of carbon dioxide (CO2) is directly proportional to fuel burn, 3.15 tonnes of CO2
per tonne of fuel;
2. NOx emissions will vary dependant on flight phase.
UPR operations via DCTs brought benefits from an environmental perspective with less fuel consumption and related emissions. The results showed an average reduction ranging from 6% to 12%, depending on the scenario and the sector group (i.e. Brussels, Hannover or DECO).
With a larger area and therefore longer potential route lengths, the Hannover and DECO sector groups provided the principal environment benefits.
Figure 29 and Figure 30 present the results from the evaluation made for scenario SCN-07.05.03-VALP-B001.0001 and SCN-07.05.03-VALP-C001.0001 in terms of fuel savings. The corresponding CO2 and NOx emissions are given.
ENV impact Night & Week-End DCTs (B)
0.0%
2.0%
4.0%
6.0%
8.0%
10.0%
12.0%
14.0%
16.0%
Brussels DECO Hannover
Em
mis
sio
n S
av
ing
s
Fuel Consumption Saving (%) CO2 Emmission Savings (%) NOX Emmission Savings (%)
Figure 29: Environmental Impact during Scenario SCN-07.05.03-VALP-B001.0001 (Night and weekend DCTs)
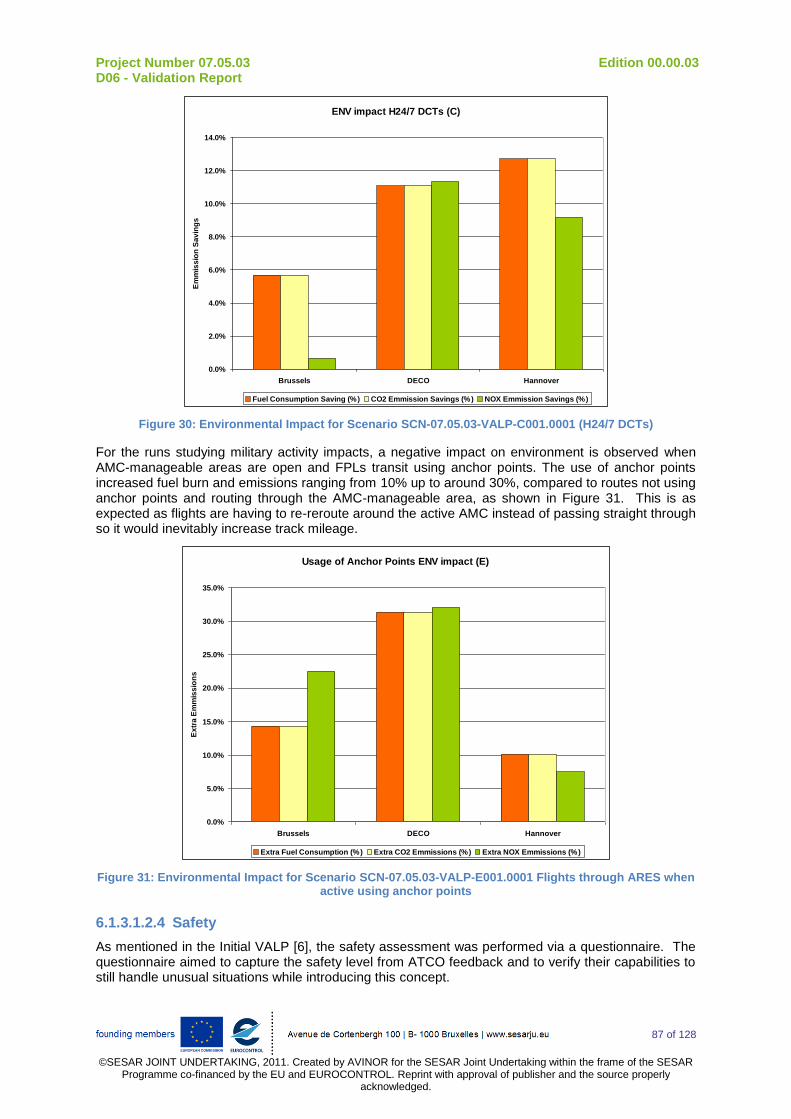
Project Number 07.05.03 Edition 00.00.03 D06 - Validation Report
87 of 128
©SESAR JOINT UNDERTAKING, 2011. Created by AVINOR for the SESAR Joint Undertaking within the frame of the SESAR
Programme co-financed by the EU and EUROCONTROL. Reprint with approval of publisher and the source properly acknowledged.
ENV impact H24/7 DCTs (C)
0.0%
2.0%
4.0%
6.0%
8.0%
10.0%
12.0%
14.0%
Brussels DECO Hannover
Em
mis
sio
n S
av
ing
s
Fuel Consumption Saving (%) CO2 Emmission Savings (%) NOX Emmission Savings (%)
Figure 30: Environmental Impact for Scenario SCN-07.05.03-VALP-C001.0001 (H24/7 DCTs)
For the runs studying military activity impacts, a negative impact on environment is observed when AMC-manageable areas are open and FPLs transit using anchor points. The use of anchor points increased fuel burn and emissions ranging from 10% up to around 30%, compared to routes not using anchor points and routing through the AMC-manageable area, as shown in Figure 31. This is as expected as flights are having to re-reroute around the active AMC instead of passing straight through so it would inevitably increase track mileage.
Usage of Anchor Points ENV impact (E)
0.0%
5.0%
10.0%
15.0%
20.0%
25.0%
30.0%
35.0%
Brussels DECO Hannover
Ex
tra
Em
mis
sio
ns
Extra Fuel Consumption (%) Extra CO2 Emmissions (%) Extra NOX Emmissions (%)
Figure 31: Environmental Impact for Scenario SCN-07.05.03-VALP-E001.0001 Flights through ARES when active using anchor points
6.1.3.1.2.4 Safety
As mentioned in the Initial VALP [6], the safety assessment was performed via a questionnaire. The questionnaire aimed to capture the safety level from ATCO feedback and to verify their capabilities to still handle unusual situations while introducing this concept.
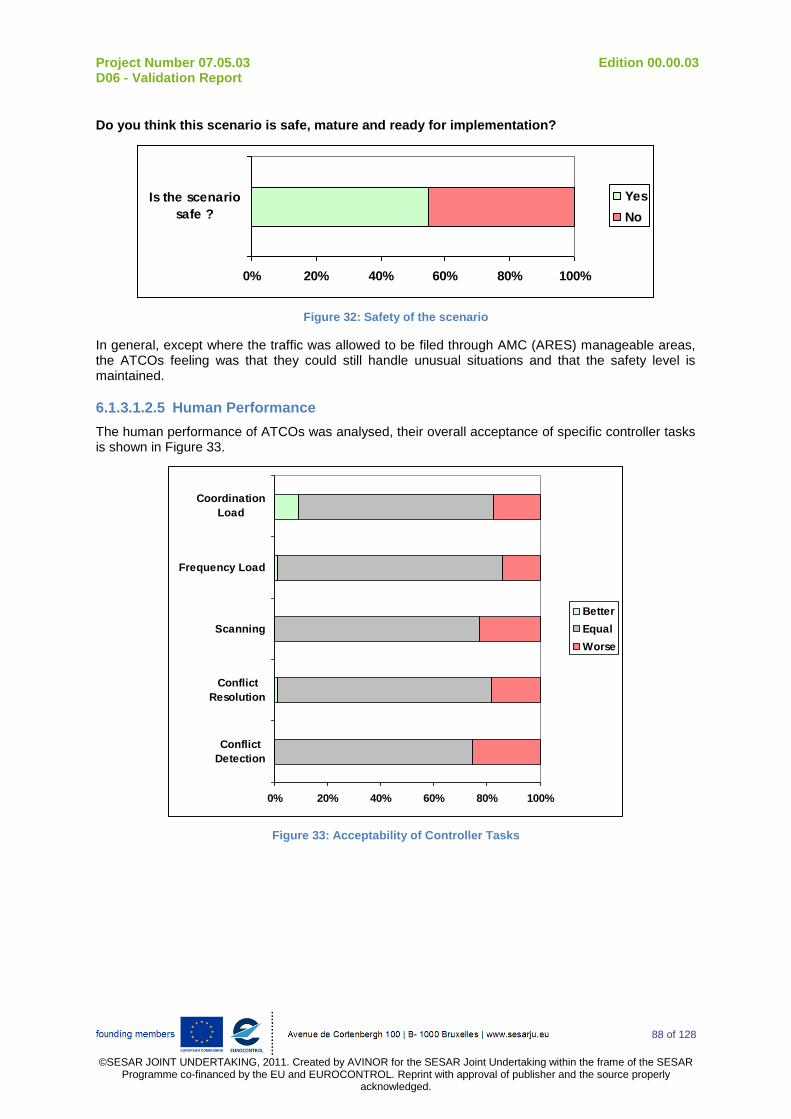
Project Number 07.05.03 Edition 00.00.03 D06 - Validation Report
88 of 128
©SESAR JOINT UNDERTAKING, 2011. Created by AVINOR for the SESAR Joint Undertaking within the frame of the SESAR
Programme co-financed by the EU and EUROCONTROL. Reprint with approval of publisher and the source properly acknowledged.
Do you think this scenario is safe, mature and ready for implementation?
0% 20% 40% 60% 80% 100%
Is the scenario
safe ?
Yes
No
Figure 32: Safety of the scenario
In general, except where the traffic was allowed to be filed through AMC (ARES) manageable areas, the ATCOs feeling was that they could still handle unusual situations and that the safety level is maintained.
6.1.3.1.2.5 Human Performance
The human performance of ATCOs was analysed, their overall acceptance of specific controller tasks is shown in Figure 33.
0% 20% 40% 60% 80% 100%
Conflict
Detection
Conflict
Resolution
Scanning
Frequency Load
Coordination
Load
Better
Equal
Worse
Figure 33: Acceptability of Controller Tasks

Project Number 07.05.03 Edition 00.00.03 D06 - Validation Report
89 of 128
©SESAR JOINT UNDERTAKING, 2011. Created by AVINOR for the SESAR Joint Undertaking within the frame of the SESAR
Programme co-financed by the EU and EUROCONTROL. Reprint with approval of publisher and the source properly acknowledged.
Do you think that the overall workload remains at an acceptable level?
0% 20% 40% 60% 80% 100%
Overall workload
remains at an
acceptable level
?
Yes
No
Figure 34: Acceptability of the Workload
On average ATCOs felt that the concept did not improve controller tasks. No controller felt that concept improved conflict detection or scanning and very few felt the concept improved coordination load, frequency load or conflict resolution. On average 20% of controllers felt that this concept decreased the acceptance of their job tasks.
6.1.3.1.3 Results impacting Regulation and Standardisation Initiatives
N/A
Project Number 07.05.03 Edition 00.00.03 D06 - Validation Report
90 of 128
©SESAR JOINT UNDERTAKING, 2011. Created by AVINOR for the SESAR Joint Undertaking within the frame of the SESAR Programme co-financed by the EU and EUROCONTROL. Reprint
with approval of publisher and the source properly acknowledged.
6.1.3.2 Analysis of Exercise Results
Validation Objective ID
Validation Objective Title Success Criterion Exercise Results
Validation Objective Analysis
Status per Exercise
OBJ-07.05.03-VALP-A001-0010
Assess if the UPR concept is operationally feasible during times of reduced traffic activity: - during night conditions; - during near-night conditions; - during weekend operations.
Results indicate that ATS can be safely provided to the airspace when users implement the UPR concept in low traffic conditions. Assessing the number of new direct routes.
Results indicate free routing via DCTs can be implemented in low traffic conditions.
79% of DCTs tested were approved for implementation.
ATCOs did highlight the possibility of increased confusion and workload due to changes in the traffic pattern/behaviour (e.g. increased turning angles and reduced time to detect conflicts).
DCTs rejected consisted of those creating opposite flows of traffic and severely reducing controller performance.
ATCOs determined that the concept could also be implemented H24 if DCTs did not enter AMC manageable areas. 98 new DCTs were approved.
OK
OBJ-07.05.03-VALP-A003.0030
Evaluate Airspace Management Cells and Airspace Restrictions to determine if FPLs should include DCTs through these areas or if they should use Anchor points.
Results indicate the use of anchor points to avoid active AMCs is operational feasible and the preferred method of operations for ATCOs, compared to tactical intervention to divert flights with FPLs filing through active AMC areas.
Results suggest that the acceptability of the concept is reliant on the use of anchor points to navigate around active AMC-manageable area.
Regarding flight planning through active AMCs, controller tactical intervention reduced ATCO workload above levels deemed acceptable with 55% ATCOs indicated they could not handle unusual events, due to increased airspace complexity.
Without the use of anchor points predicted conflicts increased 3-fold and safety was not guaranteed.
OK

Project Number 07.05.03 Edition 00.00.03 D06 - Validation Report
91 of 128
©SESAR JOINT UNDERTAKING, 2011. Created by AVINOR for the SESAR Joint Undertaking within the frame of the SESAR Programme co-financed by the EU and EUROCONTROL. Reprint
with approval of publisher and the source properly acknowledged.
OBJ-07.05.03-VALP-A004.0040
Assess whether UPR is operationally feasible in a cross-border environment.
Results indicate that ATS can be provided to the airspace when users implement the UPR concept for crossing airspace borders. The concept is acceptable and does not reduce performance.
ATCOs did not agree that any new DCTs could be approved in a cross-border scenario.
The concept was described as being dangerous due to increased ATCO workload and the need for increased coordination efforts.
NOK
OBJ-07.05.03-VALP-A005.0050
Assess if there is any difference in the level of fuel use between aircraft flying on a fixed ATS route and aircraft flying on a UPR FPL.
Results indicate fuel savings when aircraft implement the UPR concept. In terms of: - kg of fuel used per flight; - average fuel burn per flight; - compared to the standard FPL reference trajectory.
Fuel burn reduced by 6-12%.
This trial only looked at DCT routes which may not be the most fuel efficient routes (due to winds, ATC costs etc.). OK
07.05.03-VALP-A006.0060
Assess if safety is impacted by the use of the UPR concept.
Demonstrate that Safety levels will not be adversely affected by implementing the UPR concept.
ATCO results show that about 55% of the ATCO responses stated the scenario was safe, mature and ready for implementation.
However without sufficient information on why 45% of ATCO responses reported the concept was unsafe, the success criterion cannot be satisfied.
NOK
OBJ-07.05.03-VALP-A007.0070
Assess if there are any environmental impacts due to implementing the UPR concept, investigating the extent of any impacts.
Results indicate no negative impact on the environment, in terms of: - kg of CO2, NOx, H2O and Particulates; - Difference in emissions between fixed route FPL and UPR FPL; - Average fuel consumption per flight.
Average reduction in emissions ranging from 6% to 12%, depending on the scenario and the sector group.
Larger sectors were seen to benefit more from reduced emissions. OK

Project Number 07.05.03 Edition 00.00.03 D06 - Validation Report
92 of 128
©SESAR JOINT UNDERTAKING, 2011. Created by AVINOR for the SESAR Joint Undertaking within the frame of the SESAR Programme co-financed by the EU and EUROCONTROL. Reprint
with approval of publisher and the source properly acknowledged.
OBJ-07.05.03-VALP-A008.0080
Assess if the concept of UPR via direct routings and/or using intermediate way points is acceptable.
Results indicate that the concept of UPR is acceptable: - to pilots; - to the Central Flow Management Unit (CFMU); - to ATCOs; - to Airlines; - to Technical systems such as FDP.
ATCOs felt the concept was acceptable during low traffic periods.
On average human performance was thought to be unaffected by all scenarios (based on average results for all scenarios). On average 57% of ATCOs felt scenarios were safe (based on average result for all scenarios).
The acceptance of the concept to AUs, the CFMU and FDP systems was not assessed within this exercise hence the success criterion has not been met.
NOK
OBJ-07.05.03-VALP-A009.0090
Assess the impact of the concept on the horizontal efficiency of flights.
Results indicate that the concept provides efficiency gains, assessed in terms of: - UPR FPLs are flown as planned;- Distance flown in NM comparing fixed route FPL with UPR FPL; - Distance flown in NM comparing FPL track to great circle distances.
Average flown distance reduction of 7% between non UPR flights and DCT flights, for the whole MUAC area, which represents 13NM gained per flight.
OK
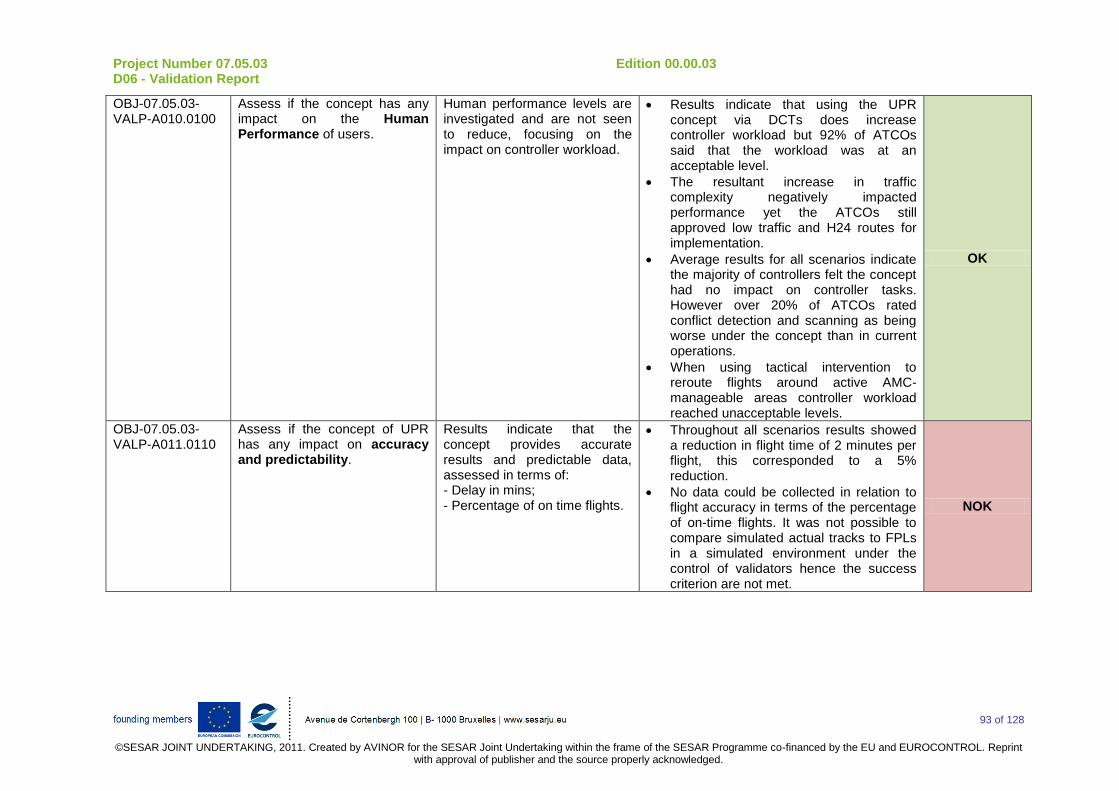
Project Number 07.05.03 Edition 00.00.03 D06 - Validation Report
93 of 128
©SESAR JOINT UNDERTAKING, 2011. Created by AVINOR for the SESAR Joint Undertaking within the frame of the SESAR Programme co-financed by the EU and EUROCONTROL. Reprint
with approval of publisher and the source properly acknowledged.
OBJ-07.05.03-VALP-A010.0100
Assess if the concept has any impact on the Human Performance of users.
Human performance levels are investigated and are not seen to reduce, focusing on the impact on controller workload.
Results indicate that using the UPR concept via DCTs does increase controller workload but 92% of ATCOs said that the workload was at an acceptable level.
The resultant increase in traffic complexity negatively impacted performance yet the ATCOs still approved low traffic and H24 routes for implementation.
Average results for all scenarios indicate the majority of controllers felt the concept had no impact on controller tasks. However over 20% of ATCOs rated conflict detection and scanning as being worse under the concept than in current operations.
When using tactical intervention to reroute flights around active AMC-manageable areas controller workload reached unacceptable levels.
OK
OBJ-07.05.03-VALP-A011.0110
Assess if the concept of UPR has any impact on accuracy and predictability.
Results indicate that the concept provides accurate results and predictable data, assessed in terms of: - Delay in mins; - Percentage of on time flights.
Throughout all scenarios results showed a reduction in flight time of 2 minutes per flight, this corresponded to a 5% reduction.
No data could be collected in relation to flight accuracy in terms of the percentage of on-time flights. It was not possible to compare simulated actual tracks to FPLs in a simulated environment under the control of validators hence the success criterion are not met.
NOK
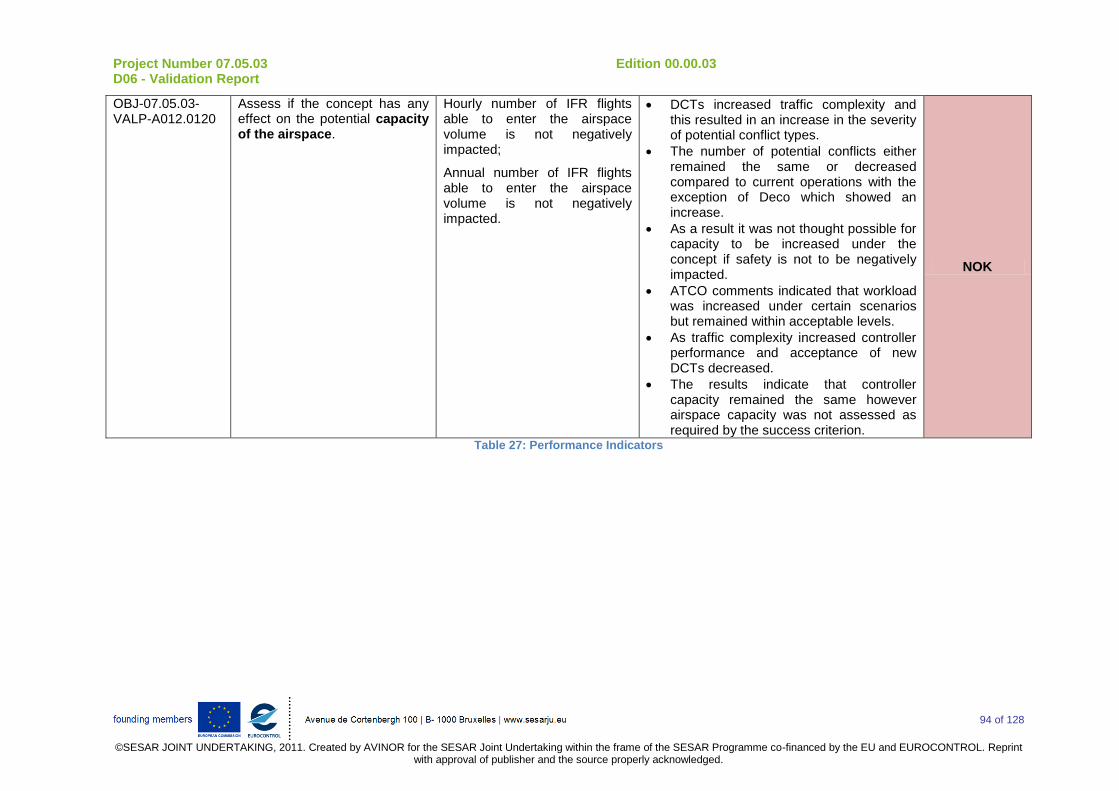
Project Number 07.05.03 Edition 00.00.03 D06 - Validation Report
94 of 128
©SESAR JOINT UNDERTAKING, 2011. Created by AVINOR for the SESAR Joint Undertaking within the frame of the SESAR Programme co-financed by the EU and EUROCONTROL. Reprint
with approval of publisher and the source properly acknowledged.
OBJ-07.05.03-VALP-A012.0120
Assess if the concept has any effect on the potential capacity of the airspace.
Hourly number of IFR flights able to enter the airspace volume is not negatively impacted;
Annual number of IFR flights able to enter the airspace volume is not negatively impacted.
DCTs increased traffic complexity and this resulted in an increase in the severity of potential conflict types.
The number of potential conflicts either remained the same or decreased compared to current operations with the exception of Deco which showed an increase.
As a result it was not thought possible for capacity to be increased under the concept if safety is not to be negatively impacted.
ATCO comments indicated that workload was increased under certain scenarios but remained within acceptable levels.
As traffic complexity increased controller performance and acceptance of new DCTs decreased.
The results indicate that controller capacity remained the same however airspace capacity was not assessed as required by the success criterion.
NOK
Table 27: Performance Indicators
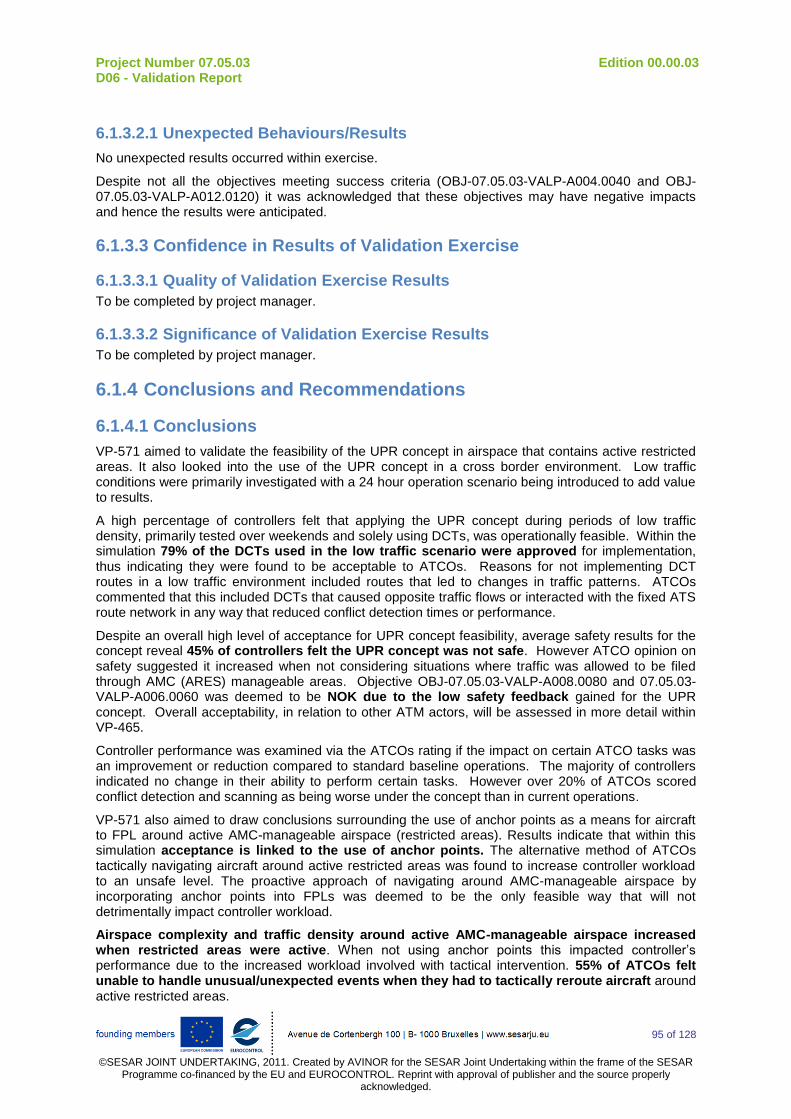
Project Number 07.05.03 Edition 00.00.03 D06 - Validation Report
95 of 128
©SESAR JOINT UNDERTAKING, 2011. Created by AVINOR for the SESAR Joint Undertaking within the frame of the SESAR
Programme co-financed by the EU and EUROCONTROL. Reprint with approval of publisher and the source properly acknowledged.
6.1.3.2.1 Unexpected Behaviours/Results
No unexpected results occurred within exercise.
Despite not all the objectives meeting success criteria (OBJ-07.05.03-VALP-A004.0040 and OBJ-07.05.03-VALP-A012.0120) it was acknowledged that these objectives may have negative impacts and hence the results were anticipated.
6.1.3.3 Confidence in Results of Validation Exercise
6.1.3.3.1 Quality of Validation Exercise Results
To be completed by project manager.
6.1.3.3.2 Significance of Validation Exercise Results
To be completed by project manager.
6.1.4 Conclusions and Recommendations
6.1.4.1 Conclusions
VP-571 aimed to validate the feasibility of the UPR concept in airspace that contains active restricted areas. It also looked into the use of the UPR concept in a cross border environment. Low traffic conditions were primarily investigated with a 24 hour operation scenario being introduced to add value to results.
A high percentage of controllers felt that applying the UPR concept during periods of low traffic density, primarily tested over weekends and solely using DCTs, was operationally feasible. Within the simulation 79% of the DCTs used in the low traffic scenario were approved for implementation, thus indicating they were found to be acceptable to ATCOs. Reasons for not implementing DCT routes in a low traffic environment included routes that led to changes in traffic patterns. ATCOs commented that this included DCTs that caused opposite traffic flows or interacted with the fixed ATS route network in any way that reduced conflict detection times or performance.
Despite an overall high level of acceptance for UPR concept feasibility, average safety results for the concept reveal 45% of controllers felt the UPR concept was not safe. However ATCO opinion on safety suggested it increased when not considering situations where traffic was allowed to be filed through AMC (ARES) manageable areas. Objective OBJ-07.05.03-VALP-A008.0080 and 07.05.03-VALP-A006.0060 was deemed to be NOK due to the low safety feedback gained for the UPR concept. Overall acceptability, in relation to other ATM actors, will be assessed in more detail within VP-465.
Controller performance was examined via the ATCOs rating if the impact on certain ATCO tasks was an improvement or reduction compared to standard baseline operations. The majority of controllers indicated no change in their ability to perform certain tasks. However over 20% of ATCOs scored conflict detection and scanning as being worse under the concept than in current operations.
VP-571 also aimed to draw conclusions surrounding the use of anchor points as a means for aircraft to FPL around active AMC-manageable airspace (restricted areas). Results indicate that within this simulation acceptance is linked to the use of anchor points. The alternative method of ATCOs tactically navigating aircraft around active restricted areas was found to increase controller workload to an unsafe level. The proactive approach of navigating around AMC-manageable airspace by incorporating anchor points into FPLs was deemed to be the only feasible way that will not detrimentally impact controller workload.
Airspace complexity and traffic density around active AMC-manageable airspace increased when restricted areas were active. When not using anchor points this impacted controller’s performance due to the increased workload involved with tactical intervention. 55% of ATCOs felt unable to handle unusual/unexpected events when they had to tactically reroute aircraft around active restricted areas.
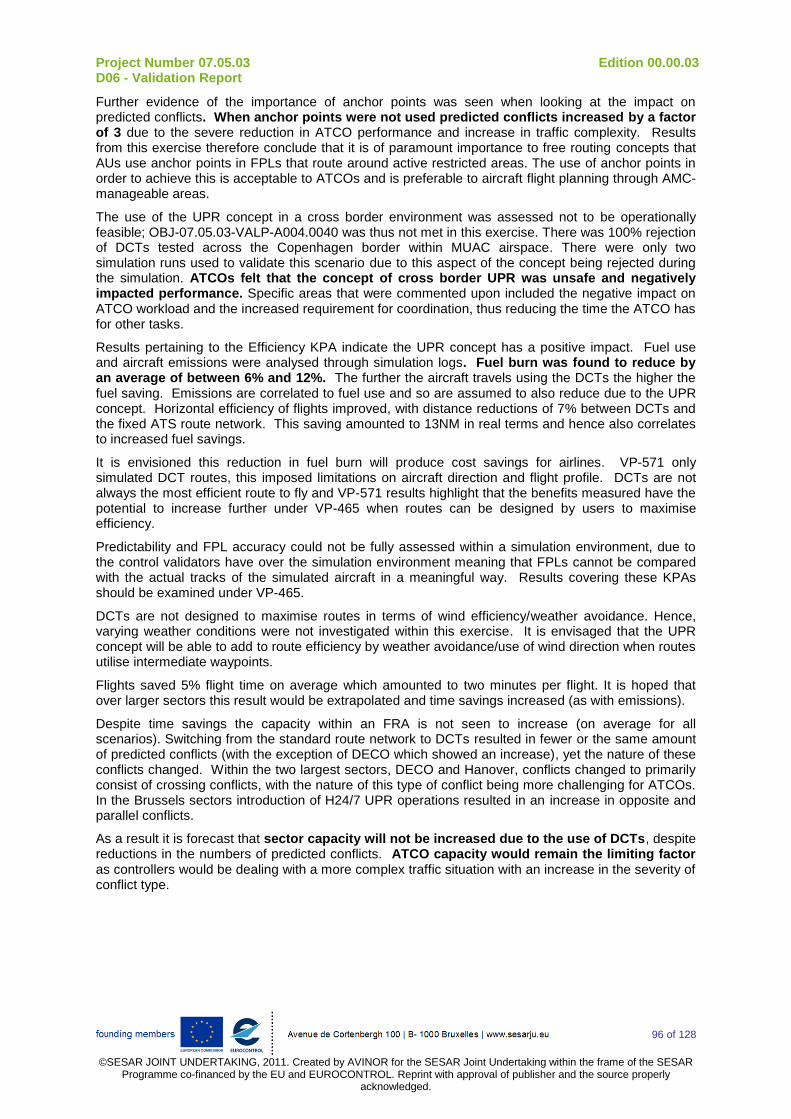
Project Number 07.05.03 Edition 00.00.03 D06 - Validation Report
96 of 128
©SESAR JOINT UNDERTAKING, 2011. Created by AVINOR for the SESAR Joint Undertaking within the frame of the SESAR
Programme co-financed by the EU and EUROCONTROL. Reprint with approval of publisher and the source properly acknowledged.
Further evidence of the importance of anchor points was seen when looking at the impact on predicted conflicts. When anchor points were not used predicted conflicts increased by a factor of 3 due to the severe reduction in ATCO performance and increase in traffic complexity. Results from this exercise therefore conclude that it is of paramount importance to free routing concepts that AUs use anchor points in FPLs that route around active restricted areas. The use of anchor points in order to achieve this is acceptable to ATCOs and is preferable to aircraft flight planning through AMC-manageable areas.
The use of the UPR concept in a cross border environment was assessed not to be operationally feasible; OBJ-07.05.03-VALP-A004.0040 was thus not met in this exercise. There was 100% rejection of DCTs tested across the Copenhagen border within MUAC airspace. There were only two simulation runs used to validate this scenario due to this aspect of the concept being rejected during the simulation. ATCOs felt that the concept of cross border UPR was unsafe and negatively impacted performance. Specific areas that were commented upon included the negative impact on ATCO workload and the increased requirement for coordination, thus reducing the time the ATCO has for other tasks.
Results pertaining to the Efficiency KPA indicate the UPR concept has a positive impact. Fuel use and aircraft emissions were analysed through simulation logs. Fuel burn was found to reduce by an average of between 6% and 12%. The further the aircraft travels using the DCTs the higher the fuel saving. Emissions are correlated to fuel use and so are assumed to also reduce due to the UPR concept. Horizontal efficiency of flights improved, with distance reductions of 7% between DCTs and the fixed ATS route network. This saving amounted to 13NM in real terms and hence also correlates to increased fuel savings.
It is envisioned this reduction in fuel burn will produce cost savings for airlines. VP-571 only simulated DCT routes, this imposed limitations on aircraft direction and flight profile. DCTs are not always the most efficient route to fly and VP-571 results highlight that the benefits measured have the potential to increase further under VP-465 when routes can be designed by users to maximise efficiency.
Predictability and FPL accuracy could not be fully assessed within a simulation environment, due to the control validators have over the simulation environment meaning that FPLs cannot be compared with the actual tracks of the simulated aircraft in a meaningful way. Results covering these KPAs should be examined under VP-465.
DCTs are not designed to maximise routes in terms of wind efficiency/weather avoidance. Hence, varying weather conditions were not investigated within this exercise. It is envisaged that the UPR concept will be able to add to route efficiency by weather avoidance/use of wind direction when routes utilise intermediate waypoints.
Flights saved 5% flight time on average which amounted to two minutes per flight. It is hoped that over larger sectors this result would be extrapolated and time savings increased (as with emissions).
Despite time savings the capacity within an FRA is not seen to increase (on average for all scenarios). Switching from the standard route network to DCTs resulted in fewer or the same amount of predicted conflicts (with the exception of DECO which showed an increase), yet the nature of these conflicts changed. Within the two largest sectors, DECO and Hanover, conflicts changed to primarily consist of crossing conflicts, with the nature of this type of conflict being more challenging for ATCOs. In the Brussels sectors introduction of H24/7 UPR operations resulted in an increase in opposite and parallel conflicts.
As a result it is forecast that sector capacity will not be increased due to the use of DCTs, despite reductions in the numbers of predicted conflicts. ATCO capacity would remain the limiting factor as controllers would be dealing with a more complex traffic situation with an increase in the severity of conflict type.
Project Number 07.05.03 Edition 00.00.03 D06 - Validation Report
97 of 128
©SESAR JOINT UNDERTAKING, 2011. Created by AVINOR for the SESAR Joint Undertaking within the frame of the SESAR
Programme co-financed by the EU and EUROCONTROL. Reprint with approval of publisher and the source properly acknowledged.
6.1.4.2 Recommendations
Recommendations for the Validation Exercise VP-571 include the following:
6.1.4.2.1 Recommendations on Concept and Procedures
With regards to the concept and associated procedures, the following points are recommended:
The concept of anchor points should be assessed by the regulator and standard procedures developed;
Investigate how the UPR concept applies to vertically evolving flights;
Investigate modifications to the method of crossing the MUAC-Copenhagen border;
The simulation should be widened to include a more flexible approach to UPR flight planning to include routes with intermediate waypoints and not simply DCT routings.
6.1.4.2.2 Recommendations on Key Performance Areas
In order to improve the analysis of KPAs the following is recommended:
Assess if implementing the UPR concept effects the level of co-ordination, phone calls and radiotelephony duration to gain further insight into potential human performance issues;
Collect subjective feedback from ATCOs to gain a better understanding of potential safety issues;
Investigate the number and type of conflicts comparing different phases of flight within FRA.
6.1.4.2.3 Recommendations for Future Validation Exercises/Planning
With regards to the future validation exercises, the following points are recommended:
A live operational trial will be required to ensure the concept is being assessed sufficiently at V3 maturity;
Within a live trial environment actual track data should be collected together with FPL data to ensure the concept is being assessed sufficiently at V3 maturity.
Project Number 07.05.03 Edition 00.00.03 D06 - Validation Report
98 of 128
©SESAR JOINT UNDERTAKING, 2011. Created by AVINOR for the SESAR Joint Undertaking within the frame of the SESAR
Programme co-financed by the EU and EUROCONTROL. Reprint with approval of publisher and the source properly acknowledged.
6.2 Live Trial in NORACON Airspace Addressing Free Route Operations Using Intermediate Waypoints (EXE-07.05.03-VP-465) Report
6.2.1 Exercise Scope
VP-465 was a live operational trial conducted in Northern European airspace by NORACON looking into the UPR concept using intermediate waypoints. This concept is currently V3 maturity.
Current implementations of Free Routing typically involve pre-defined DCT routes operated at specified times. This exercise focused on providing additional flexibility by allowing the AUs to define routes where a significant part of the intended route specified by the AU is not defined according to published route segments.
The concept allows the AU to adapt routes in finer detail on a day by day basis to optimise against wind, ATC costs etc. to meet business requirements. In addition, UPR FPLs should be better adhered to in operation as there should be less need for ATCO intervention to provide DCT routings as the original FPL should already meet the AUs requirements. This should mean better network predictability. The effect of the UPR concept was assessed in terms of efficiency and predictability of flights and the impact in terms of workload and safety from the controller perspective.
This exercise had less traffic density and complexity than VP-571 allowing an assessment to be made of improvements gained when using intermediate (published or not) way points. VP-465 considered three phases of flight: over flights, flights climbing to cruise and flights climbing, cruising then descending.
As VP-465 was a live trial meant that it was not possible to assess two identical flights using a reference and UPR concept solution. A single flight was only able to fly a UPR FPL or a non UPR FPL. To mitigate this limitation, FPL data was used for much of the assessment where UPR and non UPR FPLs could be compared together.
The baseline used was the non UPR FPLs however there were two methods that airlines used to create them. These methods are stated in Table 28 below.
VP-465-Baseline 1: Non UPR FPLs created using the fixed route network structure only.
VP-465-Baseline 2: Non UPR FPLs created using the fixed route network structure and DCT routes within FRA inside the DK/SE FAB.
Table 28: VP-465 Baseline Scenarios
The following data in this analysis compares UPR FPLs with non UPR FPLs in order to get a comparable dataset. However, it is worth noting that there may be differences between the planning environment and the operational environment. These differences may be due to inaccuracies in the weather forecast and any deviations the flight may encounter due to controller intervention.
6.2.2 Conduct of Validation Exercise
6.2.2.1 Exercise Preparation
Prior to execution of the validation exercise the following preparatory activities were undertaken:
Participating controllers from the relevant ACCs were identified and briefed on the concept and the UPR procedures;
The participant airlines briefed on how to file UPR FPLs and what data to log;
The subjective questionnaire for controllers was prepared;
The Validation Plan [6] was issued.
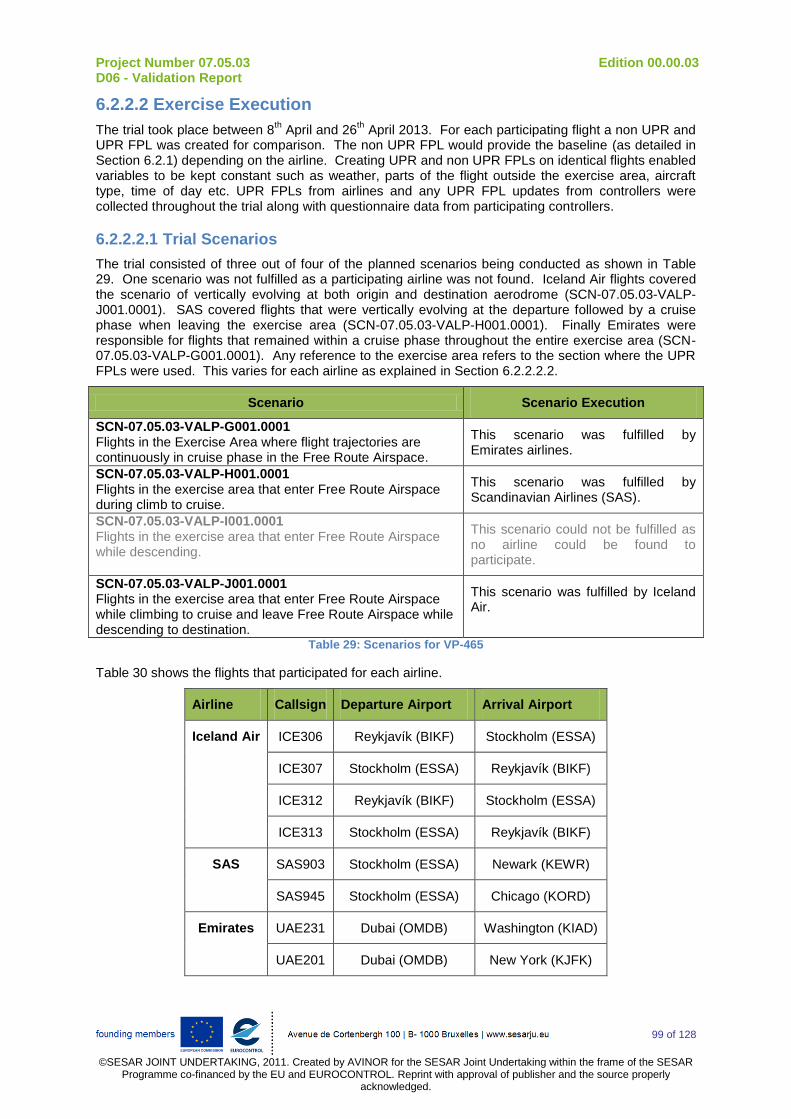
Project Number 07.05.03 Edition 00.00.03 D06 - Validation Report
99 of 128
©SESAR JOINT UNDERTAKING, 2011. Created by AVINOR for the SESAR Joint Undertaking within the frame of the SESAR
Programme co-financed by the EU and EUROCONTROL. Reprint with approval of publisher and the source properly acknowledged.
6.2.2.2 Exercise Execution
The trial took place between 8th April and 26
th April 2013. For each participating flight a non UPR and
UPR FPL was created for comparison. The non UPR FPL would provide the baseline (as detailed in Section 6.2.1) depending on the airline. Creating UPR and non UPR FPLs on identical flights enabled variables to be kept constant such as weather, parts of the flight outside the exercise area, aircraft type, time of day etc. UPR FPLs from airlines and any UPR FPL updates from controllers were collected throughout the trial along with questionnaire data from participating controllers.
6.2.2.2.1 Trial Scenarios
The trial consisted of three out of four of the planned scenarios being conducted as shown in Table 29. One scenario was not fulfilled as a participating airline was not found. Iceland Air flights covered the scenario of vertically evolving at both origin and destination aerodrome (SCN-07.05.03-VALP-J001.0001). SAS covered flights that were vertically evolving at the departure followed by a cruise phase when leaving the exercise area (SCN-07.05.03-VALP-H001.0001). Finally Emirates were responsible for flights that remained within a cruise phase throughout the entire exercise area (SCN-07.05.03-VALP-G001.0001). Any reference to the exercise area refers to the section where the UPR FPLs were used. This varies for each airline as explained in Section 6.2.2.2.2.
Scenario Scenario Execution
SCN-07.05.03-VALP-G001.0001 Flights in the Exercise Area where flight trajectories are continuously in cruise phase in the Free Route Airspace.
This scenario was fulfilled by Emirates airlines.
SCN-07.05.03-VALP-H001.0001 Flights in the exercise area that enter Free Route Airspace during climb to cruise.
This scenario was fulfilled by Scandinavian Airlines (SAS).
SCN-07.05.03-VALP-I001.0001 Flights in the exercise area that enter Free Route Airspace while descending.
This scenario could not be fulfilled as no airline could be found to participate.
SCN-07.05.03-VALP-J001.0001 Flights in the exercise area that enter Free Route Airspace while climbing to cruise and leave Free Route Airspace while descending to destination.
This scenario was fulfilled by Iceland Air.
Table 29: Scenarios for VP-465
Table 30 shows the flights that participated for each airline.
Airline Callsign Departure Airport Arrival Airport
Iceland Air ICE306 Reykjavík (BIKF) Stockholm (ESSA)
ICE307 Stockholm (ESSA) Reykjavík (BIKF)
ICE312 Reykjavík (BIKF) Stockholm (ESSA)
ICE313 Stockholm (ESSA) Reykjavík (BIKF)
SAS SAS903 Stockholm (ESSA) Newark (KEWR)
SAS945 Stockholm (ESSA) Chicago (KORD)
Emirates UAE231 Dubai (OMDB) Washington (KIAD)
UAE201 Dubai (OMDB) New York (KJFK)

Project Number 07.05.03 Edition 00.00.03 D06 - Validation Report
100 of 128
©SESAR JOINT UNDERTAKING, 2011. Created by AVINOR for the SESAR Joint Undertaking within the frame of the SESAR
Programme co-financed by the EU and EUROCONTROL. Reprint with approval of publisher and the source properly acknowledged.
Airline Callsign Departure Airport Arrival Airport
UAE203 Dubai (OMDB) New York (KJFK)
Table 30: Participating Flights in Trial
6.2.2.2.2 Airspace Information
Each airline designed UPR FPLs using different methods with further details provided below.
6.2.2.2.2.1 Iceland Air
Figure 35 shows the normal non UPR FPLs (blue tracks) that were used to compare with UPR FPLs (red tracks) for the Iceland Air flights detailed in Table 30. These non UPR FPLs are used in current operations. Before the trial started, Iceland Air created a series of UPR FPLs which started at the end of the SID (either ESSA or BIKF) and completed at the beginning of the STAR (either ESSA or BIKF). Then a published point was selected on both the Oceanic border and the Swedish-Norwegian border to provide a known crossing point between FIRs. Iceland Air did not make use of intermediate waypoints between the FIR boundaries. This would mean the full flexibility of the concept could not be used to optimise the FPLs to Iceland Air’s needs. On the day of planning for each flight, the best non UPR FPL was compared with the best UPR FPL and the cheapest route (in terms of total cost of flight including fuel cost, ATC costs, aircraft operating costs etc.) was selected to be flown.
Figure 35: Iceland Air Non UPR FPLs Vs. UPR FPLs
6.2.2.2.2.2 SAS
SAS followed a similar procedure to Iceland Air although their current operations already use the FRA initiative that Sweden are trialling at the moment so their baseline already has some flexibility built in beyond that provided by the fixed route network (Baseline 2 described in Section 6.2.1). As shown in Figure 36 during planning for each flight, SAS calculated the best non UPR FPL (blue tracks) which would typically involve a DCT routing through Swedish airspace to a published Swedish-Norwegian border point (as accommodated by the Sweden FRA initiative) then followed by a route through Norwegian airspace to the Oceanic border using the fixed route network. This was then compared to a UPR FPL (red tracks) which would simply route from the end of the ESSA SID direct out to the Oceanic border. Hence the main difference between SAS Non UPR FPLs and UPR FPLs was a route not being constrained by a published Swedish-Norwegian border waypoint. Results from SAS enabled an assessment of potential benefits that could be achieved by the additional flexibility on top of the current FRA initiative within Sweden. SAS did not actually fly their UPR FPLs. However, they did provide the UPR FPLs that they would have flown. This allows comparison of UPR and non UPR FPLs but no controller feedback.

Project Number 07.05.03 Edition 00.00.03 D06 - Validation Report
101 of 128
©SESAR JOINT UNDERTAKING, 2011. Created by AVINOR for the SESAR Joint Undertaking within the frame of the SESAR
Programme co-financed by the EU and EUROCONTROL. Reprint with approval of publisher and the source properly acknowledged.
Figure 36: SAS Non UPR FPLs Vs. UPR FPLs
6.2.2.2.2.3 Emirates
Emirates, who covered the scenario of cruising throughout the exercise area (from Eastern Swedish border to the Bodø-Reykjavík border), started with a non UPR FPL (blue tracks) as shown in Figure 37). This was adapted to include a UPR FPL segment over the exercise area (red tracks) using a Swedish-Norwegian border waypoint and intermediate points. The use of these intermediate points allowed Emirates to optimise the UPR FPL to achieve a minimum overall flight cost. These routes were designed on a day by day basis as there was no way of knowing the start and end points of the UPR FPL segment beforehand. As the flights were long haul they could have large variations in latitude when they enter the exercise area due to variables outside of the exercise area. Note that the tracks appear purple were the UPR FPL is the same as the corresponding non UPR FPL.
Creating UPR FPLs on the day with the most up to date weather conditions plus the use of intermediate points gave Emirates a lot of flexibility in optimising the routes and taking full advantage of the concept as opposed to the more restrictive methods used by Iceland Air and SAS.
Figure 37: Emirates Non UPR FPLs Vs. UPR FPLs
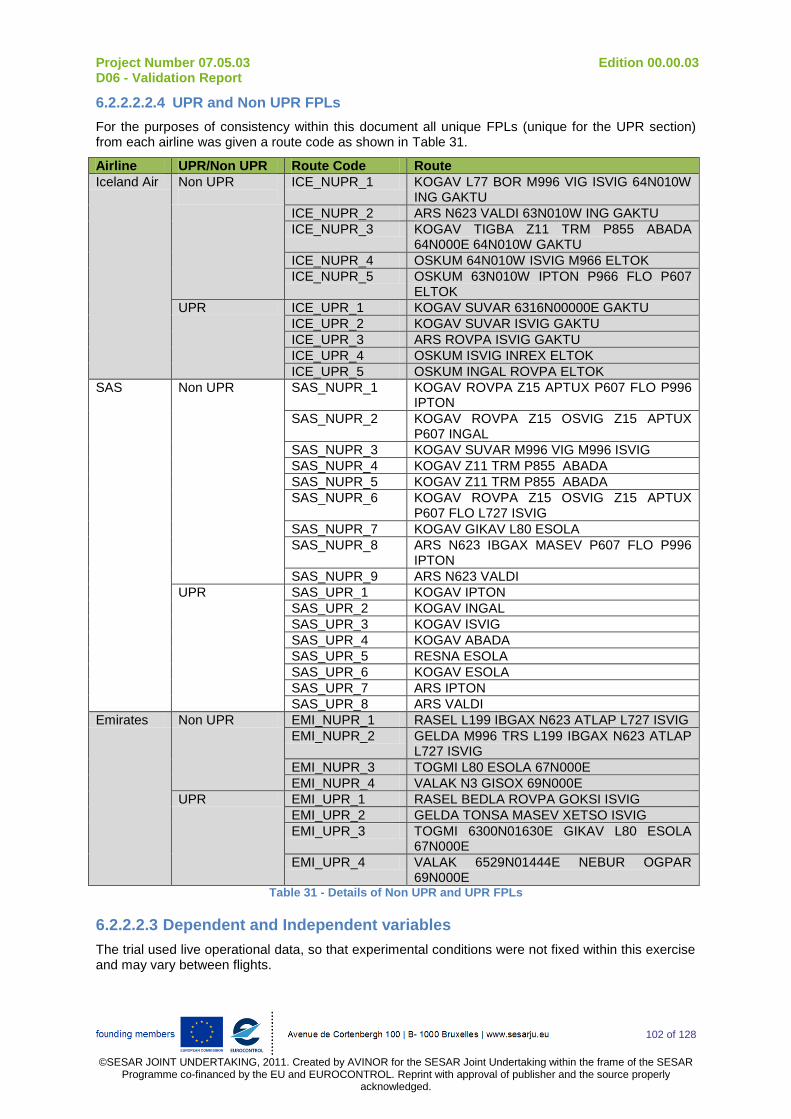
Project Number 07.05.03 Edition 00.00.03 D06 - Validation Report
102 of 128
©SESAR JOINT UNDERTAKING, 2011. Created by AVINOR for the SESAR Joint Undertaking within the frame of the SESAR
Programme co-financed by the EU and EUROCONTROL. Reprint with approval of publisher and the source properly acknowledged.
6.2.2.2.2.4 UPR and Non UPR FPLs
For the purposes of consistency within this document all unique FPLs (unique for the UPR section) from each airline was given a route code as shown in Table 31.
Airline UPR/Non UPR Route Code Route
Iceland Air Non UPR
ICE_NUPR_1 KOGAV L77 BOR M996 VIG ISVIG 64N010W ING GAKTU
ICE_NUPR_2 ARS N623 VALDI 63N010W ING GAKTU
ICE_NUPR_3 KOGAV TIGBA Z11 TRM P855 ABADA 64N000E 64N010W GAKTU
ICE_NUPR_4 OSKUM 64N010W ISVIG M966 ELTOK
ICE_NUPR_5 OSKUM 63N010W IPTON P966 FLO P607 ELTOK
UPR ICE_UPR_1 KOGAV SUVAR 6316N00000E GAKTU
ICE_UPR_2 KOGAV SUVAR ISVIG GAKTU
ICE_UPR_3 ARS ROVPA ISVIG GAKTU
ICE_UPR_4 OSKUM ISVIG INREX ELTOK
ICE_UPR_5 OSKUM INGAL ROVPA ELTOK
SAS Non UPR SAS_NUPR_1 KOGAV ROVPA Z15 APTUX P607 FLO P996 IPTON
SAS_NUPR_2 KOGAV ROVPA Z15 OSVIG Z15 APTUX P607 INGAL
SAS_NUPR_3 KOGAV SUVAR M996 VIG M996 ISVIG
SAS_NUPR_4 KOGAV Z11 TRM P855 ABADA
SAS_NUPR_5 KOGAV Z11 TRM P855 ABADA
SAS_NUPR_6 KOGAV ROVPA Z15 OSVIG Z15 APTUX P607 FLO L727 ISVIG
SAS_NUPR_7 KOGAV GIKAV L80 ESOLA
SAS_NUPR_8 ARS N623 IBGAX MASEV P607 FLO P996 IPTON
SAS_NUPR_9 ARS N623 VALDI
UPR SAS_UPR_1 KOGAV IPTON
SAS_UPR_2 KOGAV INGAL
SAS_UPR_3 KOGAV ISVIG
SAS_UPR_4 KOGAV ABADA
SAS_UPR_5 RESNA ESOLA
SAS_UPR_6 KOGAV ESOLA
SAS_UPR_7 ARS IPTON
SAS_UPR_8 ARS VALDI
Emirates Non UPR EMI_NUPR_1 RASEL L199 IBGAX N623 ATLAP L727 ISVIG
EMI_NUPR_2 GELDA M996 TRS L199 IBGAX N623 ATLAP L727 ISVIG
EMI_NUPR_3 TOGMI L80 ESOLA 67N000E
EMI_NUPR_4 VALAK N3 GISOX 69N000E
UPR EMI_UPR_1 RASEL BEDLA ROVPA GOKSI ISVIG
EMI_UPR_2 GELDA TONSA MASEV XETSO ISVIG
EMI_UPR_3 TOGMI 6300N01630E GIKAV L80 ESOLA 67N000E
EMI_UPR_4 VALAK 6529N01444E NEBUR OGPAR 69N000E
Table 31 - Details of Non UPR and UPR FPLs
6.2.2.2.3 Dependent and Independent variables
The trial used live operational data, so that experimental conditions were not fixed within this exercise and may vary between flights.

Project Number 07.05.03 Edition 00.00.03 D06 - Validation Report
103 of 128
©SESAR JOINT UNDERTAKING, 2011. Created by AVINOR for the SESAR Joint Undertaking within the frame of the SESAR
Programme co-financed by the EU and EUROCONTROL. Reprint with approval of publisher and the source properly acknowledged.
Factors that will influence the dependent variables (uncontrolled independent variables) between FPLs include:
Aircraft type;
Weather conditions obtained from a forecast (although time of forecast before flight is not known but reliability of this is important to accurately optimise UPR FPLs);
FPL optimisation variable (i.e. distance, fuel burn, time, total flight cost).
Additional factors that will influence the dependent variables between UPR FPLs that are actually flown include:
Other AUs in the vicinity of the UPR FPL that is flown that could impact it;
Interventions by ATC.
The dependant variables are:
Flight track miles;
Flight cost;
Fuel burn;
Flight time.
6.2.2.2.4 Trial Participants
Iceland Air, SAS and Emirates took part in VP-465 as described in Section 6.2.2.2.2 plus controllers from Stockholm, Malmö, Oslo, Stavanger, Bodø and Reykjavík.
6.2.2.2.5 Time Planning
An exact timetable for VP-465 was not created due to the flexible nature of a live trial. Flights were scheduled by airlines within the time period to fit in with each airline’s own operations.
6.2.2.2.6 Data collection methods
Data collection consisted of qualitative and quantitative data. The analysis within this report produced various metrics to aid analysis.
The following methods were used to collect the required data:
1 ATCO End of Shift questionnaires;
2 Airline UPR and non UPR FPLs;
3 Airline Subjective Responses/Debriefing.
6.2.2.2.7 Additional Analysis Comparisons
N/A
6.2.2.3 Deviation from the Planned Activities
The following deviations from the P07.05.03 Validation Plan [6] occurred:
1. Emirates experienced technical issues (details unknown if they are related or unrelated to the UPR concept) during the first five days so that they were unable to submit UPR FPLs during this period. Not all Emirates flights which were on routes from Dubai – New York or Dubai - Washington passed through the exercise area due to FPLs routing at a lower latitude for reasons outside the exercise area such as weather conditions;
2. Originally the trial was scheduled from 8th – 21
st April 2013 but was later extended until the
26th April to obtain more data. Iceland Air participation extended to this new date resulting in
a total of 42 flights, SAS participation did not extend resulting in 28 flights and Emirates did extend resulting in four flights;

Project Number 07.05.03 Edition 00.00.03 D06 - Validation Report
104 of 128
©SESAR JOINT UNDERTAKING, 2011. Created by AVINOR for the SESAR Joint Undertaking within the frame of the SESAR
Programme co-financed by the EU and EUROCONTROL. Reprint with approval of publisher and the source properly acknowledged.
3. Scenario SCN-07.05.03-VALP-I001.0001 was not conducted. This scenario could not be fulfilled as no airline could be found to participate.
6.2.3 Exercise Results
6.2.3.1 Summary of Exercise Results
Objective ID Validation Objective
Title Success Criterion
Objective Status per Exercise
OBJ-07.05.03-VALP-A002.0020
Assess if the concept of UPR is operationally feasible during different times of day and conditions.
Results indicate that ATS can be safely and acceptably provided to the airspace when users implement the UPR concept during any time of day and during varying traffic complexities.
OK
OBJ-07.05.03-VALP-A005.0050
Assess if there is any difference in the level of fuel use between aircraft flying on a fixed ATS route and aircraft flying on a UPR FPL.
Results indicate fuel savings when aircraft implement the UPR concept. In terms of: - kg of fuel used per flight; - average fuel burn per flight; - compared to the standard FPL reference trajectory.
OK
OBJ-07.05.03-VALP-A006.0060
Assess if safety is impacted by the use of the UPR concept.
Demonstrate that Safety levels will not be adversely affected by implementing the UPR concept.
OK
OBJ-07.05.03-VALP-A007.0070
Assess if there are any environmental impacts due to implementing the UPR concept, investigating the extent of any impacts.
Results indicate no negative impact on the environment, in terms of: - kg of CO2, NOx, H2O and Particulates; - Difference in emissions between fixed route FPL and UPR FPL; - Average fuel consumption per flight.
OK
OBJ-07.05.03-VALP-A008.0080
Assess if the concept of UPR via direct routings and/or using intermediate way points is acceptable.
Results indicate that the concept of UPR is acceptable: - to pilots; - to the Central Flow Management Unit (CFMU); - to ATCOs; - to Airlines; - to Technical systems such as FDP.
NOK
OBJ-07.05.03-VALP-A009.0090
Assess the impact of the concept on the horizontal efficiency of flights.
Results indicate that the concept provides efficiency gains, assessed in terms of: - UPR FPLs are flown as planned; - Distance flown in NM comparing fixed route FPL with UPR FPL; - Distance flown in NM comparing FPL track to great circle distances.
OK
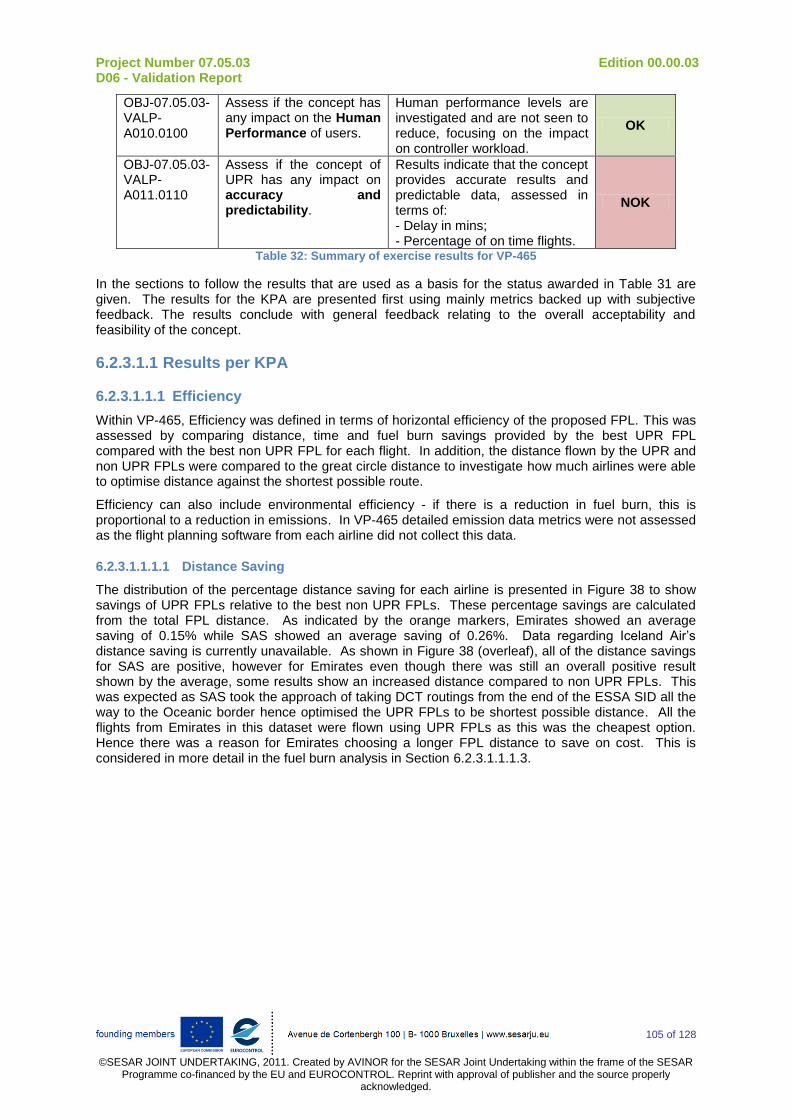
Project Number 07.05.03 Edition 00.00.03 D06 - Validation Report
105 of 128
©SESAR JOINT UNDERTAKING, 2011. Created by AVINOR for the SESAR Joint Undertaking within the frame of the SESAR
Programme co-financed by the EU and EUROCONTROL. Reprint with approval of publisher and the source properly acknowledged.
OBJ-07.05.03-VALP-A010.0100
Assess if the concept has any impact on the Human Performance of users.
Human performance levels are investigated and are not seen to reduce, focusing on the impact on controller workload.
OK
OBJ-07.05.03-VALP-A011.0110
Assess if the concept of UPR has any impact on accuracy and predictability.
Results indicate that the concept provides accurate results and predictable data, assessed in terms of: - Delay in mins; - Percentage of on time flights.
NOK
Table 32: Summary of exercise results for VP-465
In the sections to follow the results that are used as a basis for the status awarded in Table 31 are given. The results for the KPA are presented first using mainly metrics backed up with subjective feedback. The results conclude with general feedback relating to the overall acceptability and feasibility of the concept.
6.2.3.1.1 Results per KPA
6.2.3.1.1.1 Efficiency
Within VP-465, Efficiency was defined in terms of horizontal efficiency of the proposed FPL. This was assessed by comparing distance, time and fuel burn savings provided by the best UPR FPL compared with the best non UPR FPL for each flight. In addition, the distance flown by the UPR and non UPR FPLs were compared to the great circle distance to investigate how much airlines were able to optimise distance against the shortest possible route.
Efficiency can also include environmental efficiency - if there is a reduction in fuel burn, this is proportional to a reduction in emissions. In VP-465 detailed emission data metrics were not assessed as the flight planning software from each airline did not collect this data.
6.2.3.1.1.1.1 Distance Saving
The distribution of the percentage distance saving for each airline is presented in Figure 38 to show savings of UPR FPLs relative to the best non UPR FPLs. These percentage savings are calculated from the total FPL distance. As indicated by the orange markers, Emirates showed an average saving of 0.15% while SAS showed an average saving of 0.26%. Data regarding Iceland Air’s distance saving is currently unavailable. As shown in Figure 38 (overleaf), all of the distance savings for SAS are positive, however for Emirates even though there was still an overall positive result shown by the average, some results show an increased distance compared to non UPR FPLs. This was expected as SAS took the approach of taking DCT routings from the end of the ESSA SID all the way to the Oceanic border hence optimised the UPR FPLs to be shortest possible distance. All the flights from Emirates in this dataset were flown using UPR FPLs as this was the cheapest option. Hence there was a reason for Emirates choosing a longer FPL distance to save on cost. This is considered in more detail in the fuel burn analysis in Section 6.2.3.1.1.1.3.
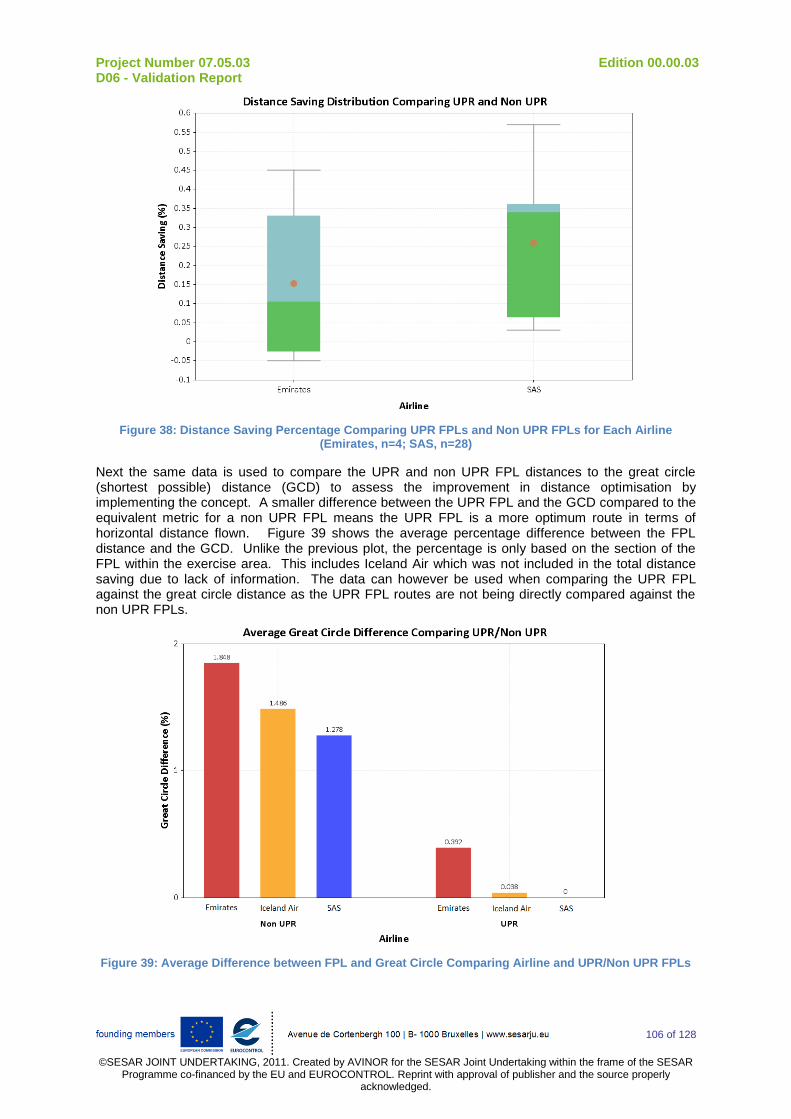
Project Number 07.05.03 Edition 00.00.03 D06 - Validation Report
106 of 128
©SESAR JOINT UNDERTAKING, 2011. Created by AVINOR for the SESAR Joint Undertaking within the frame of the SESAR
Programme co-financed by the EU and EUROCONTROL. Reprint with approval of publisher and the source properly acknowledged.
Figure 38: Distance Saving Percentage Comparing UPR FPLs and Non UPR FPLs for Each Airline (Emirates, n=4; SAS, n=28)
Next the same data is used to compare the UPR and non UPR FPL distances to the great circle (shortest possible) distance (GCD) to assess the improvement in distance optimisation by implementing the concept. A smaller difference between the UPR FPL and the GCD compared to the equivalent metric for a non UPR FPL means the UPR FPL is a more optimum route in terms of horizontal distance flown. Figure 39 shows the average percentage difference between the FPL distance and the GCD. Unlike the previous plot, the percentage is only based on the section of the FPL within the exercise area. This includes Iceland Air which was not included in the total distance saving due to lack of information. The data can however be used when comparing the UPR FPL against the great circle distance as the UPR FPL routes are not being directly compared against the non UPR FPLs.
Figure 39: Average Difference between FPL and Great Circle Comparing Airline and UPR/Non UPR FPLs
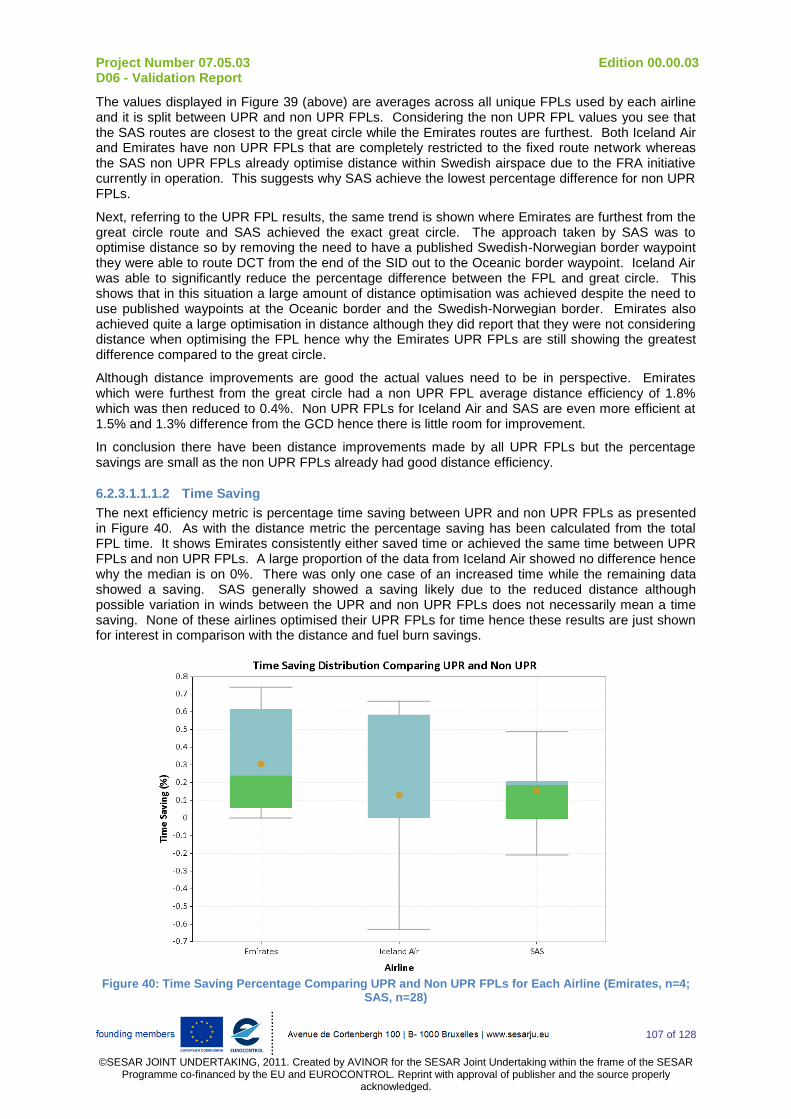
Project Number 07.05.03 Edition 00.00.03 D06 - Validation Report
107 of 128
©SESAR JOINT UNDERTAKING, 2011. Created by AVINOR for the SESAR Joint Undertaking within the frame of the SESAR
Programme co-financed by the EU and EUROCONTROL. Reprint with approval of publisher and the source properly acknowledged.
The values displayed in Figure 39 (above) are averages across all unique FPLs used by each airline and it is split between UPR and non UPR FPLs. Considering the non UPR FPL values you see that the SAS routes are closest to the great circle while the Emirates routes are furthest. Both Iceland Air and Emirates have non UPR FPLs that are completely restricted to the fixed route network whereas the SAS non UPR FPLs already optimise distance within Swedish airspace due to the FRA initiative currently in operation. This suggests why SAS achieve the lowest percentage difference for non UPR FPLs.
Next, referring to the UPR FPL results, the same trend is shown where Emirates are furthest from the great circle route and SAS achieved the exact great circle. The approach taken by SAS was to optimise distance so by removing the need to have a published Swedish-Norwegian border waypoint they were able to route DCT from the end of the SID out to the Oceanic border waypoint. Iceland Air was able to significantly reduce the percentage difference between the FPL and great circle. This shows that in this situation a large amount of distance optimisation was achieved despite the need to use published waypoints at the Oceanic border and the Swedish-Norwegian border. Emirates also achieved quite a large optimisation in distance although they did report that they were not considering distance when optimising the FPL hence why the Emirates UPR FPLs are still showing the greatest difference compared to the great circle.
Although distance improvements are good the actual values need to be in perspective. Emirates which were furthest from the great circle had a non UPR FPL average distance efficiency of 1.8% which was then reduced to 0.4%. Non UPR FPLs for Iceland Air and SAS are even more efficient at 1.5% and 1.3% difference from the GCD hence there is little room for improvement.
In conclusion there have been distance improvements made by all UPR FPLs but the percentage savings are small as the non UPR FPLs already had good distance efficiency.
6.2.3.1.1.1.2 Time Saving
The next efficiency metric is percentage time saving between UPR and non UPR FPLs as presented in Figure 40. As with the distance metric the percentage saving has been calculated from the total FPL time. It shows Emirates consistently either saved time or achieved the same time between UPR FPLs and non UPR FPLs. A large proportion of the data from Iceland Air showed no difference hence why the median is on 0%. There was only one case of an increased time while the remaining data showed a saving. SAS generally showed a saving likely due to the reduced distance although possible variation in winds between the UPR and non UPR FPLs does not necessarily mean a time saving. None of these airlines optimised their UPR FPLs for time hence these results are just shown for interest in comparison with the distance and fuel burn savings.
Figure 40: Time Saving Percentage Comparing UPR and Non UPR FPLs for Each Airline (Emirates, n=4;
SAS, n=28)
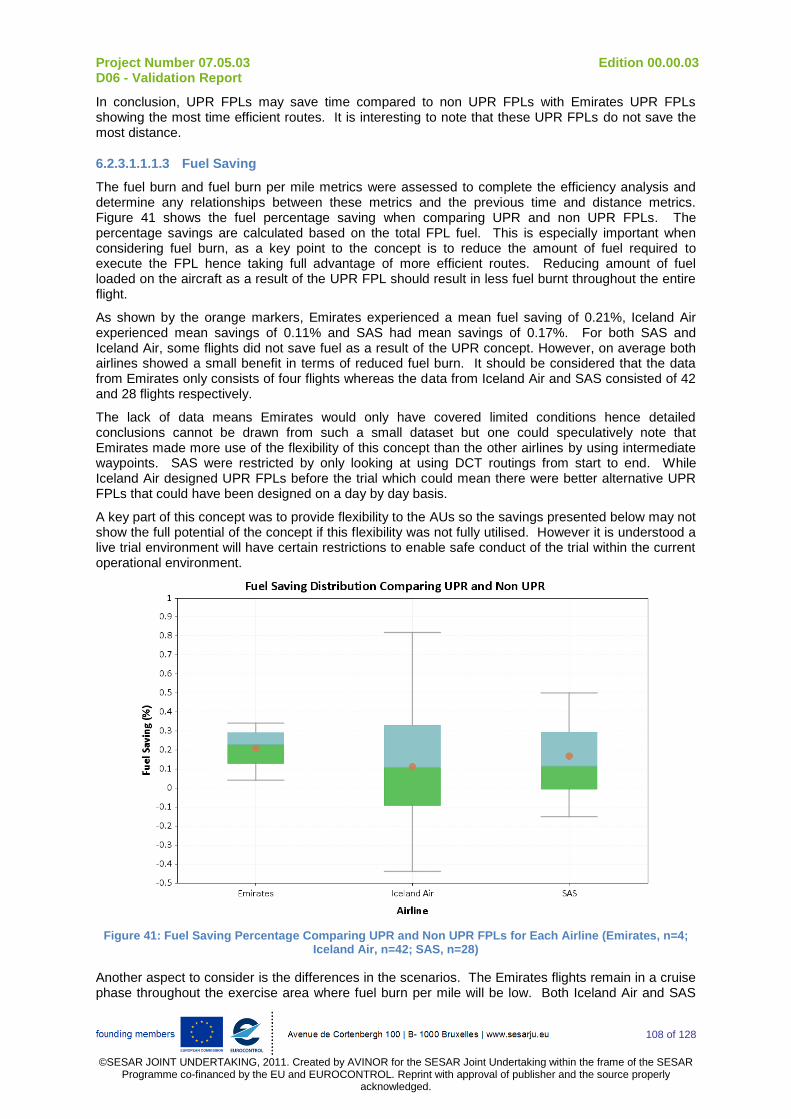
Project Number 07.05.03 Edition 00.00.03 D06 - Validation Report
108 of 128
©SESAR JOINT UNDERTAKING, 2011. Created by AVINOR for the SESAR Joint Undertaking within the frame of the SESAR
Programme co-financed by the EU and EUROCONTROL. Reprint with approval of publisher and the source properly acknowledged.
In conclusion, UPR FPLs may save time compared to non UPR FPLs with Emirates UPR FPLs showing the most time efficient routes. It is interesting to note that these UPR FPLs do not save the most distance.
6.2.3.1.1.1.3 Fuel Saving
The fuel burn and fuel burn per mile metrics were assessed to complete the efficiency analysis and determine any relationships between these metrics and the previous time and distance metrics. Figure 41 shows the fuel percentage saving when comparing UPR and non UPR FPLs. The percentage savings are calculated based on the total FPL fuel. This is especially important when considering fuel burn, as a key point to the concept is to reduce the amount of fuel required to execute the FPL hence taking full advantage of more efficient routes. Reducing amount of fuel loaded on the aircraft as a result of the UPR FPL should result in less fuel burnt throughout the entire flight.
As shown by the orange markers, Emirates experienced a mean fuel saving of 0.21%, Iceland Air experienced mean savings of 0.11% and SAS had mean savings of 0.17%. For both SAS and Iceland Air, some flights did not save fuel as a result of the UPR concept. However, on average both airlines showed a small benefit in terms of reduced fuel burn. It should be considered that the data from Emirates only consists of four flights whereas the data from Iceland Air and SAS consisted of 42 and 28 flights respectively.
The lack of data means Emirates would only have covered limited conditions hence detailed conclusions cannot be drawn from such a small dataset but one could speculatively note that Emirates made more use of the flexibility of this concept than the other airlines by using intermediate waypoints. SAS were restricted by only looking at using DCT routings from start to end. While Iceland Air designed UPR FPLs before the trial which could mean there were better alternative UPR FPLs that could have been designed on a day by day basis.
A key part of this concept was to provide flexibility to the AUs so the savings presented below may not show the full potential of the concept if this flexibility was not fully utilised. However it is understood a live trial environment will have certain restrictions to enable safe conduct of the trial within the current operational environment.
Figure 41: Fuel Saving Percentage Comparing UPR and Non UPR FPLs for Each Airline (Emirates, n=4; Iceland Air, n=42; SAS, n=28)
Another aspect to consider is the differences in the scenarios. The Emirates flights remain in a cruise phase throughout the exercise area where fuel burn per mile will be low. Both Iceland Air and SAS
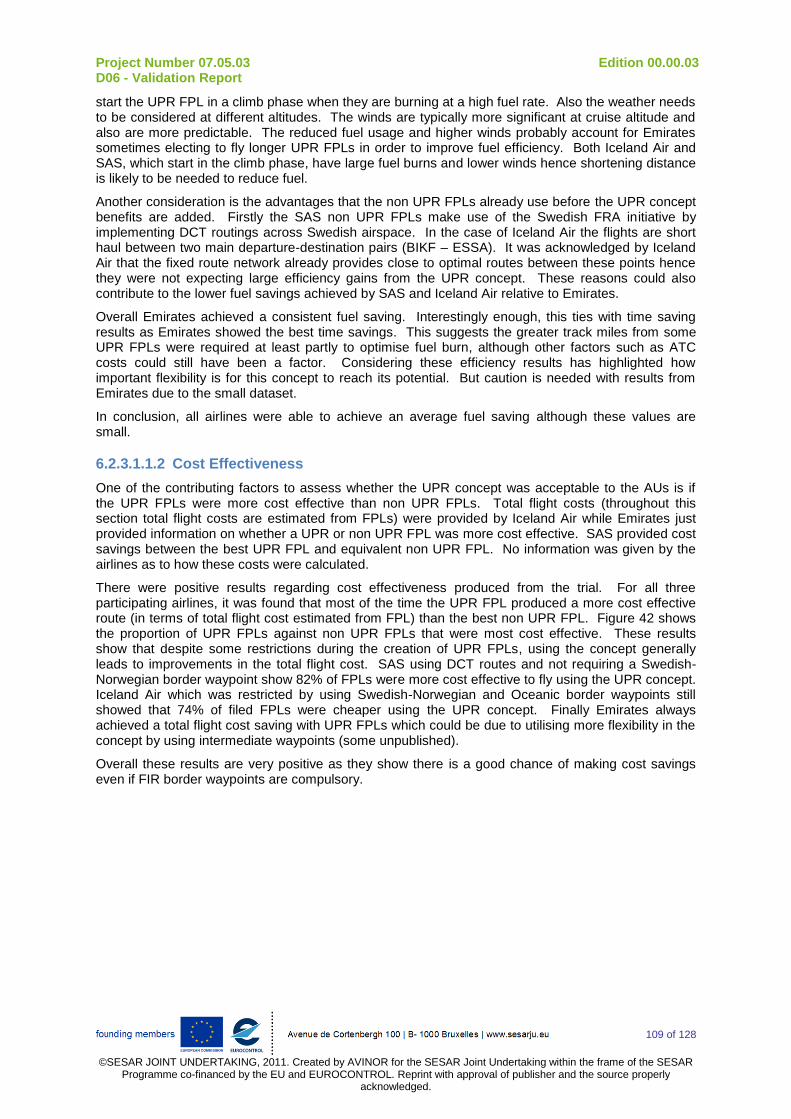
Project Number 07.05.03 Edition 00.00.03 D06 - Validation Report
109 of 128
©SESAR JOINT UNDERTAKING, 2011. Created by AVINOR for the SESAR Joint Undertaking within the frame of the SESAR
Programme co-financed by the EU and EUROCONTROL. Reprint with approval of publisher and the source properly acknowledged.
start the UPR FPL in a climb phase when they are burning at a high fuel rate. Also the weather needs to be considered at different altitudes. The winds are typically more significant at cruise altitude and also are more predictable. The reduced fuel usage and higher winds probably account for Emirates sometimes electing to fly longer UPR FPLs in order to improve fuel efficiency. Both Iceland Air and SAS, which start in the climb phase, have large fuel burns and lower winds hence shortening distance is likely to be needed to reduce fuel.
Another consideration is the advantages that the non UPR FPLs already use before the UPR concept benefits are added. Firstly the SAS non UPR FPLs make use of the Swedish FRA initiative by implementing DCT routings across Swedish airspace. In the case of Iceland Air the flights are short haul between two main departure-destination pairs (BIKF – ESSA). It was acknowledged by Iceland Air that the fixed route network already provides close to optimal routes between these points hence they were not expecting large efficiency gains from the UPR concept. These reasons could also contribute to the lower fuel savings achieved by SAS and Iceland Air relative to Emirates.
Overall Emirates achieved a consistent fuel saving. Interestingly enough, this ties with time saving results as Emirates showed the best time savings. This suggests the greater track miles from some UPR FPLs were required at least partly to optimise fuel burn, although other factors such as ATC costs could still have been a factor. Considering these efficiency results has highlighted how important flexibility is for this concept to reach its potential. But caution is needed with results from Emirates due to the small dataset.
In conclusion, all airlines were able to achieve an average fuel saving although these values are small.
6.2.3.1.1.2 Cost Effectiveness
One of the contributing factors to assess whether the UPR concept was acceptable to the AUs is if the UPR FPLs were more cost effective than non UPR FPLs. Total flight costs (throughout this section total flight costs are estimated from FPLs) were provided by Iceland Air while Emirates just provided information on whether a UPR or non UPR FPL was more cost effective. SAS provided cost savings between the best UPR FPL and equivalent non UPR FPL. No information was given by the airlines as to how these costs were calculated.
There were positive results regarding cost effectiveness produced from the trial. For all three participating airlines, it was found that most of the time the UPR FPL produced a more cost effective route (in terms of total flight cost estimated from FPL) than the best non UPR FPL. Figure 42 shows the proportion of UPR FPLs against non UPR FPLs that were most cost effective. These results show that despite some restrictions during the creation of UPR FPLs, using the concept generally leads to improvements in the total flight cost. SAS using DCT routes and not requiring a Swedish-Norwegian border waypoint show 82% of FPLs were more cost effective to fly using the UPR concept. Iceland Air which was restricted by using Swedish-Norwegian and Oceanic border waypoints still showed that 74% of filed FPLs were cheaper using the UPR concept. Finally Emirates always achieved a total flight cost saving with UPR FPLs which could be due to utilising more flexibility in the concept by using intermediate waypoints (some unpublished).
Overall these results are very positive as they show there is a good chance of making cost savings even if FIR border waypoints are compulsory.
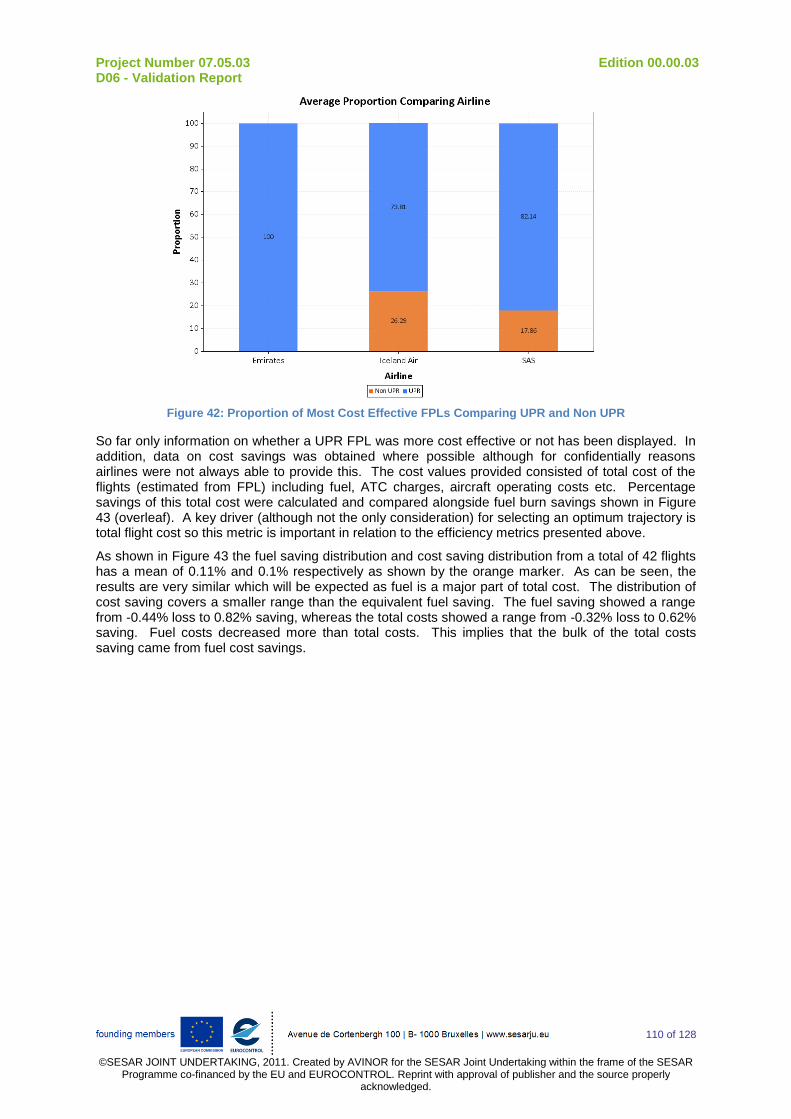
Project Number 07.05.03 Edition 00.00.03 D06 - Validation Report
110 of 128
©SESAR JOINT UNDERTAKING, 2011. Created by AVINOR for the SESAR Joint Undertaking within the frame of the SESAR
Programme co-financed by the EU and EUROCONTROL. Reprint with approval of publisher and the source properly acknowledged.
Figure 42: Proportion of Most Cost Effective FPLs Comparing UPR and Non UPR
So far only information on whether a UPR FPL was more cost effective or not has been displayed. In addition, data on cost savings was obtained where possible although for confidentially reasons airlines were not always able to provide this. The cost values provided consisted of total cost of the flights (estimated from FPL) including fuel, ATC charges, aircraft operating costs etc. Percentage savings of this total cost were calculated and compared alongside fuel burn savings shown in Figure 43 (overleaf). A key driver (although not the only consideration) for selecting an optimum trajectory is total flight cost so this metric is important in relation to the efficiency metrics presented above.
As shown in Figure 43 the fuel saving distribution and cost saving distribution from a total of 42 flights has a mean of 0.11% and 0.1% respectively as shown by the orange marker. As can be seen, the results are very similar which will be expected as fuel is a major part of total cost. The distribution of cost saving covers a smaller range than the equivalent fuel saving. The fuel saving showed a range from -0.44% loss to 0.82% saving, whereas the total costs showed a range from -0.32% loss to 0.62% saving. Fuel costs decreased more than total costs. This implies that the bulk of the total costs saving came from fuel cost savings.
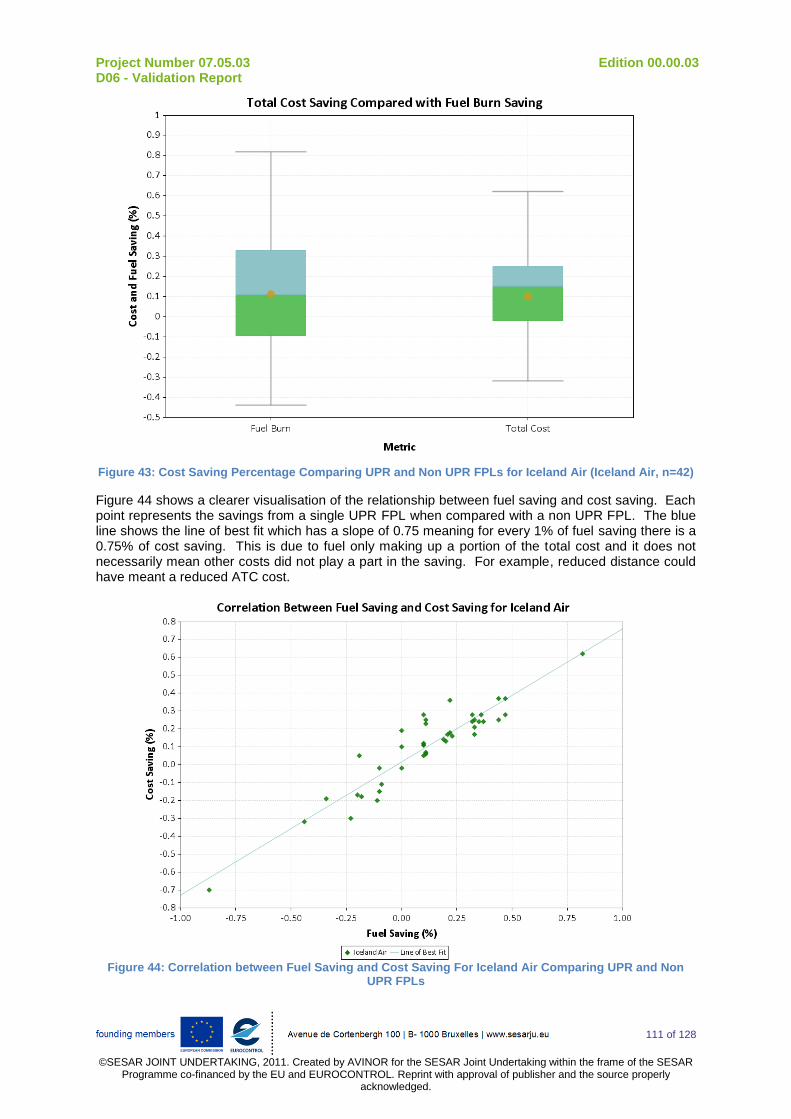
Project Number 07.05.03 Edition 00.00.03 D06 - Validation Report
111 of 128
©SESAR JOINT UNDERTAKING, 2011. Created by AVINOR for the SESAR Joint Undertaking within the frame of the SESAR
Programme co-financed by the EU and EUROCONTROL. Reprint with approval of publisher and the source properly acknowledged.
Figure 43: Cost Saving Percentage Comparing UPR and Non UPR FPLs for Iceland Air (Iceland Air, n=42)
Figure 44 shows a clearer visualisation of the relationship between fuel saving and cost saving. Each point represents the savings from a single UPR FPL when compared with a non UPR FPL. The blue line shows the line of best fit which has a slope of 0.75 meaning for every 1% of fuel saving there is a 0.75% of cost saving. This is due to fuel only making up a portion of the total cost and it does not necessarily mean other costs did not play a part in the saving. For example, reduced distance could have meant a reduced ATC cost.
Figure 44: Correlation between Fuel Saving and Cost Saving For Iceland Air Comparing UPR and Non
UPR FPLs
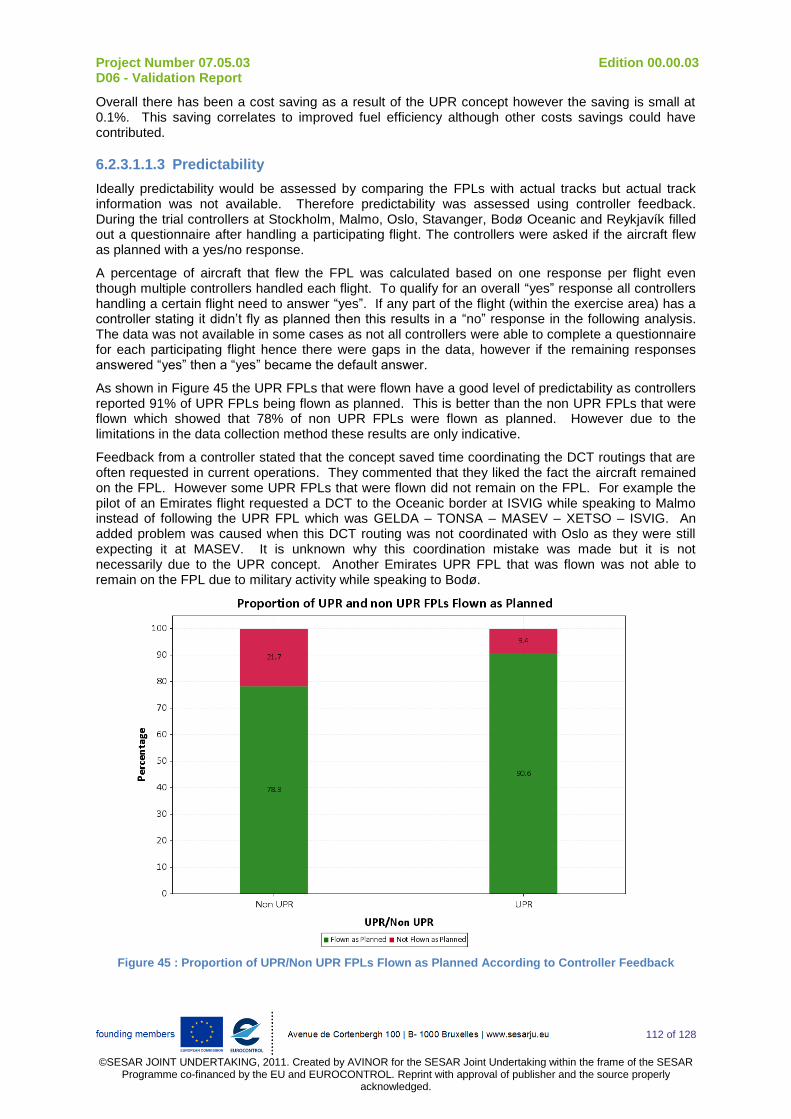
Project Number 07.05.03 Edition 00.00.03 D06 - Validation Report
112 of 128
©SESAR JOINT UNDERTAKING, 2011. Created by AVINOR for the SESAR Joint Undertaking within the frame of the SESAR
Programme co-financed by the EU and EUROCONTROL. Reprint with approval of publisher and the source properly acknowledged.
Overall there has been a cost saving as a result of the UPR concept however the saving is small at 0.1%. This saving correlates to improved fuel efficiency although other costs savings could have contributed.
6.2.3.1.1.3 Predictability
Ideally predictability would be assessed by comparing the FPLs with actual tracks but actual track information was not available. Therefore predictability was assessed using controller feedback. During the trial controllers at Stockholm, Malmo, Oslo, Stavanger, Bodø Oceanic and Reykjavík filled out a questionnaire after handling a participating flight. The controllers were asked if the aircraft flew as planned with a yes/no response.
A percentage of aircraft that flew the FPL was calculated based on one response per flight even though multiple controllers handled each flight. To qualify for an overall “yes” response all controllers handling a certain flight need to answer “yes”. If any part of the flight (within the exercise area) has a controller stating it didn’t fly as planned then this results in a “no” response in the following analysis. The data was not available in some cases as not all controllers were able to complete a questionnaire for each participating flight hence there were gaps in the data, however if the remaining responses answered “yes” then a “yes” became the default answer.
As shown in Figure 45 the UPR FPLs that were flown have a good level of predictability as controllers reported 91% of UPR FPLs being flown as planned. This is better than the non UPR FPLs that were flown which showed that 78% of non UPR FPLs were flown as planned. However due to the limitations in the data collection method these results are only indicative.
Feedback from a controller stated that the concept saved time coordinating the DCT routings that are often requested in current operations. They commented that they liked the fact the aircraft remained on the FPL. However some UPR FPLs that were flown did not remain on the FPL. For example the pilot of an Emirates flight requested a DCT to the Oceanic border at ISVIG while speaking to Malmo instead of following the UPR FPL which was GELDA – TONSA – MASEV – XETSO – ISVIG. An added problem was caused when this DCT routing was not coordinated with Oslo as they were still expecting it at MASEV. It is unknown why this coordination mistake was made but it is not necessarily due to the UPR concept. Another Emirates UPR FPL that was flown was not able to remain on the FPL due to military activity while speaking to Bodø.
Figure 45 : Proportion of UPR/Non UPR FPLs Flown as Planned According to Controller Feedback
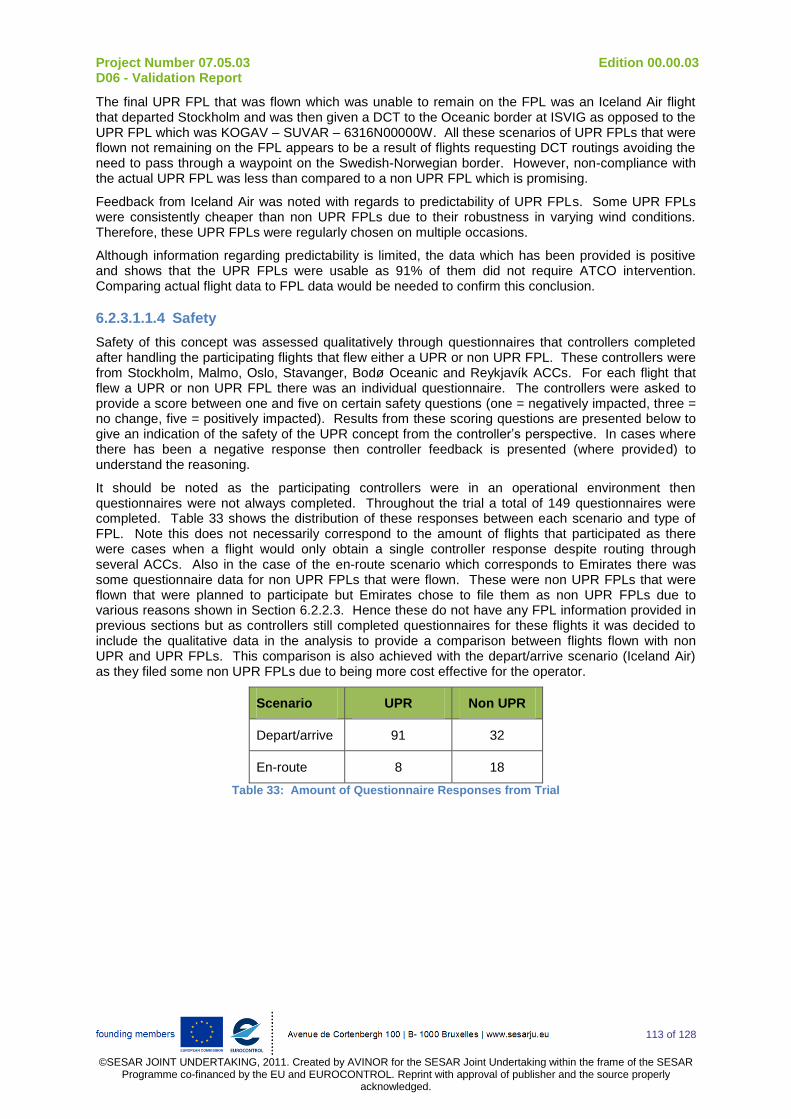
Project Number 07.05.03 Edition 00.00.03 D06 - Validation Report
113 of 128
©SESAR JOINT UNDERTAKING, 2011. Created by AVINOR for the SESAR Joint Undertaking within the frame of the SESAR
Programme co-financed by the EU and EUROCONTROL. Reprint with approval of publisher and the source properly acknowledged.
The final UPR FPL that was flown which was unable to remain on the FPL was an Iceland Air flight that departed Stockholm and was then given a DCT to the Oceanic border at ISVIG as opposed to the UPR FPL which was KOGAV – SUVAR – 6316N00000W. All these scenarios of UPR FPLs that were flown not remaining on the FPL appears to be a result of flights requesting DCT routings avoiding the need to pass through a waypoint on the Swedish-Norwegian border. However, non-compliance with the actual UPR FPL was less than compared to a non UPR FPL which is promising.
Feedback from Iceland Air was noted with regards to predictability of UPR FPLs. Some UPR FPLs were consistently cheaper than non UPR FPLs due to their robustness in varying wind conditions. Therefore, these UPR FPLs were regularly chosen on multiple occasions.
Although information regarding predictability is limited, the data which has been provided is positive and shows that the UPR FPLs were usable as 91% of them did not require ATCO intervention. Comparing actual flight data to FPL data would be needed to confirm this conclusion.
6.2.3.1.1.4 Safety
Safety of this concept was assessed qualitatively through questionnaires that controllers completed after handling the participating flights that flew either a UPR or non UPR FPL. These controllers were from Stockholm, Malmo, Oslo, Stavanger, Bodø Oceanic and Reykjavík ACCs. For each flight that flew a UPR or non UPR FPL there was an individual questionnaire. The controllers were asked to provide a score between one and five on certain safety questions (one = negatively impacted, three = no change, five = positively impacted). Results from these scoring questions are presented below to give an indication of the safety of the UPR concept from the controller’s perspective. In cases where there has been a negative response then controller feedback is presented (where provided) to understand the reasoning.
It should be noted as the participating controllers were in an operational environment then questionnaires were not always completed. Throughout the trial a total of 149 questionnaires were completed. Table 33 shows the distribution of these responses between each scenario and type of FPL. Note this does not necessarily correspond to the amount of flights that participated as there were cases when a flight would only obtain a single controller response despite routing through several ACCs. Also in the case of the en-route scenario which corresponds to Emirates there was some questionnaire data for non UPR FPLs that were flown. These were non UPR FPLs that were flown that were planned to participate but Emirates chose to file them as non UPR FPLs due to various reasons shown in Section 6.2.2.3. Hence these do not have any FPL information provided in previous sections but as controllers still completed questionnaires for these flights it was decided to include the qualitative data in the analysis to provide a comparison between flights flown with non UPR and UPR FPLs. This comparison is also achieved with the depart/arrive scenario (Iceland Air) as they filed some non UPR FPLs due to being more cost effective for the operator.
Scenario UPR Non UPR
Depart/arrive 91 32
En-route 8 18
Table 33: Amount of Questionnaire Responses from Trial
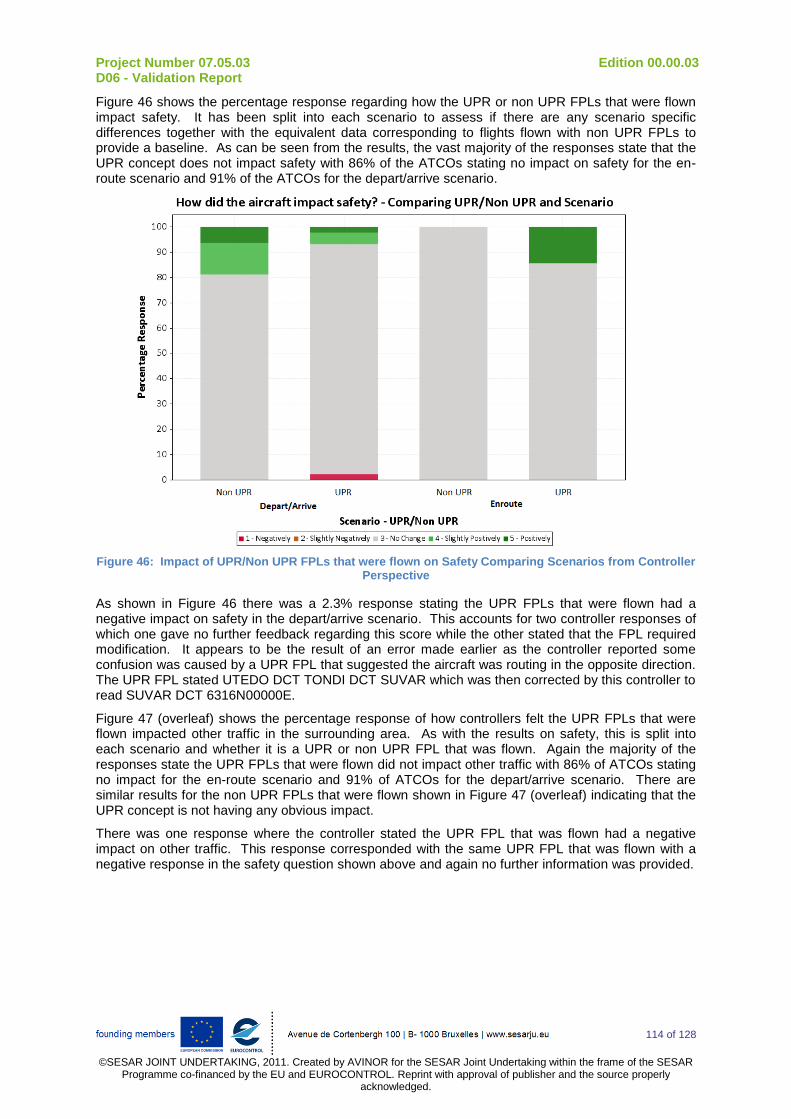
Project Number 07.05.03 Edition 00.00.03 D06 - Validation Report
114 of 128
©SESAR JOINT UNDERTAKING, 2011. Created by AVINOR for the SESAR Joint Undertaking within the frame of the SESAR
Programme co-financed by the EU and EUROCONTROL. Reprint with approval of publisher and the source properly acknowledged.
Figure 46 shows the percentage response regarding how the UPR or non UPR FPLs that were flown impact safety. It has been split into each scenario to assess if there are any scenario specific differences together with the equivalent data corresponding to flights flown with non UPR FPLs to provide a baseline. As can be seen from the results, the vast majority of the responses state that the UPR concept does not impact safety with 86% of the ATCOs stating no impact on safety for the en-route scenario and 91% of the ATCOs for the depart/arrive scenario.
Figure 46: Impact of UPR/Non UPR FPLs that were flown on Safety Comparing Scenarios from Controller Perspective
As shown in Figure 46 there was a 2.3% response stating the UPR FPLs that were flown had a negative impact on safety in the depart/arrive scenario. This accounts for two controller responses of which one gave no further feedback regarding this score while the other stated that the FPL required modification. It appears to be the result of an error made earlier as the controller reported some confusion was caused by a UPR FPL that suggested the aircraft was routing in the opposite direction. The UPR FPL stated UTEDO DCT TONDI DCT SUVAR which was then corrected by this controller to read SUVAR DCT 6316N00000E.
Figure 47 (overleaf) shows the percentage response of how controllers felt the UPR FPLs that were flown impacted other traffic in the surrounding area. As with the results on safety, this is split into each scenario and whether it is a UPR or non UPR FPL that was flown. Again the majority of the responses state the UPR FPLs that were flown did not impact other traffic with 86% of ATCOs stating no impact for the en-route scenario and 91% of ATCOs for the depart/arrive scenario. There are similar results for the non UPR FPLs that were flown shown in Figure 47 (overleaf) indicating that the UPR concept is not having any obvious impact.
There was one response where the controller stated the UPR FPL that was flown had a negative impact on other traffic. This response corresponded with the same UPR FPL that was flown with a negative response in the safety question shown above and again no further information was provided.
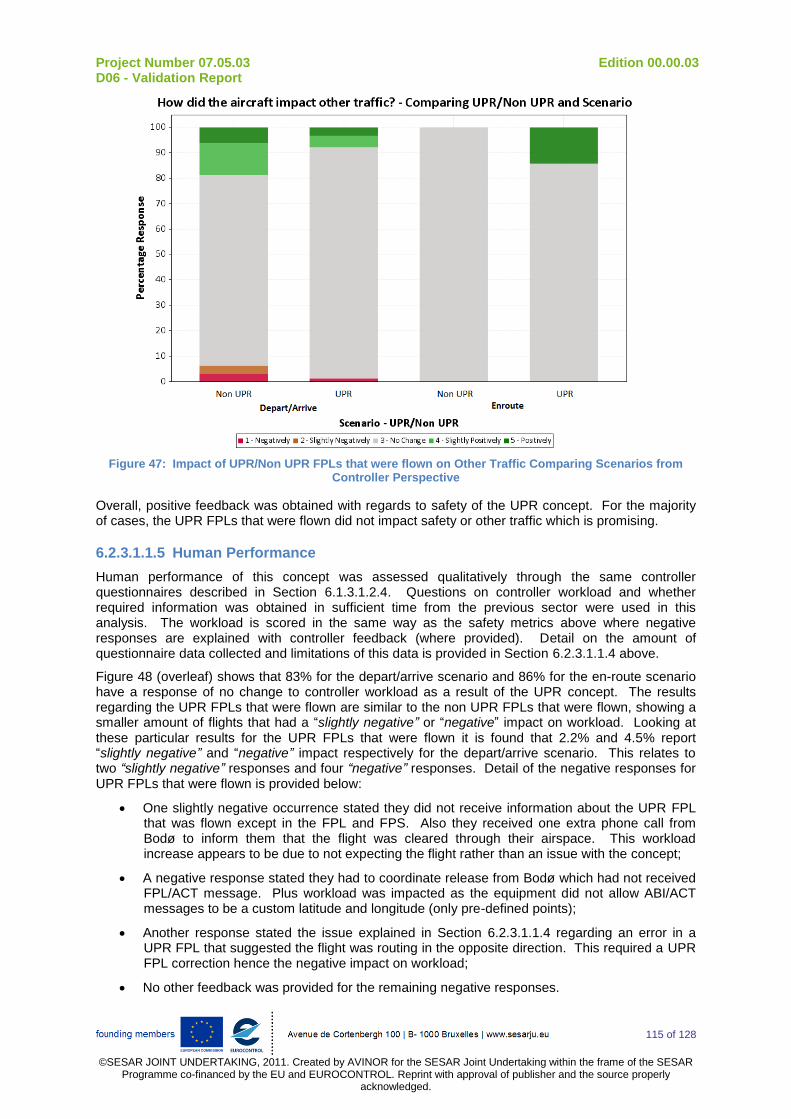
Project Number 07.05.03 Edition 00.00.03 D06 - Validation Report
115 of 128
©SESAR JOINT UNDERTAKING, 2011. Created by AVINOR for the SESAR Joint Undertaking within the frame of the SESAR
Programme co-financed by the EU and EUROCONTROL. Reprint with approval of publisher and the source properly acknowledged.
Figure 47: Impact of UPR/Non UPR FPLs that were flown on Other Traffic Comparing Scenarios from Controller Perspective
Overall, positive feedback was obtained with regards to safety of the UPR concept. For the majority of cases, the UPR FPLs that were flown did not impact safety or other traffic which is promising.
6.2.3.1.1.5 Human Performance
Human performance of this concept was assessed qualitatively through the same controller questionnaires described in Section 6.1.3.1.2.4. Questions on controller workload and whether required information was obtained in sufficient time from the previous sector were used in this analysis. The workload is scored in the same way as the safety metrics above where negative responses are explained with controller feedback (where provided). Detail on the amount of questionnaire data collected and limitations of this data is provided in Section 6.2.3.1.1.4 above.
Figure 48 (overleaf) shows that 83% for the depart/arrive scenario and 86% for the en-route scenario have a response of no change to controller workload as a result of the UPR concept. The results regarding the UPR FPLs that were flown are similar to the non UPR FPLs that were flown, showing a smaller amount of flights that had a “slightly negative” or “negative” impact on workload. Looking at these particular results for the UPR FPLs that were flown it is found that 2.2% and 4.5% report “slightly negative” and “negative” impact respectively for the depart/arrive scenario. This relates to two “slightly negative” responses and four “negative” responses. Detail of the negative responses for UPR FPLs that were flown is provided below:
One slightly negative occurrence stated they did not receive information about the UPR FPL that was flown except in the FPL and FPS. Also they received one extra phone call from Bodø to inform them that the flight was cleared through their airspace. This workload increase appears to be due to not expecting the flight rather than an issue with the concept;
A negative response stated they had to coordinate release from Bodø which had not received FPL/ACT message. Plus workload was impacted as the equipment did not allow ABI/ACT messages to be a custom latitude and longitude (only pre-defined points);
Another response stated the issue explained in Section 6.2.3.1.1.4 regarding an error in a UPR FPL that suggested the flight was routing in the opposite direction. This required a UPR FPL correction hence the negative impact on workload;
No other feedback was provided for the remaining negative responses.
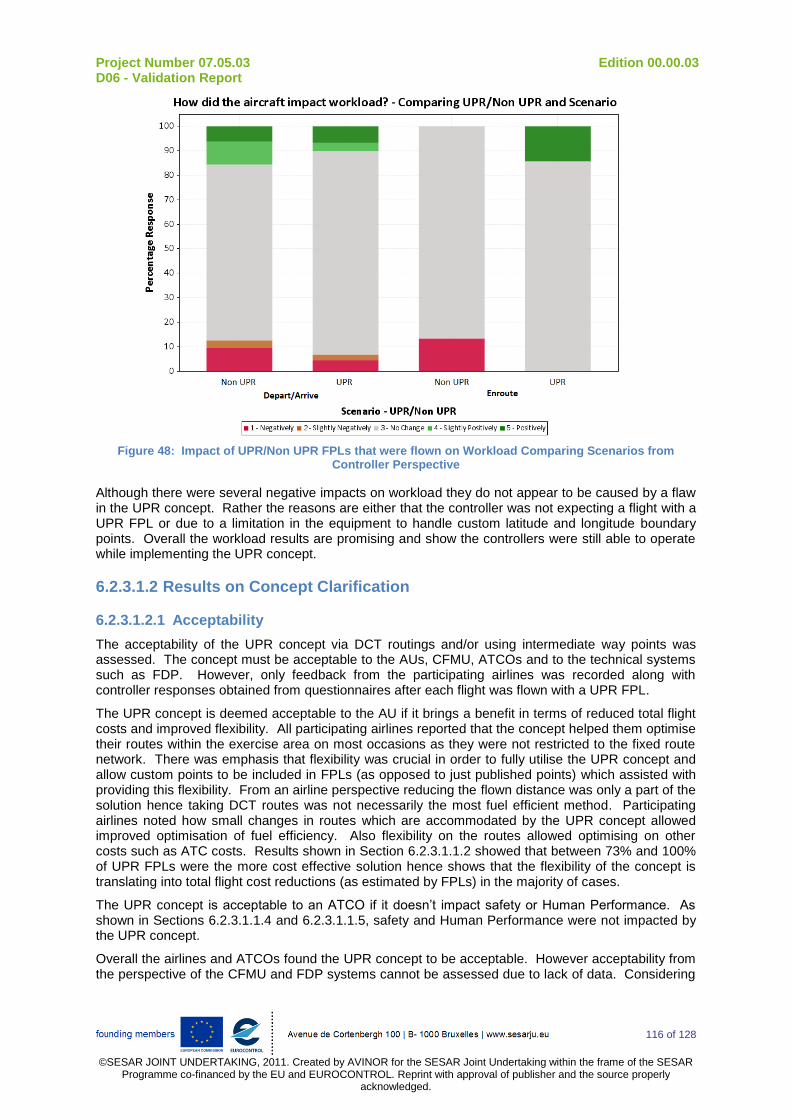
Project Number 07.05.03 Edition 00.00.03 D06 - Validation Report
116 of 128
©SESAR JOINT UNDERTAKING, 2011. Created by AVINOR for the SESAR Joint Undertaking within the frame of the SESAR
Programme co-financed by the EU and EUROCONTROL. Reprint with approval of publisher and the source properly acknowledged.
Figure 48: Impact of UPR/Non UPR FPLs that were flown on Workload Comparing Scenarios from Controller Perspective
Although there were several negative impacts on workload they do not appear to be caused by a flaw in the UPR concept. Rather the reasons are either that the controller was not expecting a flight with a UPR FPL or due to a limitation in the equipment to handle custom latitude and longitude boundary points. Overall the workload results are promising and show the controllers were still able to operate while implementing the UPR concept.
6.2.3.1.2 Results on Concept Clarification
6.2.3.1.2.1 Acceptability
The acceptability of the UPR concept via DCT routings and/or using intermediate way points was assessed. The concept must be acceptable to the AUs, CFMU, ATCOs and to the technical systems such as FDP. However, only feedback from the participating airlines was recorded along with controller responses obtained from questionnaires after each flight was flown with a UPR FPL.
The UPR concept is deemed acceptable to the AU if it brings a benefit in terms of reduced total flight costs and improved flexibility. All participating airlines reported that the concept helped them optimise their routes within the exercise area on most occasions as they were not restricted to the fixed route network. There was emphasis that flexibility was crucial in order to fully utilise the UPR concept and allow custom points to be included in FPLs (as opposed to just published points) which assisted with providing this flexibility. From an airline perspective reducing the flown distance was only a part of the solution hence taking DCT routes was not necessarily the most fuel efficient method. Participating airlines noted how small changes in routes which are accommodated by the UPR concept allowed improved optimisation of fuel efficiency. Also flexibility on the routes allowed optimising on other costs such as ATC costs. Results shown in Section 6.2.3.1.1.2 showed that between 73% and 100% of UPR FPLs were the more cost effective solution hence shows that the flexibility of the concept is translating into total flight cost reductions (as estimated by FPLs) in the majority of cases.
The UPR concept is acceptable to an ATCO if it doesn’t impact safety or Human Performance. As shown in Sections 6.2.3.1.1.4 and 6.2.3.1.1.5, safety and Human Performance were not impacted by the UPR concept.
Overall the airlines and ATCOs found the UPR concept to be acceptable. However acceptability from the perspective of the CFMU and FDP systems cannot be assessed due to lack of data. Considering
Project Number 07.05.03 Edition 00.00.03 D06 - Validation Report
117 of 128
©SESAR JOINT UNDERTAKING, 2011. Created by AVINOR for the SESAR Joint Undertaking within the frame of the SESAR
Programme co-financed by the EU and EUROCONTROL. Reprint with approval of publisher and the source properly acknowledged.
acceptability of technical systems is important for this concept to work as such systems need to be able to sufficiently support the ATCOs in delivering a safe ATS.
6.2.3.1.2.2 Operational Feasibility
The UPR concept was deemed to be operationally feasible if the ATCO and AUs reported that:
It was possible to use the concept and system (technically and operationally);
The UPR concept was acceptable to the ATCO and AUs;
The use of the UPR concept did not have a negative impact on safety.
In the trial, data regarding the feasibility of the concept was obtained via subjective responses in the ATCO questionnaires. Specific feedback was obtained on the number of UPR FPLs flown as planned, and any operational issues noted by ATCOs regarding coordination and technical problems. Since SAS did not fly the UPR FPLs, no information was obtained on the feasibility of routing DCT without a published Swedish-Norwegian border waypoint.
As described in Section 6.2.2.2.2 there were various methods and restrictions used to create UPR FPLs. All participating airlines were able to create UPR FPLs (within those restrictions) which were optimised as required (i.e. fuel burn, distance).
The method employed by SAS for creating UPR FPLs was quite restrictive. Firstly the Oceanic border waypoint is determined by the best non UPR FPL. It is possible that an improved overall FPL optimisation could be achieved by modifying the exit point due to the flexibility provided by the concept. However this was not done under trial conditions to provide a fair comparison by keeping the portion of the FPL that does not utilise the concept (i.e. after the Oceanic border) the same. More importantly the main restriction for designing UPR FPLs was the fact they were DCT routings only hence did not implement the full flexibility of the UPR concept by using intermediate waypoints. But SAS was able to ignore the need for a Swedish-Norwegian border waypoint.
Both Iceland Air and Emirates were restricted to using published Swedish-Norwegian border waypoints. Even with this restriction Iceland Air were still able to produce optimised UPR FPLs despite the fact that the route network for short distances between main departure-destination pairs (such as between BIKF and ESSA) is already designed to provide optimal route options. However these optimisation gains are small.
Using the fixed route network provides a limited number of flight planning options, then in addition using FRA DCT routings provides some more options. But by using intermediate (including unpublished) points provides a huge gain in flexibility to optimise the UPR FPLs. This extra flexibility was only used by Emirates but was shown to work to enable the airline to optimise their UPR FPLs.
Based on limited information on technical systems the participating airlines did not have any known problems with submitting UPR FPLs. Also feedback from a controller at Stavanger ACC stated their equipment was not able to send ABI/ACT messages for latitudes and longitudes (only pre-defined points) hence their workload increased in this situation which could impact safety if it caused too much distraction. Consequently, a comment was made stating that they would envisage an impact on capacity if such technical issues were not resolved.
Some flights flown with a UPR FPL incurred coordination issues as some of the downwind sectors did not receive any information regarding these flights. Out of questionnaire responses to flights flown with UPR FPLs, 74% of the 87 ATCO responses said they received sufficient information from the previous sector, 13% did not and 13% did not respond (discounting all the blank responses from the ATCOs in the first sector of the exercise area). These coordination issues are potentially an operational concern however further detail of why such issues occurred is not known.
Results showed that more FPLs were flown as planned when implementing the UPR concept. 91% of UPR FPLs were flown as planned compared to 78% of non UPR FPLs. Out of the UPR FPLs that were not flown as planned, they were either flown DCT to the Oceanic border (in the case of one Emirates and one Iceland Air flight) or re-routed to avoid military activity (an Emirates flight). More details on the nature of FPL deviations are provided in Section 6.2.3.1.1.3.
Results for Acceptability and Safety are given in Sections 6.2.3.1.2.1 and 6.2.3.1.1.4 and show that the UPR concept is deemed acceptable and safe by both AUs and ATCOs.

Project Number 07.05.03 Edition 00.00.03 D06 - Validation Report
118 of 128
©SESAR JOINT UNDERTAKING, 2011. Created by AVINOR for the SESAR Joint Undertaking within the frame of the SESAR
Programme co-financed by the EU and EUROCONTROL. Reprint with approval of publisher and the source properly acknowledged.
Other than the issues described above, no other negative feedback was recorded which suggests that the majority of controllers felt the UPR concept was operationally feasible and suggests it would be suited in a low complexity and low traffic environment.
6.2.3.1.3 Results impacting regulation and standardisation initiatives
N/A

6.2.3.2 Analysis of Exercise Results
Validation Objective ID
Validation Objective Title
Success Criterion Exercise Results Validation Objective
Analysis Status per Exercise
OBJ-07.05.03-VALP-A002.0020
Assess if the concept of UPR is operationally feasible during different times of day and conditions.
Results indicate that ATS can be safely and acceptably provided to the airspace when users implement the UPR concept during any time of day and during varying traffic complexities.
Airlines were able to create and file UPR FPLs that met their optimisation requirements.
Although there were some coordination issues, 74% of ATCOs said that they received sufficient information from the previous sector regarding the UPR FPL that was flown.
Results showed that 91% of UPR FPLs were flown as planned compared to 78% of non UPR FPLs.
ATCOs and AUs found the UPR concept to be acceptance and safe.
No feedback was obtained from SAS as they did not fly the UPR FPLs so did not complete any questionnaires regarding feasibility. More information is needed in order to assess the feasibility of the UPR FPLs via DCT routings without a published Swedish-Norwegian border waypoint.
OK
OBJ-07.05.03-VALP-A005.0050
Assess if there is any difference in the level of fuel use between aircraft flying on a fixed ATS route and aircraft flying on a UPR FPL.
Results indicate fuel savings when aircraft implement the UPR concept. In terms of: - kg of fuel used per flight; - average fuel burn per flight; - compared to the standard FPL reference trajectory.
The average fuel saving per UPR FPL was between +0.11% and +0.21% compared to non UPR FPLs.
Aircraft utilising a more flexible route and approach using intermediate points for flight planning can maximise fuel saving.
Fuel saving per mile is dependent on airline strategy and approach to implementing UPR FPLs.
OK

Project Number 07.05.03 Edition 00.00.03 D06 - Validation Report
120 of 128
©SESAR JOINT UNDERTAKING, 2011. Created by AVINOR for the SESAR Joint Undertaking within the frame of the SESAR Programme co-financed by the EU and EUROCONTROL. Reprint
with approval of publisher and the source properly acknowledged.
Validation Objective ID
Validation Objective Title
Success Criterion Exercise Results Validation Objective
Analysis Status per Exercise
OBJ-07.05.03-VALP-A006.0060
Assess if safety is impacted by the use of the UPR concept.
Demonstrate that Safety levels will not be adversely affected by implementing the UPR concept.
91% of ATCOs indicated that they felt the UPR concept would not impact safety or other traffic when considering the en-route scenario.
86% of ATCOs felt the UPR concept would not impact safety or other traffic when considering the departing/arriving scenario.
Results suggest the UPR concept may have a negative impact on controller workload if technical issues such as the ability to send ABI/ACT messages is not resolved.
OK
OBJ-07.05.03-VALP-A007.0070
Assess if there are any environmental impacts due to implementing the UPR concept, investigating the extent of any impacts.
Results indicate no negative impact on the environment, in terms of: - kg of CO2, NOx, H2O and Particulates; - Difference in emissions between fixed route FPL and UPR FPL; - Average fuel consumption per flight.
Results show the UPR concept produced a fuel saving in participating airlines hence emissions produced due to fuel burnt would therefore be reduced by a proportional amount.
UPR FPLs have the potential to use the flexibility provided by the UPR concept to (considering distance, wind, weather, ATC costs etc.) produce consistent fuel savings (as results from Emirates airline indicate).
However fuel savings are small with averages ranging from +0.11% and 0.21%.
OK
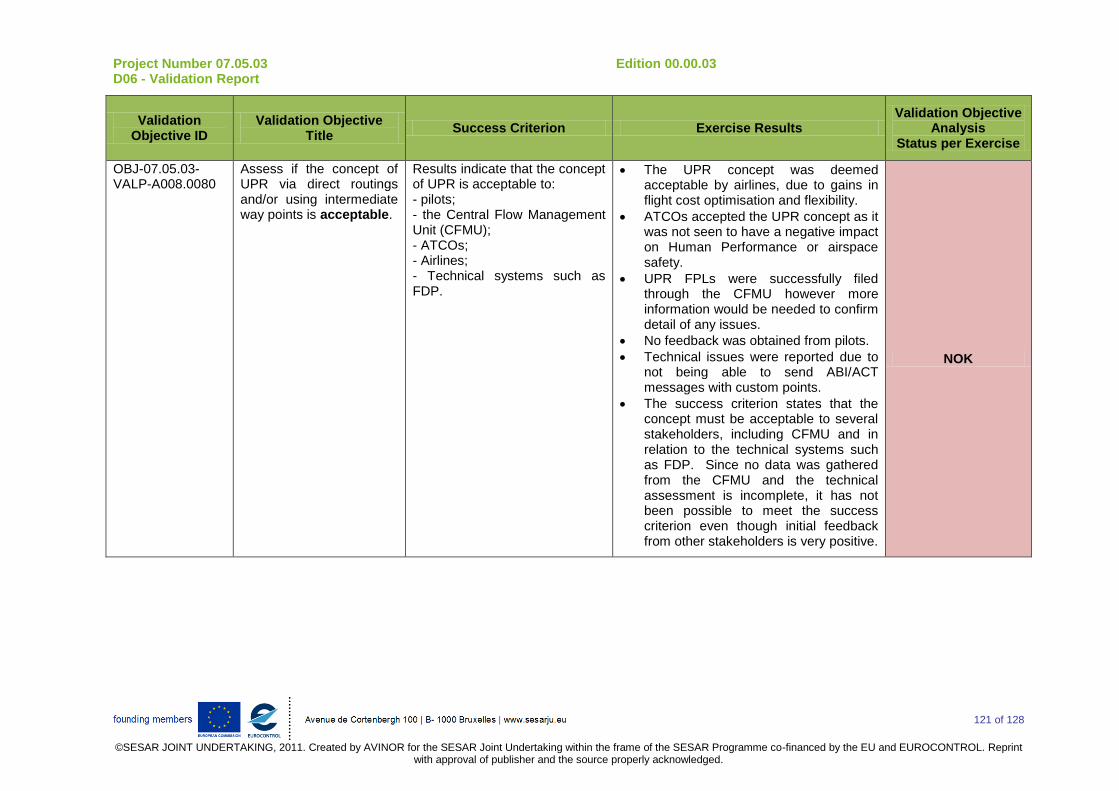
Project Number 07.05.03 Edition 00.00.03 D06 - Validation Report
121 of 128
©SESAR JOINT UNDERTAKING, 2011. Created by AVINOR for the SESAR Joint Undertaking within the frame of the SESAR Programme co-financed by the EU and EUROCONTROL. Reprint
with approval of publisher and the source properly acknowledged.
Validation Objective ID
Validation Objective Title
Success Criterion Exercise Results Validation Objective
Analysis Status per Exercise
OBJ-07.05.03-VALP-A008.0080
Assess if the concept of UPR via direct routings and/or using intermediate way points is acceptable.
Results indicate that the concept of UPR is acceptable to: - pilots; - the Central Flow Management Unit (CFMU); - ATCOs; - Airlines; - Technical systems such as FDP.
The UPR concept was deemed acceptable by airlines, due to gains in flight cost optimisation and flexibility.
ATCOs accepted the UPR concept as it was not seen to have a negative impact on Human Performance or airspace safety.
UPR FPLs were successfully filed through the CFMU however more information would be needed to confirm detail of any issues.
No feedback was obtained from pilots.
Technical issues were reported due to not being able to send ABI/ACT messages with custom points.
The success criterion states that the concept must be acceptable to several stakeholders, including CFMU and in relation to the technical systems such as FDP. Since no data was gathered from the CFMU and the technical assessment is incomplete, it has not been possible to meet the success criterion even though initial feedback from other stakeholders is very positive.
NOK
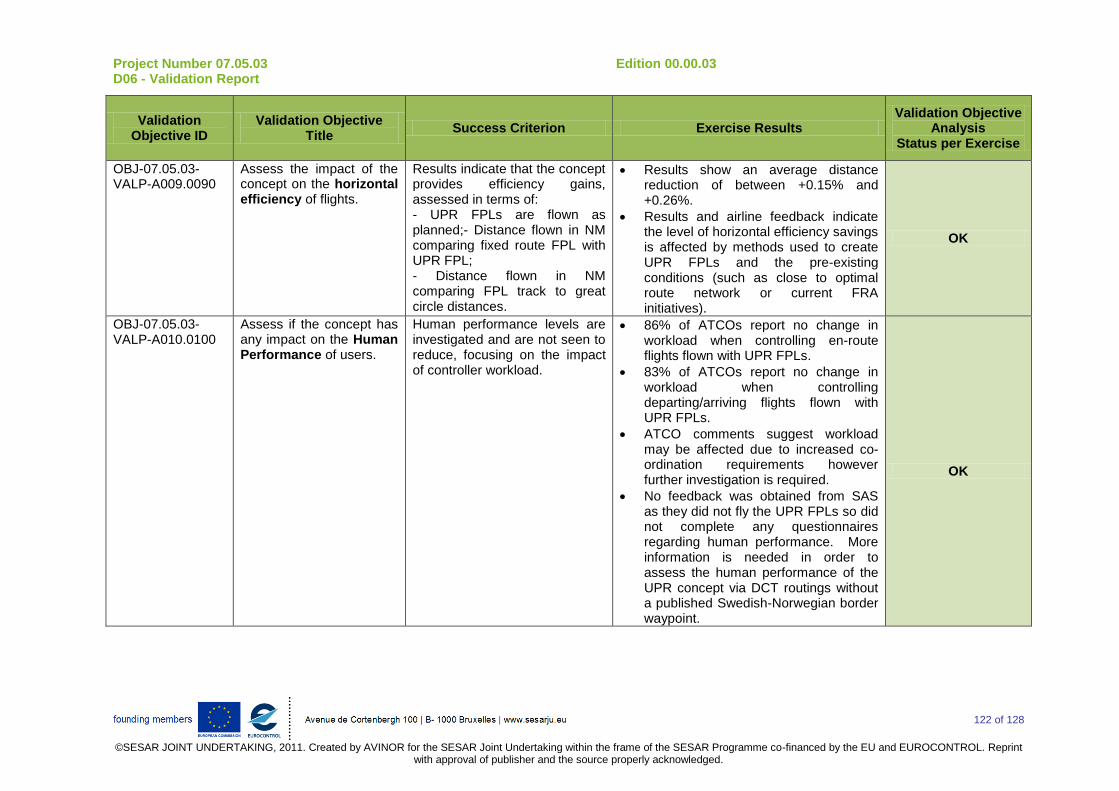
Project Number 07.05.03 Edition 00.00.03 D06 - Validation Report
122 of 128
©SESAR JOINT UNDERTAKING, 2011. Created by AVINOR for the SESAR Joint Undertaking within the frame of the SESAR Programme co-financed by the EU and EUROCONTROL. Reprint
with approval of publisher and the source properly acknowledged.
Validation Objective ID
Validation Objective Title
Success Criterion Exercise Results Validation Objective
Analysis Status per Exercise
OBJ-07.05.03-VALP-A009.0090
Assess the impact of the concept on the horizontal efficiency of flights.
Results indicate that the concept provides efficiency gains, assessed in terms of: - UPR FPLs are flown as planned;- Distance flown in NM comparing fixed route FPL with UPR FPL; - Distance flown in NM comparing FPL track to great circle distances.
Results show an average distance reduction of between +0.15% and +0.26%.
Results and airline feedback indicate the level of horizontal efficiency savings is affected by methods used to create UPR FPLs and the pre-existing conditions (such as close to optimal route network or current FRA initiatives).
OK
OBJ-07.05.03-VALP-A010.0100
Assess if the concept has any impact on the Human Performance of users.
Human performance levels are investigated and are not seen to reduce, focusing on the impact of controller workload.
86% of ATCOs report no change in workload when controlling en-route flights flown with UPR FPLs.
83% of ATCOs report no change in workload when controlling departing/arriving flights flown with UPR FPLs.
ATCO comments suggest workload may be affected due to increased co-ordination requirements however further investigation is required.
No feedback was obtained from SAS as they did not fly the UPR FPLs so did not complete any questionnaires regarding human performance. More information is needed in order to assess the human performance of the UPR concept via DCT routings without a published Swedish-Norwegian border waypoint.
OK
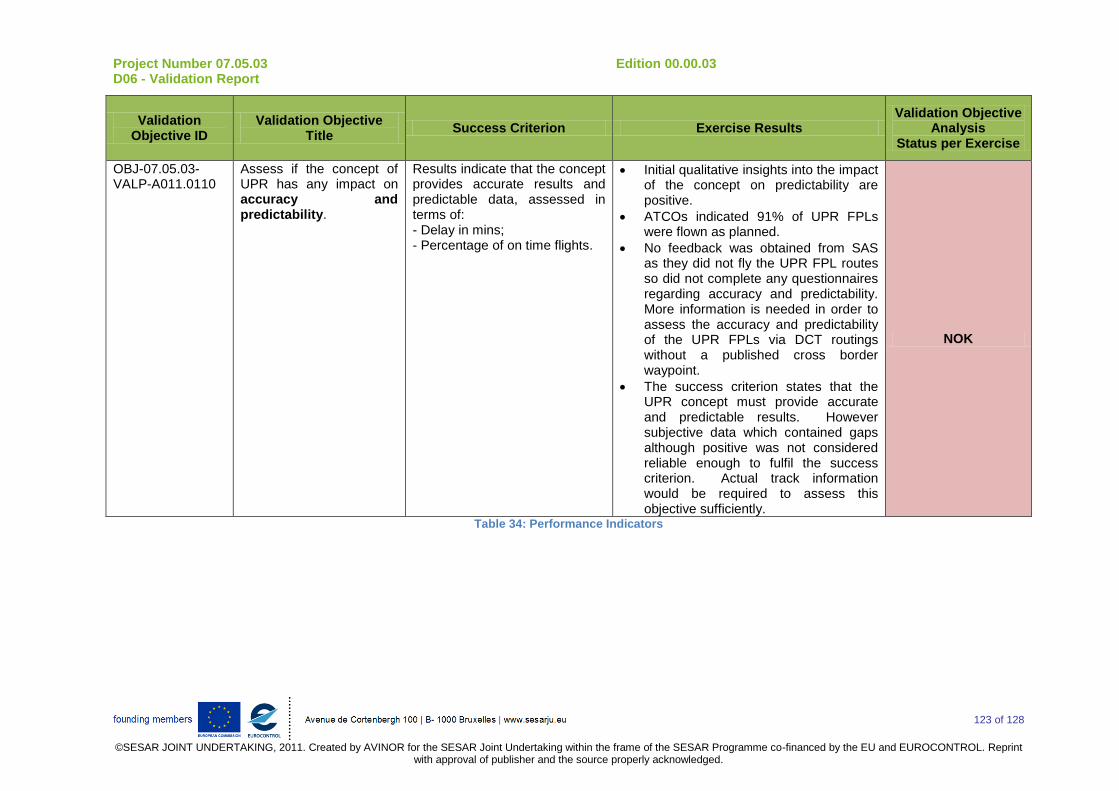
Project Number 07.05.03 Edition 00.00.03 D06 - Validation Report
123 of 128
©SESAR JOINT UNDERTAKING, 2011. Created by AVINOR for the SESAR Joint Undertaking within the frame of the SESAR Programme co-financed by the EU and EUROCONTROL. Reprint
with approval of publisher and the source properly acknowledged.
Validation Objective ID
Validation Objective Title
Success Criterion Exercise Results Validation Objective
Analysis Status per Exercise
OBJ-07.05.03-VALP-A011.0110
Assess if the concept of UPR has any impact on accuracy and predictability.
Results indicate that the concept provides accurate results and predictable data, assessed in terms of: - Delay in mins; - Percentage of on time flights.
Initial qualitative insights into the impact of the concept on predictability are positive.
ATCOs indicated 91% of UPR FPLs were flown as planned.
No feedback was obtained from SAS as they did not fly the UPR FPL routes so did not complete any questionnaires regarding accuracy and predictability. More information is needed in order to assess the accuracy and predictability of the UPR FPLs via DCT routings without a published cross border waypoint.
The success criterion states that the UPR concept must provide accurate and predictable results. However subjective data which contained gaps although positive was not considered reliable enough to fulfil the success criterion. Actual track information would be required to assess this objective sufficiently.
NOK
Table 34: Performance Indicators

6.2.3.2.1 Unexpected Behaviours/Results
Results have shown that DCTs are not always the most cost effective route. Although this result is not unusual it had not been expected or detailed within the VALP [6]. The dominant influences over flight efficiency require further investigation; however these results indicate that track mileage reduction is not always the most effective method to save fuel.
6.2.3.3 Confidence in Results of Validation Exercise
6.2.3.3.1 Quality of Validation Exercise Results
Several issues impacted the quality of the validation exercise results as detailed below:
1. Results from VP-465 were constrained due to this exercise being conducted in a live environment where variables could not be fixed. This makes comparison and repeatability difficult as well as statistical comparison irrelevant in many areas.
2. Airlines within VP-465 used different criteria to select routes. SAS only implemented DCT routes with no Swedish-Norwegian border waypoints. Iceland Air planned a mixture of DCT routes between SID/STAR and Swedish-Norwegian border waypoints. Emirates operated UPR FPLs based upon best business trajectory.
3. Only two of the three airlines operated flights that actually executed their UPR FPLs, this limits confidence in results regarding safety, human performance and predictability which relied on the UPR FPLs being executed.
4. Results for Emirates airlines operating under SCN-07.05.03-VALP-G001.0001 only included four flights, this reduce the representative and significance of these results.
5. The number of ATCOs who participated by filling in End of Shift questionnaires for this trial is unknown. Although 149 individual questionnaires were completed each questionnaire was anonymous and hence it is not possible to see if the responses come from one or multiple controllers.
6.2.3.3.2 Significance of Validation Exercise Results
Results related to predictability under Objective OBJ-07.05.03-VALP-A011.0110 were formed using a detailed qualitative assessment based on controller questionnaires. Although these results are important, the use of quantitative data based on radar measurements would provide more accurate results where confidence could be assessed.
The number of independent variables within VP-465 was high due to airlines implementing the UPR concept in different ways, flights taking place at different times of day, using different aircraft types and in varying weather conditions. This resulted in there being no possibility of performing a reliable statistically analysis of results to find causal effects. It has been highlighted as a recommendation that statistical analysis and increased sample sizes be used in subsequent trials.
6.2.4 Conclusions and Recommendations
6.2.4.1 Conclusions
Exercise VP-465 aimed to validate and assess the fundamental concept of UPR by means of a live trial in Northern European airspace. Of the eight objectives that were assessed within this trial six were adequately met their success criteria.
The concept gained a positive response in subjective feedback from both ATCOs and airlines. Controllers felt the UPR concept was operationally feasible in airspace with low traffic numbers and a reduced traffic complexity. The three airlines that took part in the trial were able to fly UPR FPLs as planned 91% of the time (the remaining 9% did not adhere to their UPR FPL as they requested DCT routing to the Oceanic border missing out the Swedish-Norwegian border point or were re-routed due to military activity). Results highlighted that the benefits UPR FPLs have compared to non UPR FPLs is dependent on how airlines implement the concept. The higher the level of flexibility introduced

Project Number 07.05.03 Edition 00.00.03 D06 - Validation Report
125 of 128
©SESAR JOINT UNDERTAKING, 2011. Created by AVINOR for the SESAR Joint Undertaking within the frame of the SESAR
Programme co-financed by the EU and EUROCONTROL. Reprint with approval of publisher and the source properly acknowledged.
into the UPR FPL the more successful the UPR concept is in gaining efficiency and producing savings. The concept is also highly sensitive to airline priorities and drivers. If airlines wish to pursue distance saving routes then DCTs will be implemented more often. This however may not yield maximum benefits in terms of cost or fuel savings. Results indicated that distance savings were not directly linked to fuel savings, with other elements such as wind effects or ATC costs resulting in DCT routes not always being the most cost efficient route possible from entry to exit point. Implementing a series of short DCTs between intermediate waypoints, adjusting each short DCT for wind etc. provides a better solution for maximising efficiency.
UPR FPLs were shown to lead to an average fuel saving for the entire FPL of between 0.11% and 0.21%. This saving was brought about by a combination of route choice and aircraft weight reduction (due to less fuel on board). Emirates used the full flexibility of the concept to reduce cost regardless of distance, which produced increased fuel savings compared to other airlines that primarily looked to reduce distance. Emirates also operated under scenario SCN-07.05.03-VALP-G001.0001 and hence all flights were in cruise throughout the exercise area where fuel burn rate is low and winds are more significant than at lower altitudes. This could account for Emirates sometimes selecting to flight plan longer distances in order to optimise on fuel burn. Whereas SAS and Iceland Air were in a climb phase initially where fuel burn rate would be high and winds lower hence why shortening distance would be important.
In line with the improvement in fuel efficiency theoretically calculated from FPL data, the use of UPR FPLs led to an average distance reduction of between 0.15% and 0.26%.
Use of the UPR FPLs proved to be the most cost effective solution for airlines with the UPR FPL being cheaper than the equivalent Non-UPR FPL between 73% (Iceland Air) and 100% (Emirates) of the time. Emirates, as discussed above, used greater flexibility while creating UPR FPLs and hence made adjustments to increase chances of achieving cost reductions. Cases where non UPR FPLs were more cost effective than UPR FPLs were due to where airlines had pre-selected UPR FPLs before the trial. Hence they did not take full advantage of the flexibility provided by the concept by optimising FPLs on a day by day basis.
Results from the trial were used to produce efficiency metrics. These metrics were compared to the OFA high level targets for WP7 Network Operations, as shown in Table 35 below.
Efficiency
SCN-07.05.03-VALP-G001.0001
SCN-07.05.03-VALP-H001.0001
SCN-07.05.03-VALP-J001.0001
OFA03.01.03
Emirates SAS Iceland Air OFA Target
Time efficiency 0.31% 0.16% 0.13% 0.10%
Cost effectiveness n/a n/a 0.10% 0.20%
Fuel efficiency 0.21% 0.17% 0.11% 0.20%
Distance saving 0.13% 0.26% n/a Table 35: Efficiency results for total FPLs within each scenario compared to OFA targets
Time efficiency targets were exceeded within every scenario by every airline within VP-465, with results from Emirates exceeding the OFA target of 0.1% by a factor of 3. Emirates approached the concept with a very flexible approach and hence were able to adapt the UPR FPLs to maximise efficiency compared to SAS and Iceland Air.
Fuel efficiency targets were only met by Emirates. The use of DCTs by SAS airlines was approaching OFA targets and Iceland Air need to double fuel efficiency performance before targets are met. The various approaches taken by these airlines contribute to these results; the routes SAS chose were DCT routings and the airline also did not have to use fixed crossing points across the Swedish-Norwegian border. Iceland Air created FPLs that were close to the great circle but were not very flexible to changes as UPR FPLs were fixed some time in advanced of actual flight. Also Iceland Air used short haul flights between main departure-destination points (BIKF – ESSA) hence the fixed route network was already close to optimal. In addition the SAS non UPR FPLs already had built in optimisation by using the Swedish FRA initiative to include DCT routings through Swedish airspace. These non UPR FPL advantages would reduce the benefits of the UPR concept for these airlines relative to Emirates.

Project Number 07.05.03 Edition 00.00.03 D06 - Validation Report
126 of 128
©SESAR JOINT UNDERTAKING, 2011. Created by AVINOR for the SESAR Joint Undertaking within the frame of the SESAR
Programme co-financed by the EU and EUROCONTROL. Reprint with approval of publisher and the source properly acknowledged.
Iceland air was the only airline able to report on cost, with a cost saving of 0.1% meaning the trial has achieved half of the OFA target for cost effectiveness at this point.
In addition to OFA targets distance efficiency improvements were seen within the trial, which if routes are also optimised for weather and wind conditions will help to contribute to time and fuel efficiencies.
The controllers that participated did not report any safety concerns as a result of the UPR concept although there was feedback stating that technical modifications were needed to ensure ABI/ACT messages could accommodate custom latitude and longitude points. During the trial 91% of ATCOs felt safety was maintained and that other traffic would not be impacted by the concept when used for en-route flights. 86% of ATCOs felt the concept was safe and would not impact traffic when used for vertically evolving flights.
Controllers did not report any significant concerns regarding how the UPR concept affected their workload with 86% of ATCOs for the en-route scenario and 83% of ATCOs for the depart/arrive scenario reporting no impact to their workload.
It should be recognised that safety and workload have only been deemed acceptable under the traffic levels and complexities validated within VP-465. This trial only validated a minimal number of UPR FPLs that were flown, in addition to this there was little/ no interaction of aircraft flying UPR FPLs with each other.
Overall the concept was accepted by both controllers and the AUs as operationally feasible and acceptable at improving flight efficiency to achieve cost savings and predictability (although this is based on limited data). But before such a concept could proceed to V4 maturity, additional data is required to investigate the acceptability of the concept on technical systems such as the CFMU and the FDP as these are crucial for the concept to operate. Also actual track information would be needed to properly assess gains in predictability.
6.2.4.2 Recommendations
Recommendations for the Validation Exercise VP-465 include the following:
6.2.4.2.1 Recommendations on Concept and Procedures
With regards to the concept and associated procedures, the following points are recommended:
Investigate the feasibility of implementing cross border UPR FPLs which do not require an FIR border point;
Focus on CFMU and FDP system to ensure they adequately support implementation of the UPR concept;
Regarding vertically evolving flights that filed UPR FPLs, investigate transition between fixed route network at lower levels and the FRA above;
Using actual track data investigate the impact of the concept on the vertical efficiency of UPR FPLs that are flown as well as the horizontal efficiency (already obtained). This would ensure that the UPR concept provides climb/descent profiles and cruise altitudes that are at least as good as equivalent non UPR FPLs;
Better understanding needed about achieved fuel burn savings to attribute such savings to distance reductions and less fuel mass on aircraft.
6.2.4.2.2 Recommendations on Key Performance Areas
In order to improve the analysis of KPAs the following is recommended:
To extend safety analysis an increased number of UPR FPLs that are flown is needed to generate scenarios where multiple aircraft are using the UPR concept in an airspace volume;
Potential coordination issues and changes in amount of phone calls which could impact workload need further investigation to determine if they occur due to the UPR concept;
Investigate the number and type of conflicts comparing different phases of flight within FRA;
Project Number 07.05.03 Edition 00.00.03 D06 - Validation Report
127 of 128
©SESAR JOINT UNDERTAKING, 2011. Created by AVINOR for the SESAR Joint Undertaking within the frame of the SESAR
Programme co-financed by the EU and EUROCONTROL. Reprint with approval of publisher and the source properly acknowledged.
Predictability needs to be assessed by comparing UPR FPLs against actual track data to improve fidelity;
Measure differences in number of tactical instructions given to flights filing UPR and non UPR FPLs to assess if concept results in less ATCO intervention due to AUs optimising routes at the planning stage;
Assess how much efficiency improvements are affected by errors in the forecasted weather as current efficiency gains are small;
Gain more understanding in how vertically evolving flights affects fuel efficiency;
Assess impact of tactical DCTs on UPR concept efficiency gains using actual track and fuel burn information.
6.2.4.2.3 Recommendations for Future Validation Exercises/Planning
With regards to the future validation exercises, the following points are recommended:
Another iteration at V3 maturity is needed to successfully validate the UPR concept by using another live trial. This should still be within Northern European airspace due to low airspace/traffic complexity but will require a greater number of flights;
The methods that airlines use to create UPR FPLs needs to be consistent between each scenario to enable more reliable comparisons;
Actual track data will be required as well as FPL data to ensure the concept is being assessed sufficiently at V3 maturity.

Project Number 07.05.03 Edition 00.00.03 D06 - Validation Report
128 of 128
©SESAR JOINT UNDERTAKING, 2011. Created by AVINOR for the SESAR Joint Undertaking within the frame of the SESAR
Programme co-financed by the EU and EUROCONTROL. Reprint with approval of publisher and the source properly acknowledged.
7 References
7.1 Applicable Documents
[1] Template Toolbox 03.00.00 https://extranet.sesarju.eu/Programme%20Library/SESAR%20Template%20Toolbox.dot
[2] Requirements and V&V Guidelines 03.00.00 https://extranet.sesarju.eu/Programme%20Library/Requirements%20and%20VV%20Guidelines.doc
[3] Templates and Toolbox User Manual 03.00.00 https://extranet.sesarju.eu/Programme%20Library/Templates%20and%20Toolbox%20User%20Manual.doc
[4] European Operational Concept Validation Methodology (E-OCVM) - 3.0 [February 2010]
[5] EUROCONTROL ATM Lexicon https://extranet.eurocontrol.int/http://atmlexicon.eurocontrol.int/en/index.php/SESAR
7.2 Reference Documents
The following documents provide input/guidance/further information/other:
[6] P07.05.03 Initial VALP (Step 1 V3), D03, P07.05.03, NORACON, Edition 00.01.03
[7] P07.05.03 Initial OSED (Step1 V3), D02, P07.05.03, Operational Service and Environment Definition, NORACON, Edition 00.06.05.
[8] Dynamic Management of the European Airspace Network - European Medium-Term ATM Network Capacity Plan Assessment 2010-2013, Edition June 2009
[9] Forecasting Civil Aviation Fuel Burn and Emissions in Europe, Interim, EEC Note No.8/2011, EUROCONTROL Experimental Centre, May 2001, http://www.eurocontrol.int/eec/gallery/content/public/document/eec/report/2001/015_Forecasting_Fuel_Burn_and_Emissions_in_Europe.pdf
[10] 16.6.X-B.5 Guidance on Scenarios & Assumptions for Primary Project Validation Exercises for Step 1, D08-02, P16.06.06, EUROCONTROL, Edition 00.01.01
[11] P07.02 Network Detailed Operational Description (DOD), P07.02, EUROCONTROL, Edition 00.01.02
[12] SWP07.02 Validation Plan (VALP) for User Preferred Routing (VALS), P07.02, D09, Edition 00.01.00, May 2011
[13] B4.01.16 Develop proposals for initial targets at Operational Sub-Package Level, Validation target allocation step 1, D10, Edition 00.02.01, November 2011.