Min(d)ing English language data on the Web: What can Google tell us?

Use real-time search data to track topics and spot emerging trends with the free Trends Explore tool. Then, use that data to tell compelling stories about the issues that matter.
Tools Used:Google Trends Explore
Google Trends
3 LESSONS - 20 MIN

Basics of Google Trends
This beginner’s course will teach you the basics of Google Trends, using the free Trends Explore tool.
LESSON 01
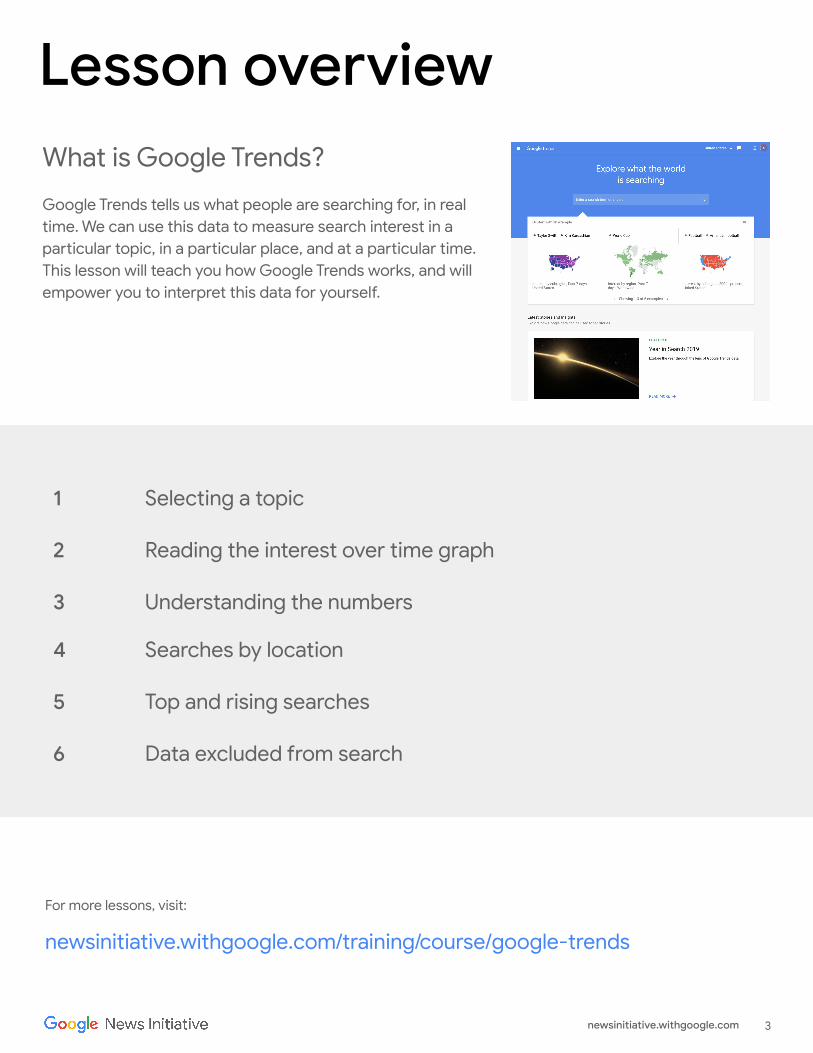
Lesson overviewWhat is Google Trends?
Google Trends tells us what people are searching for, in real time. We can use this data to measure search interest in a particular topic, in a particular place, and at a particular time. This lesson will teach you how Google Trends works, and will empower you to interpret this data for yourself.
Selecting a topic
Reading the interest over time graph
Understanding the numbers
1
2
3
newsinitiative.withgoogle.com/training/course/google-trends
For more lessons, visit:
3newsinitiative.withgoogle.com
Searches by location
Top and rising searches
Data excluded from search
4
5
6
STEP 2 OF 4
Selecting a topic
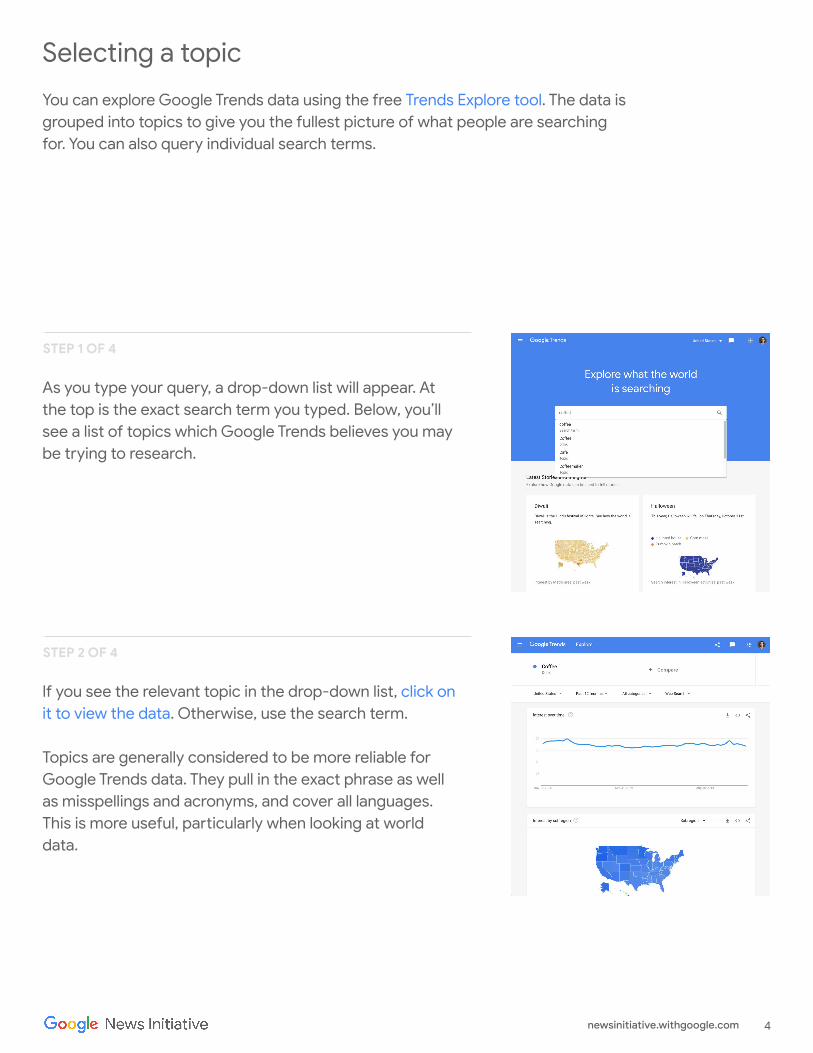
You can explore Google Trends data using the free Trends Explore tool. The data is grouped into topics to give you the fullest picture of what people are searching for. You can also query individual search terms.
As you type your query, a drop-down list will appear. At the top is the exact search term you typed. Below, you’ll see a list of topics which Google Trends believes you may be trying to research.
If you see the relevant topic in the drop-down list, click on it to view the data. Otherwise, use the search term.
Topics are generally considered to be more reliable for Google Trends data. They pull in the exact phrase as well as misspellings and acronyms, and cover all languages. This is more useful, particularly when looking at world data.
STEP 1 OF 4
4newsinitiative.withgoogle.com

To get a better understanding of the difference between topics and search terms, explore a search term and a topic with the same title, at the same time. You will notice the results look different.
You can explore up to five topics or terms on the Trends Explore tool. Make sure you compare like for like -- topics should be compared with other topics, and search terms should be compared with other search terms.
STEP 4 OF 4
STEP 3 OF 4
5newsinitiative.withgoogle.com
STEP 2 OF 3
Reading the interest over time graph
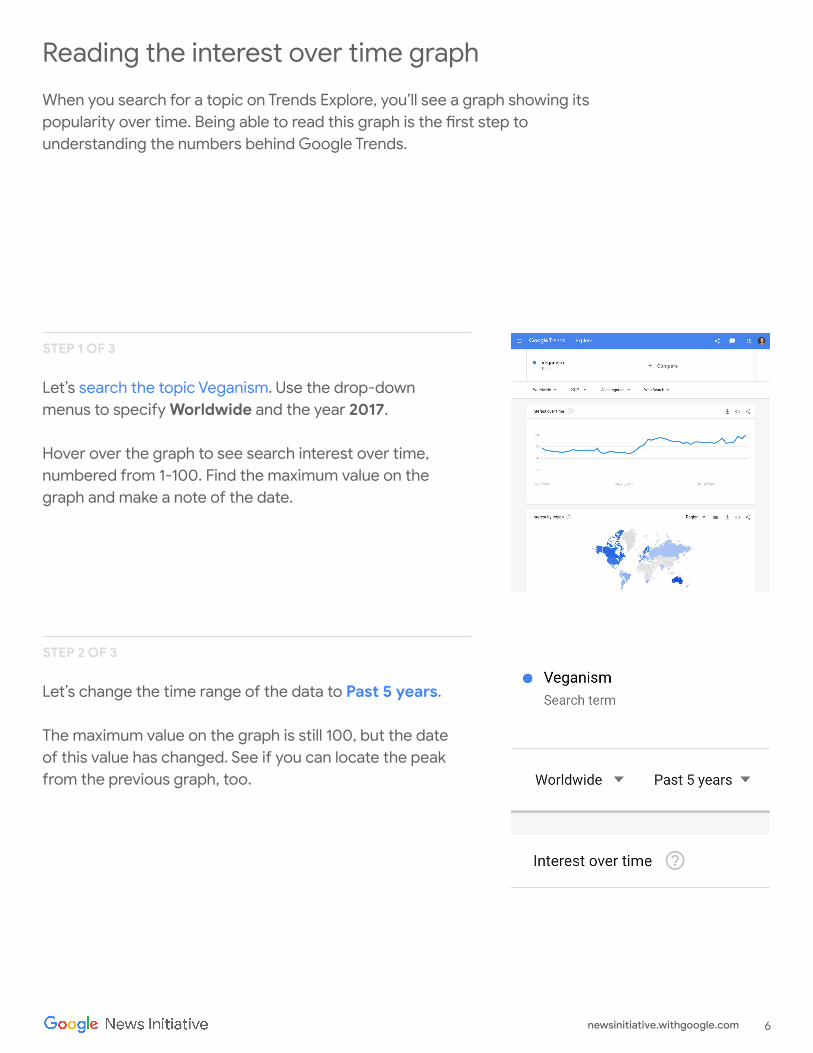
When you search for a topic on Trends Explore, you’ll see a graph showing its popularity over time. Being able to read this graph is the first step to understanding the numbers behind Google Trends.
Let’s search the topic Veganism. Use the drop-down menus to specify Worldwide and the year 2017.
Hover over the graph to see search interest over time, numbered from 1-100. Find the maximum value on the graph and make a note of the date.
Let’s change the time range of the data to Past 5 years.
The maximum value on the graph is still 100, but the date of this value has changed. See if you can locate the peak from the previous graph, too.
STEP 1 OF 3
6newsinitiative.withgoogle.com

The values on the graph do not represent absolute search volume. Instead they are normalized, then indexed on a scale from 1-100. Each point on the graph is divided by the highest point, 100.
See how the maximum points change again when we click + Add comparison and type in another topic, such as ketogenic diet.
STEP 3 OF 3
7newsinitiative.withgoogle.com

Understanding the numbers
By now, we’ve already heard that data on the Trends Explore tool is indexed and normalized. But what does this actually mean?
Indexing: Google Trends data is pulled from a random, unbiased sample of Google searches, which means we don’t have exact numbers for any terms or topics. In order to give a value to terms, we index data from 1-100, where 100 is the maximum search interest for the time and location selected.
Normalization: When we look at search interest in a topic or query, we are not looking at the total number of searches. Instead, we look at the percentage of searches for that topic, as a proportion of all searches at that time and location.
SINGLE STEP
8newsinitiative.withgoogle.com

STEP 2 OF 4
Searches by location
Google Trends also breaks down data by location. In this section, we will explore the basics of location data with Google Trends, and understand the numbers behind this.
Once you have performed your Google Trends search, scroll down to see search interest by location.
If your location is set to Worldwide, you will see search interest by country. If you have selected a country, you will see Interest by region. Darker-shaded areas have a higher level of search interest.
Trends Explore will automatically show you the map view of your data. Toggle between map view and list view using the button with three stacked horizontal lines, at the top right of the map. If your window is wide enough, you will be shown both views simultaneously.
STEP 1 OF 4
9newsinitiative.withgoogle.com

You can view Google Trends data grouped by country, region, and city. In some countries, you can also view search interest by metro area. To select the breakdown you want, use the menu at the top right of the map.
When you hover over a country or use list view, you’ll see an indexed search interest value between 1-100, just as you do with other Trends data.
The location with the highest normalized interest in the topic valued at 100, while all other values are indexed proportionally.
STEP 4 OF 4
STEP 3 OF 4
10newsinitiative.withgoogle.com
STEP 2 OF 4
Top and rising searches
Top and rising search topics and queries make up the final key element of the Trends Explore tool. In this section, we’ll learn how to read and understand this data.
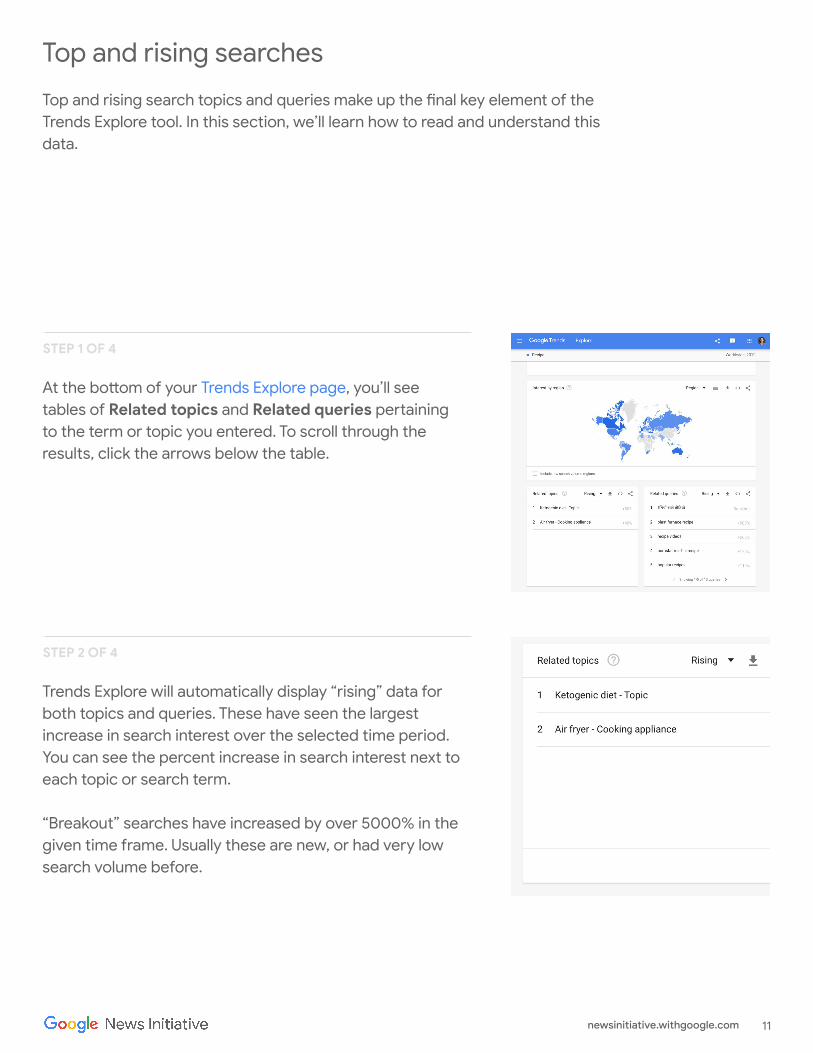
At the bottom of your Trends Explore page, you’ll see tables of Related topics and Related queries pertaining to the term or topic you entered. To scroll through the results, click the arrows below the table.
Trends Explore will automatically display “rising” data for both topics and queries. These have seen the largest increase in search interest over the selected time period. You can see the percent increase in search interest next to each topic or search term.
“Breakout” searches have increased by over 5000% in the given time frame. Usually these are new, or had very low search volume before.
STEP 1 OF 4
11newsinitiative.withgoogle.com

Click on the top right of the widget where it says Rising and switch to Top. These are the queries or topics with the highest search volume in the selected time frame and location. These are indexed and normalized values from 1-100.
Click on a top or rising topic or query to explore it in more detail.
STEP 4 OF 4
STEP 3 OF 4
12newsinitiative.withgoogle.com

Data excluded from search
Trends excludes certain data from your searches.
● Searches made by very few people: Trends only analyzes data for popular terms, so search terms with low volume appear as 0 for a given time period.
● Duplicate searches: Trends eliminates repeated searches from the same user over a short period of time for better overall accuracy.
● Special characters: Trends filters out queries with apostrophes and other special characters.
SINGLE STEP
13newsinitiative.withgoogle.com

Congratulations!You completed “Basics of Google Trends.”
To continue building your digital journalism skills and work toward Google News Initiative certification, go to our Training Center website and take another lesson:
For more lessons, visit:
7 min estimated time
Advanced Google Trends
Become a master of the Trends Explore tool
with these simple tips for extracting precise
data.
14newsinitiative.withgoogle.com
newsinitiative.withgoogle.com/training/course/google-trends

Advanced Google Trends
Become a master of the Trends Explore tool with these simple tips for extracting precise data.
LESSON 02
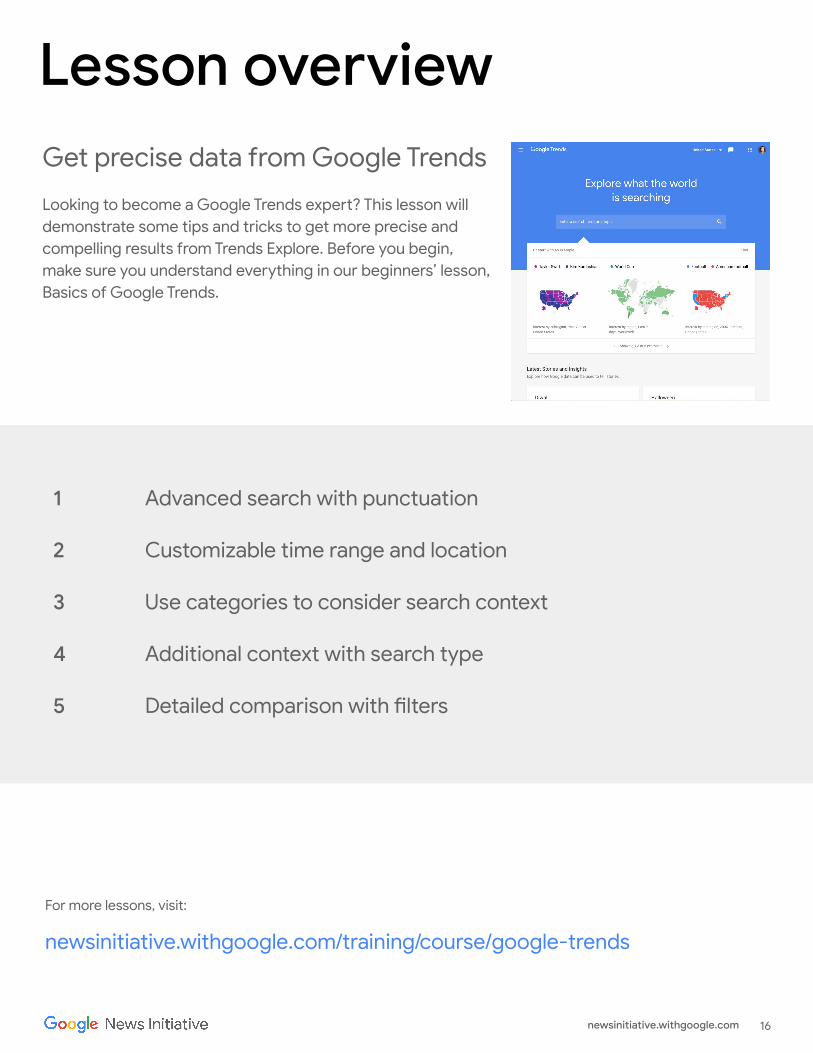
Lesson overviewGet precise data from Google Trends
Looking to become a Google Trends expert? This lesson will demonstrate some tips and tricks to get more precise and compelling results from Trends Explore. Before you begin, make sure you understand everything in our beginners’ lesson, Basics of Google Trends.
Advanced search with punctuation
Customizable time range and location
Use categories to consider search context
1
2
3
For more lessons, visit:
16newsinitiative.withgoogle.com
Additional context with search type
Detailed comparison with filters
4
5
newsinitiative.withgoogle.com/training/course/google-trends

Advanced search with punctuation
In Basics of Google Trends, we learned that it’s usually best to search for topics, rather than terms, because they are language agnostic and include misspellings.
If you can’t find the right topic for your search, you can use punctuation as a filter.
If you search the term wind farm, with no punctuation, your results will contain both words in any order. No misspellings, variations, or plural versions will be included. Here’s how various punctuation can affect this search:
● “wind farm” -- This exact term, possibly with words before and after.
● wind + solar -- Results can include the words wind OR solar.
● wind - farm -- Results will include the word wind, but exclude the word farm.
SINGLE STEP
17newsinitiative.withgoogle.com

STEP 2 OF 6
Customizable time range and location
In this section, you will consolidate your knowledge of how to select a time range and location for Google Trends data. This includes options to select a custom time range, or a smaller region for your data.
Google Trends offers a menu of time ranges for your search; from the past hour, all the way back to 2004. You can also specify a custom time range.
This example looks at search interest in cricket in India.
Trends Explore will automatically show you data from the past year. Above the time series graph, click the button that says “past 12 months”. A drop-down list of possible time ranges will appear. Click “custom time range” to see options to select an alternative time range.
STEP 1 OF 6
18newsinitiative.withgoogle.com
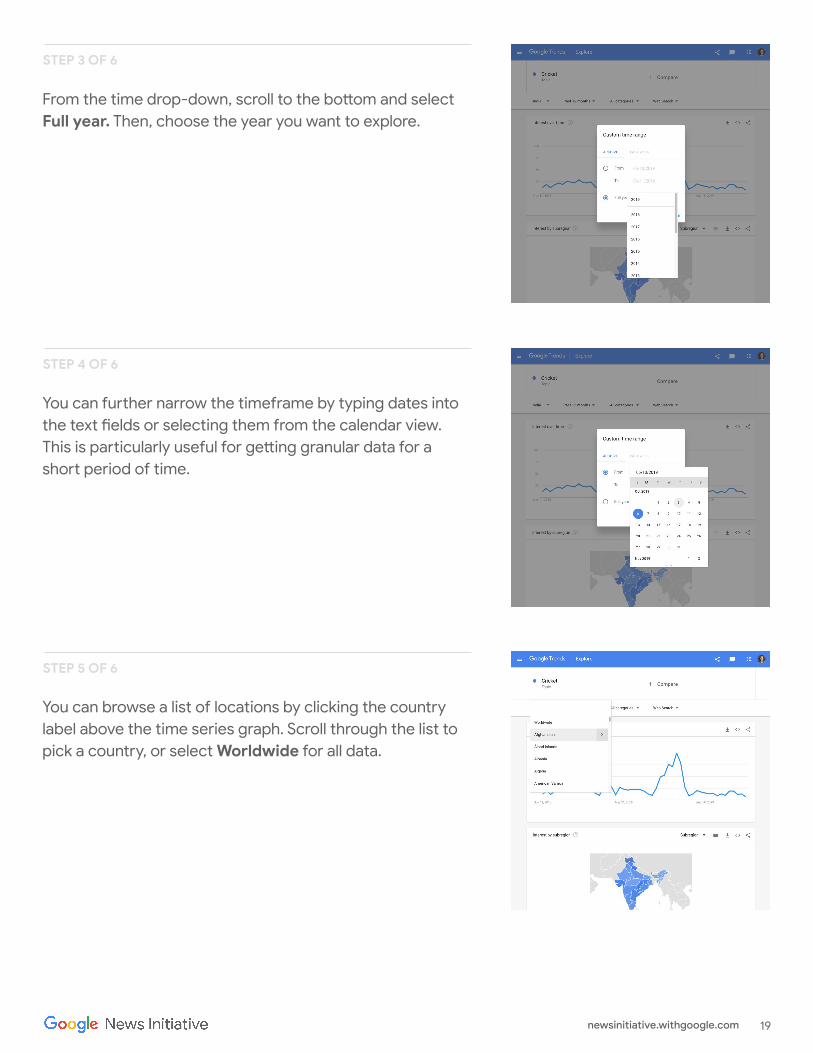
From the time drop-down, scroll to the bottom and select Full year. Then, choose the year you want to explore.
You can further narrow the timeframe by typing dates into the text fields or selecting them from the calendar view. This is particularly useful for getting granular data for a short period of time.
You can browse a list of locations by clicking the country label above the time series graph. Scroll through the list to pick a country, or select Worldwide for all data.
STEP 4 OF 6
STEP 5 OF 6
STEP 3 OF 6
19newsinitiative.withgoogle.com

When you hover over a region, a right arrow will appear. Click it to see sub-regions nested within this location, or type the name of a sub-region.
For example, we can look at search interest in cricket in Tamil Nadu.
You can also access search data by metro area, for countries where this is available.
STEP 6 OF 6
20newsinitiative.withgoogle.com

STEP 2 OF 4
Use categories to consider search context
When using Google Trends to explore a topic that is relevant to multiple contexts, you can filter your results by search category to get the most relevant data. This step will walk you through how to find and use categories in Trends Explore.
This example will look at searches for sustainability, in the past five years worldwide.
There are different contexts for how people might search for sustainability. Using categories will allow us to explore one particular context.
Above the time series graph, there is a drop-down menu labeled All categories. Click on the arrow to view a list of categories. You can type in a category name, or click through the parent categories to explore the full list.
STEP 1 OF 4
21newsinitiative.withgoogle.com

Select a category most closely related to the context you are interested in. The results will reflect searches for the term or topic in context.
In this case, we will view results for sustainability in the shopping category. This could give us information about how people search for ethical brands, for example.
Once you have selected a category, it’s also possible to remove your search term or topic and look at this broad, categorized data.
Think of these categories as umbrella topics. On their own, they are much broader than the search topics we would normally use to explore Google Trends. Combined with these topics, we can find much more specific insights.
STEP 4 OF 4
STEP 3 OF 4
22newsinitiative.withgoogle.com

STEP 2 OF 4
Additional context with search type
Filtering results by search type can also give us more relevant and granular data. This section will explore how to do this, and will explain the different search types available through Google Trends.
We will start with searches for cosmetics in 2019 in the US. Many of the related topics and queries are focused on specific products. But let’s say you want to look at tutorials and challenges around makeup. We can filter our results to get closer to this.
Above the Interest over time, click Web Search. From the drop-down menu, select YouTube Search.
STEP 1 OF 4
23newsinitiative.withgoogle.com

Scroll down to look at the related search terms and topics. How have these changed between web search and YouTube search?
If we are looking for data around makeup tutorials and challenges, these results may be more relevant.
Google Trends gives you five different options for search type: Web Search, YouTube Search, Image Search, Google News, and Google Shopping. These are discrete datasets which do not overlap.
STEP 4 OF 4
STEP 3 OF 4
24newsinitiative.withgoogle.com

STEP 2 OF 6
Detailed comparison with filters
You can also filter Google Trends data to compare topics across multiple equivalent time ranges or locations. We’ll go through the steps of selecting filters and learn their use cases and limitations.
Look at worldwide, all-time search interest in the Olympic Games. Which are the top two countries searching for the Olympics?
To compare these countries against each other, we could use the map. But in some cases, we will want more granular detail about how these countries search for the Olympics. We can use filters to get this.
Change the location of your search to the top country searching for the Olympics, according to your global search.
STEP 1 OF 6
25newsinitiative.withgoogle.com
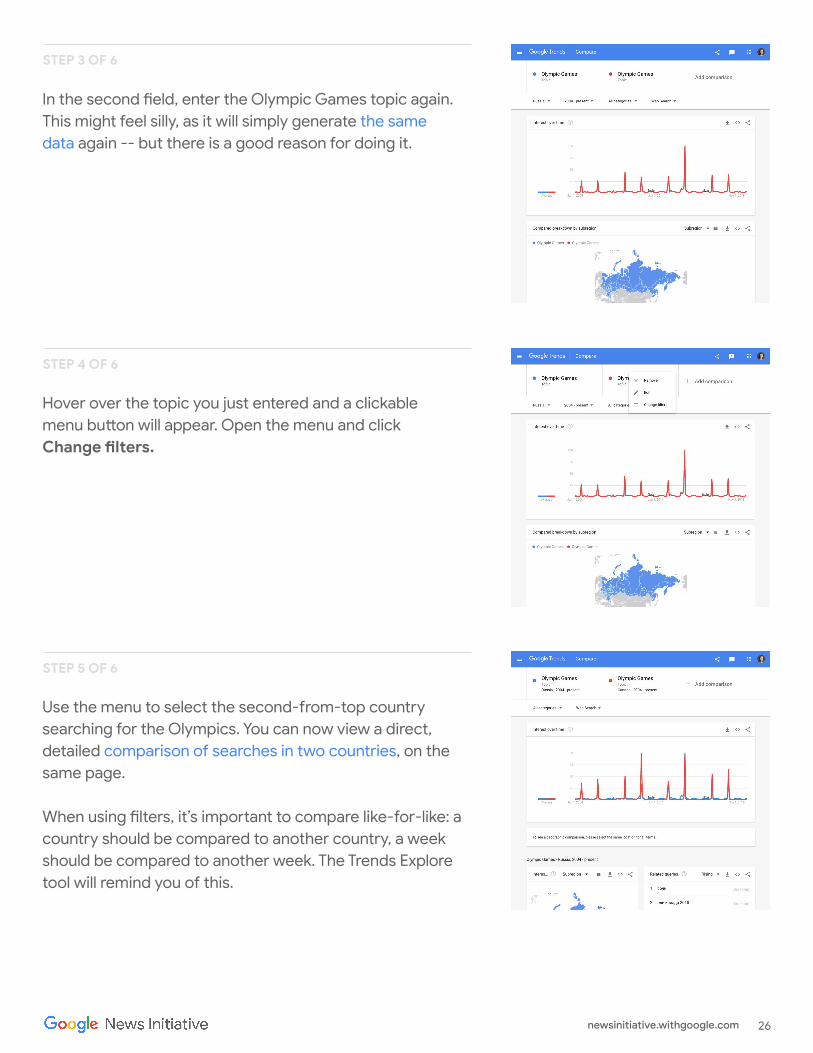
In the second field, enter the Olympic Games topic again. This might feel silly, as it will simply generate the same data again -- but there is a good reason for doing it.
Hover over the topic you just entered and a clickable menu button will appear. Open the menu and click Change filters.
Use the menu to select the second-from-top country searching for the Olympics. You can now view a direct, detailed comparison of searches in two countries, on the same page.
When using filters, it’s important to compare like-for-like: a country should be compared to another country, a week should be compared to another week. The Trends Explore tool will remind you of this.
STEP 4 OF 6
STEP 5 OF 6
STEP 3 OF 6
26newsinitiative.withgoogle.com

When you use filters for your comparisons, you see search interest by location and related queries for both of your selections separately.
STEP 6 OF 6
27newsinitiative.withgoogle.com
Congratulations!You completed “Advanced Google Trends.”
To continue building your digital journalism skills and work toward Google News Initiative certification, go to our Training Center website and take another lesson:
For more lessons, visit:
7 min estimated time
Storytelling with Google Trends
Learn ways to contextualize Google Trends
data and integrate it into your reporting.
28newsinitiative.withgoogle.com
newsinitiative.withgoogle.com/training/course/google-trends

Storytelling with Google Trends
Learn ways to contextualize Google Trends data and integrate it into your reporting.
LESSON 03

Lesson overviewHow Trends can support journalism
Google Trends is a useful tool for monitoring what audiences are interested in. Trends data can also be used in storytelling. This lesson will take you through ways to find and make sense of Trends stories, and how to report the data.
Finding stories with Trends Explore
Making sense of Google Trends data
Embed charts from Google Trends
1
2
3
For more lessons, visit:
30newsinitiative.withgoogle.com
Download data from Google Trends4
How to talk about Google Trends5
newsinitiative.withgoogle.com/training/course/google-trends
STEP 2 OF 5
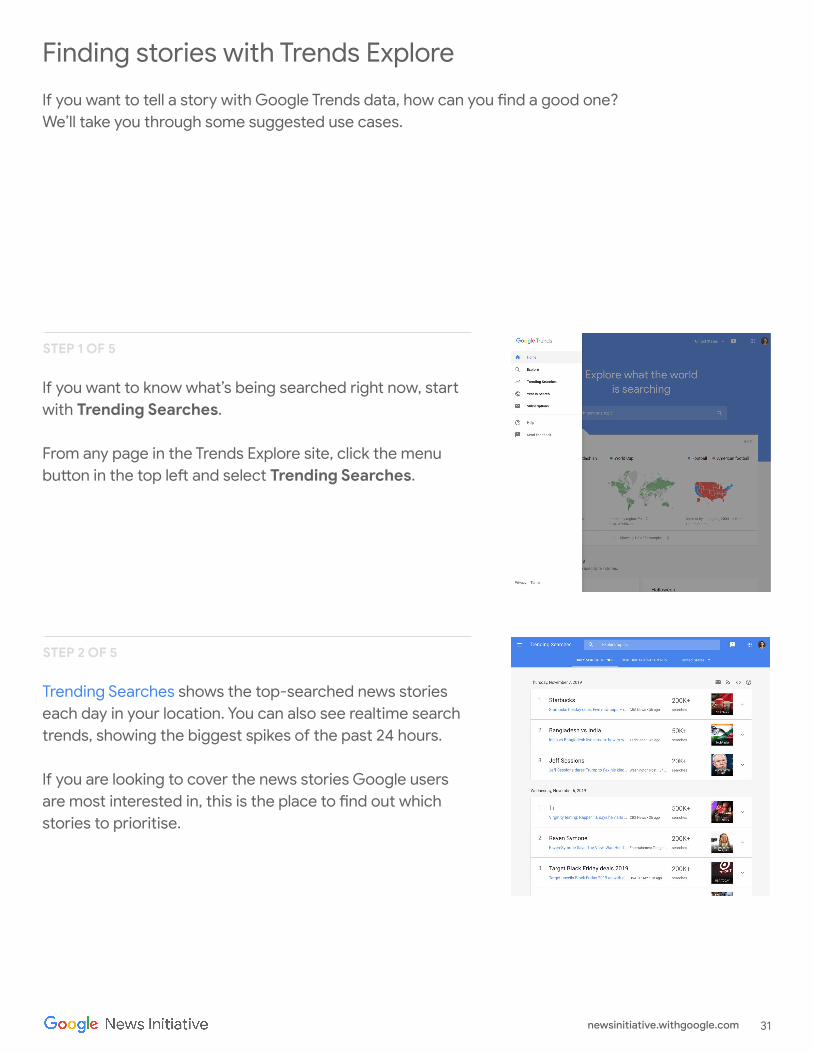
Finding stories with Trends Explore
If you want to tell a story with Google Trends data, how can you find a good one? We’ll take you through some suggested use cases.
If you want to know what’s being searched right now, start with Trending Searches.
From any page in the Trends Explore site, click the menu button in the top left and select Trending Searches.
Trending Searches shows the top-searched news stories each day in your location. You can also see realtime search trends, showing the biggest spikes of the past 24 hours.
If you are looking to cover the news stories Google users are most interested in, this is the place to find out which stories to prioritise.
STEP 1 OF 5
31newsinitiative.withgoogle.com

To surface longer term trends, use the Explore tool.
First, perform your search. On the results page, select Categories.
Once you have selected a category, remove the search term or topic you entered. You will now be able to view general data about that category. The best place to look for stories here is among the rising searches.
You can also use Google Trends to support a story you are already reporting. Let’s say you’re writing about US citizens’ shifting sentiment toward climate change.
Use Trends Explore to look up climate change in the US since 2004. We can see that search interest in climate change reached its highest point yet in September 2019. You could use this statistic to support your story.
STEP 4 OF 5
STEP 5 OF 5
STEP 3 OF 5
32newsinitiative.withgoogle.com

STEP 2 OF 5
Making sense of Google Trends data
Because Google Trends data is presented as an index, one of our frequently asked questions is, “How important is this?” In this section, we will explore how to understand and contextualize trending searches, which can then form the basis of a news story.
One of the easiest ways to make sense of Google Trends data is to find “spikes” in search. This is a sudden acceleration of search interest in a topic, compared to usual search volume.
Here is a spike in search interest in the men’s football World Cup, at the time of the tournament in 2018. We call it a spike because of the sharp upward movement of the search interest graph.
Let’s examine the numbers on this time series graph. Search interest peaks on June 27, 2018, and reaches the maximum search interest value of 100. A month earlier, on May 27, search interest was 4.
When we calculate the difference between these two values, this is a percentage increase of 2,400%. But what does this spike really mean?
STEP 1 OF 5
33newsinitiative.withgoogle.com

Above the time series graph, change the time range of the data. Look at search interest in the World Cup back to 2004. We can now see that the World Cup in 2018 was more highly-searched than any of the previous tournaments covered by the data.
Let’s return to our original search. Now we know the size of the spike, and we know this is the most highly searched World Cup since 2004. But when we see a topic is spiking, this doesn’t always mean it is very highly searched.
We can add a second topic to sense-check this. We will now compare the World Cup to the news, a consistently highly-searched topic. We can see the World Cup actually spiked above the news in 2018.
When we need to contextualise spikes in search interest -- or the general level of searches for any topic -- it can be really useful to compare them to topics with a consistently high level of search interest.
These topics vary by country, but common highly-searched topics include the news, the weather, leading politicians, and recipes.
STEP 4 OF 5
STEP 5 OF 5
STEP 3 OF 5
34newsinitiative.withgoogle.com

STEP 2 OF 5
Embed charts from Google Trends
When you find a story in Google Trends data, you will probably want to include visuals in your work. You can embed charts directly from Google Trends by following these steps.
You can choose any topic in order to work through this tutorial. Our example looks at search interest in recipes from the past 90 days, worldwide.
In the top right of any chart on Trends Explore, you’ll see an embed symbol which looks like two triangular brackets: <>.
STEP 1 OF 5
35newsinitiative.withgoogle.com

Click the embed symbol. Click Desktop or Mobile for a preview of how the chart will display.
If you chart includes the present time period and you want it to automatically update, select Keep data updated. If you are looking at a time period that has already ended, this option will not be available.
On the bottom left, you will see a text box with an embed code. Copy and paste it into any HTML page to embed your Google Trends chart.
STEP 4 OF 5
STEP 5 OF 5
STEP 3 OF 5
36newsinitiative.withgoogle.com

STEP 2 OF 5
Download data from Google Trends
You can create bespoke visualizations using Google Trends data rather than embedding from Trends Explore. We will now explain how to download Google Trends data so you can make your own maps and charts.
Choose any topic to work through this tutorial. Our example looks at search interest in recipes from the past 90 days, worldwide.
In the top right of any widget, you will see an arrow pointing downward to a horizontal line. This download symbol lets you access the data behind that chart.
STEP 1 OF 5
37newsinitiative.withgoogle.com

For this example, download all of the data for related topics, terms, searches by region, and searches over time.
Open the csv files. How do they look? If you are working in Google Sheets, they should display properly. However, in some spreadsheet software, csv files may display irregularities in column alignment, special characters, etc.
You can now clean the data and visualize it using free tools such as Flourish.
Note that the geoMap file will leave blank cells in the search interest value column, for countries where search volume was not high enough to allocate an index value.
STEP 4 OF 5
STEP 5 OF 5
STEP 3 OF 5
38newsinitiative.withgoogle.com

How to talk about Google Trends
Now that you can integrate Google Trends data into your journalism, how do you ensure you represent it accurately?
When writing about a trend, make sure you include the search term or topic, location, and time frame. If you have used categories or filtered by search type, you should mention this, too.
You should also ensure you have accurately represented the numbers. You should describe spikes as an increase in “search interest,” rather than “searches.” You should also know the difference between top searches and rising or “trending” searches. For more information on this, see “Basics of Google Trends”.
It’s also important to remember that Google Trends data is completely anonymous. Your writing should reflect this -- don’t make assumptions about who is searching for a topic, or why they are searching.
Finally, please credit the data source as Google Trends.
SINGLE STEP
39newsinitiative.withgoogle.com
Congratulations!You completed “Storytelling with Google Trends.”
To continue building your digital journalism skills and work toward Google News Initiative certification, go to our Training Center website and take another lesson:
For more lessons, visit:
40newsinitiative.withgoogle.com
newsinitiative.withgoogle.com/training/course/google-trends


![[Harvard CS264] 09 - Machine Learning on Big Data: Lessons Learned from Google Projects (Max Lin, Google Research)](https://static.fdocuments.in/doc/165x107/547bc2aeb479597c098b4eb2/harvard-cs264-09-machine-learning-on-big-data-lessons-learned-from-google-projects-max-lin-google-research.jpg)