2nd Quarter 2012 - meralcomain.s3.ap-southeast …
48
2 nd Quarter 2012 Investors’ Briefing & Teleconference 30 July 2012 Pasig Room, Lopez Building, Pasig City Conference call numbers: 00-852-3001-3802 (Hong Kong) 63-2-858-3662 (Philippines) Passcode: MERALCO MANILA ELECTRIC COMPANY
Transcript of 2nd Quarter 2012 - meralcomain.s3.ap-southeast …

2nd
Quarter 2012
Investors’ Briefing &
Teleconference
30 July 2012
Pasig Room, Lopez Building, Pasig City
Conference call numbers: 00-852-3001-3802 (Hong Kong)
63-2-858-3662 (Philippines) Passcode: MERALCO
MANILA ELECTRIC COMPANY

2
OPERATIONS REPORT
1H2012 Results
Mr. Oscar S. Reyes
President and Chief Executive Officer

3

4
1H 2012 Net System Input Up 9.6% vs. 1H 2011
• Consolidated NSI of 17,626 GWh (1,541 GWh more than 2011)
• Peak Demand at 5,633 MW, up 6.6% vs. 2011
• NPC leading source of consolidated power supply at 49.6%,
IPPs/SGC at 44.9% and WESM at 5.5%
• IPPs/SGC remain as lowest cost source of supply
- By type of fuel, Nat Gas accounts for 56.2%, Coal at 31.8% and
balance of 12.0% are mixed fuel sources
1H 2012 Energy Sales Up 9.7% vs. 1H 2011
• Consolidated sales of 16,215 GWh (1,434 GWh more than 2011)
• Robust performance of major segments vs. 2011
- Growth led by Industrial, up 14.6%
• Consolidated Customer Count up 3.7% to 5.11 million
- Total of 88,391 new customers from beginning of 2012
HIGHLIGHTS

5
HIGHLIGHTS
1H 2012 Ave. Rate up 62¢/kWh to P9.57/kWh vs.
1H 2011
• Generation, System Loss, Universal Charges and Taxes accounted
for the increase (77¢/kWh)
• Mitigated largely by lower Distribution Charge (down 13¢/kWh)
• Generation Charge the largest component of customers’ bill at
57.8%; Meralco share 15.7%; NGCP is 10.8%
Sustained outperformance vs. Regulatory Standards
• 12-MMA System Loss ended June 2012 at 7.35%, improved by
0.13% vs. 2011
• All S-Factor performance within rewards range
• GSL performance within allowed limits, resulting in savings
due to improved service, efficiency and quality.

Events of Interest / Business Updates
Operations:
•Tight supply conditions in June
• Signing of new Power Supply Agreements
• Expansion of Bacoor Substation
• Commissioning of Saog, Bulacan Substation
• Meralco Managed Services
•Accredited Meralco Contractors (AMC)
Marketing, CSR, HR and Corp Governance:
• Bright Ideas
• “Understanding Your Bill” Communication Plan
• e-Vehicle Summit 2012
• Isla Verde School Electrification
• Power Camp Graduation & Power Academy Launching
• Meralco Corporate Wellness center now managed by CSMC
• Meralco’s governance efforts recognized
• 2012 Best in Asia on Corporate Governance
• “Silver” citation from ICD
6

7

PARENT
Sustained growth on Sales June 2012 highest ever
1,871
2,323 2,453
2,942
2,258
2,715
2,207
2,776
Jan Feb Mar Apr May Jun 12,789
14,950
14,781
16,215
MONTHLY SALES, GWh JUNE YTD SALES, GWh
CONSOLIDATED (MERALCO + CEDC)
Ave.
2005-09
2010
2011
2012
JUNE GROWTH COMPARISON
2012 vs. 2011 8.4%
2012 vs. 2010 6.0%
2012 vs. Ave. 2005-09 26.6%
JUNE YTD GROWTH COMPARISON
2012 vs. 2011 9.7%
2012 vs. 2010 8.5%
2012 vs. Ave. 2005-09 26.8%
Record-high

1H 2012 Energy Sales Consolidated sales up 9.7% vs. 2011 (1,434 GWh more sales than last year) Robust performance of major segments vs. 2011
CONSOLIDATED (MERALCO + CEDC)
30.4%
38.6%
30.6%
Industrial
Commercial
Total in GWh
Share of Sales: 13,190 13,118
14,950 14,781 16,215
2008 2009 2010 2011 2012
CONSO
7.9%▲ Residential
7.8%▲
14.6%▲
Details:
9.7%▲
Growth Drivers:
4,595 4,956
5,810 6,261
4,303 4,933
•Electrical Machinery (semicon)
•Food & Beverage •Basic Metals (metal plates, strips, bars, rods, etc.)
•Real Estate (condominiums, BPO office space)
• Private Services (hotels, rest., private schools, gyms)
• Transport, Storage and Communication
•Ramp-up of newly-energized sales in 2011 & Slightly warmer temperature (1H 2012 ave. temp, 28 C vs. 2011’s 27.5C)

1H 2012 Customer Count Billed customer count up 3.7% vs. 2011 to 5.11 million customers - Total of 88,391 new customers* from beginning of 2012, majority Residential
CONSOLIDATED (MERALCO + CEDC)
3.7%▲
Commercial
Total Count
4.51 Mn 4.63 4.78 4.93
5.11 Mn
2008 2009 2010 2011 2012
4.49Mn 4.66Mn
0.43Mn 0.44Mn
3.8%▲ Residential
2.4%▲
91.2%
8.6%
Indl
0.2%
4,663,025
Share of Count:
437,706
9,770
83,422
4,974 (4)
Residential Commercial Industrial
88,391 new customers as of Jun 30, 2012
*net, additions less terminations
New Customers:
Details:

16,086
17,626
2011 2012
9.6%▲
Net System Input, GWh:
Net System Input (NSI) & Peak Demand 1H 2012 consolidated NSI of 17,626 GWh up 9.6% vs. 2011 June YTD Peak demand up 6.6% vs. 2011 YTD Peak; also exceeded 2010 YTD peak
CONSOLIDATED (MERALCO + CEDC)
5,283
5,633*
2011 2012
Meralco YTD Peak Demand, MW:
6.6%▲
*occurred May 10, 2012 as against May 18, 2011 peak; surpasses May 26, 2010’s 5,374 MW record (all-time high)
7,552 7,889**
2011 2012
Luzon YTD Peak Demand, MW:
4.5%▲
** occurred April 27, 2012

1H 2012 Clark Electric (CEDC) Sales, NSI and Customer Count Energy Sales, NSI and Customer Count sustained growth vs. 2011
134 151
2011 2012
1,671
1,735
2011 2012
12.7%▲ 3.8%▲
Energy Sales, GWh
NSI, GWh
Customer Count
% Sales % Count
Commercial 49.2% 56.1% Industrial 49.0% 6.2%
Residential 1.4% 34.4%
140
157
2011 2012
12.2%▲

NPC
49.6%
WESM
5.5%
SGC- SEM-Calaca
4.1% SGC- Sual 0.9%
IPP- QPPL
7.9%
IPP- Sta Rita
20.9% IPP-San Lorenzo
10.9%
IPP-Others 0.1%
*Including Special Programs (Ecozone and CCP) IPPs/SGC Total = 44.9%
1H 2012 Purchases
1H 2012 Power Supply Mix, Volume
SOURCE GWh Share
NPC* 8,746.3 49.6%
WESM 968.1 5.5%
IPPs/SGC Total 7,911.8 44.9%
Sta. Rita 3,685.2 20.9%
San Lorenzo 1,930.0 10.9%
QPPL 1,395.0 7.9%
SEM-Calaca 726.7 4.1%
Sual 157.2 0.9%
Others 17.6 0.1%
Total NSI 17,626.2 100%
WESM purchases below 6% due to higher NPC volume and IPPs/SGC
CONSOLIDATED (MERALCO + CEDC)

TYPE GWh Share
Natural Gas 9,902.5 56.7%
Coal 5,602.5 31.8%
Geothermal 1,024.8 5.8%
Biomass/Run-of-River Hydro 17.6 0.11%
NPC TSC (multi-fuel) 110.7 0.6%
WESM (multi-fuel) 968.1 5.5%
Total NSI 17,626.2 100.0%
Multi-fuel (Hydro, Coal, et al.)
Natural Gas
56.2%
NPC TSC
0.6%
WESM
5.5%
Coal 31.8%
Geothermal 5.8%
1H 2012 Power Plant Mix Majority of Meralco’s purchased power used Natural Gas.
Biomass & Hydro
0.11%
1H 2012 Purchases
CONSOLIDATED (MERALCO + CEDC)

1H 2012 Ave. Retail Rate up 62¢/kWh Generation Charge, System Loss & Taxes accounted for the increase (total 77¢/kWh) Mitigated largely, by lower Distribution Charge (down 13¢/kWh) Generation Charge the largest component in customer’s bill at 57.8% Distribution Charge (Meralco ) 16.0%; Transmission Charge (NGCP) 10.8%
1H 2012 Share per component
BILL COMPONENT 1H 2012
Overall Ave, P/kWh
1H 2011 Overall Ave,
P/kWh
Inc/
(Dec)
Generation Charge 5.53 4.94 12%
Distribution Charge (MERALCO)
1.51 1.64 (8%)
Transmission Charge (NGCP)
1.03 1.05 (2%)
System Loss Charge 0.53 0.52 2%
Taxes, Univ Charge 0.97 0.81 20%
TOTAL 9.57 8.95 7%
PARENT (MERALCO)
Generation Charge
57.8%
Meralco
15.7% NGCP
10.8%
Taxes, Univ Charge
10.2%
System Loss Charge
5.5%

SL CAP, 2010-PRESENT
System Loss Performance 12-MMA ending June 2012 at 7.35% Lower by 0.13% vs. June 2011’s 7.48%
1.17%
8.5%
Official ERC-filed Meralco System Loss: excludes Clark Electric Distribution Corp. (CEDC) – 12MMA ending Jun 2012: 3.75%; June 2011: 3.99%
MERALCO (PARENT) & CEDC
7.8 7.78 7.78 7.78 7.73
7.94 7.88
7.66 7.62
7.42
7.59
7.48 7.72
7.56
7.43 7.44 7.44
7.35 7.36
7.31 7.33
7.63
7.38 7.35
JUL AUG SEP OCT NOV DEC JAN FEB MAR APR MAY JUN
YEAR AGO 12-MMA (JUL '10-JUN '11)
LATEST 12-MMA (JUL '11 - JUN '12)

S-Factor Performance: 1H 2012 Summary All performances are within rewards* range
*ERC-imposed performance band
**SAIFI [System Average Interruption Frequency Index (Forced and Pre-Arranged)]; to replace IFR (Forced and Pre-arranged)
CAIDI [Customer Average Interruption Duration Index (Forced and Pre-Arranged)]; to replace CIT (Forced)
SAIDI [System Average Interruption Duration Index (Pre-Arranged)]; to replace CIT (Pre-arranged)
REWARDS DEADBAND PENALTY
ACTUAL 1H 2012
SAIFI, Forced and PAI (Times)**
2.83
1.91
2011
2012 32.5% improvement
CAIDI, Forced and PAI (Minutes)**
113.94
98.12
2011
2012 13.9% improvement
SAIDI, Pre-arranged (Minutes)**
38.1
32.31
2011
2012 15.2% improvement
Prob. of Voltage Level (% not falling within limits)
0.13
0.06
2011
20120.07%pts
improvement
Ave. Time to Process App. (Days)
5.67
4.78
2011
2012 15.7% improvement
Ave. Time to Connect (Days)
3.13
2.17
2011
2012 30.8% improvement
Call Center performance (Seconds)
17.06
4.92
2011
201271.2%
improvement
System Loss (%) -12MMA
7.48
7.35
2011
2012 0.13%pts improvement

GSL Performance: Jul 2011-Jun 2012 (RY2012) All GSL performances are within set limits; with expected savings
PARENT (MERALCO)
GSL1 : Customer experiencing a
cumulative duration of sustained
service interruptions in a Regulatory
Year that exceeds the threshold
GSL2 : Customer experiencing a
total number of sustained interruption
in a Regulatory Year that exceeds
the threshold
GSL3: Restoration of supply to a
customer after a fault on the
secondary distribution network
taking longer that the threshold time
GSL4 : Connection not provided on
the day agreed with the customer
373,658
58,499
No. of Violations for
RY2012 (Ceiling)
Actual RY2012 customers
18,989
482
No. of Violations for
RY2012 (Ceiling)
Actual RY2012 customers
234,439
42,916
No. of Violations for
RY2012 (Ceiling)
Actual RY2012 incidents
163,995
82,087
No. of Violations for
RY2012 (Ceiling)
Actual RY2012 days delay
SAVINGS PAYOUT
ACTUAL 1H 2012


Business Updates
0018H - Sual 1
(647 MW)
Tripped due to high
drum level. Cut-in
at 1417H.
1442H - Sual
1 Tripped out
again. Cut-in
at 1517H.
1500H -. Calaca 2
(260MW) tripped out
due to undetermined
cause. Cut-in at
2356H.
0900H - Sta. Rita 30
(250 MW) tripped out
due to fuel oil pump
trouble. Cut-in at
1129H.
Maximum load dropped at 1100H = 254 MW
MLD implemented from 0959H to 1524H due to insufficient generation caused by the ff:
1. Outage of Sual 1
2. Outage of Sta. Rita 30
3. Limited output of Ilijan from 1200
MW to 350 MW due to leak on
reboiler vapor line of Malampaya
4. San Lorenzo 60 (250 MW)
shutdown at 0447H for scheduled
washing of inlet guide vane
ALD 1
ALD 2 ALD 3 ALD 4
Meg
aw
att
Plants still out:
Calaca 1 (300 MW) – Out since August 29, 2011 due to reheater tube leak
Sual 2 (647 MW) – Out since June 6, 2012 due to boiler tube leak
Power plant outages on June 9, 2012 (Sual 1, Calaca 2, San Lorenzo, and Sta. Rita)
Note: On June 8, changed-over from
gas to liquid fuel was
implemented for Sta. Rita
module 30 and San Lorenzo
modules 50 and 60 due to
restriction of gas supply from
Malampaya because of leak on
its reboiler vapor line.
Impact:
•Four (4) Automatic Load Dropping
(ALD) incidents with durations
ranging from 8 to 46 minutes.
Unrealized sales: ~117 MWh
•Manual Load Dropping (MLD)
implemented from 0949H to
1524H (~5.5 hours) affecting 128
circuits (97 residential, 23
commercial, 8 industrial)
Unrealized sales: ~977 MWh
Total unrealized sales: ~1,094 MWh
Power Supply Situation:
Available dependable capacity:
5,841 MW Power shortfall: 404 MW

Business Updates
Tight supply conditions 11x May 31-Jun 25. Resulting upward pressure on WESM
Power Supply Situation
Date Condition
May 31 Yellow alert – 1000H to 1600H, 1900H to 2000H
June 6 Yellow alert – 1000H to 1600H, 1900H to 2100H
June 7 Yellow alert – 1000H to 1600H, 1900H
June 9 Red alert – 900H to 1500H (ALDs); Yellow alert – 1600 to 22380H
June 11 Yellow alert – 1000H to 1130H
June 20 Yellow alert – 1000H, 1100H, 1400H
June 21 Yellow alert – 1000H to 1700H, 1900H to 2100H
June 22 Red alert – 1100 to 1400H; Yellow alert – 900H, 1000H, 1200H,
1300H, 1500H to 2000H
June 23 Yellow alert – 1100H, 1400H to 1600H
June 24 Yellow alert – 1100H, 1400H to 1600H
June 25 Yellow alert – 1100H, 1400H, 1500H

Business Updates
Meralco signs new
Power Supply Agreement With San Miguel Energy Corp., a subsidiary of
San Miguel Corp.
To replace NPC Transition Supply Contract (extended until ERC final approval), 3 months after OARC or December 25, 2012, whichever comes first.
SIGNING DATE
POWER PLANT / LOCATION
INITIAL CONTRACTED
CAPACITY FUEL TERM
Jun. 26, 2012
SUAL,
Pangasinan 200-500 MW
Coal-fired
7 yrs., extendable upon agreement
of parties
Sual plant
Details of all PSAs
MPower* signs new Power Supply
Agreement
With San Miguel Energy Corp., a subsidiary of San Miguel Corp.
For RES power supply portfolio for Contestable Customers upon Open Access.
*Meralco Retail Electricity Supply business ** Initial contract capacity which shall be increased/ adjusted one month prior to OARC
Sual plant
SIGNING DATE
POWER PLANT / LOCATION
INITIAL CONTRACTED
CAPACITY FUEL TERM
Jun. 26, 2012
SUAL,
Pangasinan 10 MW*
Coal-fired
7 yrs., extendable upon agreement
of parties

Business Updates
Expansion of Bacoor Substation
Completed Jun 15, 2012 Installation of 2nd 83 MVA, 115kV-34.5
kV power transformer bank with 4 new 34.5kV distrn feeders.
Benefits: Addresses critical loading of Bacoor power
transformer bank # 1 (80% in 2011) Provides additional capacity for load growth in
Bacoor and Imus, Cavite Improves switching flexibility during
maintenance and contingencies in the said areas.
Commissioning of Saog Substation
On July 12, 2012 in Brgy. Saog, Marilao, Bulacan
Installation of 83 MVA, 115 kV- 34.5 kV power Transformer initially with 2 new distribution feeders. The other 2 new feeders are still undergoing construction.
Benefits: Improves network reliability, switching flexibility,
and power quality benefiting customers in Valenzuela City, Meycauayan City and municipalities of Marilao and Bocaue.
Addresses prolonged outages due to flooding of Bocaue Substation during typhoons.

Business Updates / Initiatives
Soft launched the Meralco Managed Services (MMS) last June 5-7, 2012 at the Philippine Semiconductor & Electronics Convention and Exhibition.
Showcased the MMS concept during the networking committee comprised of 45 plant facilities and operations managers.
Generated a total of 28 queries with notable customers:
- Light Industrial & Science Park
(LISP)
- Toshiba Information Equip Phil.
Meralco Managed Services
Finalized and approved guidelines, procedures and accreditation rules for launch.
Developed marketing plan and marketing materials, and FAQs for AMC launch day on July 26, 2012.
Conducted AMC Press- briefing in Meralco with a total of 41 representatives from various companies and alliances attended the event.
Accredited Meralco Contractors (AMC)
• Promotion of induction cooking technology
•Offer “Broad C” customers who don’t own ACUs with 0.5HP units via attractive installment scheme and Meralco tested Php5/ hr use measurement.
Bright Ideas
Retooled traditional energy efficiency campaign mandated by ERC into customer lifestyle and revenue generation for Meralco by:
Supported by 360-degree marketing campaign to ensure maximum reach among target segments and heightened consumer awareness.
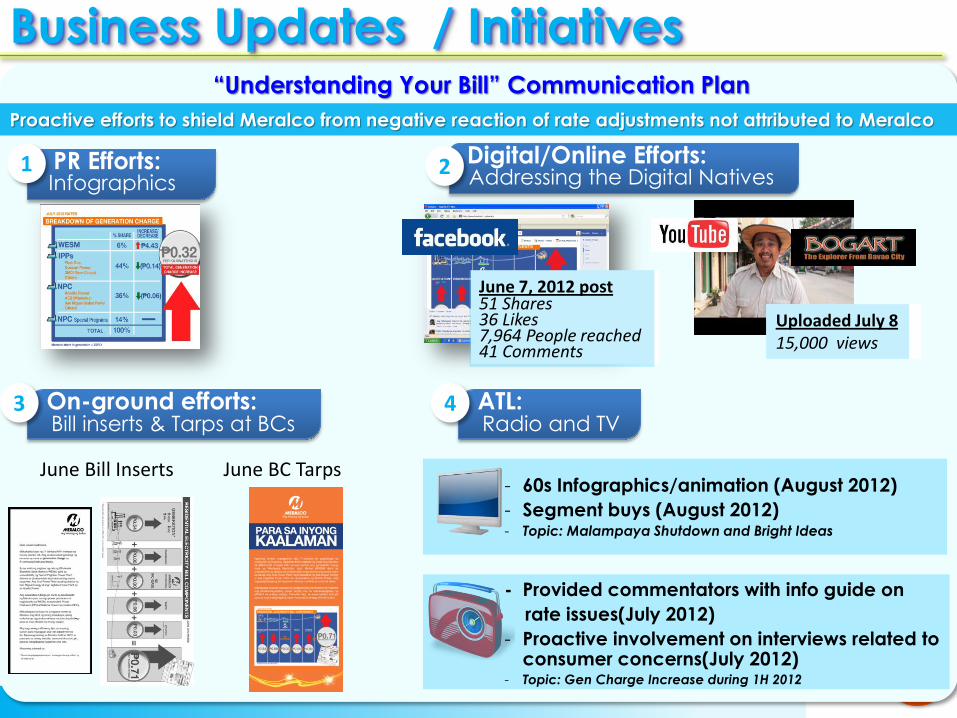
Business Updates / Initiatives “Understanding Your Bill” Communication Plan
Proactive efforts to shield Meralco from negative reaction of rate adjustments not attributed to Meralco
PR Efforts: Infographics
1 Digital/Online Efforts: Addressing the Digital Natives
2
Uploaded July 8 15,000 views
June 7, 2012 post 51 Shares 36 Likes 7,964 People reached 41 Comments
On-ground efforts: Bill inserts & Tarps at BCs
3
June Bill Inserts June BC Tarps
ATL: Radio and TV
4
- 60s Infographics/animation (August 2012)
- Segment buys (August 2012) - Topic: Malampaya Shutdown and Bright Ideas
- Provided commentators with info guide on
rate issues(July 2012)
- Proactive involvement on interviews related to consumer concerns(July 2012)
- Topic: Gen Charge Increase during 1H 2012

Business Updates
2nd Philippine EV Summit, May 24 and 25, at Meralco Theme: “Mobilizing the Region in Electric Vehicle Promotion and Development.” Gathering with stakeholders and EV organization leaders from Japan, Taiwan, and Korea The Summit’s aim: • partnership and investment opportunities between international and local EV providers
• get support push and advocate for the development of EV industry and fast track EV adoption.
e-Vehicle Summit 2012
May 26, 2012 Meralco / One Meralco
Foundation, provided electricity to six schools in Verde Island, Batangas City; provided basic school needs of over 1,000 school children
Special guest: Dep Ed Secretary Bro. Armin Luistro and representatives of Batangas City LGU
Isla Verde School Electrification
Meralco Corporate Wellness center now managed by CSMC Cardinal Santos Medical
Center and Meralco entered into a partnership for the management of Meralco’s Corporate Wellness Center.
CSMC will administer medical services for the Meralco organization.

Business Updates
May 30, 2012, in the latest Corporate Governance Scorecard.
Meralco, one of the 196 listed companies evaluated, received 94.45%, 0.55% shy of “Gold”. - Companies were scored in terms of shareholder rights, equitable treatment of shareholders, role of stakeholders, disclosure and transparency, and board responsibilities.
C O R P O R A T E
G O V E R N A N C E
S C O R E C A R D
2012 Best in Asia on Corporate
Governance 8th Corporate Governance Asia Recognition Awards Jun. 20, 2012, Renaissance Harbour View Hotel, HK For its track record and reform initiatives on
corporate governance for the past 12 months. Meralco received the same recognition from
Corporate Governance (CG) Asia last year. - Signifies the Company’s abiding advocacy to advance corporate governance in Asia.
“Silver” citation from ICD
Meralco’s governance efforts recognized
29 Power Campers graduated last June 26 in a ceremony held at the Lighthouse. −A total of three awards were given: Exemplary Live Case, Best Presenters and Award for Leadership.
−Attended by company key officers and the Power Campers' mentors and supervisors.
Power Academy launching last June 14. − Meralco's support to the national development agenda of DOE and nation's future manpower and technical skills requirement.
−Participated by key leaders of the electric power industry such as DOE, DepED, TESDA, PRC, private DUs and electric cooperatives, members from the university/academe and the MetroPac group that will support the industry growth.
Power Camp Graduation
Power Academy Launching

28
FINANCIAL REPORT
1H2012 Results
Ms. Betty C. Siy-Yap
Senior Vice President and
Chief Finance Officer

FINANCIAL HIGHLIGHTS
29
Net Income: Driven by Robust Electricity Volume and Regulatory Recoveries
Revenues: Overcoming Lower Tariff Levels
EBITDA: Reflecting Improved Performance
Purchased Power Cost: Seeking to Contain Power Prices through Additional Bilateral Contracts
OPEX: Containing Spend through Stringent Costs Discipline
Financial Position: Enhancing Investment Value
Debt Profile: Pre-funding Capital and Investment Commitments
CAPEX: Ensuring System Reliability and Efficiency
Cash Flows: Supporting Overall Business
Return to Shareholders: Delivering Shareholder Expectations

(Amounts In Million Pesos, Except Per Share Data) For the six months ended
June 30
% Increase / (Decrease)
2012 2011
Gross Revenues P 143,600 P122,636 17
Electric 142,464 121,191 18
Non-electric 1,136 1,445 (21)
Costs and Expenses 130,276 113,569 15
Purchased power 117,862 96,133 23
Operations and maintenance expenses 8,783 9,711 (10)
Depreciation and amortization 2,844 2,731 4
Others 787 4,994 (84)
EBITDA 15,750 12,336 28
Income from Continuing Operations 9,674 5,893 64
Income from Discontinued Operations 197 402 (51)
Reported Net Income 9,752 6,091 60
Core Net Income 9,023 7,822 15
EBITDA Margin* 11% 10% 10
Reported Earnings per share P8.65 P5.40 60
Core Earnings per share P8.01 P6.94 15 *Margin on Gross Revenues, inclusive of pass-through charges
30
FINANCIAL PERFORMANCE

7,822
9,023
1H2011 1H2012
Core Net Income
Net Income: Driven by Robust Electricity Volume and Regulatory Recoveries
15% 6,091
9,752
1H2011 1H2012
Reported Net Income
60%
31
• Core Net Income at 9.0B up 15% vs. 2011
Includes approved recovery of long outstanding local franchise taxes paid to 19 cities and provinces • Reported Net Income at 9.8B up 60% vs. 2011 Includes Recognition of gain divestment from Rockwell Land Corporation of P769 million in 2012

EBITDA: Reflecting Improved Performance
12,336
15,750
1H2011 1H2012
EBITDA
14,796
15,061
1H2011 1H2012
Core EBITDA
• 1H EBITDA grew by 28% • 1H EBITDA Margin at 11% in 2012
compared with 10% in 2011 Driven by:
increase in electric revenues contained operating expenses gains from other income items
• Core EBITDA at P15.1B in 2012 • Core EBITDA Margin at 10% in 2012 vs.
12% in 2011
28%
2%
32

73,970
15,439
7,662
24,120
1,445
92,141
16,679
9,254
24,390
1,136
1H2011 1H2012
Revenues: Overcoming Lower Tariff Levels
33
Electric Revenues
• Total revenues was at P143.6B, 17% higher vs. 2011
Electric revenues account for substantially all of the Company’s revenues
Pass-through charges amounted to P118.1B, 22% higher year on year
• Distribution revenue up 1%
Average distribution revenue at P1.50 per kWh vs. P1.63 per kWh in 2011
1H2012 distribution revenue represents 17% of total electric revenue of P142.5B
64% 12%
6%
17%
1%
Generation
Transmission
System Loss
Distribution
Non-Electric

Purchase Power Costs: Seeking to Contain Power Prices through Additional Bilateral Contracts
79,642
100,610
16,491
17,252
1H2011 1H2012
Purchased Power Cost
Generation Transmission
23%
• Purchased power totaled P117.9B in 2012, 23% higher than the P96.1B in 2011 Represents 90% of Total Cost and Expenses Average purchased power cost of P6.69 per
kWh in 2012 versus P5.98 per kWh in 2011 WESM charges per kWh increased by over
100% ranging from P8.05 to P22.45 in 2012 compared with P5.48 to P11.14 in 2011
34
96,133
117,862

• Operating and Maintenance Expenses at P8.8B, 10% lower compared with 2011 Labor and contracted services amounted 6.1B, representing
70 % of total Labor and contracted services increased moderately by 1 % in
2012 Provisions for doubtful accounts at P534M, 74% lower than
2011 Other expenses include recognition of transmission over-
recoveries in the 6-months of 2012 amounting to P793M in 2012
• Depreciation totaled P2.8B, or 4% higher relating to cost of completed capital expenditures
OPEX: Containing Spend through Stringent Costs Discipline
35
9,711
8,783
1H2011 1H2012
Operating and Maintenance Costs
10%
2,731
2,844
1H2011 1H2012
Depreciation and Amortization
4%

Financial Position: Enhancing Investment Value
36
Jun-12 Jun-11 %Chg Dec-11
Cash and cash equivalents 51,648 42,025 23 44,141
Receivables 29,468 26,423 12 29,108
Other current assets 5,513 9,604 (43) 4,175
Utility plant assets and others 106,704 103,467 3 105,510
Investments 3,313 8,282 (60) 2,486
Other noncurrent assets 11,715 7,710 52 6,619
Total Assets 208,361 197,511 5 192,039
Jun-12 Jun-11 %Chg Dec-11
Interest bearing loans 24,881 28,381 (12) 24,443
Customers' deposits 25,115 22,926 10 24,080
Other noncurrent liabilities 33,824 29,454 15 31,447
Trade and other payables 48,969 36,880 33 41,608
Customers' refund 6,164 6,733 (8) 6,250
Dividends payable 726 370 96 557
Other liabilities 3,969 6,070 (35) 4,389
Total Liabilities 143,648 130,814 10 132,774
Equity Attributable to Equity
Holders of Parent 64,472 62,266 4 63,788
Non-controlling Interests 241 4,431 (95) 4,713
Total Equity 64,713 66,697 (3) 68,501
Total Liabilities and Equity 208,361 197,511 5 201,275
• Total assets grew by 5 % in 2012 Higher liquidity accounted for by improved
collection and increased revenues Accounts receivable grew 12% as a result of
higher billed revenues Total trade receivables amounted to P28.7B Utility Plant Assets accounts for 51% of Total
Assets Other noncurrent assets include receivables
from local franchise tax recoverable and generation net under-recoveries
• Total Liabilities grew by 10 % in 2012 Higher trade liabilities to power generators,
NPC and WESM for current period power purchase costs averaging P6.69 per kWh
Interest bearing debt of P24.9 B

Debt Profile: Pre-funding Capital and Investment Commitments
374 766
2,366
189
4,845
2,054
2,984
1,019
2,756
4,115
2
2012 2013 2014 2015 2016 2017 2018 2019 2020 2021 2022
Principal Repayment Schedule*
*Amounts in Million Pesos (PARENT)
2012 2013 2014 2015 2016 2017 2018 2019 2020 2021 2022 Year End Loan Balance
22,914
22,148
19,781
19,592
14,748
12,694
9,710
8,691
5,935
1,820
-
• Consolidated debt balance as at end of 1H2012 at P24.9B All denominated in Philippine Peso
• Average interest rate at 5.7% in 2012 • Debt to EBITDA at 0.81x
37

3,070
4,046
1H2011 1H2012
CAPEX
CAPEX: Ensuring System Reliability and Efficiency
• CAPEX increased by 32% year-on-year
• Major system improvements to address network reliability and system efficiency Expansion of the Bacoor substation Commissioning of the new Saog
Substation Reinforcement of the Carmelray
Industrial Park II-First Philippine Industrial Park 115kV line
Installation of Back-up 33MVA Power transformer at the Carmelray substation
Construction of First Cavite Industrial Estate -Rosario and First Cavite Industrial Estate –Trece Martires City 2 115kV lines
Construction of Cruz Na Daan-San Miguel 69kV line
• Capital Expenditure commitment for the 3rd Regulatory Period of P37.2B
Bacoor Substation expansion
32%
38
Commissioning of Saog Substation

Cash Flows: Supporting Overall Business
18,566 17,750
42,025
51,648
1H2011 1H2012
Cash
Alloted Cash
15,171
11,957
1H2011 1H2012
Free Cash Flow
23%
21%
• Cash from operations amounted to P17.8B
Includes additional cash from collection of approved LFT recoveries
• Cash disbursements for construction in progress and additions to utility plant and others amounted to P2,744M and P1,243M, respectively
• The Parent Company availed of a P3B long-term loan
• Total principal debt repayments and interest costs of P3.7B
• The ending cash balance also includes allotted funds totalling P17.8B for redemption of preferred shares and settlement of various liabilities other than debt repayment
39
Jun-12 Jun-11 Amount %
Cash flows from operating activities
Operating income before working capital changes 20,196 19,454 742 3.8
Net change in working capital 755 1,092 (337) (30.9)
Income tax paid (3,161) (1,753) (1,408) 80.3
Net cash provided by operating activities 17,790 18,793 (1,003) (5.3)
Net cash used in investing activities (4,587) (2,030) (2,557) 126.0
Net cash used in financing activities (5,696) 892 (6,588) (738.6)
Net cash flows from discontinued operations 0 0 0 0.0
Net increase (decrease) in cash and cash equivalents 7,507 17,655 (10,148) (57.5)
Cash balance, beginning 44,141 24,370 19,771 81.1
Cash balance, ending 51,648 42,025 9,623 22.9
(Amounts in Million Pesos)
UNAUDITED Inc (Dec)
For the Six Months Ended Jun-12 vs. Jun-11

Return to Shareholders: Delivering Shareholder Expectations
• Dividend policy: 50% of Core Net Income with a “look back approach” Cash dividend of P9.25
per share was declared and paid out of the 2011 Core Net Income, representing 70% of the year’s earnings
Completed property dividend payment on May 18, 2012
P2.50
P3.45
P4.00
1H2010 1H2011 1H2012
Interim Cash Dividends
40
Interim dividend in 2012 at P4.00 a share to all shareholders of record as at August 29, payable on September 24

REGULATORY
UPDATES
Ivanne G. Del Pena
First Vice President and
Head, Regulatory Management

Retail Competition & Open
Access (RCOA) updates Date Event
14 May DOE issued Circular No. 2012-05-0005 entitled
“Prescribing the General Principles for the
Implementation of Retail Competition and Open
Access” (RCOA)
6 June DOE issued Order No. 2012-06-0009 entitled
“Creating the Technical Working Group to Integrate
Retail Competition and Open Access to the WESM”
26 DEC
Dec. 26, 2012: Target for the start of RCOA

ERC approval of Feed-In Tariffs Chronology
• Dec. 16, 2008 – Republic Act 9513, Renewable Energy (RE) Act, was signed into law
• May 25, 2009 – Implementing Rules & Regulations (IRR) were promulgated
• July 12, 2010 – ERC approved the Feed-In Tariff (FIT) Rules
• May 16, 2011 – The National Renewable Energy Board (NREB) filed a petition for the adoption of Feed-In Tariffs
• July 27, 2012 – ERC announced its ruling on the NREB petition. (The actual decision was not yet available as of this date.)
• Next Step: National Grid Corporation of the Philippines will file a petition to set the FIT-Allowance, a fixed rate/kWh that would be imposed on all end-users to fund the FIT payments to eligible RE generators
(in PhP/kWh) NREB Petition VECO’s Proposal ERC Approval
Run-of-River 6.15 5.75 5.90
Biomass 7.00 6.74 6.63
Wind 10.37 8.05 8.53
Solar 14.95 9.50 9.68
Ocean 17.65 - -
(source: ERC press release)
MPG Project Updates
Aaron A. Domingo
Executive Vice President and
General Manager
Meralco Power Gen Corporation

RP Energy Project Status Site Preparation: 95% complete; full completion by end-Aug; demobilization of workers
and equipment has commenced
EPC: On-going negotiations with the leading bidder; technical specifications have been
finalized; EPC Contract negotiations and finalization to commence on 2 Aug 2012
Transmission Line: Discussions with the NGCP on an optimum interconnection
arrangement are on-going; such discussions are expected to be concluded in early Aug
2012
SBMA Land Lease Agreement: Discussions with SBMA are ongoing
Environmental Compliance Certificate (ECC): Public hearing was held on 29 June with
over 5,000 attendees; public consultations have been completed; final report to be
submitted to the Environmental Management Bureau in early-Aug; issuance of ECC is
expected by Q4 2012
BOI Certification: RPE’s application for incentives under the 2011 IPP list has been
submitted to the BOI Board for consideration; included in the BOI Board agenda on 31
July
Financing: Extended term-sheet negotiations are on-going with the 3 mandated lead
arrangers; lenders’ due diligence work on the Project to commence shortly
Coal Supply: Visits to candidate coal mines in Indonesia were completed in June 2012;
technical assessment is underway with the report from the coal consultant
expected by mid-Aug 2012

MPG Pipeline Projects Status
Aero Derivative Combined Cycle Power Project Status:
Site Acquisition: Asset Purchase closed on July 30, 2011; 2.2-Hectare Land and 2
Fuel Tanks turned over
Environmental Compliance Certificate (ECC): ECC issued by the DENR on October
26, 2011; Multi-partite Monitoring Team (MMT) process ongoing
Interconnection: Distribution Impact Study (DIS) completed on August 8, 2011;
Transmission Line route survey also completed
Project Feasibility: Project should be ready to further advance as soon as Meralco
determines the need for this peaking capacity
Other Pipeline Projects:
Currently in active discussions with potential partners for an LNG-fired power plant
Currently in active discussions for potential partnerships on Coal-fired power plants
ranging from 300MW to 500MW per project

47
This presentation is prepared for the participants of the MERALCO Investors’ Briefing & Teleconference held on July 30, 2012. This presentation has consequential limitations and is not a comprehensive discussion about Manila Electric Company and Subsidiaries (MERALCO). The same materials are restricted to the participants and may only be used in conjunction with the meeting held on such date.
The information contained herein should not be quoted in whole or in part without prior consent of MERALCO. No responsibility to any third party is accepted as the presentation has not been prepared for and is intended for any other purpose.
Accordingly, MERALCO makes no representation or assurance that any projected results based on the use of these information will be realized. Investors should not place undue reliance on these information, though presumed correct at the time of the presentation, are exposed to various risks and competitive uncertainties and contingencies which are beyond MERALCO’s control.
Cautionary Statements

END OF PRESENTATION
Thank You!