2nd FGD on Competitiveness and Innovation_BPO Innoovation Analysis_Dr.alvin Culaba
55
What has held back Philippine competitiveness and growth? • Low savings rate, high population growth rate, and a dismally low total factor productivity (the efficiency with which inputs are combined to produce output) Å due to social infrastructure (norms, laws, gov’t policies and institutions that enforce themÅ shaped by culture and history as conditioned by geographic, climatic, and environmental factors (M. Alba, The Philippines Quest for Long-Term Competitiveness from the Perspective of Growth Economics, AIM Policy Center: 2007 in Macaranas,
-
Upload
shaharyar-rao -
Category
Documents
-
view
85 -
download
1
description
2nd FGD on Competitiveness and Innovation_BPO Innoovation Analysis_Dr.alvin Culaba
Transcript of 2nd FGD on Competitiveness and Innovation_BPO Innoovation Analysis_Dr.alvin Culaba
What has held back Philippine competitiveness and growth?
• Low savings rate, high population growth rate, and a dismally low total factor productivity (the efficiency with which inputs are combined to produce output) due to social infrastructure (norms, laws,gov’t policies and institutions that enforce them shaped by culture and history as conditioned by geographic, climatic, and environmental factors (M. Alba, The Philippines Quest for Long-Term Competitiveness
from the Perspective of Growth Economics, AIM Policy Center: 2007 in
Macaranas,
Case Study on Innovation and Competitiveness:
The Philippine BPO Industry
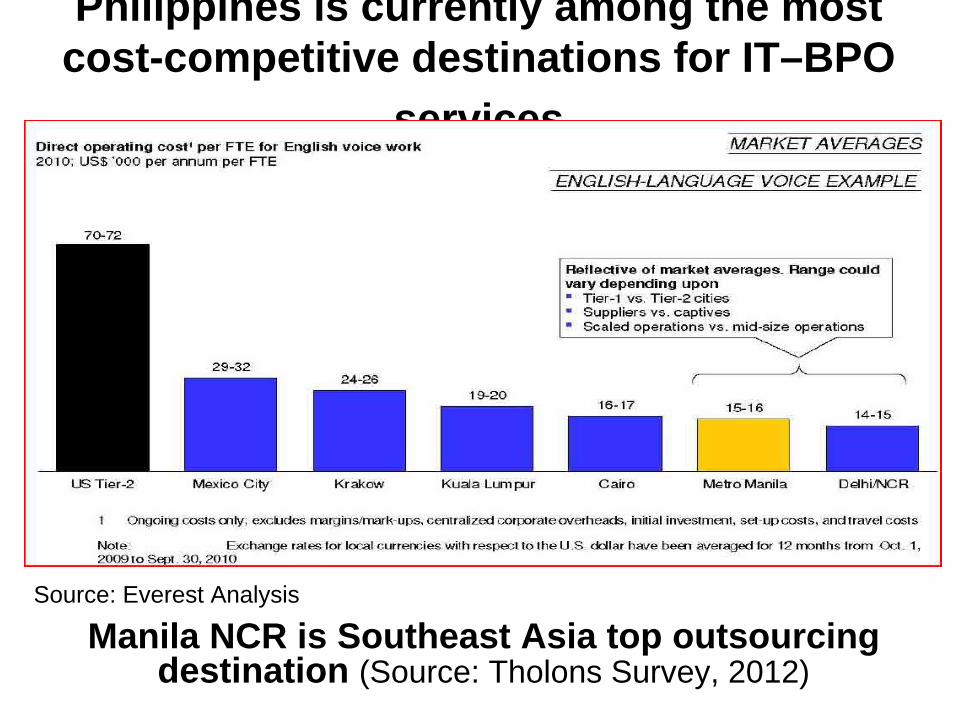
Philippines is currently among the most cost-competitive destinations for IT–BPO
services
Source: Everest Analysis
Manila NCR is Southeast Asia top outsourcing destination (Source: Tholons Survey, 2012)

Working Definitions
• BPO refers to a broad range of business outsourcing activity with the end view of improving one’s process
• BPO is “the delegation of one or more IT- intensive business processes to an external provider that, in turn, owns, administrates and manages the selected process based on a defined and measurable performance metrics”. (Def. from Gartner Dataquest)
• A BPO company enters into a contract with another organization to operate and manage
f it b i
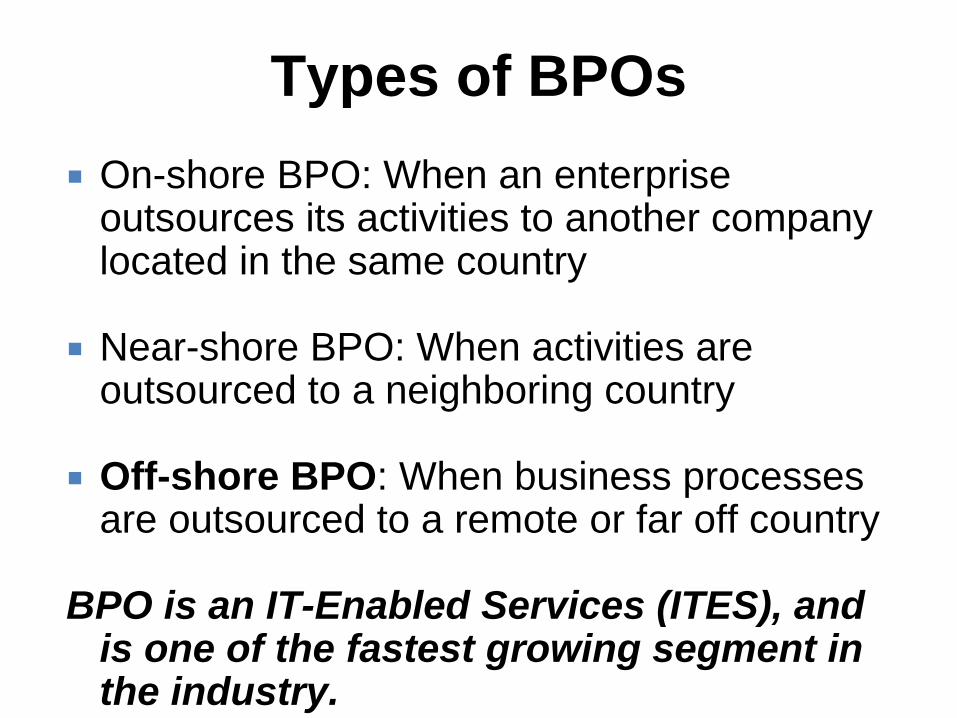
Types of BPOsOn-shore BPO: When an enterpriseoutsources its activities to another company located in the same country
Near-shore BPO: When activities are outsourced to a neighboring country
Off-shore BPO: When business processes are outsourced to a remote or far off country
BPO is an IT-Enabled Services (ITES), and is one of the fastest growing segment in the industry.
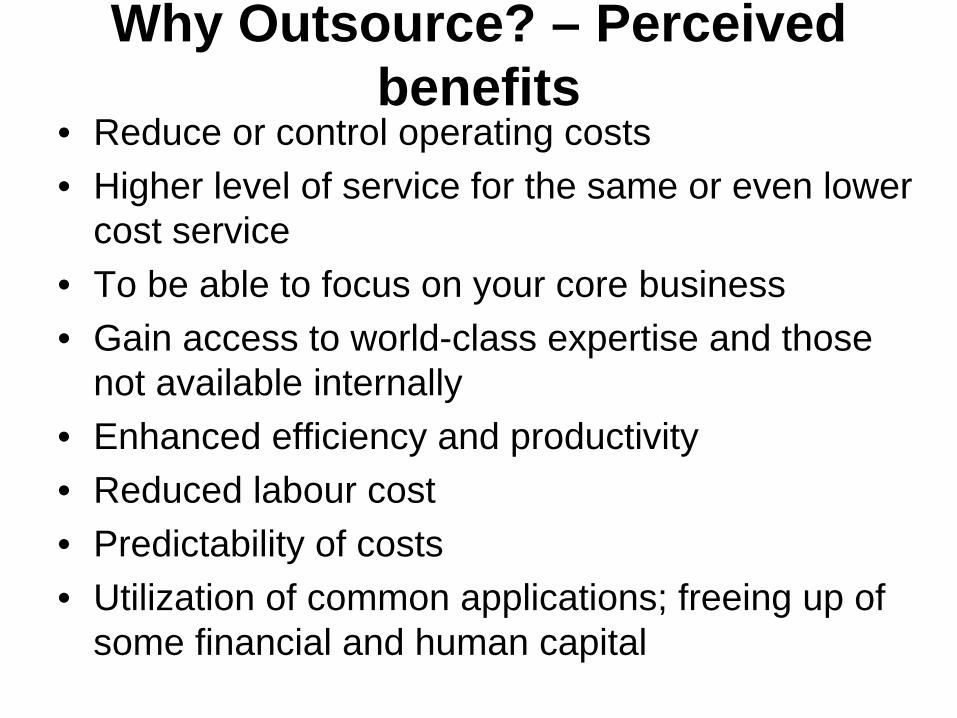
Why Outsource? – Perceived benefits
• Reduce or control operating costs• Higher level of service for the same or even lower
cost service• To be able to focus on your core business• Gain access to world-class expertise and those
not available internally• Enhanced efficiency and productivity• Reduced labour cost• Predictability of costs• Utilization of common applications; freeing up of
some financial and human capital
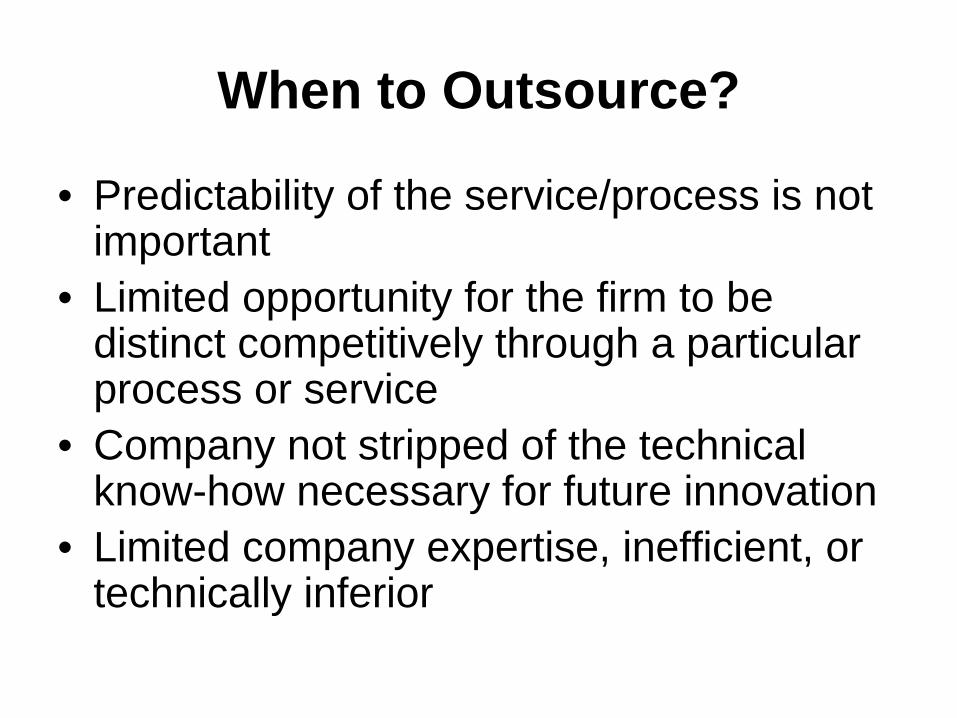
When to Outsource?
• Predictability of the service/process is not important
• Limited opportunity for the firm to be distinct competitively through a particular process or service
• Company not stripped of the technical know-how necessary for future innovation
• Limited company expertise, inefficient, or technically inferior
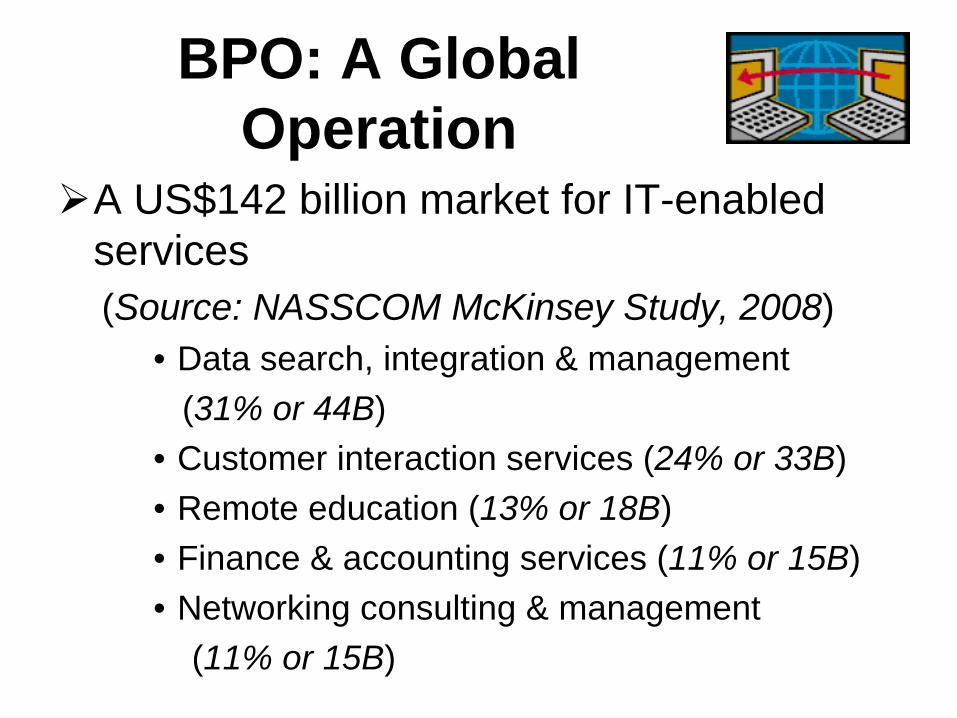
BPO: A Global Operation
A US$142 billion market for IT-enabled services(Source: NASSCOM McKinsey Study, 2008)
• Data search, integration & management (31% or 44B)
• Customer interaction services (24% or 33B)• Remote education (13% or 18B)• Finance & accounting services (11% or 15B)• Networking consulting & management
(11% or 15B)
BPO: A Global Operation
A US$142 billion market for IT-enabled services(Source: NASSCOM McKinsey Study, 2008)
– Others: (12% or 16B) • Translation, transcription & localization (2B)• Engineering & design (1B)• HR services (5B)• Website services (5B)• Market research (3B)
IT-BPO industry to increase from US$500 billion in 2009 to US$1.5 trillion in 2024 (Tholons, 2011)

Profile of the BPO Industry in the Philippines
• Most attractive global provider of IT- BPO services in Asia (Economist Survey: M. Alan in MBOL May 29, 2012)
• IT-BPO revenues for the Philippines reached US$11 billion and 640,000 direct employees in 2011 (BPAP, 2012)
• Key driver of economy; fastest growing source of employment and revenue (DTI 2012)
Profile of the BPO Industry in the Philippines
• IT-BPO revenues for the Philippines reached US$11 billion and 640,000 direct employees in 2011 (BPAP, 2012)
• Contact center, more than 50% of revenues, is key driver of industry growth; outpaced India(BSP in ABS-CBN.com April 6, 2012)
• 30% share of US market; 20% of Asia- Pacific; 8% of global market (BOI in SRI, 2012)
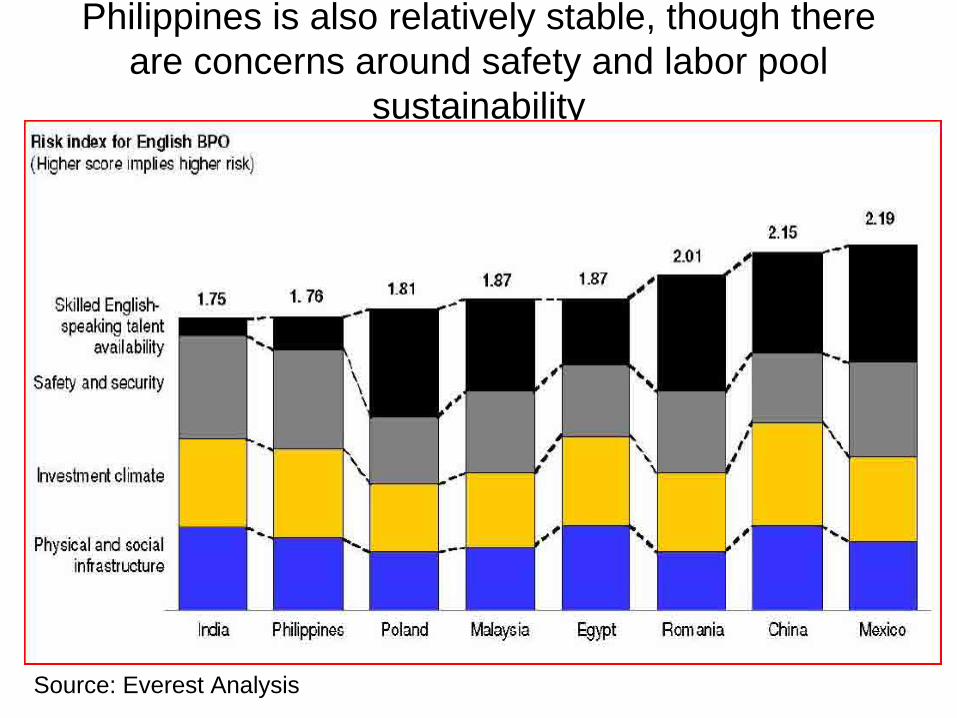
Philippines is also relatively stable, though there are concerns around safety and labor pool
sustainability
Source: Everest Analysis
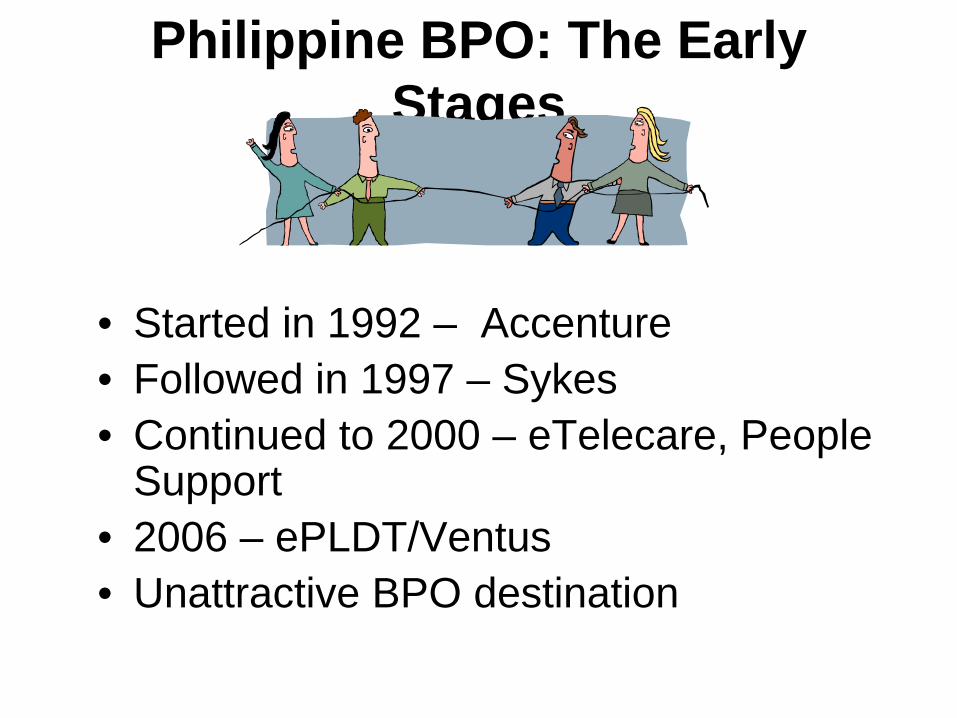
Philippine BPO: The Early Stages
• Started in 1992 – Accenture• Followed in 1997 – Sykes • Continued to 2000 – eTelecare, People
Support• 2006 – ePLDT/Ventus• Unattractive BPO destination

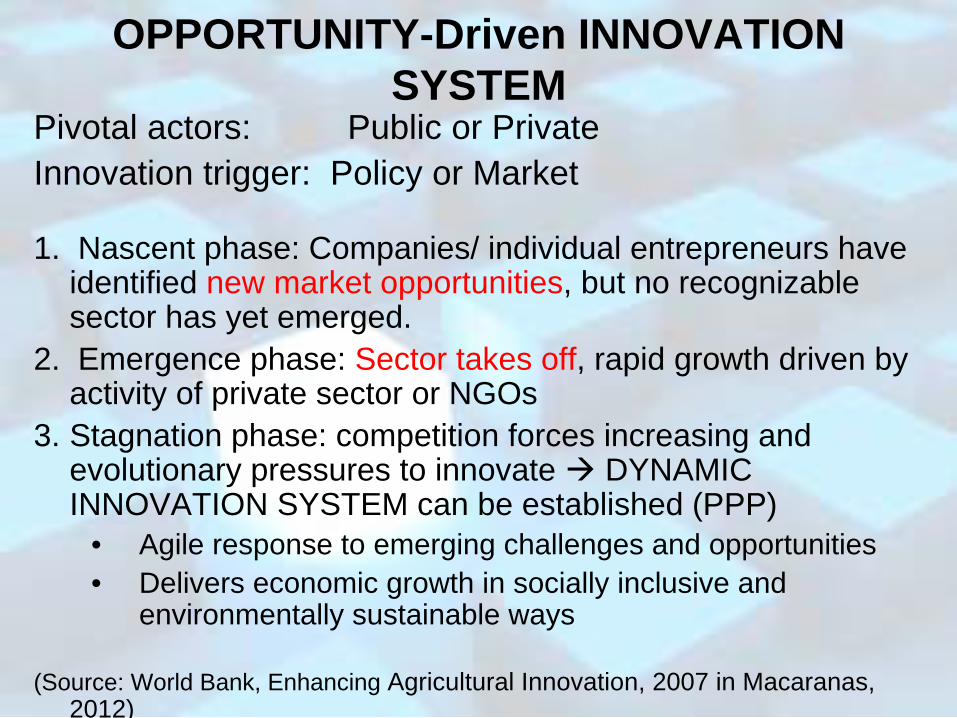
OPPORTUNITY-Driven INNOVATION SYSTEM
Pivotal actors: Public or PrivateInnovation trigger: Policy or Market
1. Nascent phase: Companies/ individual entrepreneurs have identified new market opportunities, but no recognizable sector has yet emerged.
2. Emergence phase: Sector takes off, rapid growth driven by activity of private sector or NGOs
3. Stagnation phase: competition forces increasing and evolutionary pressures to innovate DYNAMIC INNOVATION SYSTEM can be established (PPP)
• Agile response to emerging challenges and opportunities• Delivers economic growth in socially inclusive and
environmentally sustainable ways
(Source: World Bank, Enhancing Agricultural Innovation, 2007 in Macaranas, 2012)
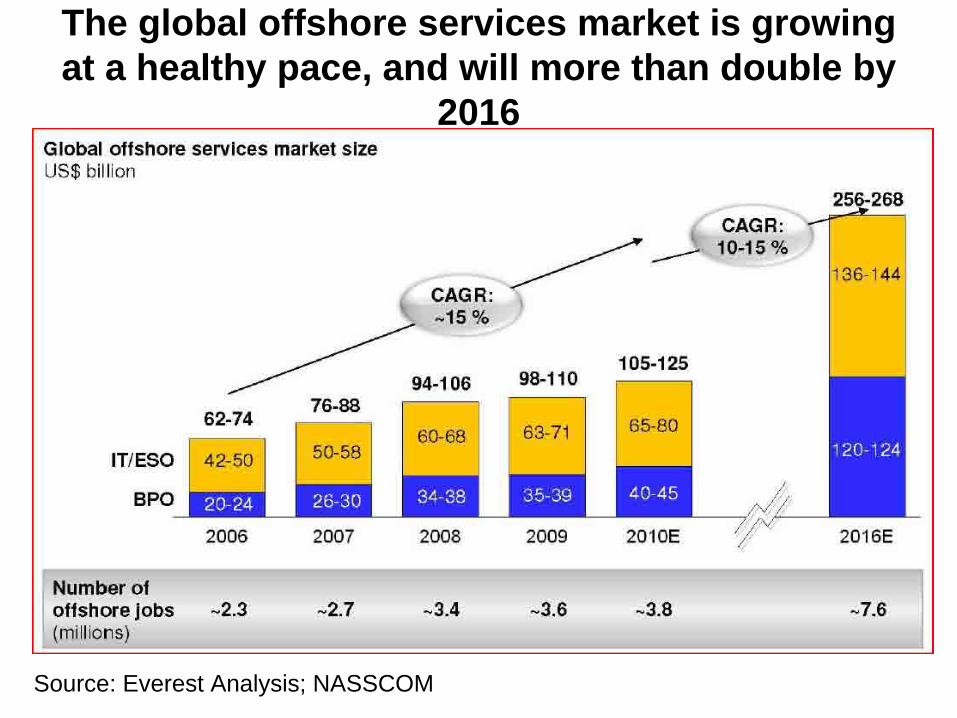
The global offshore services market is growing at a healthy pace, and will more than double by
2016
Source: Everest Analysis; NASSCOM
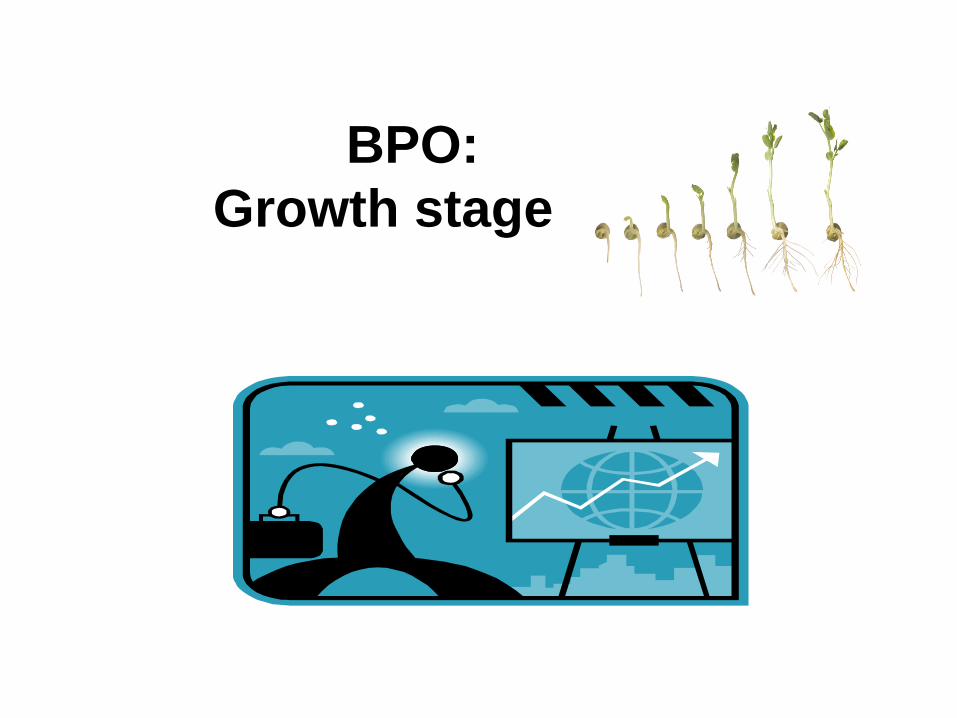
BPO: Growth stage
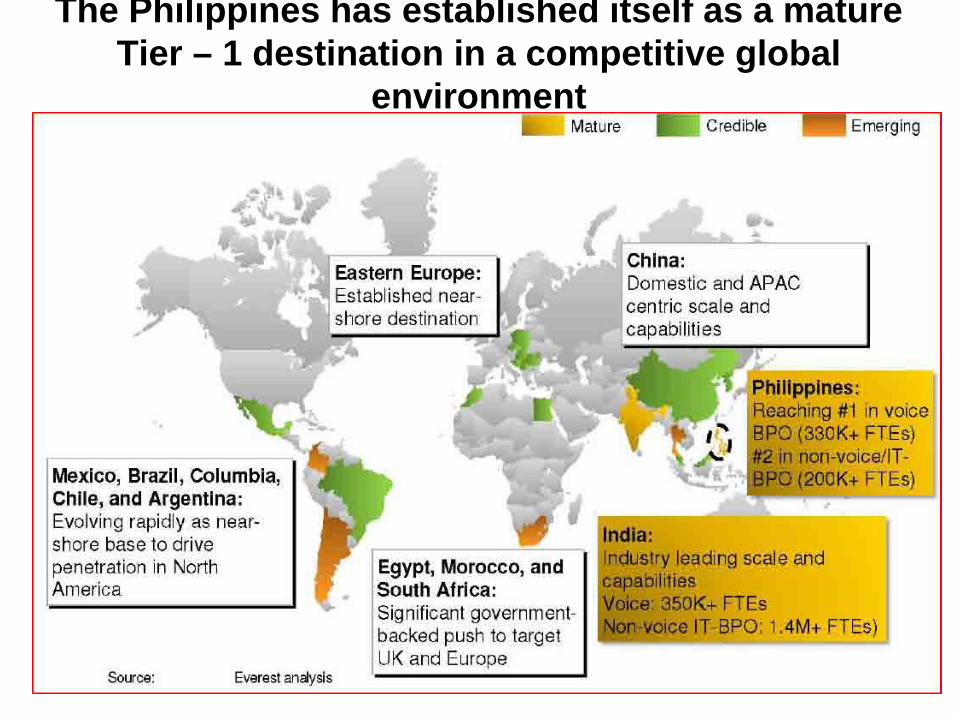
The Philippines has established itself as a mature Tier – 1 destination in a competitive global
environment

ORCHESTRATED INNOVATION SYSTEMPivotal actors: Public or PrivateInnovation trigger: Policy or Market
1. Pre-planned phase: no research or policy made, no opportunities identified
2. Foundation phase: priority sectors/commodities identified, government supports research and policy intervention, but have limited effect on growth.
3. Expansion phase: government intervenes with projects and special programs to link actors in the innovation system DYNAMIC INNOVATION SYSTEM can be established (PPP)
(Source: World Bank, Enhancing Agricultural Innovation, 2007 in Macaranas, 2012)
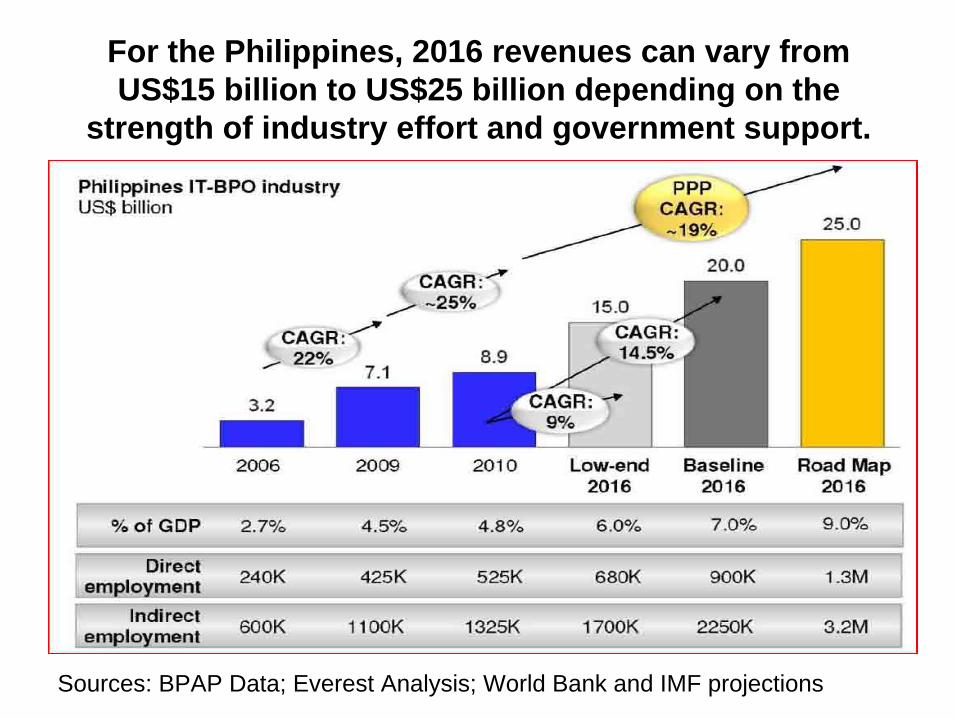
For the Philippines, 2016 revenues can vary from US$15 billion to US$25 billion depending on the
strength of industry effort and government support.
Sources: BPAP Data; Everest Analysis; World Bank and IMF projections
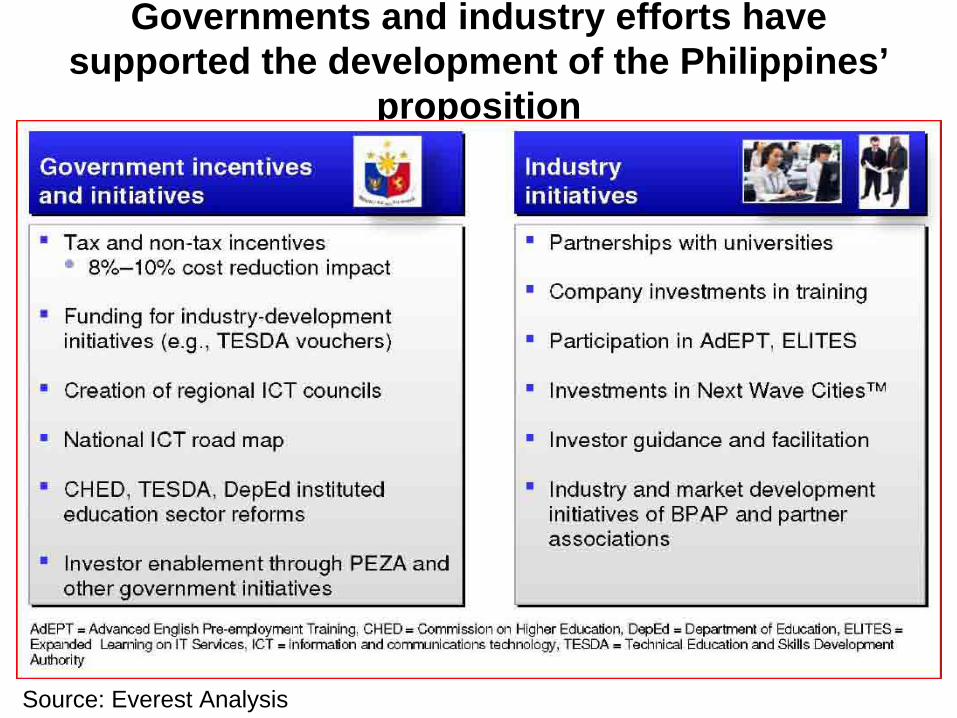
Governments and industry efforts have supported the development of the Philippines’
proposition
Source: Everest Analysis
Support the “Whole-of- Government Approach” but
innovations carried out by the private sector (consistent with the
World Bank observation).
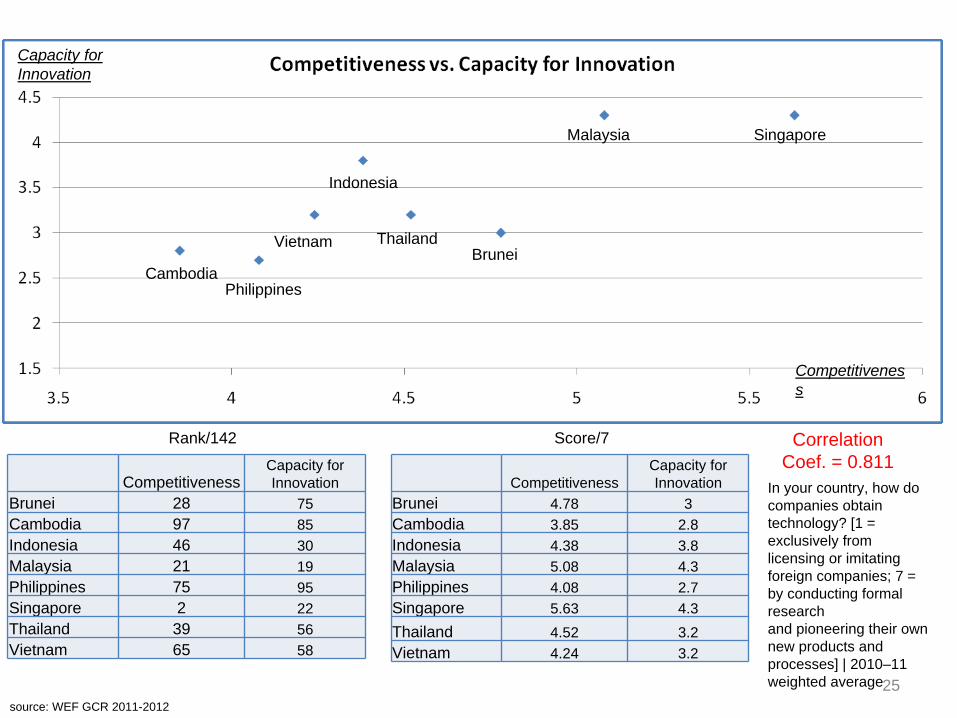
Capacity for Innovation
Competitivenes s
CompetitivenessCapacity for Innovation
Brunei 28 75Cambodia 97 85Indonesia 46 30Malaysia 21 19Philippines 75 95Singapore 2 22Thailand 39 56Vietnam 65 58
Competitiveness Capacity for Innovation
Brunei 4.78 3Cambodia 3.85 2.8Indonesia 4.38 3.8Malaysia 5.08 4.3Philippines 4.08 2.7Singapore 5.63 4.3Thailand 4.52 3.2Vietnam 4.24 3.2
In your country, how do companies obtain technology? [1 = exclusively from licensing or imitating foreign companies; 7 = by conducting formal researchand pioneering their own new products and processes] | 2010–11 weighted average
source: WEF GCR 2011-2012
CambodiaPhilippines
Vietnam
Indonesia
ThailandBrunei
Malaysia Singapore
Rank/142 Score/7
25
Correlation Coef. = 0.811

This create multiple opportunities to drive the next
wave of growth for the Philippines
Source: Everest Analysis

While voice and IT – ESO continue to grow,
non–voice BPO will drive market growth
Source: Everest Analysis

What’s at stake under various scenarios?
Source: Everest Analysis

What does the Road Map 2016 (PPP) target of US$ 25 billion in IT/BPO revenue mean to the
Philippines?
Source: Everest Analysis

Larger tax base with even larger multiplier effects through consumption
Sources: National Statistics Office; Team Analysis
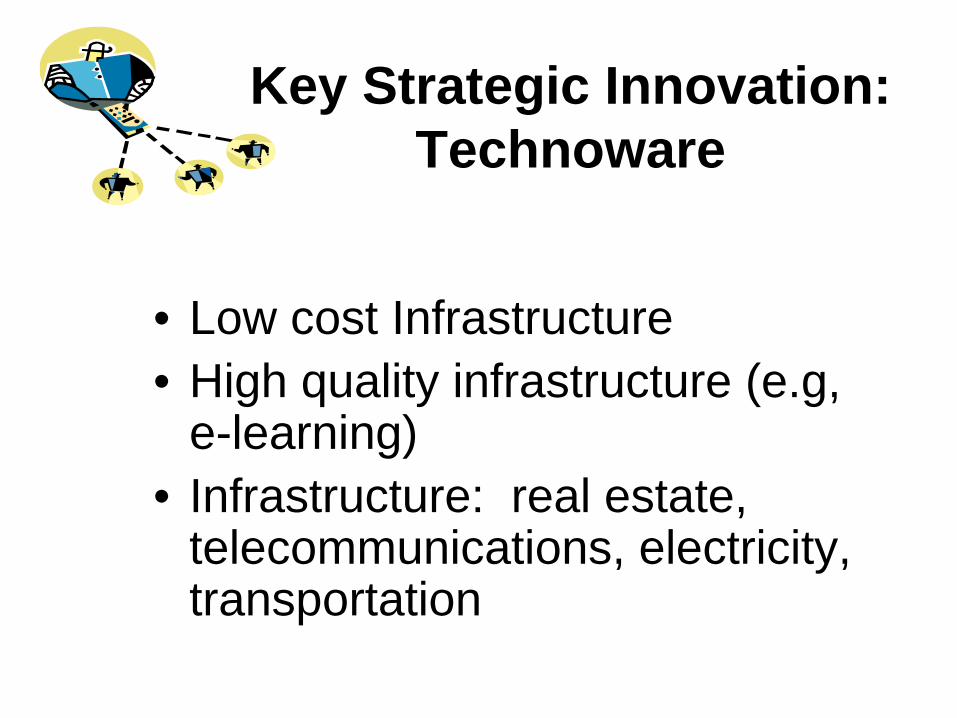
Key Strategic Innovation: Technoware
• Low cost Infrastructure• High quality infrastructure (e.g,
e-learning)• Infrastructure: real estate,
telecommunications, electricity, transportation
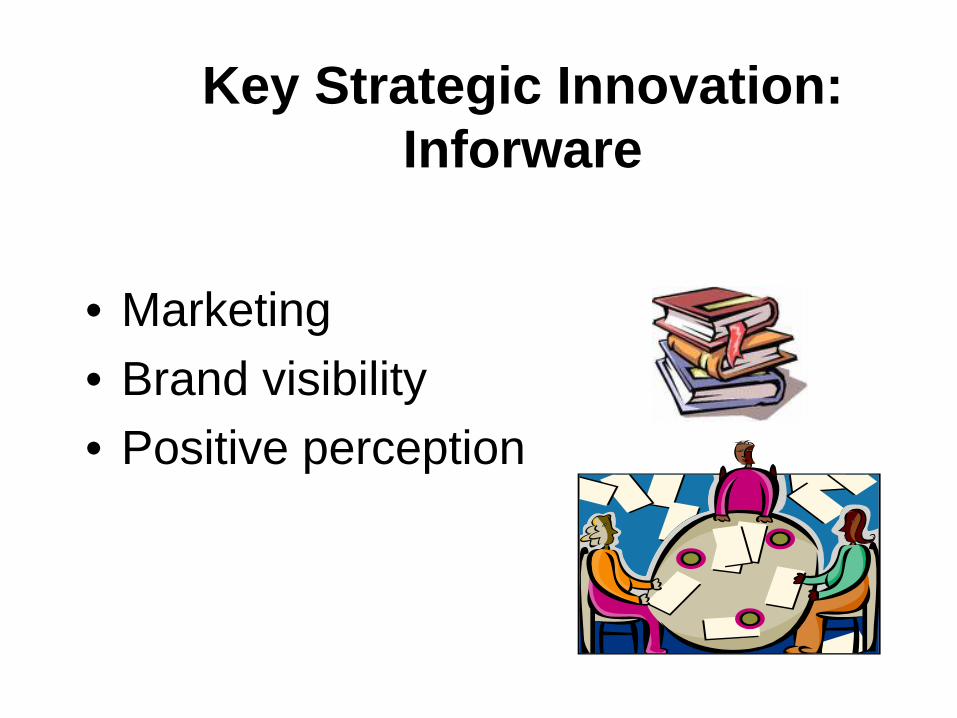
Key Strategic Innovation: Inforware
• Marketing• Brand visibility• Positive perception
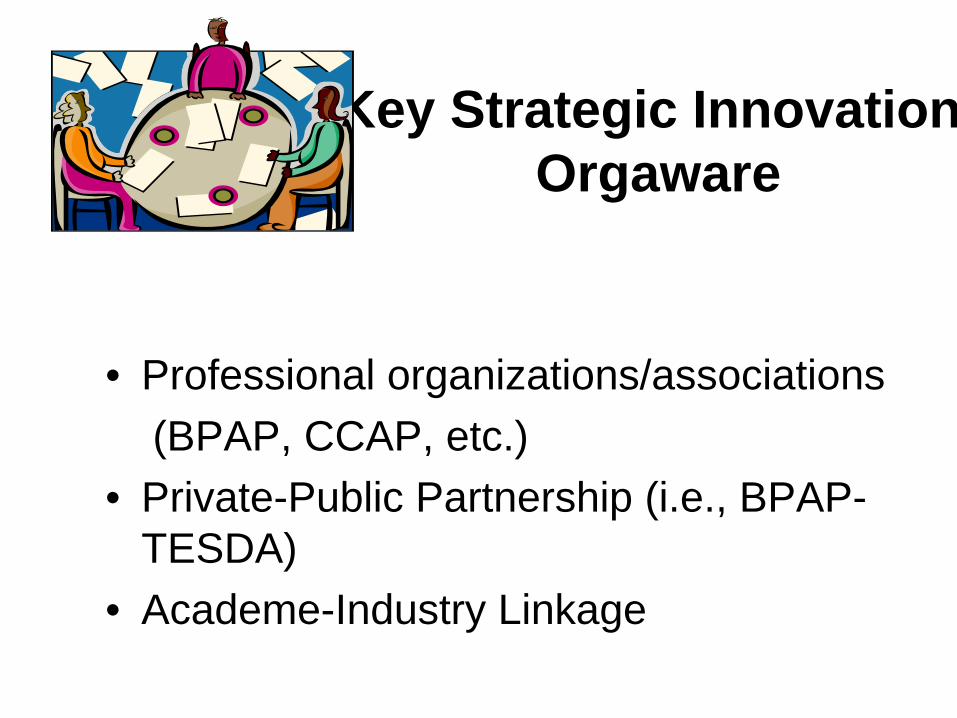
Key Strategic Innovation Orgaware
• Professional organizations/associations(BPAP, CCAP, etc.)
• Private-Public Partnership (i.e., BPAP- TESDA)
• Academe-Industry Linkage

Key Strategic Innovation: Humanware
• Skills (technical, language)• Skills set (effective communication, right
attitudes)• Educated pool (KPO)• Domain expertise (process-specific)• Project management; qualified labor
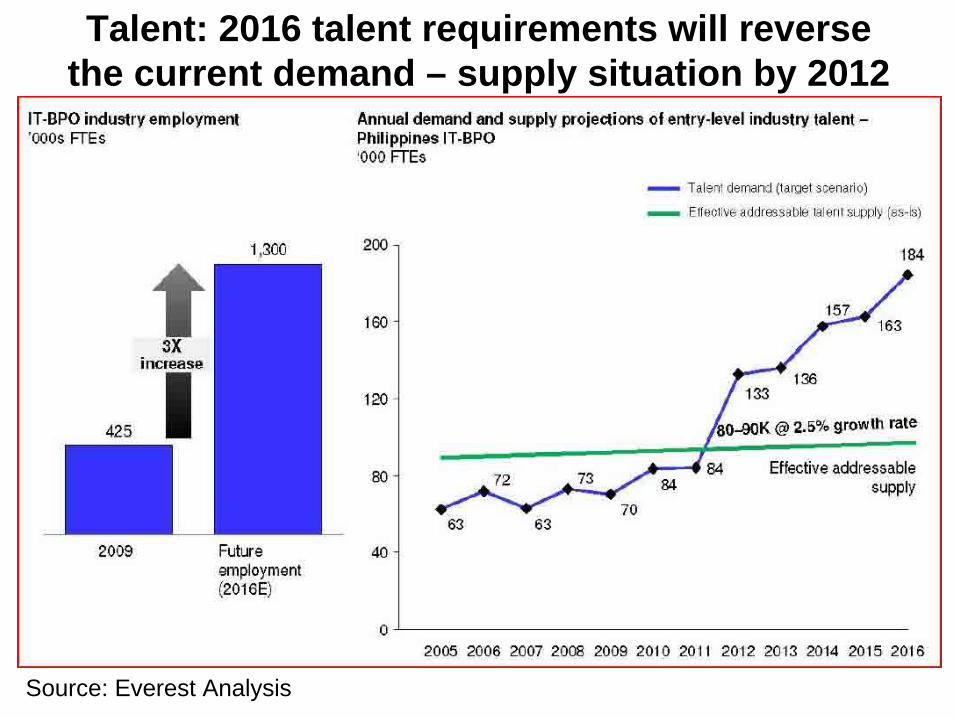
Talent: 2016 talent requirements will reverse the current demand – supply situation by 2012
Source: Everest Analysis

source: WEF GCR 2011-2012
RANK
Availability of latest
technologies InnovationBrunei 70 68Cambodia 98 85Indonesia 74 36Malaysia 35 24Philippines 62 108Singapore 17 8Thailand 82 54Vietnam 133 66
Score
Availability of latest technologies Innovation
Brunei 5 3.15Cambodia 4.5 3Indonesia 4.9 3.59Malaysia 5.8 4.32Philippines 5.2 2.79Singapore 6.3 5.33Thailand 4.8 3.3Vietnam 3.8 3.16
CambodiaPhilippine s
Vietnam
Indonesia
Thailand Brunei
Malaysia
Singapore
Availability of latest technologies
Innovation
To what extent are the latest technologies available in your country? [1 = not available; 7 = widely available] | 2010–11 weighted average
Rank/142 Score/7
36
Correlation Coef. = 0.838
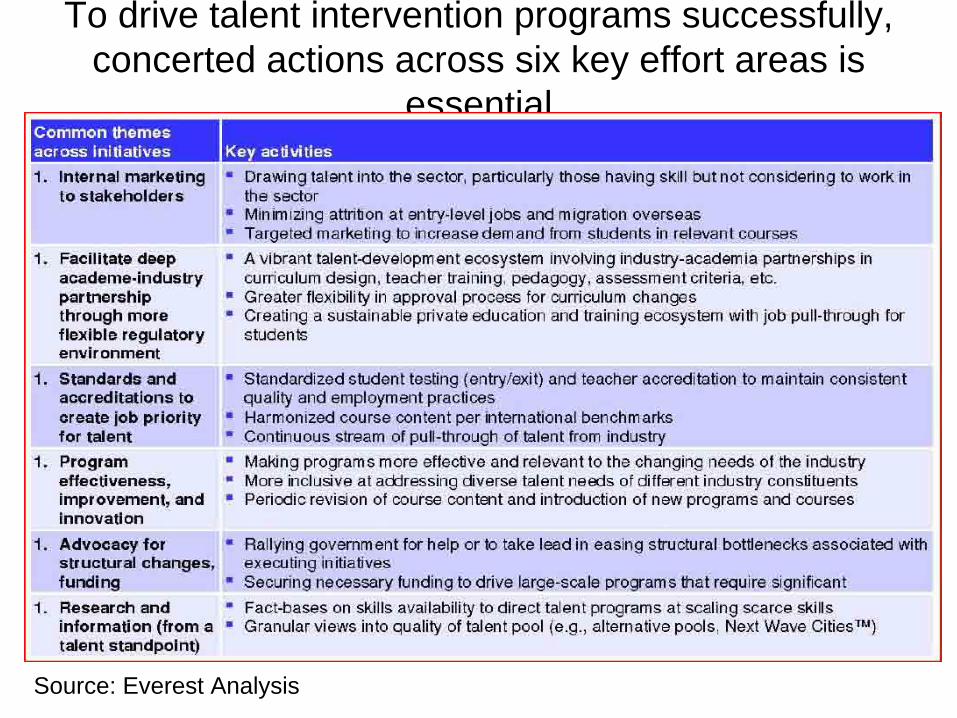
To drive talent intervention programs successfully, concerted actions across six key effort areas is
essential
Source: Everest Analysis

Competitiveness InnovationBrunei 28 68Cambodia 97 85Indonesia 46 36Malaysia 21 24Philippines 75 108Singapore 2 8Thailand 39 54Vietnam 65 66
Competitivenes s Innovation
Brunei 4.78 3.15Cambodia 3.85 3Indonesia 4.38 3.59Malaysia 5.08 4.32Philippines 4.08 2.79Singapore 5.63 5.33Thailand 4.52 3.3Vietnam 4.24 3.16
Innovation
Competitivenes s
CambodiaPhilippines
Vietnam
Indonesia
Rank/142
Thailand Brunei
Malaysia
Singapore
Score/7
source: WEF GCR 2011-2012
38
Correlation Coef. = 0.909
Competitiveness as the set of institutions, policies, and factors that determine the level of productivity of a country.InnovationImproving Institutions, building Infrastructure, reducing macroeconomic instability, improving human capital, efficiency of the labor, financial and good markets.
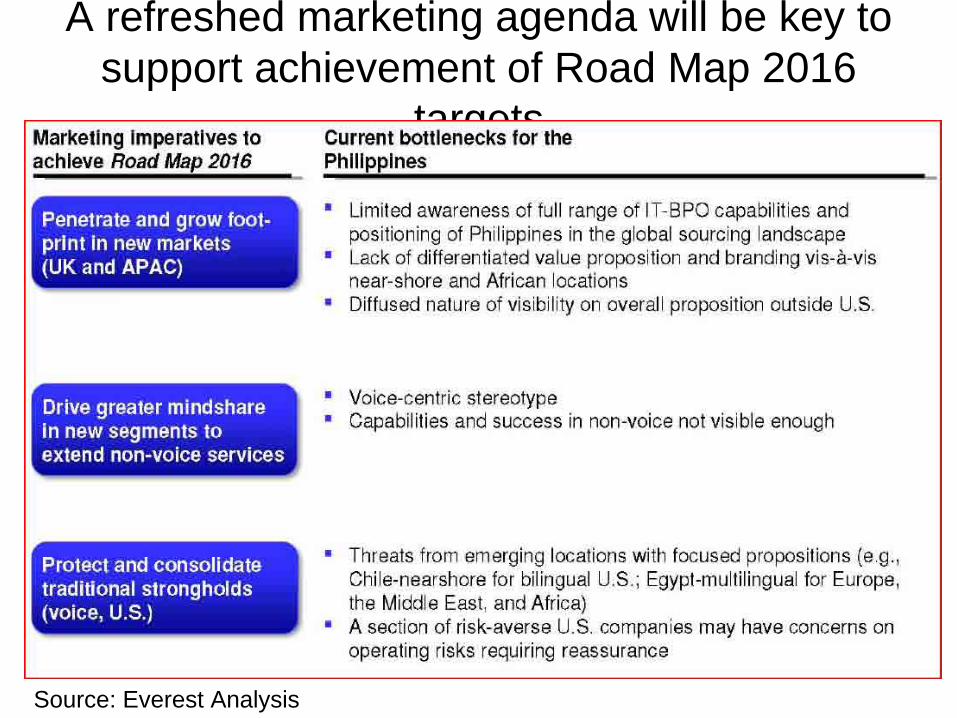
A refreshed marketing agenda will be key to support achievement of Road Map 2016
targets
Source: Everest Analysis
Process Innovations
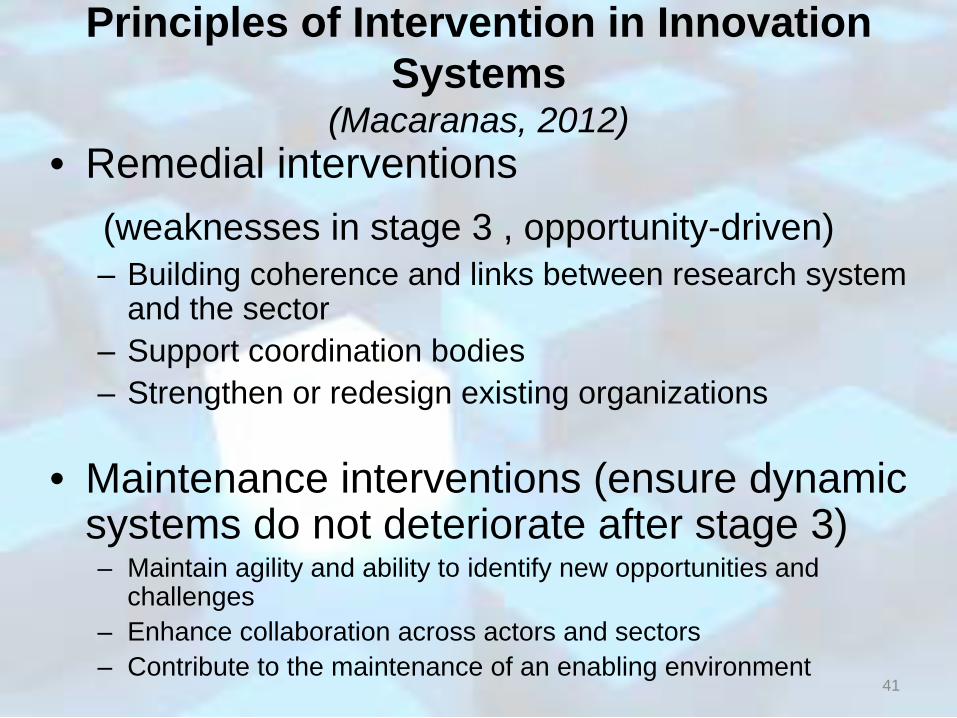
Principles of Intervention in Innovation Systems
(Macaranas, 2012)• Remedial interventions
(weaknesses in stage 3 , opportunity-driven)– Building coherence and links between research system
and the sector– Support coordination bodies– Strengthen or redesign existing organizations
• Maintenance interventions (ensure dynamic systems do not deteriorate after stage 3)– Maintain agility and ability to identify new opportunities and
challenges– Enhance collaboration across actors and sectors– Contribute to the maintenance of an enabling environment
41
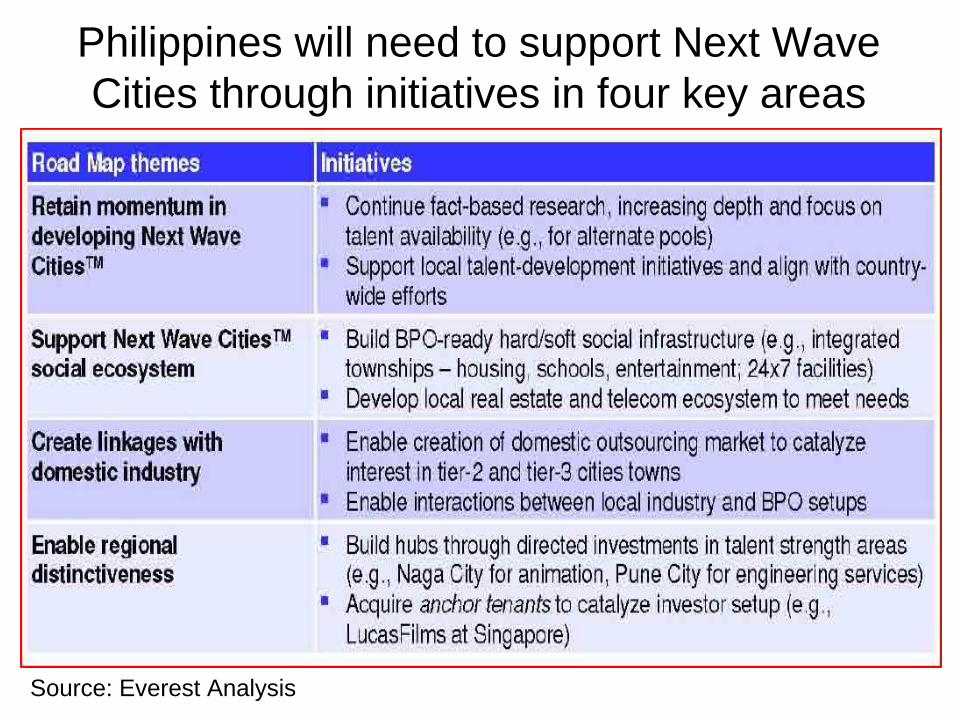
Philippines will need to support Next Wave Cities through initiatives in four key areas
Source: Everest Analysis
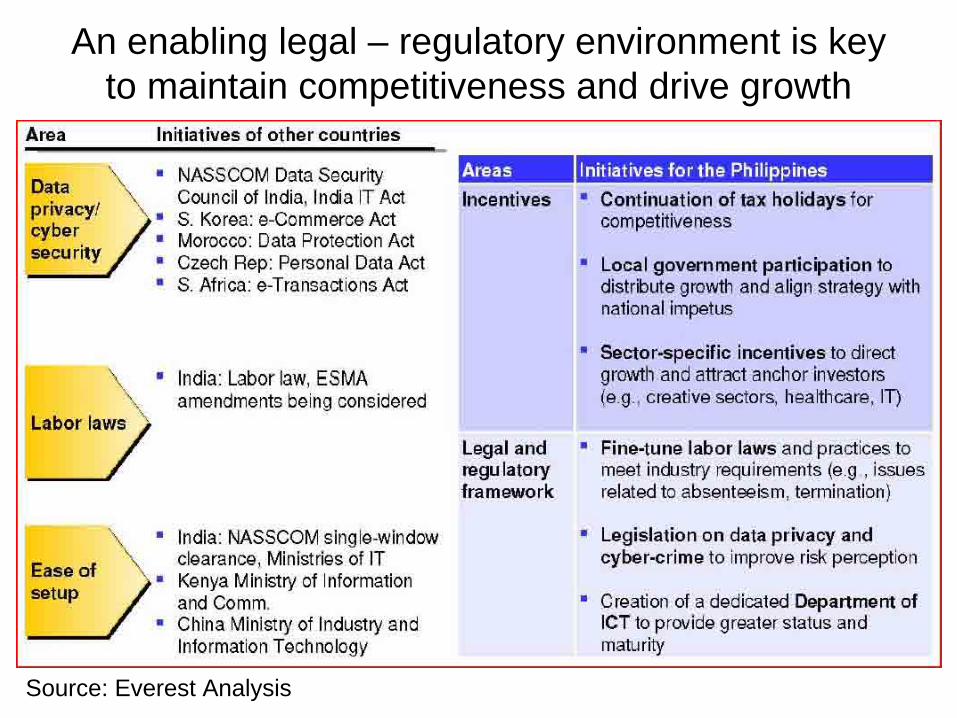
An enabling legal – regulatory environment is key to maintain competitiveness and drive growth
Source: Everest Analysis

Key Competitiveness Strategy of the BPO Industry
Cost focus
Labor cost All-in costs(Manageable) inflation
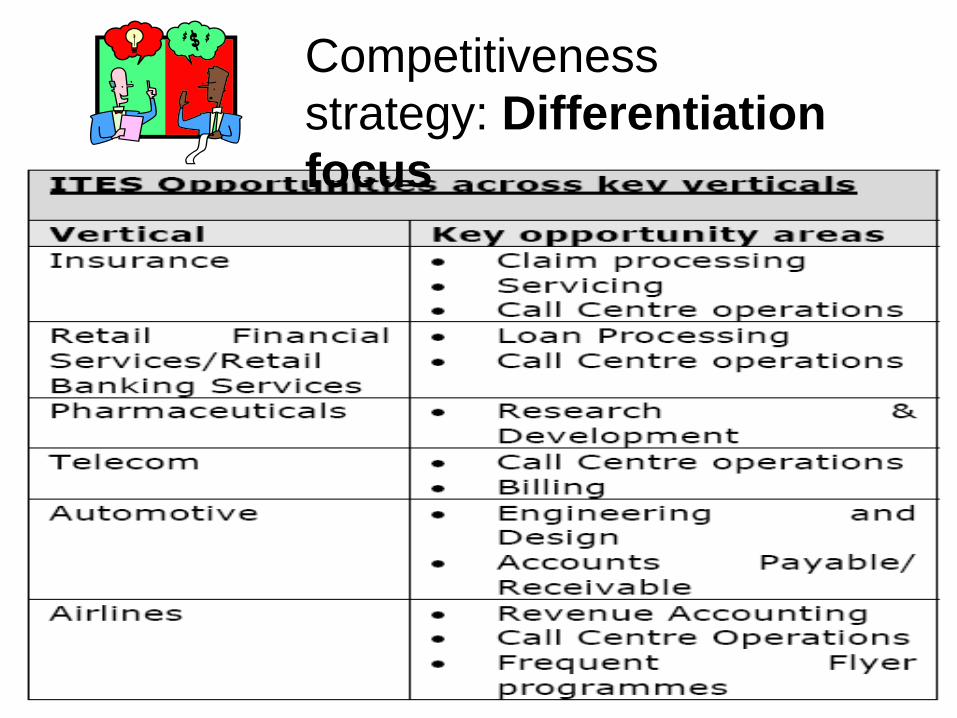
Competitiveness strategy: Differentiation focus
Summary
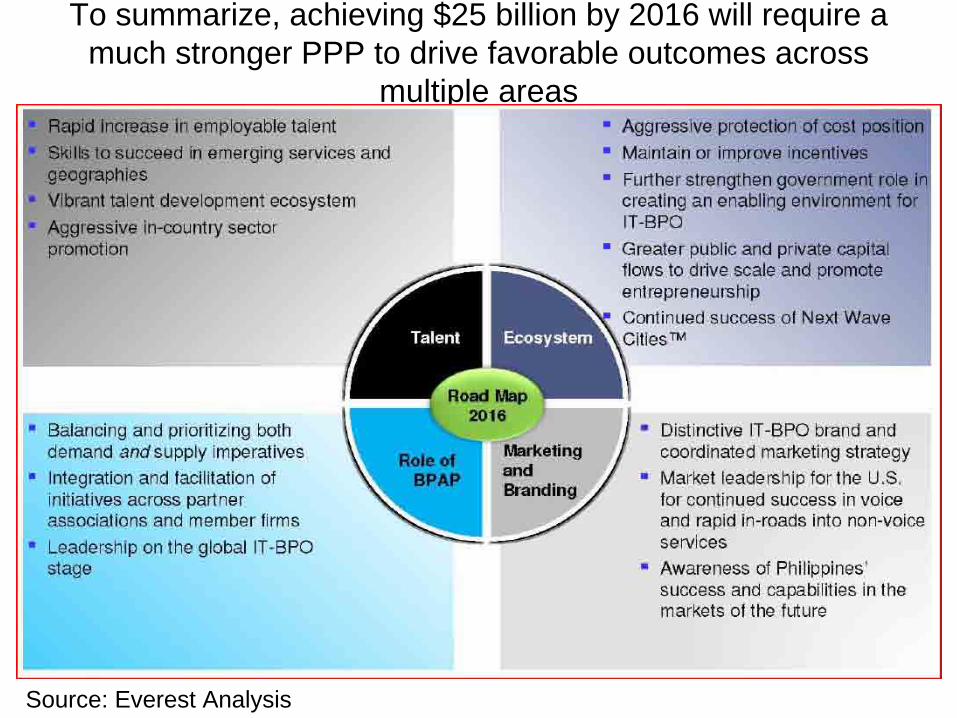
To summarize, achieving $25 billion by 2016 will require a much stronger PPP to drive favorable outcomes across
multiple areas
Source: Everest Analysis
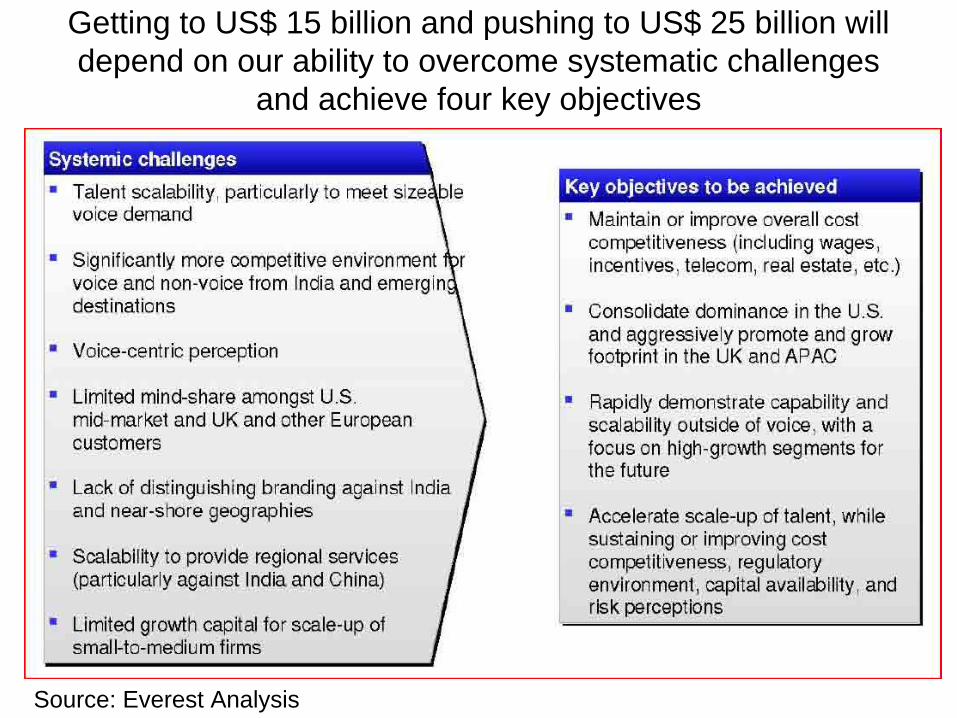
Getting to US$ 15 billion and pushing to US$ 25 billion will depend on our ability to overcome systematic challenges
and achieve four key objectives
Source: Everest Analysis
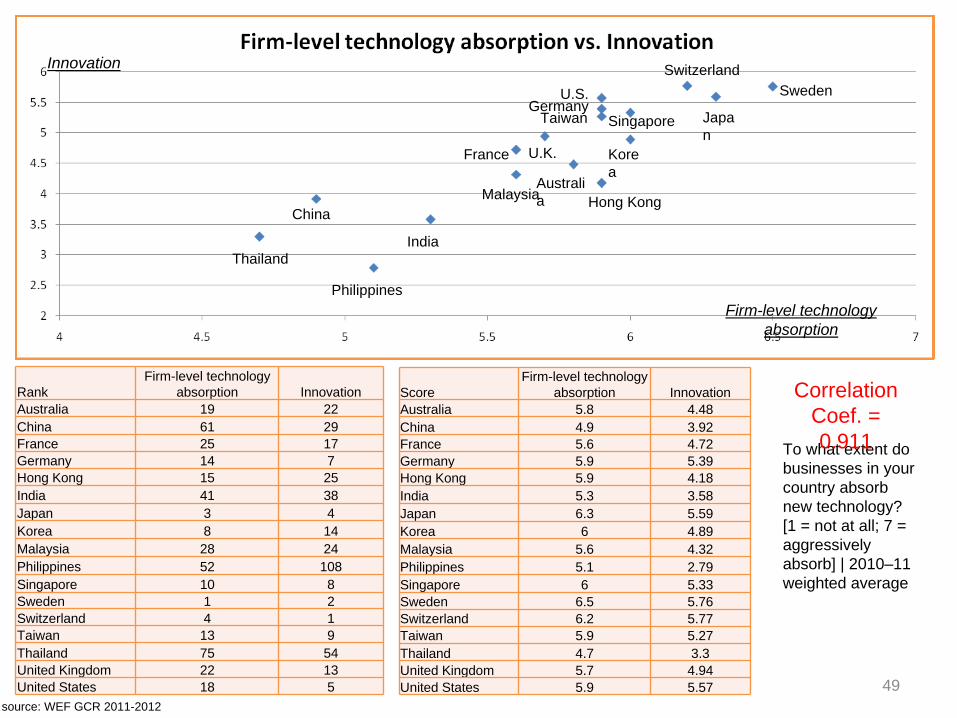
source: WEF GCR 2011-2012
RankFirm-level technology
absorption InnovationAustralia 19 22China 61 29France 25 17Germany 14 7Hong Kong 15 25India 41 38Japan 3 4Korea 8 14Malaysia 28 24Philippines 52 108Singapore 10 8Sweden 1 2Switzerland 4 1Taiwan 13 9Thailand 75 54United Kingdom 22 13United States 18 5
ScoreFirm-level technology
absorption InnovationAustralia 5.8 4.48China 4.9 3.92France 5.6 4.72Germany 5.9 5.39Hong Kong 5.9 4.18India 5.3 3.58Japan 6.3 5.59Korea 6 4.89Malaysia 5.6 4.32Philippines 5.1 2.79Singapore 6 5.33Sweden 6.5 5.76Switzerland 6.2 5.77Taiwan 5.9 5.27Thailand 4.7 3.3United Kingdom 5.7 4.94United States 5.9 5.57
Philippines
IndiaThailand
China
Kore a
Malaysia
France
Taiwan
Hong Kong
U.K.
U.S. SwedenSwitzerland
Germany
Australi a
Singapore Japa n
Firm-level technology absorption
Innovation
To what extent do businesses in your country absorb new technology? [1 = not at all; 7 = aggressively absorb] | 2010–11 weighted average
49
Correlation Coef. = 0.911

Going forward, BPAP’s role will need to evolve to drive impact to support Road Map 2016
Source: Philippine IT-BPO Road Map 2016, Commission on Information and Communications Technology , Business Processing Association of the Philippines, Everest Global and Outsources, Philippines 2010

Competitiveness with Inclusive Growth: Innovation in the Philippines
H(Human)
K(Physical
)
R(Natural)
HKR CapitalHKR CapitalHKR Capital
IdeasIdeasIdeas
ThingsThingsThings
InputsInputsInputsDemand(consumers) Demand(consumers) Demand(consumers)
Firm Rivalry, Structure and
Strategy
Firm Rivalry, Structure and
Strategy
Firm Rivalry, Structure and
Strategy
Related and SupportingIndustries
Related and SupportingIndustries
Related and SupportingIndustries
Compe-titivenes
sInputsInputsInputs
Inclusive
Growth*
Gov’tor
PPP
Gov’tor
PPP
Gov’tor
PPP
NCC FrameworkNCC FrameworkNCC Framework
WelfareWelfareWelfare
b. Reducing distortions favoring K
a. Addressing misgovernance & corruption
d. Strengthening regulation
c. Correcting market failures hurting H and R
Financial Markets
Quality of GrowthQuality of GrowthQuality of Growth
* Quality Growth (WB)a.Addressing misgovernance and corruptionb.Reducing distortions favoring Kc.Correcting market failures hurting H and Rd.Strengthening regulation
Gov’t / PPP Gov’t / PPP Gov’t / PPP
Gov’t / PPP Gov’t / PPP Gov’t / PPP
Gov’t / PPP Gov’t / PPP Gov’t / PPP
Gov’t / PPP Gov’t / PPP Gov’t / PPP
Source: Adapted from Macaranas, 2012

Innovation, Brand Image
Knowledge,Technology Based
Capital-Intensive
Labor-Intensive
Physical Resource-Based
Japan,U.S.A.
Korea, HongKongSingapore,
Taiwan
ThailandMalaysia,
Brunei
Cambodia, Laos,Myanmar
Moving Up the Value LadderMoving Up the Value Ladder
Value creation increasingly occurs through sub-regional and bilateral trading arrangements rather than through global regimes like WTO.
China. India
Indonesia, Philippines, Vietnam
Source: Adapted from Macaranas, 2012
WB innovation framework has moved from bricks and mortars (stage 1), to human resource management (stage 2), to knowledge management (stage 3), to innovation systems (stage 4).
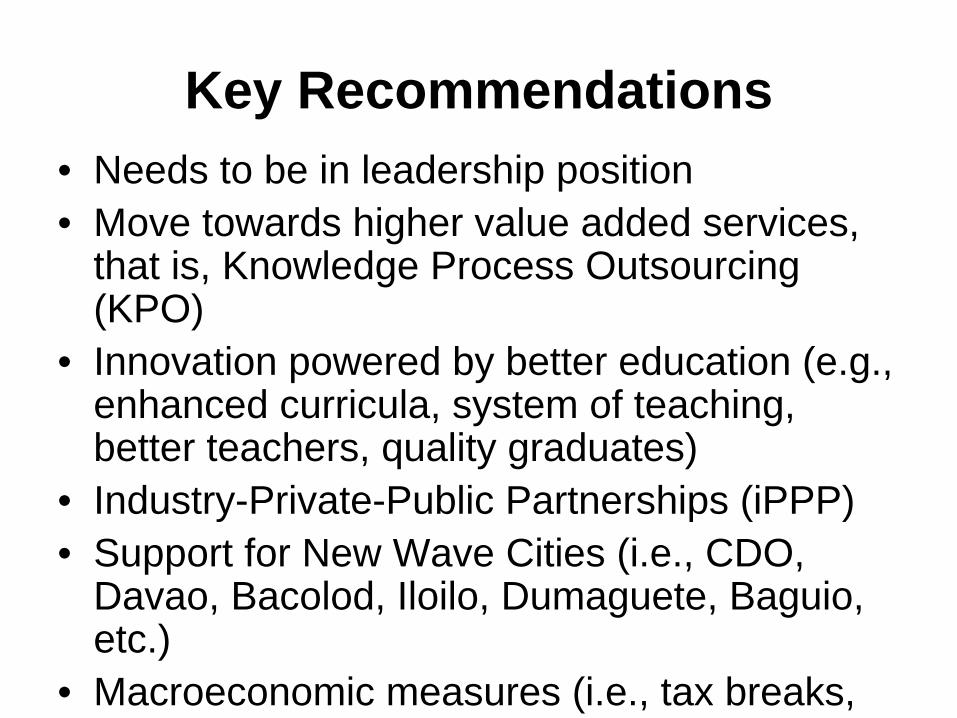
Key Recommendations• Needs to be in leadership position• Move towards higher value added services,
that is, Knowledge Process Outsourcing (KPO)
• Innovation powered by better education (e.g., enhanced curricula, system of teaching, better teachers, quality graduates)
• Industry-Private-Public Partnerships (iPPP)• Support for New Wave Cities (i.e., CDO,
Davao, Bacolod, Iloilo, Dumaguete, Baguio, etc.)
• Macroeconomic measures (i.e., tax breaks,
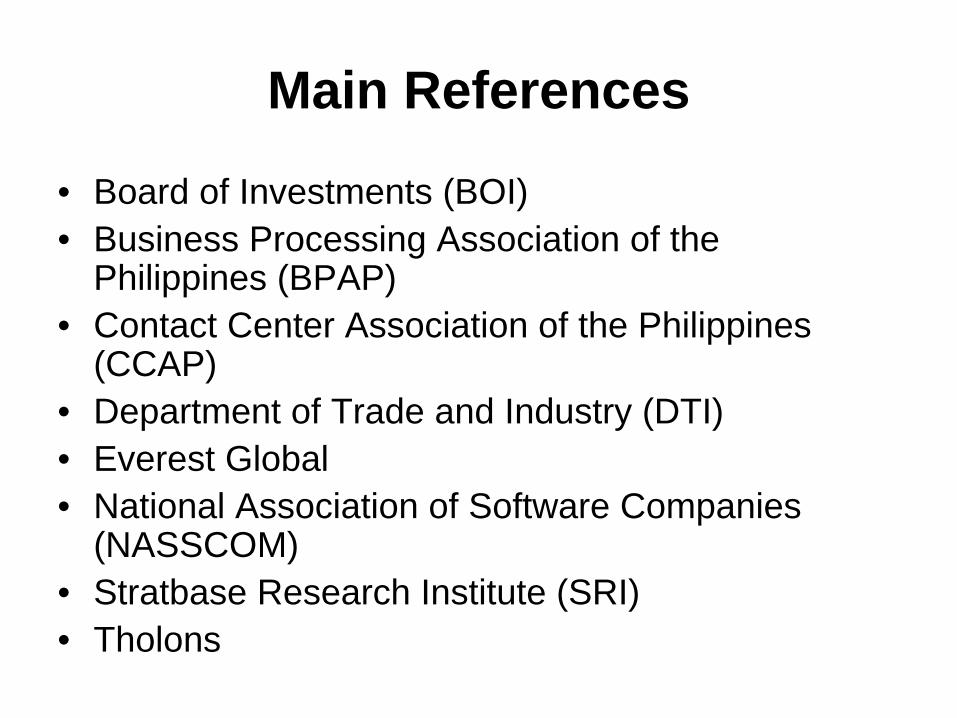
Main References
• Board of Investments (BOI)• Business Processing Association of the
Philippines (BPAP)• Contact Center Association of the Philippines
(CCAP)• Department of Trade and Industry (DTI)• Everest Global• National Association of Software Companies
(NASSCOM) • Stratbase Research Institute (SRI)• Tholons

Thank you.
- End -


![[FGD I3M] Fgd pimnas + solusi](https://static.fdocuments.in/doc/165x107/558a2bccd8b42aca328b459a/fgd-i3m-fgd-pimnas-solusi.jpg)