29 fileAdministrative expenses 22 (118,245) (128,970) Finance costs 23 (89) ... (Rs. in 000’) 2014...
27
Balance Sheet AS AT JUNE 30, 2014 Note 2014 (Rs. in 000’) 2013 Fahim Kapadia Chief Executive Yutaka Arae Chairman ASSETS NON CURRENT ASSETS Property, plant and equipment 6 573,393 504,722 Long term investment 7 1,028,320 703,125 Long term deposits and other receivables 8 6,234 5,714 1,607,947 1,213,561 CURRENT ASSETS Stores, spares and loose tools 9 55,336 75,107 Stock-in-trade 10 442,487 625,925 Trade debts 11 246,250 472,811 Advances, deposits, prepayments and other receivables 12 67,361 23,624 Accrued profit 974 831 Sales tax receivable 7,619 - Short term investments 13 510,410 50,341 Taxation – net 27,219 - Cash and bank balances 14 135,344 550,812 1,493,000 1,799,451 TOTAL ASSETS 3,100,947 3,013,012 EQUITY AND LIABILITIES SHARE CAPITAL AND RESERVES Authorised capital 40,000,000 (2013: 40,000,000) Ordinary shares of Rs. 5/- each 200,000 200,000 Issued, subscribed and paid-up capital 15 144,000 144,000 Reserves 2,665,617 2,515,820 2,809,617 2,659,820 NON CURRENT LIABILITIES Deferred taxation 16 61,055 54,440 CURRENT LIABILITIES Trade and other payables 17 230,275 270,217 Taxation – net - 7,794 Sales tax payable - 20,741 230,275 298,752 CONTINGENCIES AND COMMITMENTS 18 TOTAL EQUITY AND LIABILITIES 3,100,947 3,013,012 The annexed notes from 1 to 40 form an integral part of these financial statements. Agriauto Industries Limited 29
Transcript of 29 fileAdministrative expenses 22 (118,245) (128,970) Finance costs 23 (89) ... (Rs. in 000’) 2014...

Balance Sheet AS AT JUNE 30, 2014
Note 2014(Rs. in 000’)
2013
Fahim KapadiaChief Executive
Yutaka AraeChairman
ASSETS
NON CURRENT ASSETS Property, plant and equipment 6 573,393 504,722Long term investment 7 1,028,320 703,125Long term deposits and other receivables 8 6,234 5,714 1,607,947 1,213,561CURRENT ASSETSStores, spares and loose tools 9 55,336 75,107Stock-in-trade 10 442,487 625,925Trade debts 11 246,250 472,811Advances, deposits, prepayments and other receivables 12 67,361 23,624Accrued profit 974 831Sales tax receivable 7,619 -Short term investments 13 510,410 50,341Taxation – net 27,219 -Cash and bank balances 14 135,344 550,812 1,493,000 1,799,451TOTAL ASSETS 3,100,947 3,013,012
EQUITY AND LIABILITIES
SHARE CAPITAL AND RESERVESAuthorised capital 40,000,000 (2013: 40,000,000) Ordinary shares of Rs. 5/- each 200,000 200,000
Issued, subscribed and paid-up capital 15 144,000 144,000Reserves 2,665,617 2,515,820 2,809,617 2,659,820NON CURRENT LIABILITIESDeferred taxation 16 61,055 54,440
CURRENT LIABILITIES Trade and other payables 17 230,275 270,217Taxation – net - 7,794Sales tax payable - 20,741 230,275 298,752CONTINGENCIES AND COMMITMENTS 18 TOTAL EQUITY AND LIABILITIES 3,100,947 3,013,012
The annexed notes from 1 to 40 form an integral part of these financial statements.
Agriauto Industries Limited29

Profit And Loss Account FOR THE YEAR ENDED JUNE 30, 2014
Turnover - net 19 3,158,800 3,503,624
Cost of sales 20 (2,647,863) (2,929,021)Gross profit 510,937 574,603
Distribution costs 21 (56,556) (54,754)Administrative expenses 22 (118,245) (128,970)Finance costs 23 (89) (126) (174,890) (183,850)Operating profit 336,047 390,753
Other charges 24 (37,865) (32,993)Other income 25 105,383 81,374 67,518 48,381Profit before taxation 403,565 439,134
Taxation 26 (95,327) (129,714)
Profit after taxation 308,238 309,420 Rupees Rupees
Earnings per share – basic and diluted 27 10.70 10.74
The annexed notes from 1 to 40 form an integral part of these financial statements.
Note(Rs. in 000’)
2014 2013
Fahim KapadiaChief Executive
Yutaka AraeChairman
SHAPING THE INDUSTRY RESHAPING PAKISTAN
Ann
ual R
epor
t 201
4
30

Statement Of Comprehensive IncomeFOR THE YEAR ENDED JUNE 30, 2014
Net profit for the year 308,238 309,420
Other comprehensive income
Unrealized gain on change in fair value of available-for-sale investments arisen during the year – net of tax 24,476 31,043
Reclassification adjustment for gains included in profit and loss account upon disposal of investments (24,517) (32,227)
(41) (1,184)
Total comprehensive income for the year 308,197 308,236
The annexed notes from 1 to 40 form an integral part of these financial statements.
Note 2014 2013
Fahim KapadiaChief Executive
Yutaka AraeChairman
(Rs. in 000’)
31 Agriauto Industries Limited

Statement Of Comprehensive IncomeFOR THE YEAR ENDED JUNE 30, 2014
Cash Flow StatementFOR THE YEAR ENDED JUNE 30, 2014
CASH FLOWS FROM OPERATING ACTIVITIES
Cash generated from operations 28 740,021 320,163Finance costs paid (89) (126)Income tax paid (123,725) (120,203)Long term deposits (520) (1,760)Net cash generated from operating activities 615,687 198,074
CASH FLOWS FROM INVESTING ACTIVITIES
Fixed capital expenditure (143,828) (119,334)Proceeds from disposal of property, plant and equipment 9,567 9,568Proceeds from disposal of short term investment 474,519 657,530Short term investments (450,000) (625,000)Long term investments into subsidiary (325,195) (653,125)Profit received on term deposit receipts 11,604 33,998Profit received on deposit accounts 8,639 12,992Net cash used in investing activities (414,694) (683,371)
CASH FLOWS FROM FINANCING ACTIVITIES Lease rentals paid - (211)Dividends paid (156,461) (213,572)Net cash used in financing activities (156,461) (213,783) Net increase / (decrease) in cash and cash equivalents 44,532 (699,080) Cash and cash equivalents at the beginning of the year 600,812 1,299,892 Cash and cash equivalents at the end of the year 29 645,344 600,812
The annexed notes from 1 to 40 form an integral part of these financial statements.
Note 2014 2013
Fahim KapadiaChief Executive
Yutaka AraeChairman
(Rs. in 000’)
SHAPING THE INDUSTRY RESHAPING PAKISTAN
Ann
ual R
epor
t 201
4
32

Statement Of Changes In EquityFOR THE YEAR ENDED JUNE 30, 2014
Balance as at June 30, 2012 144,000 12,598 1,815,000 594,761 1,225 2,423,584 2,567,584
Final dividend for the year ended June 30, 2012 @ Rs. 7.5 /- per share - - - (216,000) - (216,000) (216,000)
Transfer to general reserve - - 345,000 (345,000) - - -
Profit after taxation for the year - - - 309,420 - 309,420 309,420Other comprehensive loss - - - - (1,184) (1,184) (1,184)Total comprehensive income for the year - - - 309,420 (1,184) 308,236 308,236
Balance as at June 30, 2013 144,000 12,598 2,160,000 343,181 41 2,515,820 2,659,820
Final dividend for the year ended June 30, 2013 @ Rs. 5.50 /- per share - - - (158,400) - (158,400) (158,400)
Transfer to general reserve - - 175,000 (175,000) - - -
Profit after taxation for the year - - - 308,238 - 308,238 308,238Other comprehensive loss - - - - (41) (41) (41)
Total comprehensive income for the year - - - 308,238 (41) 308,197 308,197
Balance as at June 30, 2014 144,000 12,598 2,335,000 318,019 - 2,665,617 2,809,617
The annexed notes from 1 to 40 form an integral part of these financial statements.
R e s e r v e s
Issued, subscribed and paid-up
capital
Gain / (loss) on changes in fair value of available-
for-sale investments
Total Total equity
Share premium
Capital reserve Revenue reserves
General
Unappropriat-ed profit
Fahim KapadiaChief Executive
Yutaka AraeChairman
----------------------------------(Rs. in 000’)----------------------------------
Agriauto Industries Limited33

Notes to the Financial Statements FOR THE YEAR ENDED JUNE 30, 2014
1. THE COMPANY AND ITS OPERATIONS
1.1 Agriauto Industries Limited (the Company) was incorporated in Pakistan on June 25, 1981 as a public limited company, under the Companies Act, 1913 (now the Companies Ordinance, 1984), and is listed on the Karachi and Lahore stock exchanges of Pakistan since June 1984. The Company is engaged in the manufacture and sale of components for automotive vehicles, motor cycles and agricultural tractors. The registered office of the Company is situated at 5th Floor, House of Habib, Main Shahrah-e-Faisal, Karachi.
These financial statements are separate financial statements of the Company in which investments in subsidiary is accounted for on the basis of direct equity interest and is not consolidated or accounted for using equity method.
2. STATEMENT OF COMPLIANCE
2.1 These financial statements have been prepared in accordance with approved accounting standards as applicable in Pakistan. Approved accounting standards comprise of such International Financial Reporting Standards (IFRSs) issued by the International Accounting Standards Board (IASB) as are as notified under the Companies Ordinance, 1984, provisions of and directives issued under the Companies Ordinance, 1984. In case requirements differ, the provisions or directives of the Companies Ordinance, 1984 shall prevail.
2.2 Standards and amendments to approved accounting standards that are not yet effective The following revised standards, amendments and interpretations with respect to the approved
accounting standards as applicable in Pakistan would be effective from the dates mentioned below against the respective standard or interpretation:
Effective date (accounting periods beginning on or after) Standard or Interpretation
IFRS 10 – Consolidated Financial Statements 01 January 2015 IFRS 11 – Joint Arrangements 01 January 2015 IFRS 12 – Disclosure of Interests in Other Entities 01 January 2015 IFRS 13 – Fair Value Measurement 01 January 2015 IAS 16 & 38 – Clarification of Acceptable Method of Depreciation and Amortization 01 January 2016 IAS 19 – Employee Contributions 01 July 2014 IAS 32 – Offsetting Financial Assets and Financial liabilities – (Amendment) 01 January 2014 IAS 36 – Recoverable Amount for Non-Financial Assets – (Amendment) 01 January 2014 IAS 39 – Novation of Derivatives and Continuation of Hedge Accounting – (Amendment) 01 January 2014
SHAPING THE INDUSTRY RESHAPING PAKISTAN
Ann
ual R
epor
t 201
4
34

Notes to the Financial Statements FOR THE YEAR ENDED JUNE 30, 2014
The Company is currently evaluating the impact of the above standards and interpretation on the Company’s financial statements in the period of initial application.
In addition to the above, the following new standards have been issued by IASB which are yet to be notified by the SECP for the purpose of applicability in Pakistan.
IASB Effective date (accounting periods beginning
Standard on or after)
IFRS 9 – Financial Instruments: Classification and Measurement 01 January 2018 IFRS 14 – Regulatory Deferral Accounts 01 January 2016 IFRS 15 – Revenue from Contracts with Customers 01 January 2017
3. BASIS OF MEASUREMENT 3.1 These financial statements have been prepared under the historical cost convention except for
available-for-sale investments which are valued as stated in note 4.6 to the financial statements. 3.2 These financial statements are presented in Pak Rupees which is the Company’s functional and
presentation currency.
4. SUMMARY OF SIGNIFICANT ACCOUNTING POLICIES The accounting policies adopted in the preparation of these financial statements are consistent with
those of the previous financial year except as described below: 4.1 New / revised standards, interpretations and amendments
The Company has adopted the following revised standard, amendments and interpretation of IFRSs which became effective for the current year:
IAS 19 – Employee Benefits –(Revised) IFRS 7 – Financial Instruments : Disclosures – (Amendments) -Amendments enhancing disclosures about offsetting of financial assets and financial liabilities Improvements to Accounting Standards Issued by the IASB
IAS 1 – Presentation of Financial Statements - Clarification of the requirements for comparative informationIAS 16 – Property, Plant and Equipment – Clarification of Servicing EquipmentIAS 32 – Financial Instruments: Presentation – Tax Effects of Distribution to Holders of Equity InstrumentsIAS 34 – Interim Financial Reporting – Interim Financial Reporting and Segment Information for Total Assets and Liabilities
The adoption of the above amendments, revisions, improvements to accounting standards and interpretations did not have any effect on the financial statements.
Agriauto Industries Limited35

Notes to the Financial Statements FOR THE YEAR ENDED JUNE 30, 2014
4.2 Property, plant and equipment
Owned
These are stated at cost less accumulated depreciation and impairment loss except for freehold land and capital work in progress which are stated at cost.
Depreciation on fixed assets is charged to the profit and loss account applying the reducing balance method at the rates specified in note 6 to the financial statements. Depreciation on additions is charged from the month of addition and in case of deletion up to the month of disposal. Maintenance and normal repairs are charged to profit and loss account as and when incurred, while major renewals and improvements are capitalised. Gains or losses on disposals of fixed assets, if any, are included in income currently.
Leasehold land is amortised in equal installments over the lease period.
The carrying values of assets are reviewed for impairment when events or changes in circumstances indicate that the carrying value may not be recoverable. If any such indication exists and where the carrying values exceed the estimated recoverable amount, the assets or related cash-generating units are written down to their recoverable amount.
Finance leases
Assets held under finance leases are initially recorded at the lower of the present value of minimum lease payments under the lease agreements and the fair value of the leased assets. The related obligations under the lease less financial charges allocated to future periods are recorded as liability.
The financial charges are allocated to accounting periods in a manner so as to provide a constant periodic rate of interest on the outstanding liability.
Depreciation is charged to income on the same basis as for the Company’s owned assets.
4.3 Stores, spares and loose tools
These are stated at the lower of cost and Net Realisable Value (NRV) except for goods-in-transit which are stated at invoice price plus other charges incurred thereon upto the date of the balance sheet. Cost is determined on weighted moving average basis.
Stores, spares and loose tools are regularly reviewed by the management and any obsolete items
are brought down to their NRV.
SHAPING THE INDUSTRY RESHAPING PAKISTAN
Ann
ual R
epor
t 201
4
36

Notes to the Financial Statements FOR THE YEAR ENDED JUNE 30, 2014
4.4 Stock-in-trade
Stock-in-trade, except goods-in-transit, is stated at the lower of NRV and cost determined as follows:
Raw and packing materials - Moving average basis.
Work-in-process - Cost of direct materials plus conversion cost is valued on the basis of equivalent production units.
Finished goods - Cost of direct materials plus conversion cost is valued on time proportion basis.
Goods-in-transit are valued at purchase price, freight value and other charges incurred thereon upto the balance sheet date.
Stock-in-trade is regularly reviewed by the management and any obsolete items are brought down to their NRV.
NRV signifies the estimated selling price in the ordinary course of business less the estimated costs
of completion and the estimated costs necessary to make the sale.
4.5 Trade debts and other receivables
Trade debts originated by the Company are recognised and carried at original invoice amount less provision for impairment. Other receivables are carried at cost less provision for impairment. Provision for impairment is based on the management’s assessment of customers’ outstandings and creditworthiness. Bad debts are written-off as and when identified.
4.6 Investments
Investment in subsidiary company
Investment in subsidiary is stated at cost less impairment, if any.
Held-to-maturity
Investments with fixed maturity where management has both the intent and ability to hold to maturity are classified as held-to-maturity.
Gains or losses on held-to-maturity investments are recognised in income when the investments are derecognised or impaired.
Available-for-sale
Investments which are not classified in the above category and which the management intends to hold for indefinite period, but may be sold in response to the need for liquidity or changes in interest rates are classified as available-for-sale.
Agriauto Industries Limited37

Notes to the Financial Statements FOR THE YEAR ENDED JUNE 30, 2014
All investments are initially recognised at cost, being the fair value of the consideration given including transaction costs associated with the investment. Transaction costs in the case of held-for-trading investments are charged to income when incurred. After initial recognition, investments classified as available-for-sale are remeasured at fair values and held-to-maturity investments are measured at amortised cost.
Gains or losses on revaluation of available-for-sale investments are recognised in equity until the investment is sold, collected or otherwise disposed off, or until the investment is determined to be impaired, at which time the cumulative gain or loss previously reported in equity is included in income.
4.7 Cash and cash equivalents
For the purpose of cash flow statement, cash and cash equivalents comprise of cash in hand, bank balances and short term investments with a maturity of three months or less from the date of acquisition net of short-term running finance. The cash and cash equivalents are readily convertible to known amount of cash and are therefore subject to insignificant risk of changes in value.
4.8 Financial instruments
All financial assets and liabilities are recognised at the time when the Company becomes party to the contractual provisions of the instrument. Financial assets are derecognised when the contractual rights under the instruments are realised, expired or surrendered. Financial liabilities are derecognised when the obligation is extinguished, discharged, cancelled or expired. Any gain or loss on recognition or derecognition of the financial assets and financial liabilities is taken to the profit and loss account.
4.9 Offsetting of financial assets and financial liabilities
A financial asset and a financial liability is offset and the net amount is reported in the balance sheet if the Company has a legally enforceable right to set off the recognised amounts and intends either to settle on a net basis or to realise the assets and settle the liability simultaneously.
4.10 Employees’ benefits Provident fund
The Company operates a recognised provident fund scheme (defined contribution plan) for all its employees who are eligible for the scheme in accordance with the Company’s policy. Contributions in respect thereto are made in accordance with the terms of the scheme.
Compensated absences
The Company accounts for these benefits in the period in which the absences are earned.
4.11 Taxation
Current
Provision for current taxation is based on taxable income at current rates of taxation after taking into account tax credits and rebates available, if any, or 1 percent of turnover, whichever is higher. Tax on export sales is calculated under final tax regime under Section 154 of the Income Tax Ordinance, 2001.
SHAPING THE INDUSTRY RESHAPING PAKISTAN
Ann
ual R
epor
t 201
4
38

Notes to the Financial Statements FOR THE YEAR ENDED JUNE 30, 2014
Deferred
Deferred tax is provided, proportionate to local sales, for temporary differences between the carrying amounts of assets and liabilities for financial reporting purposes and the amounts used for taxation purposes. The amount of deferred tax provided is based on the expected manner of recognised or settlement of the carrying amount of assets and liabilities, using tax rates enacted at the balance sheet date.
4.12 Provisions
Provision is recognised in the balance sheet when the Company has a present obligation (legal or constructive) as a result of a past event, it is probable that an outflow of resources embodying economic benefits will be required to settle the obligation and a reliable estimate can be made of the amount of obligation.
4.13 Warranty obligations The Company recognises the estimated liability to repair or replace products under warranty at the
balance sheet date on the basis of historical experience. 4.14 Foreign currency transactions
Transactions denominated in foreign currencies are recorded on initial recognition in Pak. Rupees,
by applying to the foreign currency amount the exchange rate ruling at the date of the transaction. Monetary assets and liabilities denominated in foreign currencies are translated into Pak. Rupees equivalents using the exchange rate at the balance sheet date. Exchange differences are included in income currently.
4.15 Revenue recognition
Sales are recorded when goods are dispatched to the customers.
Profit on term deposit receipts is recognised on constant rate of return to maturity. Profit on deposit accounts is recognised on accrual basis. Dividend income is recognised when the right to receive the dividend is established.
4.16 Borrowing costs
Borrowing costs directly attributable to the acquisition, construction or production of an asset that necessarily takes a substantial period of time to get ready for its intended use or sale are capitalized as part of the cost of the respective assets. All other borrowing costs are expensed in the period they occur. Borrowing costs consist of interest and other costs that an entity incurs in connection with the borrowing of funds.
Agriauto Industries Limited39

Notes to the Financial Statements FOR THE YEAR ENDED JUNE 30, 2014
4.17 Research and development costs
Research and development costs are expensed as incurred, except for development costs that relate
to the design of new or improved products which are recognised as an asset to the extent that it is
expected that such asset will meet the recognition criteria mentioned in IAS – 38 “Intangible Assets”.
4.18 Dividends and appropriation to reserve
Dividend and appropriation to reserve are recognised in the financial statements in the period in
which these are approved.
5. SIGNIFICANT ACCOUNTING JUDGEMENTS AND ESTIMATES
The preparation of financial statements in conformity with approved accounting standards requires
the use of certain critical accounting estimates. It also requires management to exercise its judgment
in the process of applying the Company’s accounting policies. Estimates and judgments are
continually evaluated and are based on historic experience and other factors, including expectations
of future events that are believed to be reasonable under the circumstances. Revisions to accounting
estimates are recognised in the period in which the estimate is revised and in any future periods
affected.
In the process of applying the accounting policies, management has made the following judgments
and estimates which are significant to the financial statements:
Notes
- determining the residual values and useful lives of property, plant and
equipment 4.2 & 6
- valuation of inventories 4.3, 4.4, 9 & 10
- provision against trade debts and other receivables 4.5, 8 & 11
- provision for tax and deferred tax 4.11, 16 & 26
- provision for employee’s benefits 4.10 & 17.1
- warranty obligations 4.13 & 17.3
Note 2014 2013
(Rs. in 000’)
6. PROPERTY, PLANT AND EQUIPMENT
Operating assets – tangible 6.1 570,428 463,273
Capital work-in-progress 6.4 2,965 41,449
573,393 504,722
SHAPING THE INDUSTRY RESHAPING PAKISTAN
Ann
ual R
epor
t 201
4
40

Notes to the Financial Statements FOR THE YEAR ENDED JUNE 30, 2014
6.1 Operating assets WRITTEN DOWN C O S T ACCUMULATED DEPRECIATION VALUE
As at As at As at Charge Disposals As at As at July 01, Additions/ June 30, Depreciation July 01, for the for the June 30, June 30, 2013 (disposals) 2014 rate 2013 Year Year 2014 2014 ---------------(Rs. In 000’) --------------- % -------------- ----------------- (Rs. In 000’) --------------------------
Owned Freehold land 1,652 - 1,652 - - - - - 1,652
Building on freehold land 107,051 20,359 127,410 10 54,467 5,982 - 60,449 66,961
Plant and machinery 624,228 136,094 748,668 10 – 20 269,352 47,388 (10,816) 305,924 442,744 (11,654)
Furniture and fittings 8,042 400 8,442 15 3,682 687 - 4,369 4,073
Vehicles 58,301 9,554 58,999 20 24,734 7,838 (4,105) 28,467 30,532 (8,856)
Office equipment 2,897 328 3,225 20 1,524 278 - 1,802 1,423
Computer equipment 26,762 863 27,553 33 16,084 3,672 (58) 19,698 7,855 (72)
Dies and tools 20,667 14,714 35,381 40 16,484 3,709 - 20,193 15,188 2014 849,600 182,312 1,011,330 386,327 69,554 (14,979) 440,902 570,428
(20,582)
WRITTEN DOWN C O S T ACCUMULATED DEPRECIATION VALUE
Charge/ As at Additions/ As at As at transfers* Disposals As at As at July 01, (disposals)/ June 30, Depreciation July 01, for the for the June 30, June 30, 2012 transfers* 2013 rate 2012 Year Year 2013 2013 ---------------(Rs. In 000’) --------------- % -------------- ----------------- (Rs. In 000’) --------------------------
Owned Freehold land 1,652 - 1,652 - - - - - 1,652
Building on freehold land 109,501 - 107,051 10 50,858 5,862 (2,253) 54,467 52,584 (2450)
Plant and machinery 589,153 67,983 624,228 10 – 20 257,796 39,709 (28,153) 269,352 354,876 (32,908)
Furniture and fittings 6,785 1,327 8,042 15 3,137 596 (51) 3,682 4,360 (70)
Vehicles 56,181 7,152 58,301 20 17,886 8,367 (2,572) 24,734 33,567 (7,338) 1,053* 2,306*
Office equipment 2,243 654 2,897 20 1,234 290 - 1,524 1,373
Computer equipment 25,736 1,183 26,762 33 11,237 4,914 (67) 16,084 10,678 (157)
Dies and tools 20,667 - 20,667 40 13,695 2,789 - 16,484 4,183 811,918 78,299 849,600 355,843 62,527 (33,096) 386,327 463,273 (42,923) 1,053* 2,306* Leased
Vehicles 2,306 (2,306)* - 20 1,010 43 - - - (1,053)* 2013 814,224 78,299 849,600 356,853 62,570 (33,096) 386,327 463,273 (42,923) -* -*
Agriauto Industries Limited41

Notes to the Financial Statements FOR THE YEAR ENDED JUNE 30, 2014
6.2 Depreciation charge for the year has been allocated as follows : Note 2014 2013 (Rs. in 000’) Cost of sales 20 61,150 52,466 Distribution costs 21 872 777 Administrative expenses 22 7,532 9,327 69,554 62,570
6.3 The following property, plant and equipment were disposed off during the year:
Accumulated Sales Gain / Mode of
Particulars Cost Depreciation Book value proceeds (loss) Disposal Particulars of buyer ----------------------------- (Rs. In 000’) -----------------------------
Plant and machinery / Dies and Tools Plant, machinery & equipment 11,654 10,816 838 1,911 1,073 Auction New ABC Neelam Ghar
IT Equipment Laptop 72 58 14 40 26 Insurance Claim Habib Insurance Company Limited
Vehicles Daihatsu Coure 665 358 307 665 358 Insurance Claim Habib Insurance Company Limited Toyota Corolla 1,399 592 807 1,280 473 Negotiation Mr. Muhammad Amin Honda CD-70 63 34 29 45 16 Negotiation Mr. Aamir Mehboob - Employee Honda CD-70 63 32 31 35 4 Negotiation Mr. Alam Alvi - Employee Daihatsu Coure 759 336 423 690 267 Negotiation Mr. Inayat Ali Suzuki Cultus 855 420 435 775 340 Negotiation Mr. Muhammad Shafique Ahmed Suzuli Alto 678 271 407 690 283 Negotiation Mr. Ali Gul Sangi Toyota Corolla 1,554 602 952 1,300 348 Company policy Mr. M. Noman Khan - Ex - Employee Suzuli Alto 712 259 453 690 237 Negotiation Mr. Rasheeduddin Suzuki Cultus 1,010 135 875 1,010 135 Insurance Claim Habib Insurance Company Limited Honda CD-70 51 37 14 49 35 Negotiation Mr. Abdul Wahab - Employee Honda CD-70 51 37 14 49 35 Negotiation Mr. Aamir Mehboob - Employee Fork Lifter 996 992 4 338 334 Negotiation Mr. Adam 8,856 4,105 4,751 7,616 2,865 2014 20,582 14,979 5,603 9,567 3,964 2013 42,923 33,096 9,827 9,568 (259)
6.4 Capital work-in-progress Plant and Dies and
machinery Civil works tools Total ----------------------------(Rs. in 000’)----------------------------
Balance as at July 01, 2013 35,737 - 5,712 41,449
Capital expenditure incurred / advances made during the year 31,347 17,865 - 49,212 Transfer to fixed assets during the year (64,119) (17,865) (5,712) (87,696) Balance as at June 30, 2014 2,965 - - 2,965
SHAPING THE INDUSTRY RESHAPING PAKISTAN
Ann
ual R
epor
t 201
4
42

Notes to the Financial Statements FOR THE YEAR ENDED JUNE 30, 2014
2014 2013 (Rs. in 000’)7. LONG TERM INVESTMENT
Investment in a subsidiary company - at cost Agriauto Stamping Company (Private) Limited 1,028,320 703,125
7.1 The subsidiary company was incorporated on January 20, 2012 and the Company has made an investment of Rs 1,028.320 million (2013: Rs. 703.125 million) as at 30 June 2014. The Company holds 100 percent shares in the subsidiary company.
Note 2014 2013 (Rs. in 000’)
8. LONG TERM DEPOSITS AND OTHER RECEIVABLES
Security deposits – considered good 6,234 5,714
Other receivable - considered doubtful - 49,252 Less: Provision for impairment 8.1 - (49,252)
- - 6,234 5,714
8.1 During the year ended 30 June 2010, Company sold its shareholding in Makro-Habib Pakistan Limited (MHPL) to Thal Limited (TL), a related party under a Share Purchase Agreement (SPA) dated May 14, 2010, at an aggregate consideration of Rs.157.658 million. In terms of the SPA, the Company received an amount of Rs.108.406 million from TL towards the purchase consideration of the said shares. However, the balance consideration amounting to Rs. 49.252 million shall only be payable by TL subject to the following:
a) TL determines that the Group tax relief for the years 2008-2010, as claimed by TL, can be fully sustained or is unable to make such determination by June 2014; and
b) TL determines that MHPL will not incur an impairment loss in case of closure of its Sadder store or is unable to make such determination about the impairment by June 2014.
Accordingly, the contingent balance payment for (a) and (b) above, amounts to Rs. 28.710 million and
Rs. 20.542 million respectively. The management, upon fulfilment of the aforementioned conditions, has reversed the provision for impairment and recognized it as other income. The receivable balance of Rs. 49.252 million from Thal Limited has been reclassified to current assets in the financial statements for the year ended 30 June 2014 as the said receivable has been received subsequent to the year end.
2014 2013 (Rs. in 000’)
9. STORES, SPARES AND LOOSE TOOLS Stores 19,727 38,710 Spares 30,690 30,748 Loose tools 4,919 5,649 55,336 75,107
Agriauto Industries Limited43
Notes to the Financial Statements FOR THE YEAR ENDED JUNE 30, 2014
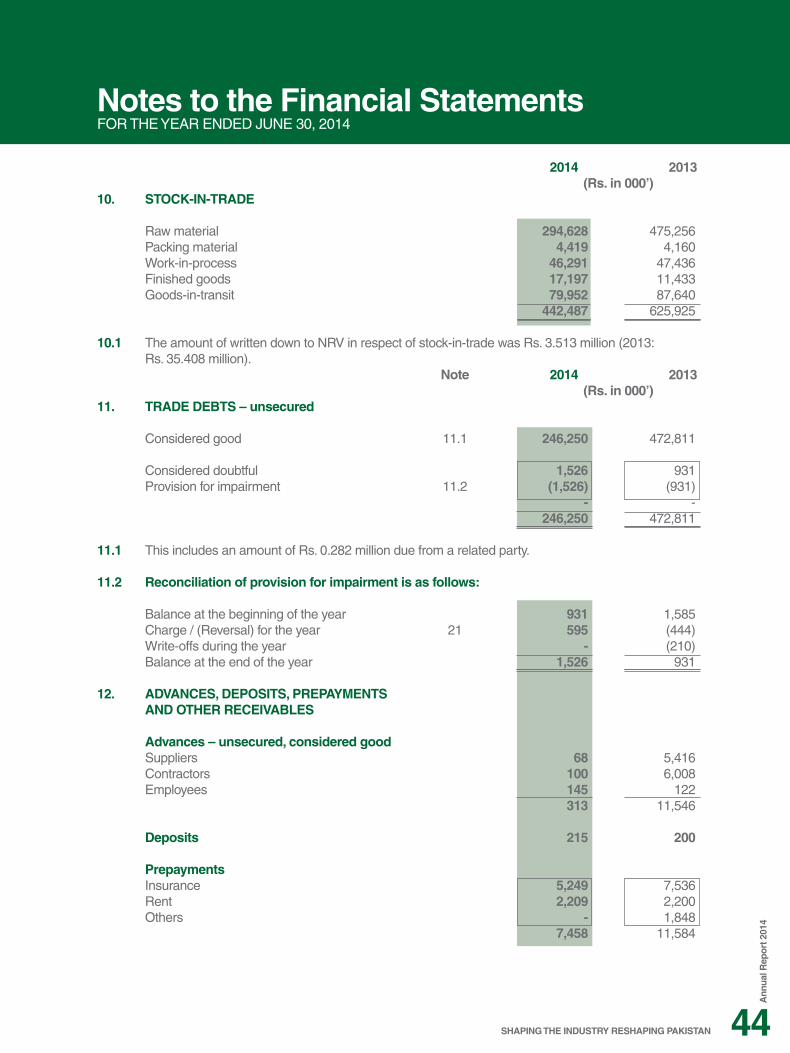
2014 2013 (Rs. in 000’)10. STOCK-IN-TRADE
Raw material 294,628 475,256 Packing material 4,419 4,160 Work-in-process 46,291 47,436 Finished goods 17,197 11,433 Goods-in-transit 79,952 87,640 442,487 625,925
10.1 The amount of written down to NRV in respect of stock-in-trade was Rs. 3.513 million (2013: Rs. 35.408 million). Note 2014 2013 (Rs. in 000’)11. TRADE DEBTS – unsecured
Considered good 11.1 246,250 472,811 Considered doubtful 1,526 931 Provision for impairment 11.2 (1,526) (931) - - 246,250 472,811
11.1 This includes an amount of Rs. 0.282 million due from a related party.
11.2 Reconciliation of provision for impairment is as follows:
Balance at the beginning of the year 931 1,585 Charge / (Reversal) for the year 21 595 (444) Write-offs during the year - (210) Balance at the end of the year 1,526 931
12. ADVANCES, DEPOSITS, PREPAYMENTS AND OTHER RECEIVABLES
Advances – unsecured, considered good Suppliers 68 5,416 Contractors 100 6,008 Employees 145 122 313 11,546
Deposits 215 200 Prepayments
Insurance 5,249 7,536 Rent 2,209 2,200 Others - 1,848 7,458 11,584
SHAPING THE INDUSTRY RESHAPING PAKISTAN
Ann
ual R
epor
t 201
4
44

Notes to the Financial Statements FOR THE YEAR ENDED JUNE 30, 2014
Note 2014 2013 (Rs. in 000’) Other receivables – unsecured, considered good Insurance claim receivable - 294 Workers’ profit participation Fund 17.2 10,123 - Against sale of shares 8.1 49,252 - 59,375 294 67,361 23,62413. SHORT TERM INVESTMENTS
Held- to- maturity Term deposit receipts 13.1 510,000 50,000 Accrued profit thereon 410 300 510,410 50,300 Available-for-sale - Money Market Fund - 41 510,410 50,341
13.1 Represents three months term deposit receipts with a commercial bank carrying profit rate ranging from 8.5% to 9.5% (2013: 8.75%) per annum and will mature by September 2014.
Note 2014 2013 (Rs. in 000’)
14. CASH AND BANK BALANCES
In hand 40 25 With banks in - current accounts 84,003 27,680 - deposit accounts 14.1 51,301 523,107 135,304 550,787 135,344 550,812
14.1 These carry profit rates ranging from 7% to 8% (2013: 6% to 7.5%) per annum.
2014 2013 (Rs. in 000’)15. ISSUED, SUBSCRIBED AND PAID-UP CAPITAL
Ordinary shares of Rs. 5/- each
Number of shares in (000’) 2014 2013
22,800 22,800 Fully paid in cash 114,000 114,000
6,000 6,000 Issued as fully paid bonus shares 30,000 30,000 28,800 28,800 144,000 144,000
Agriauto Industries Limited45

Notes to the Financial Statements FOR THE YEAR ENDED JUNE 30, 2014
15.1 Related parties held 2,115,600 (2013: 2,115,600) Ordinary shares of Rs. 5/- each in the Company at year end.
Note 2014 2013 (Rs. in 000’)16. DEFERRED TAXATION
Taxable temporary differences arising due to: - accelerated tax depreciation 89,658 81,103
Deductable temporary differences arising due to: - assets subject to finance lease - - - provisions (28,603) (26,663) (28,603) (26,663)
61,055 54,440
17. TRADE AND OTHER PAYABLES
Creditors 67,996 86,568 Royalty payable 11,149 12,560 Accrued liabilities 108,109 109,991
Advance from customers 1,073 1,513 Payable to provident fund 17.1 - 1,263 Workers’ Profit Participation Fund 17.2 - 12,231 Workers’ Welfare Fund 8,313 11,208 Warranty obligations 17.3 18,277 18,052 Unclaimed and unpaid dividends 12,471 10,531 Guarantee bond payable 17.4 1,110 1,110 Tax deducted at source 1,269 2,837 Others 508 2,353 230,275 270,217
(Unaudited)17.1 General Disclosures Size of the fund 146,275 132,749 Cost of investments 106,050 107,382 Fair value of investments 17.1.1 146,275 132,749 Percentage of investments 100% 100%
17.1.1 The breakup of fair value of investments is: 2014 2013 -------------------------- (Unaudited) ------------------------ (Rs. in 000’) (%) (Rs. in 000’) (%)
Special Saving Certificates 110,712 75 36,314 27 Term Deposit Receipts - - 59,386 45 Term Finance Certificates 12,575 9 13,732 10 Mutual fund units 5,462 4 6,458 5 Shares in listed companies 2,901 2 1,972 1 Bank balance 3,775 3 7,375 6 Others 10,850 7 7,512 6 Total 146,275 100 132,749 100
SHAPING THE INDUSTRY RESHAPING PAKISTAN
Ann
ual R
epor
t 201
4
46

Notes to the Financial Statements FOR THE YEAR ENDED JUNE 30, 2014
17.1.2 Investments of provident fund have been made in accordance with the provisions of Section 227 of the Companies Ordinance, 1984 and the rules formulated for this purpose.
Note 2014 2013 (Rs. in 000’)17.2 Workers’ Profit Participation Fund
Balance at the beginning of the year 12,231 (392) Prior year’s adjustment 24 3,784 - Allocation for the year 24 21,877 19,601 37,892 19,209 Less: Payment made during the year 48,015 (6,978) Balance at end of the year (10,123) 12,231
17.3 Warranty obligations
Balance at the beginning of the year 18,052 23,885 Provision for the year 21 5,760 2,613 23,812 26,498
Less: Claims paid during the year 5,535 8,446 Balance at end of the year 18,277 18,052
17.4 The Company has provided bank guarantees to Collector of Customs as a security against the import duty.
18. CONTINGENCIES AND COMMITMENTS Commitments
(i) Commitments in respect of outstanding letters of credit for raw material amount to Rs. 231.358 million (2013: Rs. 169.459 million).
(ii) Commitments in respect of capital expenditure amount to Rs.3.134 million (2013: Rs. 17.641
million). (iii) Outstanding bank guarantees issued to Sui Southern Gas Company Limited amounts to Rs.
0.385 million (2013: Rs. 0.385 million)
Agriauto Industries Limited47

Notes to the Financial Statements FOR THE YEAR ENDED JUNE 30, 2014
Note 2014 2013 (Rs. in 000’)
19. TURNOVER – net
Sales 3,704,775 4,068,990 Less: Trade discount 7,091 221 Sales tax 538,884 565,145 545,975 565,366 3,158,800 3,503,62420. COST OF SALES
Raw material consumed Opening stock 475,256 544,286
Purchases 1,831,368 2,224,301 2,306,624 2,768,587 Closing stock (294,628) (475,256) 2,011,996 2,293,331 Manufacturing expenses
Salaries, wages and benefits 227,639 207,912 Stores, spares and loose tools consumed 112,445 110,030 Packing material consumed 18,949 19,828 Fuel and power 73,445 71,695 Transportation and traveling 59,286 49,565 Depreciation 6.2 61,150 52,466 Repairs and maintenance 37,815 39,345 Royalty and technical fees 33,907 43,494 Research and development costs 95 128 Communications and professional fee 1,968 1,922 Printing and stationery 866 765 Insurance 2,552 3,899 Rent, rates and taxes 5,343 10,206 Others 5,026 5,320
640,486 616,575 Work-in-process
Opening stock 47,436 55,253 Closing stock (46,291) (47,436) 1,145 7,817 Cost of goods manufactured 2,653,627 2,917,723
Finished goods Opening stock 11,433 22,731 Closing stock (17,197) (11,433) (5,764) 11,298 2,647,863 2,929,02121. DISTRIBUTION COSTS
Salaries and benefits 14,090 12,568 Advertisement and sales promotion 12,767 13,940 Carriage and forwarding 18,329 21,013 Traveling and conveyance 2,972 2,858 Depreciation 6.2 872 777 Provision for warranty claims 17.3 5,760 2,613 Provision / (reversal) for impairment of trade debts 11.2 595 (444) Rent, rates and taxes 140 99 Communications 272 209 Insurance 231 225 Repairs and maintenance 451 657 Others 77 239 56,556 54,754
SHAPING THE INDUSTRY RESHAPING PAKISTAN
Ann
ual R
epor
t 201
4
48

Notes toT the Financial Statements FOR THE YEAR ENDED JUNE 30, 2014
Note 2014 2013 (Rs. in 000’)
22. ADMINISTRATIVE EXPENSES Salaries and benefits 56,880 57,779 Legal and professional charges 17,007 23,992 Repairs and maintenance 9,923 10,467 Depreciation 6.2 7,532 9,327 Printing and stationery 808 1,068 Computer supplies 423 299 Rent, rates and taxes 3,247 3,179 Traveling and conveyance 11,046 11,593 Communications and professional fee 3,156 2,696 Utilities 1,566 1,678 Security services 3,923 4,218 Insurance 911 1,150 Auditors’ remuneration 22.1 1,056 828 Advertisement 169 198 Others 598 498 118,245 128,97022.1 Auditors’ remuneration
Audit fee for standalone financial statements 600 550 Audit fee for consolidated financial statements 125 125 Fee for review of half yearly financial statements 60 55 Other certifications 185 28 Out of pocket expenses 86 70 1,056 82823. FINANCE COSTS
Mark-up on finance lease - 7 Bank charges 89 119 89 12624. OTHER CHARGES
Workers’ Profit Participation Fund 17.2 25,661 19,601 Workers’ Welfare Fund 8,313 8,962 Donations 24.1 3,891 4,430 37,865 32,993
Agriauto Industries Limited49

Notes to the Financial Statements FOR THE YEAR ENDED JUNE 30, 2014
24.1 None of the directors or their spouses had any interest in any of the donees to whom donations were made during the year.
Note 2014 2013 (Rs. in 000’)25. OTHER INCOME
Income from financial assets Profit on:
- term deposit receipts 11,715 23,873 - deposit accounts 8,781 12,215 Gain on sale of available-for-sale investments 24,517 32,227 Reversal of provision for impairment 8.1 49,252 - 94,265 68,315 Liabilities no longer payable - written back 2,616 622 Income from non-financial assets
Gain / (loss) on disposal of property, plant and equipment 6.3 3,964 (259) Scrap sales 3,093 5,326 Miscellaneous income 1,445 - 8,502 5,067 Refund of Workers’ Profit Participation Fund - 7,370
105,383 81,37426. TAXATION
Current 87,581 127,573 Prior 1,131 (793) Deferred 6,615 2,934 95,327 129,714
26.1 Relationship between tax expense and accounting profit Profit before taxation 403,565 439,134
Tax at the rate of 34% (2013: 35%) 137,212 153,697
Tax effects of:
Expenses that are admissible in determining taxable profit (33,396) (14,363)
Prior year 1,131 (793) Tax rebates (16,235) (11,761)
Deferred 6,615 2,934 95,327 129,714
SHAPING THE INDUSTRY RESHAPING PAKISTAN
Ann
ual R
epor
t 201
4
50

Notes to the Financial Statements FOR THE YEAR ENDED JUNE 30, 2014
27. EARNINGS PER SHARE – basic and diluted
There is no dilutive effect on the basic earnings per share of the Company, which is based on:
2014 2013
Profit after taxation (Rs. in 000’) 308,238 309,420
Weighted average number of ordinary shares outstanding during the year (in 000’) 28,800 28,800
Basic earnings per share (Rs.) 10.70 10.74
28. CASH GENERATED FROM OPERATIONS
Profit before taxation 403,565 439,134 Adjustments for
Depreciation 69,554 62,570 Finance costs 89 126 Provision for impairment of trade debts 595 (444) Liabilities no longer payable - written back (2,616) (622) Gain on disposal of available-for-sale investment (24,517) (32,227) Profit on term deposit receipts (11,715) (23,873) Profit on deposit accounts (8,781) (12,215) (Gain) / loss on disposal of property, plant and equipment (3,965) 259 18,644 (6,426) 422,209 432,708 Decrease / (increase) in current assets
Stores, spares and loose tools 19,771 2,665 Stock-in-trade 183,438 56,002 Trade debts 225,966 (156,511) Advances, deposits, prepayments and other receivables (43,737) (12,408) Sales tax receivable (7,619) - 377,819 (110,252) (Decrease) / increase in current liabilities Trade and other payables (39,266) (777) Sales tax payable (20,741) (1,516) (60,007) (2,293) 740,021 320,16329. CASH AND CASH EQUIVALENTS
Cash and bank balances 14 135,344 550,812 Short term investments – term deposit receipts 13 510,000 50,000 645,344 600,812
30. FINANCIAL RISK MANAGEMENT OBJECTIVES AND POLICIES
The main risks arising from the Company’s financial instruments are market risks, credit risk and liquidity risk. The Board of Directors reviews and agrees policies for managing each of these risks which are summarized below:
30.1 Market risk
Market risk is the risk that the fair value or future cash flows of financial instruments will fluctuate due to changes in market variables such as interest rate and foreign exchange rates.
Agriauto Industries Limited51

Notes to the Financial Statements FOR THE YEAR ENDED JUNE 30, 2014
(i) Interest rate risk Interest rate risk is the risk that the value of financial instrument will fluctuate due to the changes
in market interest rates. The Company is exposed to interest rate risk in respect of bank deposits, term deposit receipts and investment in income based mutual funds. Management of the Company estimates that 1% increase in the market interest rate, with all other factor remaining constant, would increase the Company’s profit after tax by Rs. 3.705 million (2013 : 3.726 million) and a 1% decrease would result in the decrease in the Company’s profit after tax by the same amount. However, in practice, the actual result may differ from the sensitivity analysis.
(ii) Foreign currency risk Foreign currency risk is the risk that the value of financial assets or a financial liability will fluctuate
due to a change in foreign exchange rates. It arises mainly where receivables and payables exist due to transactions in foreign currency. As at June 30, 2014, the Company does not have any financial assets or financial liabilities which are denominated in foreign currencies.
30.2 Credit risk
Credit risk is the risk that one party to a financial instrument will fail to discharge an obligation and cause the other party to incur a financial loss.
Concentration of credit risk arises when a number of counterparties are engaged in similar business
activities or have similar economic features that would cause their ability to meet contractual obligations to be similarly affected by changes in economic, political or other conditions. Concentration of credit risk indicates the relative sensitivity of the Company’s performance to developments affecting a particular industry.
The Company is exposed to credit risk mainly on trade debts, short term investments and bank
balances. The Company seeks to minimise the credit risk exposure through having exposure only to customers considered credit worthy and obtaining securities where applicable.
The table below provides the analysis of the credit quality of financial assets on the basis of external
credit rating or the historical information about counter party default rates.
2014 2013 (Rs. in 000’) Trade debts
The analysis of trade debts is as follows:
Neither past due nor impaired 218,925 447,472 Past due but not impaired – 30 to 90 days 27,325 25,339 246,250 472,811 Bank balances
Ratings A-1+ 58,342 13,741 A1+ 76,747 536,831 P1 215 215 135,304 550,787 Short term investments
Ratings A1+ 510,000 50,000 A-1+ - 41 510,000 50,041
SHAPING THE INDUSTRY RESHAPING PAKISTAN
Ann
ual R
epor
t 201
4
52

Notes to the Financial Statements FOR THE YEAR ENDED JUNE 30, 2014
30.3 Liquidity risk
Liquidity risk is the risk that the Company will encounter difficulties in raising funds to meet commitments associated with financial instruments. The management of the Company believes that is not exposed to any significant level of liquidity risk.
The management forecasts the liquidity of the Company on the basis of expected cashflow considering the level of liquid assets necessary to mitigate the liquidity risk.
2014 Less than 3 3 to 12 On demand months Months Total ---------------------- (Rupees in ‘000) -----------------------
Trade and other payables 86,514 135,448 8,313 230,275
2013 Less than 3 3 to 12 On demand months Months Total ---------------------- (Rupees in ‘000) -----------------------
Trade and other payables 79,613 179,396 11,208 270,217
31. FAIR VALUE OF FINANCIAL INSTRUMENTS
Fair value is the amount for which an asset could be exchanged, or a liability settled, between knowledgeable, willing parties in an arm’s length transaction. The fair value of the mutual fund units is determined by using the net asset value as disclosed by the Fund Manager at each balance sheet date. The carrying values of all financial assets and liabilities reflected in the financial statements approximate their fair values.
Fair value hierarchy The Company uses the following hierarchy for disclosure of the fair value of financial instruments by
valuation technique:
Level 1: quoted prices in active market for identical assets.
Level 2: other techniques for which all inputs which have a significant effect on the recorded fair value are observable, either directly or indirectly.
Level 3: techniques which use inputs which have a significant effect on the recorded fair value that are not based on observable market data.
As at 30 June 2014, the Company has available-for-sale investments measured at fair value using
level 1 valuation technique.
Agriauto Industries Limited53

Notes to the Financial Statements FOR THE YEAR ENDED JUNE 30, 2014
32. CAPITAL RISK MANAGEMENT
The Company’s objectives when managing capital is to safeguard the Company’s ability to continue to provide returns for shareholders and benefit for other stakeholders and to maintain an optimal capital structure to reduce the cost of capital. The Company is currently financing majority of its operations through equity and working capital. The capital structure of the Company is equity based with no financing through long term borrowings.
33. TRANSACTIONS WITH RELATED PARTIES
Related parties of the Company comprise companies with common directorship, retirement funds, directors and key management personnel. Detail of transactions with related parties during the year, other than disclosed elsewhere in the financial statements, are as follows:
2014 2013 (Rs. in 000’)
Purchases of goods 311 1,749
Contribution to the Provident fund 5,159 4,866
The receivable/payable balances with related parties as at June 30, 2014 are disclosed in the respective notes to the financial statements.
34. REMUNERATION OF THE CHAIRMAN, CHIEF EXECUTIVE AND EXECUTIVES 34.1 Aggregate amounts charged in the financial statements are as follows:
2014 2013 Chief Chief Chairman Executive Executives Chairman Executive Executives ------------------------------------- (Rupees in ‘000) --------------------------------------
Managerial remuneration 15,477 10,134 42,500 15,028 9,308 40,030 Retirement benefits - 449 1,748 - 368 1,806 Utilities 391 149 866 634 122 869 Medical expenses 140 61 727 166 20 457 16,008 10,793 45,841 15,828 9,818 43,162 Number of persons 1 1 20 1 1 18
34.2 The Chairman, Chief Executive and certain Executives are also provided with free use of Company maintained vehicles in accordance with the Company’s policy.
35. PRODUCTION CAPACITY
The production capacity of the Company cannot be determined as this depends on the relative proportions of various types of vehicles and agricultural tractors produced by OEMs.
SHAPING THE INDUSTRY RESHAPING PAKISTAN
Ann
ual R
epor
t 201
4
54
Notes to the Financial Statements FOR THE YEAR ENDED JUNE 30, 2014
36. UNUTILIZED CREDIT FACILITIES As of the balance sheet date, the Company has unutilized facilities for short term running finance
available from various banks amounted to Rs. 160 million (2013: Rs. 160 million). The rate of mark-up on these finances ranges from 1 to 3 months KIBOR plus rates varying from 0.75% to 1.25% (2013: 1 to 3 months KIBOR plus rates varying from 0.75% to 1.25%). The facilities are secured by way of pari passu hypothecation of Company’s stock-in-trade, stores, spares, loose tools and trade debts.
37. NON-ADJUSTING EVENT AFTER THE BALANCE SHEET DATE
The Board of Directors in its meeting held on August 29, 2014 (i) approved the transfer of Rs. 170 million from unappropriated profit to general reserve and (ii) proposed cash dividend of Rs. 5.00 per share for the year ended June 30, 2014 amounting to Rs. 144 million for approval of the members at the Annual General Meeting to be held on September29, 2014.
38. NUMBER OF EMPLOYEES
Number of persons employed as at year end were 276 (2013: 265) and the average number of persons employed during the year were 264 (2013: 258).
39. GENERAL 39.1 Figures have been rounded off to the nearest thousands. 39.2 There were no material reclassifications to report. 40. DATE OF AUTHORISATION FOR ISSUE
These financial statements were authorized for issue on August 29, 2014 by the Board of Directors of the Company.
Fahim KapadiaChief Executive
Yutaka AraeChairman
Agriauto Industries Limited55