
28 pager FF - Eastech Flow Controls is a leading ... · The true cost of any sewer study lies in...
28
Inflow & Infiltration Micro Detection Pinpointing Inflow & Infiltration Down to Adjoining Manholes i TRACKING ®
-
Upload
nguyendung -
Category
Documents
-
view
217 -
download
0
Transcript of 28 pager FF - Eastech Flow Controls is a leading ... · The true cost of any sewer study lies in...
Inflow & Infiltration Micro Detection
Pinpointing Inflow & InfiltrationDown to Adjoining Manholes
iTRACKING®
800-226-3569 • 918-664-1212 Fax: 918-664-8494
4250 S. 76th E. AvenueTulsa, OK 74145

®
iTracker® Sensor . . . . . . . . . . . . . . . . . . . . .
I&I Micro Detection . . . . . . . . . . . . . . . . . . .
iTracking® Software . . . . . . . . . . . . . . . .
SewerWatch® App . . . . . . . . . . . . . . . . . .
Micro Detection Explained . . . . . . . . . . .
NetPak™ . . . . . . . . . . . . . . . . . . . . . . . . . .
Cost Benefits . . . . . . . . . . . . . . . . . . . . . . . . .
360 Support . . . . . . . . . . . . . . . . . . . . . . . . . .
4-5
6-9
10-11
13-15
17-21
23-25
27
28
A Technological Breakthrough inInflow & Infiltration Detection

®
INFLOW & INFILTRATION MICRO DETECTION
In case after case, extensive studies have proven that 80% of I&I originates in just 20% of the collection system.
By having the ability to deliver over 40 times the detection capability of portable-type flow meters, patented iTracking®
technology provides the means to locate and pinpoint inflow and infiltration to within a single pair of adjacent manholes.
3
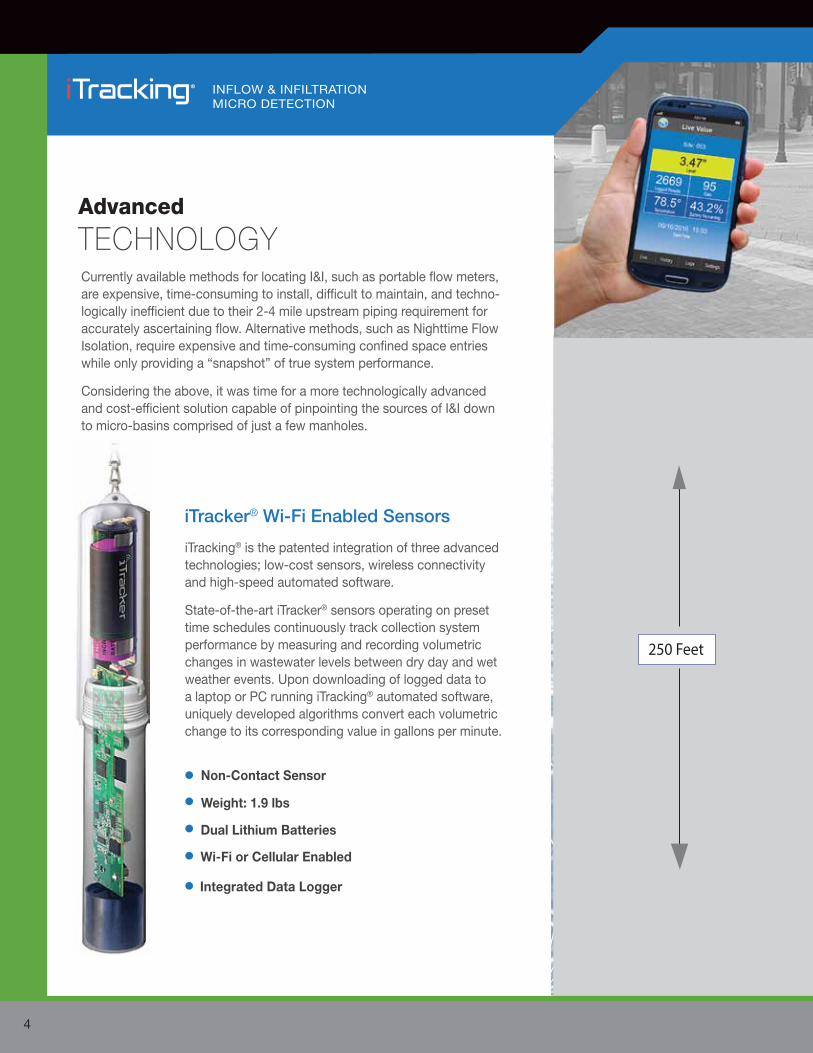
250 Feet
Currently available methods for locating I&I, such as portable flow meters, are expensive, time-consuming to install, difficult to maintain, and techno-logically inefficient due to their 2-4 mile upstream piping requirement for accurately ascertaining flow. Alternative methods, such as Nighttime Flow Isolation, require expensive and time-consuming confined space entries while only providing a “snapshot” of true system performance.
Considering the above, it was time for a more technologically advanced and cost-efficient solution capable of pinpointing the sources of I&I down to micro-basins comprised of just a few manholes.
iTracking® is the patented integration of three advanced technologies; low-cost sensors, wireless connectivity and high-speed automated software.
State-of-the-art iTracker® sensors operating on preset time schedules continuously track collection system performance by measuring and recording volumetric changes in wastewater levels between dry day and wet weather events. Upon downloading of logged data to a laptop or PC running iTracking® automated software, uniquely developed algorithms convert each volumetric change to its corresponding value in gallons per minute.
TECHNOLOGYAdvanced
INFLOW & INFILTRATION MICRO DETECTION
®
iTracker® Wi-Fi Enabled Sensors
Wi-Fi or Cellular Enabled
Integrated Data Logger
Non-Contact Sensor
Weight: 1.9 lbs
Dual Lithium Batteries
4
PERFORMANCE
$Minimal Projects Costs
Zero Maintenance
Remote Data Retrieval
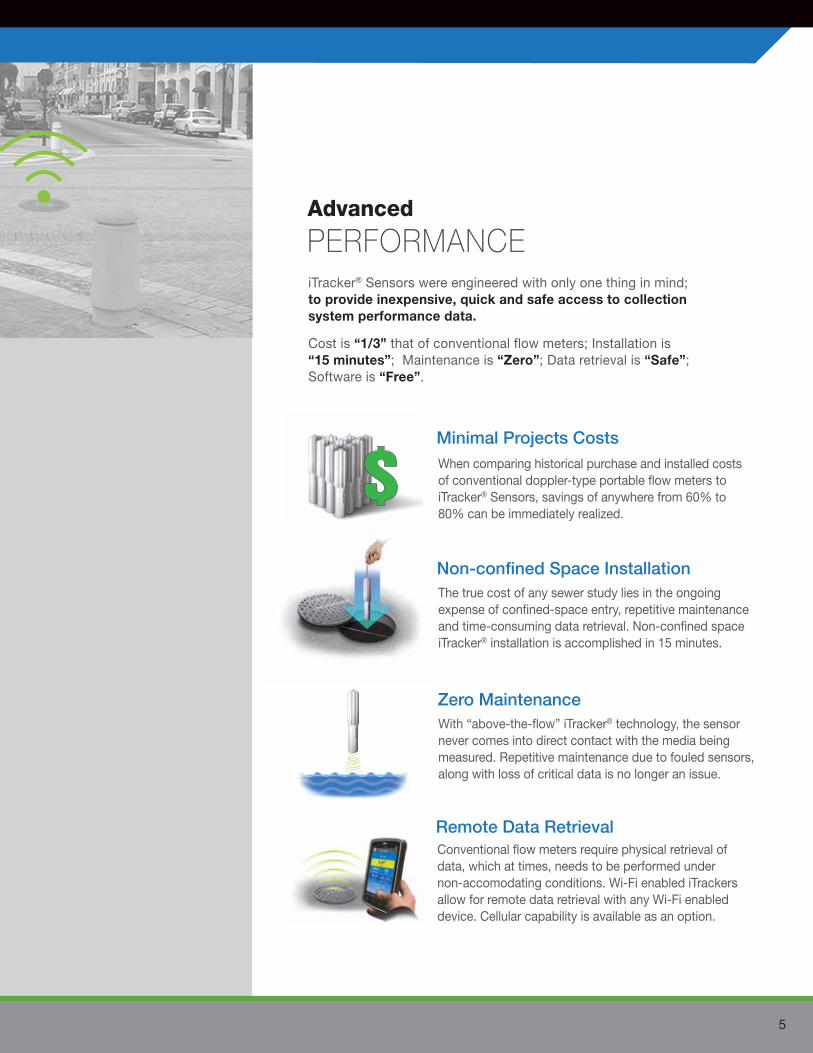
When comparing historical purchase and installed costs of conventional doppler-type portable flow meters to iTracker® Sensors, savings of anywhere from 60% to 80% can be immediately realized.
The true cost of any sewer study lies in the ongoing expense of confined-space entry, repetitive maintenance and time-consuming data retrieval. Non-confined space iTracker® installation is accomplished in 15 minutes.
With “above-the-flow” iTracker® technology, the sensor never comes into direct contact with the media being measured. Repetitive maintenance due to fouled sensors, along with loss of critical data is no longer an issue.
Conventional flow meters require physical retrieval of data, which at times, needs to be performed under non-accomodating conditions. Wi-Fi enabled iTrackers allow for remote data retrieval with any Wi-Fi enabled device. Cellular capability is available as an option.
Non-confined Space Installation
Advanced
iTracker® Sensors were engineered with only one thing in mind; to provide inexpensive, quick and safe access to collection system performance data.
Cost is “1/3” that of conventional flow meters; Installation is “15 minutes”; Maintenance is “Zero”; Data retrieval is “Safe”; Software is “Free”.
5
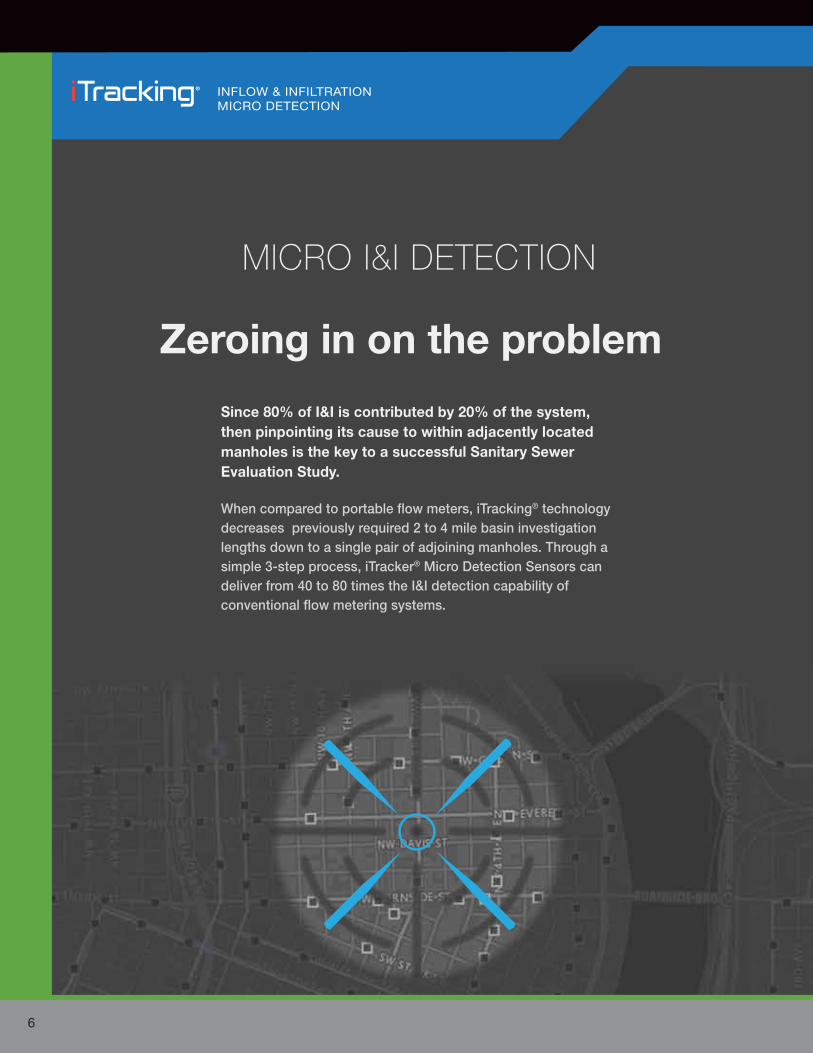
Since 80% of I&I is contributed by 20% of the system, then pinpointing its cause to within adjacently located manholes is the key to a successful Sanitary Sewer Evaluation Study.
When compared to portable flow meters, iTracking® technology decreases previously required 2 to 4 mile basin investigation lengths down to a single pair of adjoining manholes. Through a simple 3-step process, iTracker® Micro Detection Sensors can deliver from 40 to 80 times the I&I detection capability of conventional flow metering systems.
MICRO I&I DETECTION
Zeroing in on the problem
INFLOW & INFILTRATION MICRO DETECTION
®
6

C
Major Basins1A single iTracker® is strategically placed within the last manhole of each Major Basin under investigation.
System performance data collected by the iTracker® is downloaded to the iTracking® automated software program.
By the simple click of a button, a bar graph is immediately generated displaying I&I contribution rates for each Major Basin.
As can be seen from the above bar graph, Major Basin B is responsible for the highest contribution (37%) of I&I.
AVERAGE I&I VOLUME
200,000
180,000
160,000
140,000
120,000
100,000
80,000
60.000
40,000
20,000
0
GPD
A B C D E F G
D
F
E
A
EV
AL
UA
TIO
N S
TU
DY
B
BASINS
7

60,000
50,000
40,000
35,000
30,000
25,000
20,000
15.000
10,000
5,000
0
GPD
EV
AL
UA
TIO
N S
TU
DY
8
Mini-Basins2
Ten iTrackers® are strategically positioned within Major Basin B creating (10) new Mini-Basins (B-1 through B-10).
Of the seven Basins under investigation, Major Basin B was shown to be the largest contributor (37%) of I&I.
System performance data obtained from the (10) newly created Mini-Basins is downloaded to the iTracking® automated software program.
A bar graph is immediately generated displaying I&I contribution rates for each of the (10) Mini-Basins.
AVERAGE I&I VOLUME
BB
B-7B-6
B-5
B-8 B-9
B-10
B-4
B-2
B-3
MAJOR BASIN B (Mini-Basins B-1 thru B-10)
BASINS
B-1 B-2 B-3 B-4 B-5 B-6 B-7 B-8 B-9 B-10
As can be seen from the above bar graph, four out of the (10) Mini-Basins have been recognized as being responsible for 60% of the I&I within Major Basin B with Mini-Basin B-1 contributing nearly one-half of the 60%.
B-1
9
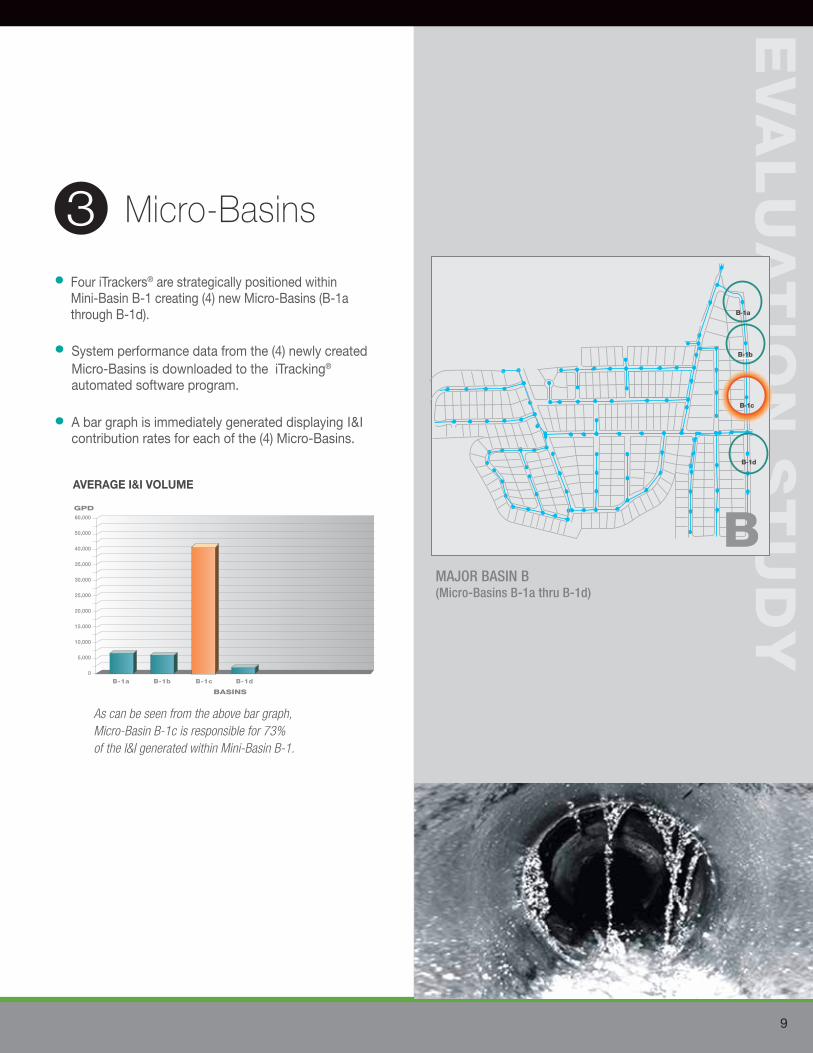
Micro-Basins3
60,000
50,000
40,000
35,000
30,000
25,000
20,000
15.000
10,000
5,000
0
GPD
B-1a B-1b B-1c B-1d
Four iTrackers® are strategically positioned within Mini-Basin B-1 creating (4) new Micro-Basins (B-1a through B-1d).
System performance data from the (4) newly created Micro-Basins is downloaded to the iTracking® automated software program.
A bar graph is immediately generated displaying I&I contribution rates for each of the (4) Micro-Basins.
AVERAGE I&I VOLUME
EV
AL
UA
TIO
N S
TU
DY
B
B-1a
B-1b
B-1c
B-1d
MAJOR BASIN B(Micro-Basins B-1a thru B-1d)
As can be seen from the above bar graph, Micro-Basin B-1c is responsible for 73% of the I&I generated within Mini-Basin B-1.
BASINS
10
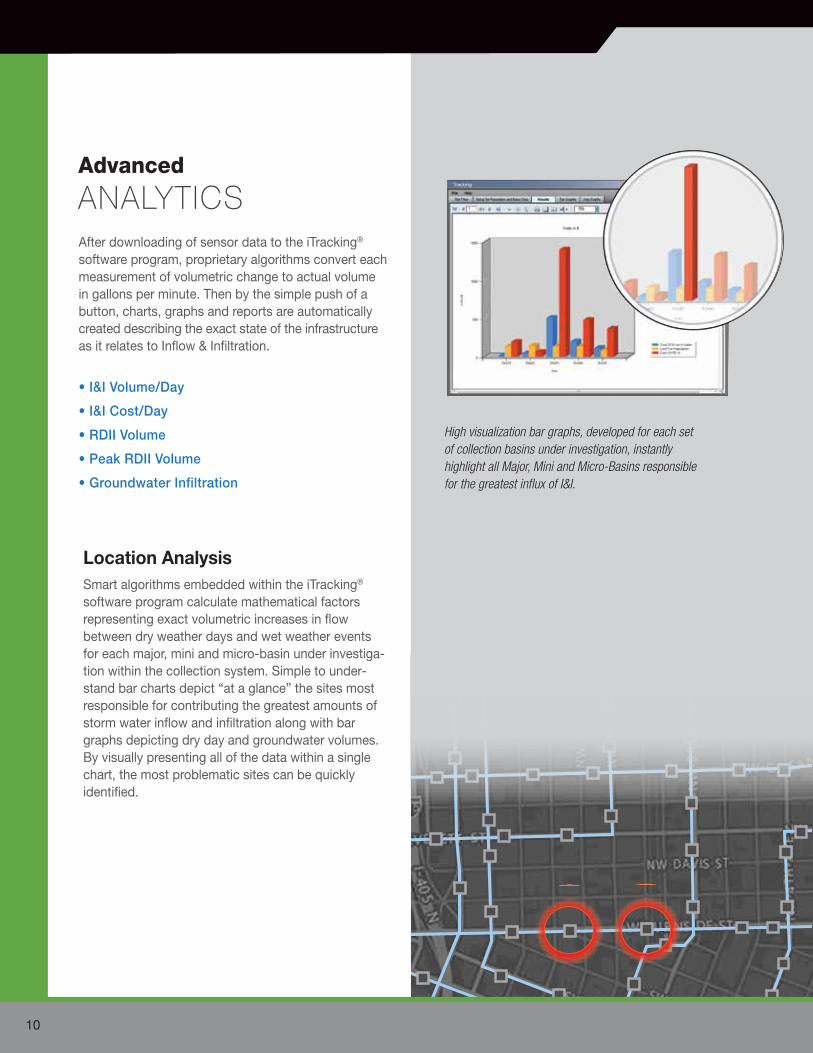
Location AnalysisSmart algorithms embedded within the iTracking® software program calculate mathematical factors representing exact volumetric increases in flow between dry weather days and wet weather events for each major, mini and micro-basin under investiga-tion within the collection system. Simple to under-stand bar charts depict “at a glance” the sites most responsible for contributing the greatest amounts of storm water inflow and infiltration along with bar graphs depicting dry day and groundwater volumes. By visually presenting all of the data within a single chart, the most problematic sites can be quickly identified.
After downloading of sensor data to the iTracking® software program, proprietary algorithms convert each measurement of volumetric change to actual volume in gallons per minute. Then by the simple push of a button, charts, graphs and reports are automatically created describing the exact state of the infrastructure as it relates to Inflow & Infiltration.
• I&I Volume/Day
• I&I Cost/Day
• RDII Volume
• Peak RDII Volume
• Groundwater Infiltration
High visualization bar graphs, developed for each set of collection basins under investigation, instantly highlight all Major, Mini and Micro-Basins responsible for the greatest influx of I&I.
ANALYTICSAdvanced

11
Detailed Hydrographs
Hydrographs report exactly what is transpiring within the collection system on a 5, 10 or 15-minute incremental basis. iTracking analysis programs start off at the Major Basin level and then drill down to greater detail as areas and sub-areas of I&I are identified and ranked by volume. This approach, in concert with a fully comprehensive set of hydro-graphs, greatly speeds up the process of dry and wet weather analysis for understanding the effects of inflow and infiltration. Hydrographs perform an array of engineering functions that greatly assist in providing a complete understanding of collection system performance. These functions include Rainfall Analysis, Groundwater Analysis, Dry vs. Wet Day Analysis, Peak RDII Analysis and Capacity Analysis.
Consolidated ReportsConsolidated analysis reports are generated detailing the effects that both dry and wet weather have upon specifically designated areas within the wastewater collection network. Location, volume and cost data is clearly organized and presented for every major, mini and micro-basin undergoing investigation for suspicion of contributing excessive amounts of inflow and infiltration.
Hydrographs display an array of engineering functions that assist in providing a complete understanding of collection system performance.
Concise “Results” Reports are efficiently presented on a single page that organizes in full detail all pertinent data relating to each site under analysis.

12
®
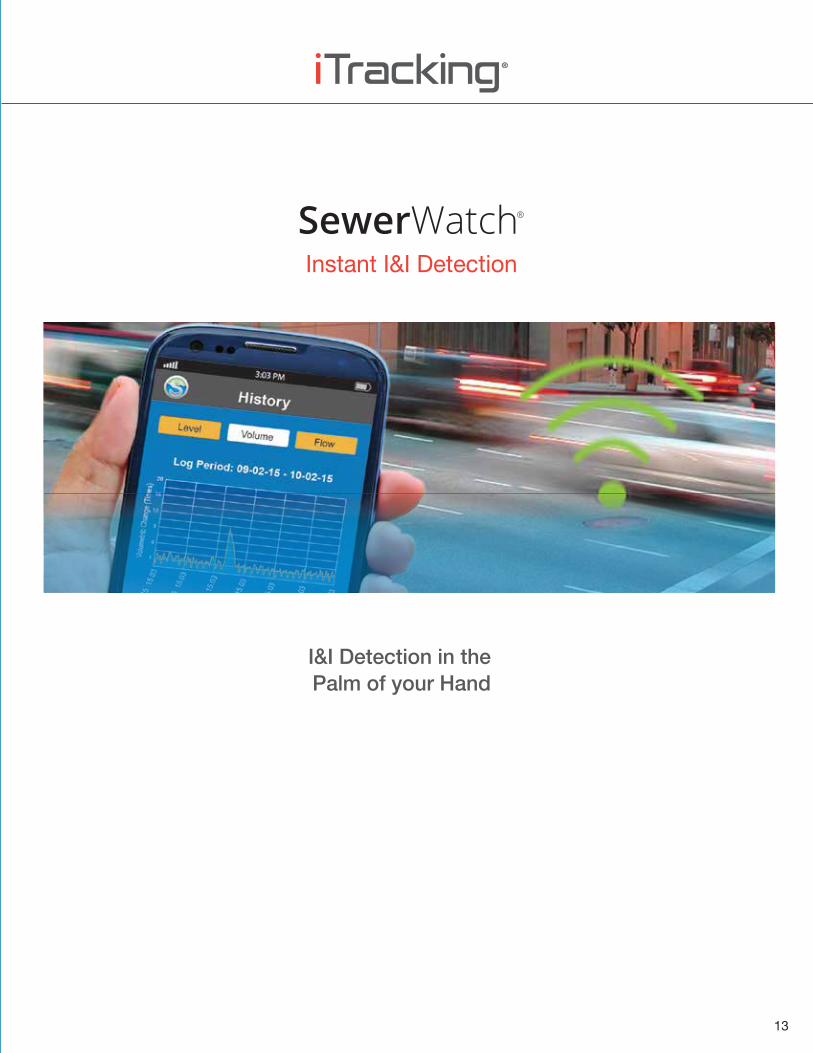
I&I Detection in thePalm of your Hand
SewerWatch®
Instant I&I Detection
13

Instant I&I Detection
Simple as 1 • 2 • 3
A Simple Tool for Identifying I&I has Finally Arrived
1. Walk or drive over to any manhole containing an iTracker sensor.
2. Connect to the iTracker’s internal server via Wi-Fi from your smart device.
3. View performance graphs in the palm of your hand showing the effects of I&I.
Eastech’s free SewerWatch® App, working hand-in-hand with iTracker® sensors, provides O&M personnel with a quick and easy way to assess the collection network for I&I. Without the need for custom analytical software or “in the road” data retrieval, municipal personnel can simply connect to any iTracker in the system, click a button, and view its behavior for the last 24 hours, 7 or 30 days right in the palm of their hand.
Easy to understand graphs “magically” appear displaying the operating characteristics of user-selected segments of the collection network along with a quick “at a glance” analysis of both peak and average increases in volume due to the influence of I&I. Operations and maintenance personnel are now able to simply go out into the field with only their smartphones and with the click of a few buttons map the performance of their community’s wastewater collection network.
SewerWatch® is the friendliest tool available for quickly locating and assessing the extent of I&I after just a single rainstorm.
14

Using just your smartphone, begin to discover what actually transpires within your collection system during changing weather conditions. Historical graphs, show-ing the past 24 hour, 7 and 30-day operating behavior of the sewer segment under surveillance, along with an automatic analysis of peak and volume increases due to I&I will be visually displayed on your phone.
SewerWatch® is the I&I Detection tool that the industry has been waiting for and the best part is that it comes “free” with the purchase of any iTracker sensor. Simply “Connect” to the iTracker, “Click” over to your browser, and in minutes, “Discover” the inner workings of your wastewater infrastructure network. One can easily navigate from wastewater levels to changes in volume between dry and wet days to actual flow in gallons per minute.
Connect, Click and Discover3:03 PM
History
Live History Logs Settings
24hr 7day 30day
Log Period: 09-02-15 - 10-02-15
Volum
etric
Chan
ge (T
imes
)
1
4
8
12
16
20
09/0
7/15
14:
55
09/1
2/15
14:
55
09/1
7/15
14:
55
09/2
2/15
14:
55
09/2
7/15
14:
55
10/0
2/15
14:
55
09/0
2/15
14:
55
30-day analysis of increases in wastewater volumes as compared to average dry day volume. Automatically calculates monthly increase in total volume (Delta V: 1.23 times) along with increase in peak volume (Delta V: 9.88 times) due to the effects of I&I when compared to average dry day volumes.
30-day analysis of increases in wastewater levels due to the effects of I&I.
30-day analysis of increases in wastewater flows due to the effects of I&I.
History
Live History Logs Settings
24hr 7day 30day
Log Period: 04-10-15 - 05-10-15
Flow
(GPM
)
200
406080
100120140160
200180
04-1
5-15
12:
15
04-2
0-15
12:
15
04-2
5-15
12:
15
04-3
0-15
12:
15
05-0
5-15
12:
15
05-1
0-15
12:
15
04-1
0-15
12:
153:03 PM
History
Live History Logs Settings
Level Volume Flow
24hr 7day 30day
Log Period: 11-07-15 - 12-07-15
LEVE
L (IN
CHES
)
10
2345678
109
11/1
2/15
10:
30
11/1
7/15
10:
30
11/2
2/15
10:
30
11/2
7/15
10:
30
12/0
2/15
10:
30
12/0
7/15
10:
30
11/0
7/15
10:
30
3:03 PM
1.23Delta V (I&I)
9.88Delta V (Peak)
15

16

17
®
Pinpointing I&I downto Adjacent Manholes
I&I Micro Detection

I&I Micro Detection
iTracking® Micro Detection is based on a simple premise:
This is exactly what Eastech’s iTracking Micro Detection technology is designed to achieve; locateinflow and infiltration down to adjacent manholes simply, safely, quickly and affordably.
Hundreds of independent flow studies have confirmed that 80% of I&I resides in just 20% of thecollection network. It is in this 20% of the system that I&I needs to be discovered. ConventionalDoppler-type flow meters, while able to measure flows in larger basins (2-4 miles) wherewastewater levels remain at heights satisfactory for covering their "bottom-sitting” sensors,have proven themselves incapable of providing the necessary high resolution monitoring requiredfor micro detecting I&I in the smaller diameter pipes (8"-12") that make up 85% of almost everycollection system. This shortcoming presented Eastech with an opportunity for developing asolution not currently possible with conventional flow metering devices.
The key to iTracking Micro Detection is the seamless integration of low-cost sensors, wirelessconnectivity and automated analytical software, delivering results where portable flow meters fallshort. iTracker® Wi-Fi and cellular-enabled sensors simply and safely record wastewater levelsfrom 0 – 100% pipe ID during dry day periods and wet weather events and then convert thosechanges in level to volumetric differences in flow through the use of uniquely developedalgorithms embedded within the iTracking software program. With the simple click of a button,bar charts, line graphs and operating performance reports are clearly presented detailing thecontribution of I&I for each mini and micro-basin within the area under investigation. In manyinstances, the problem is pinpointed down to adjacent manholes without the requirement forexpensive monitoring equipment, confined-space entry, repetitive maintenance or "in the road"data retrieval.
The success or failure of attempts to determine the actual location of I&I does not depend on the length of the sewer evaluation study period but rather on the investigative ability of the detection method employed. With iTracking Micro Detection technology, the time period to pinpoint faulty infrastructure could be as short as one rain event. This single storm approach is the biggest factor in delivering a successful and cost saving I&I detection study.
What municipalities and utilities are ultimately interested in accomplishingis NOT to measure each gallon of I&I but to quickly and cost-efficientlyPINPOINT those areas within the collection network responsible forcontributing the greatest influx of rain and groundwater.
18
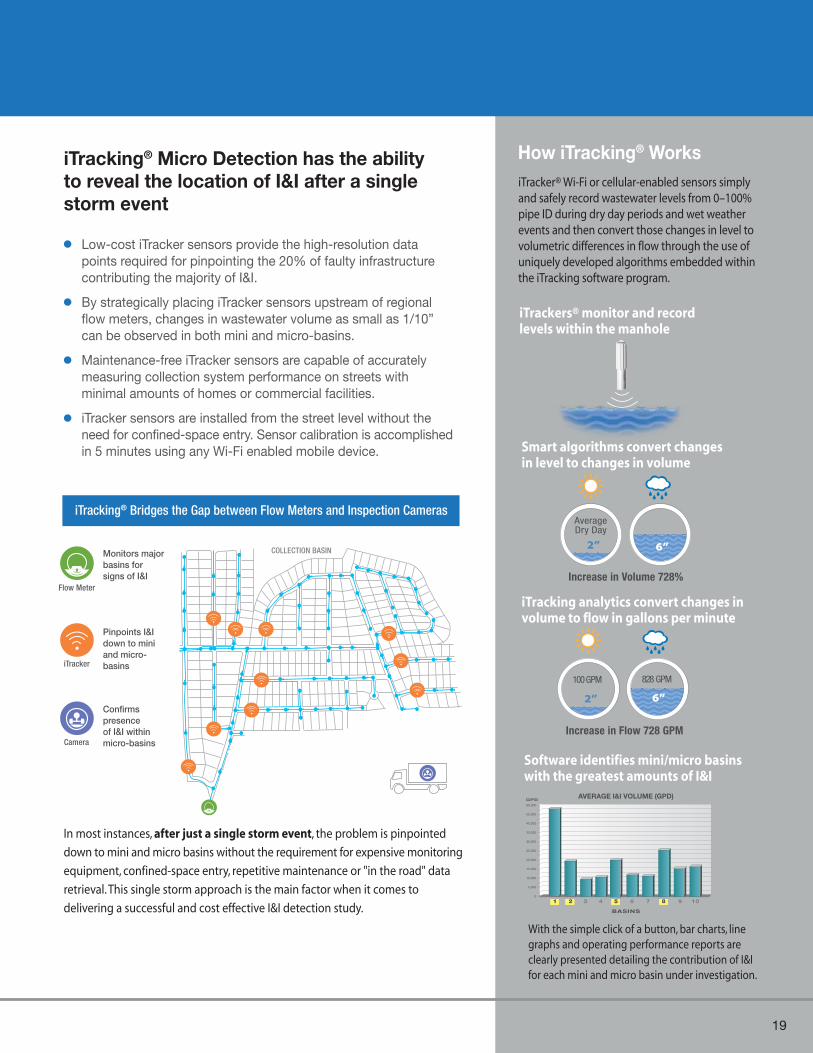
iTracking® Micro Detection has the ability to reveal the location of I&I after a single storm event
Low-cost iTracker sensors provide the high-resolution data points required for pinpointing the 20% of faulty infrastructure contributing the majority of I&I.
By strategically placing iTracker sensors upstream of regional flow meters, changes in wastewater volume as small as 1/10” can be observed in both mini and micro-basins.
Maintenance-free iTracker sensors are capable of accurately measuring collection system performance on streets with minimal amounts of homes or commercial facilities.
iTracker sensors are installed from the street level without the need for confined-space entry. Sensor calibration is accomplished in 5 minutes using any Wi-Fi enabled mobile device.
With the simple click of a button, bar charts, line graphs and operating performance reports are clearly presented detailing the contribution of I&I for each mini and micro basin under investigation.
iTracker® Wi-Fi or cellular-enabled sensors simply and safely record wastewater levels from 0–100% pipe ID during dry day periods and wet weather events and then convert those changes in level to volumetric differences in flow through the use of uniquely developed algorithms embedded within the iTracking software program.
In most instances, after just a single storm event, the problem is pinpointed
down to mini and micro basins without the requirement for expensive monitoring
equipment, confined-space entry, repetitive maintenance or "in the road" data
retrieval. This single storm approach is the main factor when it comes to
delivering a successful and cost effective I&I detection study.
iTrackers® monitor and record levels within the manhole
Smart algorithms convert changes in level to changes in volume
iTracking analytics convert changes in volume to flow in gallons per minute
Software identifies mini/micro basins with the greatest amounts of I&I
60,000
50,000
40,000
35,000
30,000
25,000
20,000
15.000
10,000
5,000
0
GPDAVERAGE I&I VOLUME (GPD)
BASINS
1 2 3 4 5 6 7 8 9 10
Flow Meter
iTracker
Camera
Monitors majorbasins for signs of I&I
Pinpoints I&I down to mini and micro- basins
Confirms presenceof I&I within micro-basins
COLLECTION BASIN
iTracking® Bridges the Gap between Flow Meters and Inspection Cameras
Increase in Volume 728%
AverageDry Day
2” 6”
Increase in Flow 728 GPM
100 GPM 828 GPM
2” 6”
How iTracking® Works
19

20
iTracker sensors are strategically distributed within each major basin responsible for allowing the entry of excess volumes of ground and storm water.
Portable flow meters monitor operating conditions in major basins (2-4 linear miles) in order to discover the extent of inflow and infiltration.
“At a glance” iTracking analytics automatically identify the mini basins (1, 2, 5 & 8) responsible for contributing the highest percentages of I&I.
Hydrographs are then created for each Major Basin showing increases in wastewater volume during periods of wet weather.
Flow Meter(Major Basin Monitoring)
iTracking (Mini Basin I&I Detection)
60,000
50,000
40,000
35,000
30,000
25,000
20,000
15.000
10,000
5,000
0
GPDAVERAGE I&I VOLUME (GPD)
BASINS
1 2 3 4 5 6 7 8 9 10
I&I Micro Detection
Peak: 0.69 MGD Low: 0.02 MGD Ave. 0.28 MGD
29-Dec
Flo
w (M
GD
)
Rai
n (in
/hr)
30-Dec 31-Dec 1-Jan 2-Jan 3-Jan 4-Jan
0.8
0.7
0.6
0.5
0.4
0.3
0.2
0.1
0.0
0.0
0.1
0.2
0.3
0.4
0.5
0.6
0.7
0.8
1
2
5
8

21
Having discovered that mini basin 1 is responsible for 30% of total I&I, iTracker sensors are relocated creating (4) micro basins within mini basin 1.
A robotic inspection camera is employed to ascertain the exact cause of the Rain- Derived Inflow & Infiltration (RDII) entering micro basin 1C.
iTracking analytics immediately discover that micro basin 1C, comprised of adjacent manholes 1B - 1C, is contributing 75% of the I&I within all of mini basin 1.
Robotic cameras are capable of providing visual evidence as to whether I&I is due to faulty construction, crumbling pipes or improper installation.
iTracking (Micro Basin I&I Detection)
Camera (I&I Confirmation)
1C 1D1B1A
60,000
50,000
40,000
35,000
30,000
25,000
20,000
15.000
10,000
5,000
0
GPDAVERAGE I&I VOLUME (GPD)
BASINS
Zeroing in on the problem
1A
1B
1C
1B
1C
1D

22

iTracking® Network Packages for Quickly Locating I&I
iTRACKING®
NetpakTM
23

Netpak™ puts forward an exciting new approach for safely, quickly and affordably locating I&I.
• Maintenance-free smart sensors are installed in under 20 minutes • Data is safely retrieved by using any Wi-Fi enabled mobile device • Analytical software pinpoints I&I with the simple click of a button • Locate I&I all the way down to a pair of adjacent manholes
A better way to pinpoint inflow & infiltration
USERFRIENDLY
iTRACKING®
SewerWatchMobile App
iTrackingSoftware
WirelessConnectivity
Non-Confined Space
Installation
ZeroMaintenance
24
SAFE

iTracking®
Network Packages
Purchase: $9,975Lease: $15.80/Day*
NETPAKTM SMiTrackers . . . . . . . . . . . . . . . . . 7 SewerWatch App . . . . . Included
iTracking Software . . . . Included
NETPAKTM MMiTrackers . . . . . . . . . . . . . . . . 18 SewerWatch App . . . . . Included
iTracking Software . . . . Included
NETPAKTM LMiTrackers . . . . . . . . . . . . . . . . 28 SewerWatch App . . . . . Included
iTracking Software . . . . Included
Purchase: $25,650 Lease: $40.65/Day*
Purchase: $39,900 Lease: $63.20/Day*
Netpaks also include all mounting hardware, accessories, batteries and 360˚ Support. *Lease: 2-year/$1 buyout
SmallMunicipality(Under 10,000 Residents)
Mid-SizeMunicipality(10 – 25,000 Residents)
LargeMunicipality(25 – 40,000 Residents)
Purchase: $4,875
NETPAKTM EPiTrackers . . . . . . . . . . . . . . . . . 3 SewerWatch App . . . . . Included
iTracking Software . . . . Included Technical Support . . . . Included
EvaluationProgram(iTracking Evaluation Kit)
AFFORDABLE
NetpakTM
25

26
27
Cost Benefits
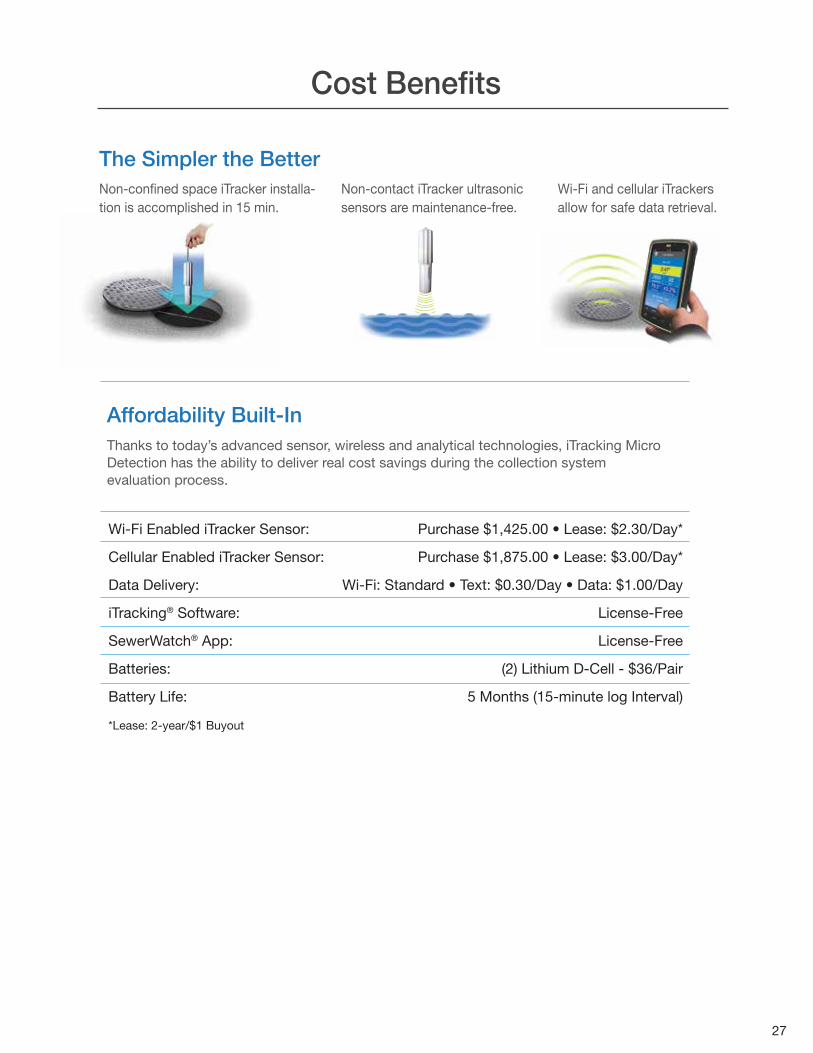
The Simpler the BetterNon-confined space iTracker installa-tion is accomplished in 15 min.
Non-contact iTracker ultrasonic sensors are maintenance-free.
Wi-Fi and cellular iTrackers allow for safe data retrieval.
Affordability Built-InThanks to today’s advanced sensor, wireless and analytical technologies, iTracking Micro Detection has the ability to deliver real cost savings during the collection system evaluation process.
Wi-Fi Enabled iTracker Sensor: Purchase $1,425.00 • Lease: $2.30/Day*
Cellular Enabled iTracker Sensor: Purchase $1,875.00 • Lease: $3.00/Day*
Data Delivery: Wi-Fi: Standard • Text: $0.30/Day • Data: $1.00/Day
iTracking® Software: License-Free
SewerWatch® App: License-Free
Batteries: (2) Lithium D-Cell - $36/Pair
Battery Life: 5 Months (15-minute log Interval)
*Lease: 2-year/$1 Buyout

smartwastewater.com
To learn more about iTracking® and how it can cost-effectively pinpoint I&I, please contact us directly at 1-800-226-3569 or visit:
800-226-3569 • 918-664-1212 Fax: 918-664-8494
4250 S. 76th E. AvenueTulsa, OK 74145
We take pride in delivering the best customer service and the highest level of support. Your 100% satisfaction is our promise.
Eastech offers comprehensive training services through multiple channels to ensure 100% success of iTracking applications.
Training videos are available on the iTracking 360° Support Portal. At your leisure, you can access introductory videos to get started quickly or watch advanced topics to enhance your skills.
iTracking 360˚ Support also includes one-on-one, interac-tive, web-based training sessions with a customer support specialist. Book these as you need them throughout the life of your project.
iTracking 360° Support
iTracking On-Site TrainingMore Than Your Typical Support
Online Training Videos
Web-Based Training


