276 O. BOCK - d28rz98at9flks.cloudfront.net · Synthetic seismogram sections are shown (Figs 1, 2)...
5
BMR Journal of Au stralian Geology & Geophysics, 13,275- 279 © Commonwealth of Australia 1993 Depth phases from local earthquakes Gunter Bock l Synthetic seismogram modelling and observations suggest that depth phases from local crustal earthquakes are of the type sX , where X stands for P g, P n, and the reflections from the crust-mantle boundary, mainly PMP and SMS, Depth phases of the type pX generally have much smaller amplitudes and are unlikely to stand out in seismograms . The differential times sX-X provide a very Introduction Focal depths of Australian earthquakes are usually poorly constrained. Most, if not all earthquakes have their foci in the upper crust, at depths not deeper than about 20 km. Good depth control is normally provided by data of stations that are located close to the epic entre. This favourable condition is rarely met in Australia. Accurate depth estimates have been obtained for large earthquakes and some of their foreshock and aftershock sequences in central and western Australia using waveform analysis of local and teleseismic seismograms and data of temporary seismic networks (Langston, 1987; Fredrich & others, 1988; Bowman & others, 1990; Choy & Bowman, 1990). Langston (1987) used the depth phase sP g and the ratio Rg/Sg observed at distances of less than 100 km to constrain focal depths of events in the 1968 Meckering earthquake sequence. He showed that most foreshocks and aftershocks occurred within 2 km of the surface. Most weak earthquakes in Australia usually do not attract attention far beyond the realm of routine interpretation. In the absence of reliable constraints, focal depths are often fixed to a value chosen by the interpreter. An improved knowledge of the depth distribution of earthquakes, however, is of considerable importance in seismotectonic studies of the Australian continent. It is the purpose of this paper to discuss depth-sensitive phases from crustal earthquakes at distances to several hundred kilometres, which may provide a much improved depth control over what is possible with first arrival time data only. The successful identification of such phases is considerably aided, and in the experience of the author only possible in many cases, if digital seismograms are avail• able. In this paper, synthetic seismograms are presented that tell us which depth-sensitive phases we may expect to see on seismograms. Examples from the Armidale (New South Wales) seismograph station, where a PC-based data logger has been successfully tested for more than a year, are then discussed. Synthetic seismograms Synthetic seismograms have been calculated for a shear dislocation point source using the reflectivity method of Kind (1978, 1979a). The crustal gradient model used is shown in Table 1. A crustal thickness of 33 km is assumed which is based on seismic refraction studies in the New England Orogen described by Finlayson &; Collins (in GeoForschungsZentrum , Telegrafenberg A6, 0-1561 Potsdam, Germany ; formerly Department of Geology aM Geophysics, University of New England, Armidale NSW 23$1 good control of focal depth. Examples of earthquakes that occurred in May and June 1991 in an area northwest of Kempsey (New South Wales) and in September 1991 near St George (Queensland) indicate that their foci were in the uppermost crust, at depths of between 2 and 3 km. press). Synthetic seismogram sections are shown (Figs 1, 2) for two different distance ranges. Seismograms from a 3 km deep source (Fig. I) are shown for the distance range from 70 to 140 km. A dip slip shear dislocation was assumed along a plane dipping at 45° towards the receivers. The crustal phase P g is the first arrival followed about 0.6 s later by a second phase which, based on travel time, is the surface reflection sP g' This is a phase which has left the focus upwards as an S wave, been converted at the surface to a P wave, and then has travelled the remaining path to the receivers as P entirely confined to the upper crust. Following the P g wavegroup another set of phases arrives between 2 sand 5 s reduced time. The first phase has the travel time of the Moho reflection P MP, Its amplitude is DEPTH = 3 km 45 degree dip slip Vertical Component 22 19 16 <0 ..... OJ 13 Cl 10 I ., E i= Sm'P 1-- I · .... 1···· · ·····1··· .. ·· .. .. · .. ·· t·· ··· ·· ...... . ... . .. . ....... " 4 PmP ------- ------ ------ .. : ..... . :. :':. " ::' :" : ::' :" :':::'-::'::" ::"- ---- r --- r --- - P g -2 - -r -- _ -5 I I I II I I II I I I I I II I I I I I I I 1 I Ie! I I (I I I j M n lW Distance (km) Figure 1. Synthetic seismograms for a 45° dip slip point source at 3 km depth. The arrival times of various crustal phases have been marked by the dashed lines; the associated depth phases of type sX , where X stands for P g , PMP, SMP or SMS are marked by dotted lines. Table 1. Crustal gradient model. Depth P-wave S-wave Density Qp Qs (km) velocity (kmls) (glcc) 0 6.00 3.53 2.53 1000 444 12.5 6.00 3.53 2.53 1000 444 22 6. 15 3.61 2.58 1000 444 33 6.45 3.79 2.70 1000 444 33 7.70 4.46 3.17 1000 444 45 7.80 4.50 3.21 1000 444 60 8.08 4.66 3.31 1000 444 92 8.12 4.69 3.33 1000 444
Transcript of 276 O. BOCK - d28rz98at9flks.cloudfront.net · Synthetic seismogram sections are shown (Figs 1, 2)...
BMR Journal of Australian Geology & Geophysics, 13,275- 279 © Commonwealth of Australia 1993
Depth phases from local earthquakes Gunter Bock l
Synthetic seismogram modelling and observations suggest that depth phases from local crustal earthquakes are of the type sX , where X stands for P g, P n , and the reflections from the crust-mantle boundary , mainly PMP and SMS, Depth phases of the type pX generally have much smaller amplitudes and are unlikely to stand out in seismograms . The differential times sX-X provide a very
Introduction Focal depths of Australian earthquakes are usually poorly constrained. Most, if not all earthquakes have their foci in the upper crust, at depths not deeper than about 20 km. Good depth control is normally provided by data of stations that are located close to the epic entre. This favourable condition is rarely met in Australia.
Accurate depth estimates have been obtained for large earthquakes and some of their foreshock and aftershock sequences in central and western Australia using waveform analysis of local and teleseismic seismograms and data of temporary seismic networks (Langston, 1987 ; Fredrich & others, 1988; Bowman & others, 1990; Choy & Bowman, 1990). Langston (1987) used the depth phase sP g and the ratio Rg/Sg observed at distances of less than 100 km to constrain focal depths of events in the 1968 Meckering earthquake sequence. He showed that most foreshocks and aftershocks occurred within 2 km of the surface.
Most weak earthquakes in Australia usually do not attract attention far beyond the realm of routine interpretation. In the absence of reliable constraints , focal depths are often fixed to a value chosen by the interpreter. An improved knowledge of the depth distribution of earthquakes, however, is of considerable importance in seismotectonic studies of the Australian continent.
It is the purpose of this paper to discuss depth-sensitive phases from crustal earthquakes at distances to several hundred kilometres, which may provide a much improved depth control over what is possible with first arrival time data only. The successful identification of such phases is considerably aided, and in the experience of the author only possible in many cases , if digital seismograms are avail•able. In this paper, synthetic seismograms are presented that tell us which depth-sensitive phases we may expect to see on seismograms. Examples from the Armidale (New South Wales) seismograph station, where a PC-based data logger has been successfully tested for more than a year, are then discussed.
Synthetic seismograms Synthetic seismograms have been calculated for a shear dislocation point source using the reflectivity method of Kind (1978, 1979a). The crustal gradient model used is shown in Table 1. A crustal thickness of 33 km is assumed which is based on seismic refraction studies in the New England Orogen described by Finlayson &; Collins (in
GeoForschungsZentrum , Telegrafenberg A6, 0-1561 Potsdam, Germany ; formerly Department of Geology aM Geophysics, University of New England, Armidale NSW 23$1
good control of focal depth. Examples of earthquakes that occurred in May and June 1991 in an area northwest of Kempsey (New South Wales) and in September 1991 near St George (Queensland) indicate that their foci were in the uppermost crust, at depths of between 2 and 3 km .
press) . Synthetic seismogram sections are shown (Figs 1, 2) for two different distance ranges .
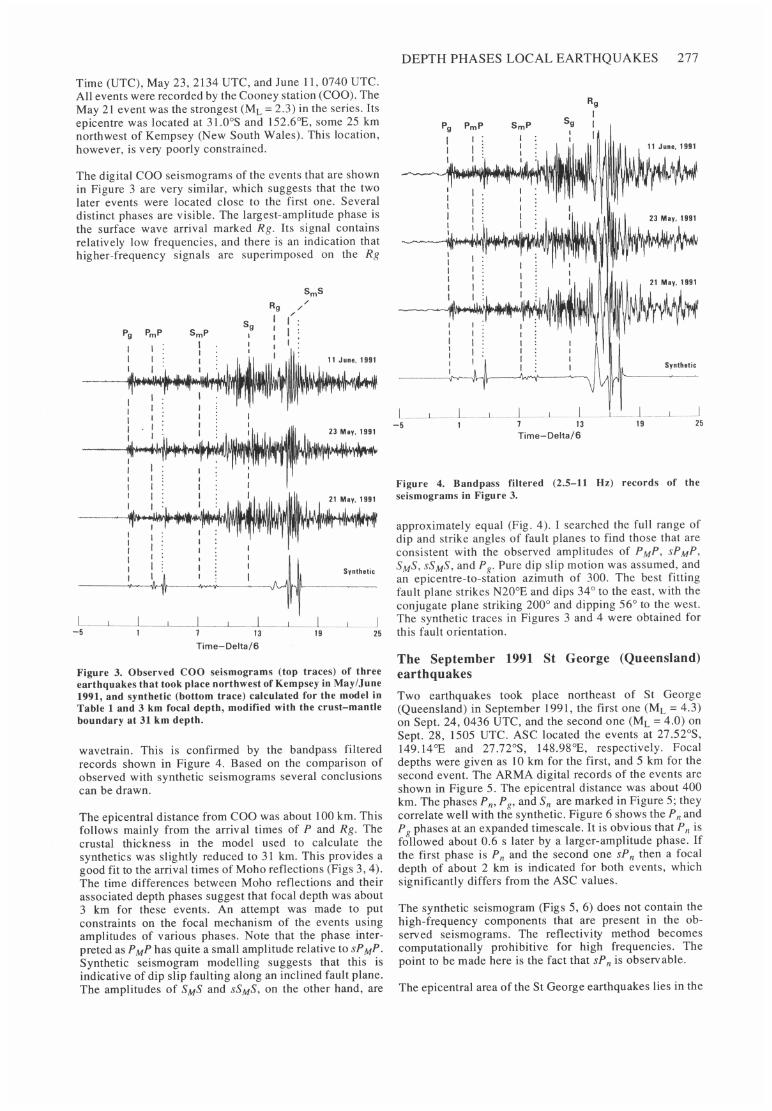
Seismograms from a 3 km deep source (Fig . I) are shown for the distance range from 70 to 140 km. A dip slip shear dislocation was assumed along a plane dipping at 45 ° towards the receivers . The crustal phase P g is the first arrival followed about 0.6 s later by a second phase which, based on travel time, is the surface reflection sP g' This is a phase which has left the focus upwards as an S wave, been converted at the surface to a P wave, and then has travelled the remaining path to the receivers as P entirely confined to the upper crust.
Following the P g wavegroup another set of phases arrives between 2 sand 5 s reduced time. The first phase has the travel time of the Moho reflection P MP, Its amplitude is
DEPTH = 3 km
45 degree dip slip
Vertical Component 25 ,...,---,-,1 111111 111-----,-,~
22
19
16 <0 ..... ~ OJ
13 ~SmS
Cl 10 I ., E i=
Sm'P 1-- -- -.~- - - - -
I · .... 1··········1··· .. ·· .. ~· .. · .. ··t······· .......... ........... " 4 ~ PmP ------- ------ ------ -----~ ----~l~~~~l~~~~ .. 1~-: ...... :. :':."::' ::":::' ::" :':::'-::'::" ::"- ----r--- r--- -Pg -2 ~ --r-- _ -5 I I I II I I II I I I I I II I I I I I I I 1 I Ie! I I ( I I I j
M n ~ 1~ lW 1~ 1~
Distance (km)
Figure 1. Synthetic seismograms for a 45° dip slip point source at 3 km depth. The arrival times of various crustal phases have been marked by the dashed lines; the associated depth phases of type sX, where X stands for Pg, PMP , SMP or SMS are marked by dotted lines.
Table 1. Crustal gradient model. Depth P-wave S-wave Density Qp Qs (km) velocity (kmls) (glcc)
0 6.00 3.53 2.53 1000 444 12.5 6.00 3.53 2.53 1000 444
22 6.15 3.61 2.58 1000 444 33 6.45 3.79 2.70 1000 444 33 7.70 4.46 3.17 1000 444 45 7.80 4.50 3.21 1000 444 60 8.08 4.66 3.31 1000 444 92 8.12 4.69 3.33 1000 444

276 O. BOCK
small because P wave radiation is weak in the takeoff direction of PMP for the 45° dip slip source used in the calculations. About 1 s after P MP a second, large-amplitude phase arrives. Its arrival time suggests that it is the surface reflection sPMP which leaves the focus upwards as an S wave, is converted at the surface to P, and then follows along the PMP path to the receivers. The amplitude of PMP is sensitive to the radiation pattern. Assuming a vertical strike slip dislocation, for example, PMP and sPMP reach similar amplitudes.
Another reflection from the crust-mantle boundary and associated depth phase shows up in Figure 1 between 7 s and 10 s reduced ·time. The earlier phase fits the travel time of SMP while the phase arriving about 1.5 s after SMP is the surface reflection SSMP,
The Moho reflection SMS and associated depth phase SSMS shows up between 15 sand 20 s reduced time; it interferes at larger distances with the surface wave arrival Rg .
The synthetic seismogram section in Figure 2 covers the distance range from 250 to 450 km. A vertical strike slip dislocation source at 6 km depth was assumed, with the receivers located at 45° azimuth to the strike of the fault plane. The first arrivals are upper mantle phases (P n) that are followed about 2.5 s later by a second phase which fits the travel time for the surface reflection sP n' The phase sP n
has been discussed by other authors (Kind, 1979b; Zonno & Kind, 1984; Barbano & others, 1985), and has been used by Bock (in press) to constrain the focal depth of the 1990 Woods Reef earthquake. If sP n can be correctly identified it provides a stringent constraint on focal depth. As noted by Bock (in press) the amplitude ratio P n/sP n depends strongly on the source mechanism. For a 45° dip slip source, for example, the P n amplitude becomes quite small compared to sP n. In this case P n may go unnoticed, especially for weaker earthquakes, and sP n may be picked as first arrival and erroneously interpreted as P n.
Other depth phases in Figure 2 are associated with P g' Sn and multiple reflections from the crust-mantle boundary.
DEPTH = 6 km
Vertical strike slip
Vertical Component
75 ~ "I i " i I " " I " " I " " I " " \ "i l" )::£ i~ 60 I- k= 45 I•eD 1 tttl Il.-.1 s"-
...... $ Qi o I
Q)
E
30 f- + .. ~~::~---- ----- I i= 15 I- j -
• f- -+1:1 . 1:t:t J _~~ P, -15 I I , I I I , ,1' 1 !! I I I I ! I I !!! I!! ! ! I I I I!!!! I ! ! I I I l' I
225 275 325 375 425 475 Distance (km)
Figure 2. Synthetic seismograms for a strike slip point source along a vertical plane at 6 km depth. Dotted lines indicate depth phases of type sX associated with Pn • Pg and Sn.
Some of these phases are identified in Figure 2. The occurrence of multiple reflections from the Moho depends on many factors such as crustal thickness, crustal velocities and sharpness of the crust-mantle transition. Their actual arrival times and amplitudes are clearly subject to regional variations. The differential times between these phases and associated depth phases however are much less dependent on regional variations in crustal structure; they are therefore well suited as depth constraint if they can be reliably identified.
Note that in all the cases discussed in this section the depth phases are of the type sX, where X stands for P g' P n' or reflections from the Moho. Depth phases of the type pX are unlikely to stand out with significant amplitude because the P-P reflection coefficient for the free surface is small over a range of angles of incidence (Aki & Richards, 1980, 142). The S-P reflection coefficient of the free surface, on the other hand, reaches large values particularly if the angle of incidence is near critical.
Examples Armidale seismograph In this section, recordings of several earthquakes that occurred in eastern Australia in 1991 are discussed with regard to the presence of depth phases. The observations are from the vertical-component, short-period Armidale seismograph which is part of the National Seismograph Network operated by the Australian Seismological Centre (ASC). The seismometer was located until September 1991 in the Cooney (COO) tunnel at 30.568°S, 151.884°E, approximately 25 km east of Armidale. In September 1991 it was shifted to a new location at Newholme, about 7 km north of Armidale (ARMA, 30.4200 S, 151.628°E). A telephone line has been used to transmit the seismometer signal to the recording site in the Department of Geology and Geophysics of the University of New England where seismograms are routinely recorded as Helicorder chart records.
Since April 1991, recordings of most earthquakes have been obtained also as digital records. This was achieved by digitising the output of the demodulator at the recording site using a 12 bit analogue-digital converter (ADC) connected to an AT compatible microcomputer. A data acquisition program written in Quickbasic by Boggs (1991) is based on the comparison of short term average (STA) and long term average (L T A) values of the seismic signal as described by McEvilly & Majer (1982). If the STA exceeds the L TA by a prescribed value, an event is indicated and the data are stored with a sample frequency of 50 Hz to hard disk. The dynamic range of the digital record is of course limited by the analogue recording system. Furthermore, data are recorded over a narrow frequency band because of the filter settings for the analogue system. Therefore, the quality of the Armidale digital records is poor by comparison to those obtained from state of the art broadband seismographs. Nevertheless, the availability of a digitised copy of the analogue seismogram leads to a dramatic improvement in data quality, and much more information can be extracted from the digital records than is possible with chart recordings as demonstrated by the following examples.
The 1991 Kempsey earthquakes The first example is from a series of three earthquakes that occurred in 1991 on May 21, 0324 Universal Coordinated
Time (UTC), May 23, 2134 UTC, and June 11 , 0740 UTC. All events were recorded by the Cooney station (COO). The May 21 event was the strongest (ML = 2.3) in the series. Its epicentre was located at 31.00S and 152.6°E, some 25 km northwest of Kempsey (New South Wales). This location, however, is very poorly constrained.
The digital COO seismograms of the events that are shown in Figure 3 are very similar, which suggests that the two later events were located close to the first one. Several distinct phases are visible. The largest-amplitude phase is the surface wave arrival marked Rg. Its signal contains relatively low frequencies, and there is an indication that higher-frequency signals are superimposed on the Rg
P9 Pm P
I I
I I I
5 mP I I I
59
5 m5 R9 //
I ( I I
I. 1,.1 . . I : . 11 SynthetIC
------~.~~i~~II----~~-------
L-__ ~ __ ~ __ ~ __ -L __ ~ __ ~ ____ ~ __ ~~~
13 19 25 Time-Delta/6
Figure 3. Observed COO seismograms (top traces) of three earthquakes that took place northwest of Kempsey in May/June 1991, and synthetic (bottom trace) calculated for the model in Table 1 and 3 km focal depth, modified with the crust-mantle boundary at 31 km depth.
wavetrain . This is confirmed by the bandpass filtered records shown in Figure 4. Based on the comparison of observed with synthetic seismograms several conclusions can be drawn.
The epicentral distance from COO was about 100 km. This follows mainly from the arrival times of P and Rg. The crustal thickness in the model used to calculate the synthetics was slightly reduced to 31 km. This provides a good fit to the arrival times of Moho reflections (Figs 3, 4). The time differences between Moho reflections and their associated depth phases suggest that focal depth was about 3 km for these events. An attempt was made to put constraints on the focal mechanism of the events using amplitudes of various phases . Note that the phase inter•preted as P MP has quite a small amplitude relative to sP MP, Synthetic seismogram modelling suggests that this is indicative of dip slip faulting along an inclined fault plane. The amplitudes of SMS and SSMS, on the other hand, are
DEPTH PHASES LOCAL EARTHQUAKES 277
1 ___ L _ 1 -5
5 m P I I
59
13 Time-Delta/6
Synthetic
l~-L J 19 25
Figure 4. Bandpass filtered (2.5-11 Hz) records of the seismograms in Figure 3.
approximately equal (Fig . 4) . I searched the full range of dip and strike angles of fault planes to find those that are consistent with the observed amplitudes of PMP, sPMP, SMS, SSMS , and Pg . Pure dip slip motion was assumed , and an epicentre-to-station azimuth of 300. The best fitting fault plane strikes N200E and dips 34° to the east, with the conjugate plane striking 200° and dipping 56° to the west. The synthetic traces in Figures 3 and 4 were obtained for this fault orientation.
The September 1991 St George (Queensland) earthquakes Two earthquakes took place northeast of St George (Queensland) in September 1991, the first one (ML = 4.3) on Sept. 24, 0436 UTC, and the second one (ML = 4.0) on Sept. 28, 1505 UTC. ASC located the events at 27.52°S, 149.14°E and 27.72°S, 148.98°E, respectively. Focal depths were given as 10 km for the first, and 5 km for the second event. The ARMA digital records of the events are shown in Figure 5. The epicentral distance was about 400 km. The phases P n' P g' and Sn are marked in Figure 5; they correlate well with the synthetic. Figure 6 shows the P nand P g phases at an expanded timescale. It is obvious that P n is followed about 0.6 s later by a larger-amplitude phase. If the first phase is P n and the second one sP n then a focal depth of about 2 km is indicated for both events, which significantly differs from the ASC values .
The synthetic seismogram (Figs 5, 6) does not contain the high-frequency components that are present in the ob•served seismograms. The reflectivity method becomes computationally prohibitive for high frequencies. The point to be made here is the fact that sP n is observ able.
The epicentral area of the St George earthquakes lies in the

278 G. BOCK
-20 Time-Delta/6
Figure S. Observed ARMA seismograms (top traces) of the St George earthquakes that occurred in September 1991 and synthetic (bottom trace) calculated for 2 km focal depth.
Surat Basin near Riverslea. Sediment thicknesses there are about 1.5 km (Petroleum Resources Assessment and Development Subprogram, 1990). This suggests that the St George earthquakes took place near the top of the basement underlying the basin sediments. I investigated the question of whether the presumed phase sP n could be in fact a reflection from the sediment-basement interface rather than from the surface. This however is unlikely because reasonable reflection coefficients of the sediment-base•ment interface are too small to produce the large-amplitude arrivals observed.
The P g wavetrain, by comparison, is relatively complex in both observed and synthetic seismograms. It would be quite difficult to identify reliably depth phases in the P g coda. The same applies to the Lg wavetrain. The presence of significant scattered energy following the P g and Lg arrival s makes it impossible to identify any reflections from the Moho and associated depth phases . It is therefore concluded that, if only vertical-component records from a single station are available, the phase sP n is probably the
-15 -10
Pn
-5 Time-Delta/6
Pg I
: 28 Sopt .. 1991
24 Sopt .. 1991
Synthetic
10
Figure 6. The Pn and Pg wavetrains of Figure 5 in close up view.
'-
only useful body wave phase which allows us to put constraints on focal depth from recordings at several hundred kilometres distance.
Discussion and summary Synthetic seismograms presented in this paper suggest that a number of depth phases can be observed from local earthquakes at distances up to several hundred kilometres. At epicentral distances of about 100 km or less, reflections from the crust-mantle boundary and associated surface reflections may show up in the seismograms. To be observed over a wide distance range, the crust-mantle transition must be sharp compared with the wavelength of the signals . If the transition is smooth, observable reflec•tions may be restricted to distances near critical. The depth phases are mainly of the type sX, where X represents the Moho reflections PMP, SMP, or SMS, Depth phases of the type pX are negligible in amplitude because the P-P reflection coefficient of the free surface is much smaller than the S-P coefficient. Differential times sX -X are shown plotted against focal depth (Fig. 7) for the crustal model in Table 1.
~ Ql E i=
10ro------------,------------;r------------r------------,
+---+ sPmP - PmP * - - * sSms - sms ><---+( sSmP - sm P ~sPn-Pn
-- sPg-Pg ,/ ,)<,/
,/
,/ ,)<,/
,)<,/ ,/
,/ ,/
'" ;x ,/
,)<,/
10
Depth (km)
,/,/ ,/
,/ ,/
,/
15 20
Figure 7. Differential times sX - X for the phases marked in the legend box against focal depth.
Synthetic seismograms suggest that another observable depth phase may be sPs This phase is less sensitive to focal depth than sX as the differential time sP g - P g reaches only about half the values of the sX - X times associated with Moho reflections (Fig . 7) .
At epicentral distances where P n is the first arrival, the most useful depth phase is sP n' To be observed at single stations, the time difference P g - P n must be large enough so that sP n arrives well before P g This means that the epicentral distance must be well beyond the distance at which P g is overtaken by P n' The differential sP n - P n times are also shown in Figure 7.
The method of synthetic seismogram comparison has been applied to earthquakes that occurred in 1991 near Kempsey (New South Wales) and St George (Queensland) . Very shallow depths between 2 and 3 km are indicated for these events, while the 1990 Woods Reef earthquake investi•gated in an earlier study by Bock (in press) was located at a greater depth, near 12 km. A prerequisite for the success of the method described in this paper was the availability

of digital images of the Helicorder chart recordings of the Armidale seismograph. Without this, identification of the various phases contained in the P wave coda would have been impossible. The usage of depth-sensitive phases as discussed in this paper and also by Langston (1987) may eventually lead to a much improved picture of the depth distribution of Australian earthquakes
Acknowledgements I am grateful to Frank Ludbey who installed the ADC and made it work, to Russell Cuthbertson who drew my attention to the Petroleum Resources Assessment paper, and to Riki Davidson who critically read the manuscript. Marion Leiba from the Australian Seismological Centre is thanked for providing the epicentrallocation of the May 21 1991 Kempsey earthquake. This research was supported by an Internal Research Grant from the Department of Geology and Geophysics of the University of New England.
References Aki, K. & Richards, P.G., 1980 - Quantitative seismology
theory and methods. Vol. I . Freeman and Co., San Francisco .
Barbano, M.S., Kind, R. & Zonno, G., 1985 - Focal parameters of some Friuli earthquakes (1976-1979) using complete theoretical seismograms. Journal of Geophysics 58 , 175-182.
Bock, G., in press - The Woods Reef (New South Wales) earthquake of 14 November 1990: focal mechanism derived from amplitude ratios and synthetic seismo•grams. Australian Journal of Earth Sciences.
Boggs, D., 1991 - A computer based earthquake record acquisition system. Department of Geology and Geo•physics, University of New England, unpublished pro•ject report.
Bowman, J.R., Gibson, G. & Jones, T., 1990 - After•shocks of the January 22, 1988 Tennant Creek, Australia intraplate earthquakes : evidence for a complex fault
DEPTH PHASES LOCAL EARTHQUAKES 279
geometry. Geophysical Journal International 100, 87-97.
Choy, G.L. & Bowman, J.R., 1990 - Rupture process of a multiple main shock sequence: analysis of teleseismic, local, and field observ ations of the Tennant Creek, Australia, earthquakes of January 22, 1988. Journal of Geophysical Research 95, 6867-6882.
Finlayson, D.M. & Collins, C.D.N., in press - Li•thospheric velocity structures under New England, northeastern New South Wales - contrasts with other areas of the Tasman Orogen. Australian Journal of Earth Sciences.
Fredrich, J., McCaffrey, R. & Denham, D. , 1988 - Source parameters of seven large Australian earthquakes deter•mined by body waveform inversion. Geophysical Jour•na195 , 1- 13.
Kind, R. , 1978 - The reflectivity method for a buried source. Journal of Geophysics 44,603- 612.
Kind, R., 1979a - Observations of sPn from Swabian Alb earthquakes at the GRF array. Journal of Geophysics 45 , 337-340.
Kind, R. , 1979b - Extensions of the reflectivity method. Journal of Geophysics 45 ,373-380.
Langston, CA., 1987 - Depth of faulting during the 1968 Meckering, Australia, earthquake sequence determined from waveform analysis of local seismograms. Journal of Geophysical Research 92, 11561-11574.
McEvilly, T.V. & Majer, E.L., 1982 - ASP: an automated seismic processor for microearthquake networks. Bulle•tin of the Seismological Society of America 72, 303-325.
Petroleum Resources Assessment and Development Sub•program, 1990 - Petroleum Resources of Queensland (Review to June 30, 1989). Queensland Department of Resource Industry Review Series , Department of Re•source Industries , Queensland.
Zonno, G. & Kind, R., 1984 - Depth determination of North Italian earthquakes using Griifenberg data. Bulle •tin of the Seismological Society of America 74, 1645-1659.