27 central nervous system changes in acquired immunodeficiency
14
27 Central Nervous System Changes in Acquired Immunodeficiency Syndrome
-
Upload
muhammad-bin-zulfiqar -
Category
Education
-
view
54 -
download
4
Transcript of 27 central nervous system changes in acquired immunodeficiency
27 Central Nervous System Changes in Acquired
Immunodeficiency Syndrome
CLINICAL IMAGAGINGAN ATLAS OF DIFFERENTIAL DAIGNOSIS
EISENBERG
DR. Muhammad Bin Zulfiqar PGR-FCPS III SIMS/SHL
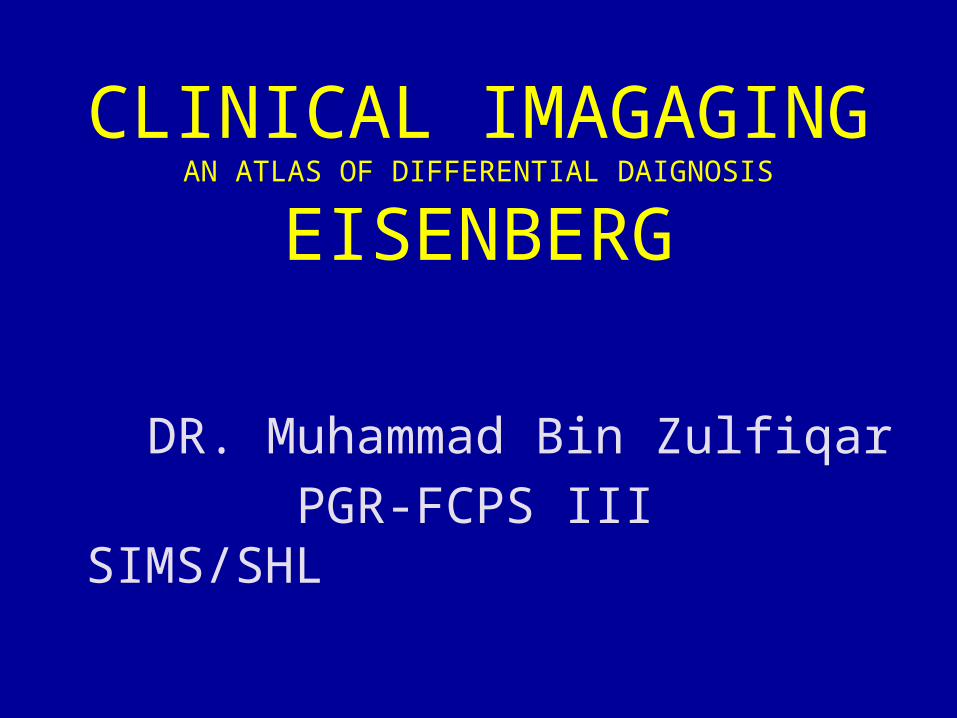
• Fig SK 27-1 Toxoplasmosis. Contrast-enhanced CT scan shows multiple small areas of ring and solid enhancement in the region of the cerebral peduncles and pons. A small round area of enhancement is seen in the left occipital lobe.44
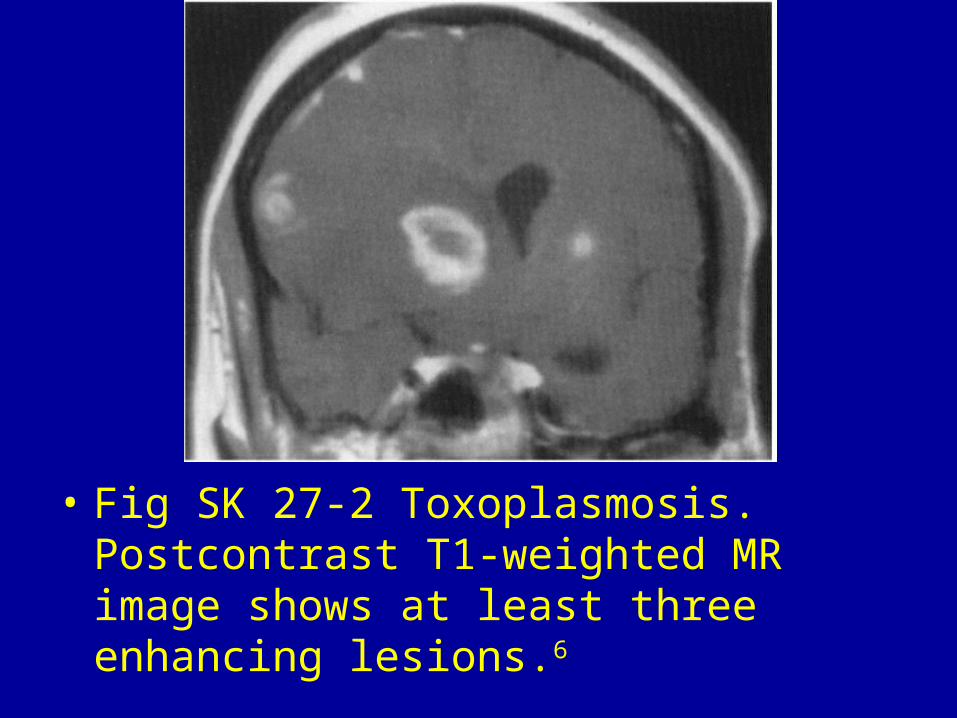
• Fig SK 27-2 Toxoplasmosis. Postcontrast T1-weighted MR image shows at least three enhancing lesions.6
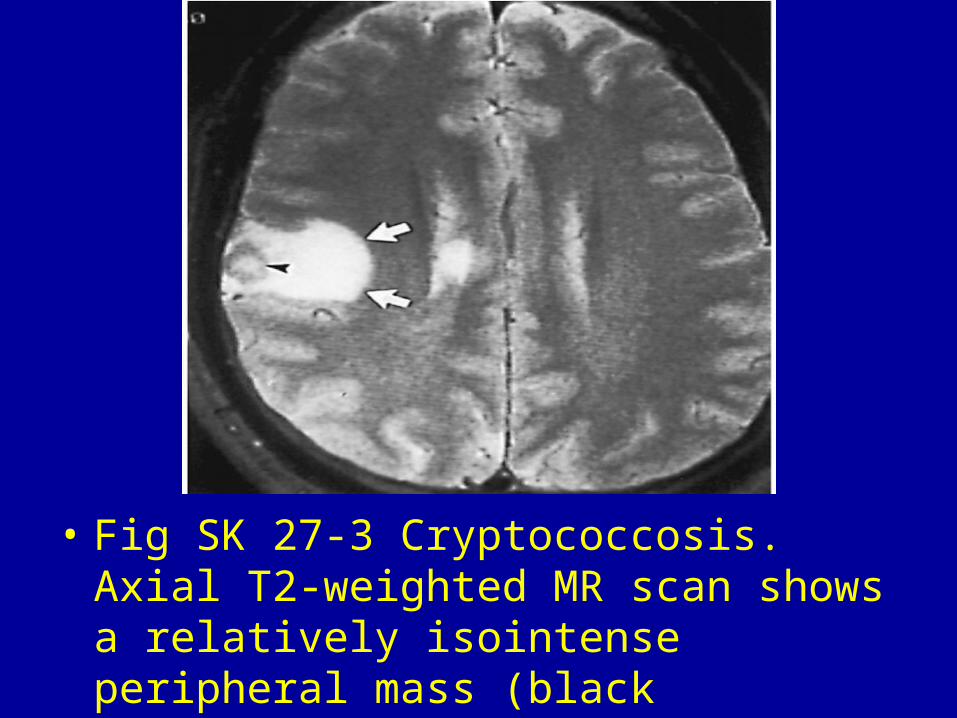
• Fig SK 27-3 Cryptococcosis. Axial T2-weighted MR scan shows a relatively isointense peripheral mass (black arrowhead) with prominent surrounding edema (white arrows).
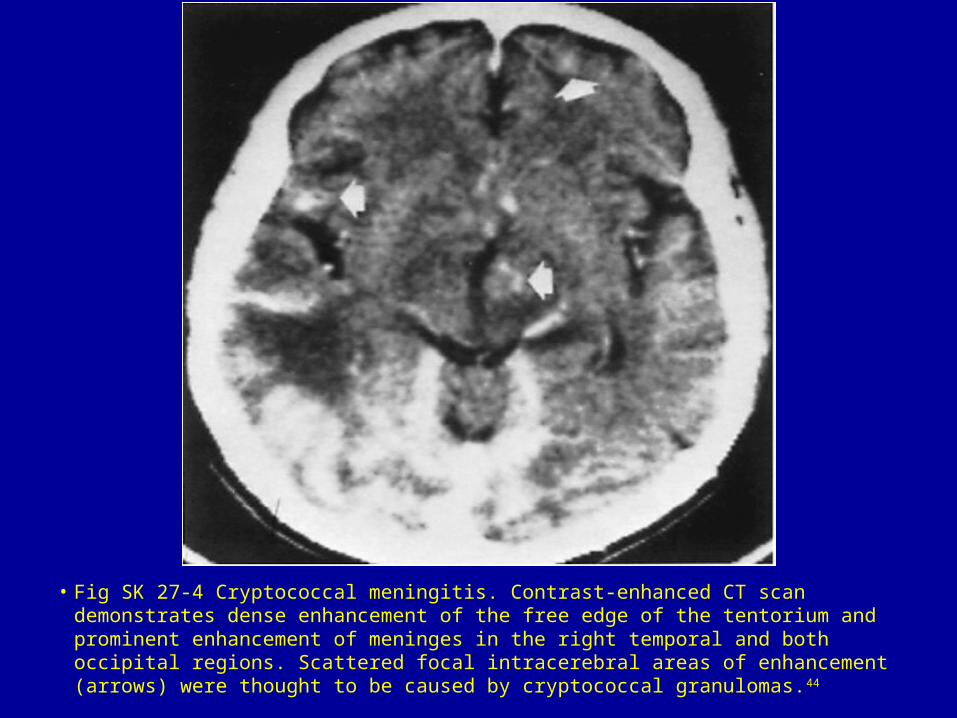
• Fig SK 27-4 Cryptococcal meningitis. Contrast-enhanced CT scan demonstrates dense enhancement of the free edge of the tentorium and prominent enhancement of meninges in the right temporal and both occipital regions. Scattered focal intracerebral areas of enhancement (arrows) were thought to be caused by cryptococcal granulomas.44

• Fig SK 27-5 Streptococcal abscess. T2-weighted MR scan shows a well-defined, slightly lobulated mass in the left cerebellum. The margin of the abscess has a rim of decreased signal intensity, and there is moderate surrounding edema.44
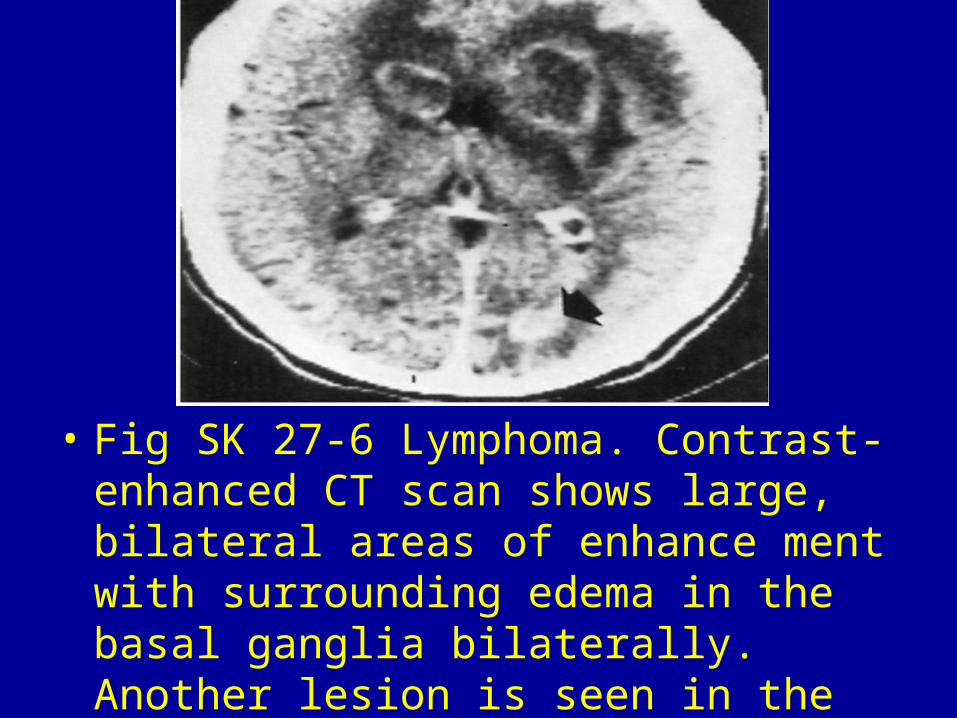
• Fig SK 27-6 Lymphoma. Contrast-enhanced CT scan shows large, bilateral areas of enhance ment with surrounding edema in the basal ganglia bilaterally. Another lesion is seen in the left occipital pole (arrow).44
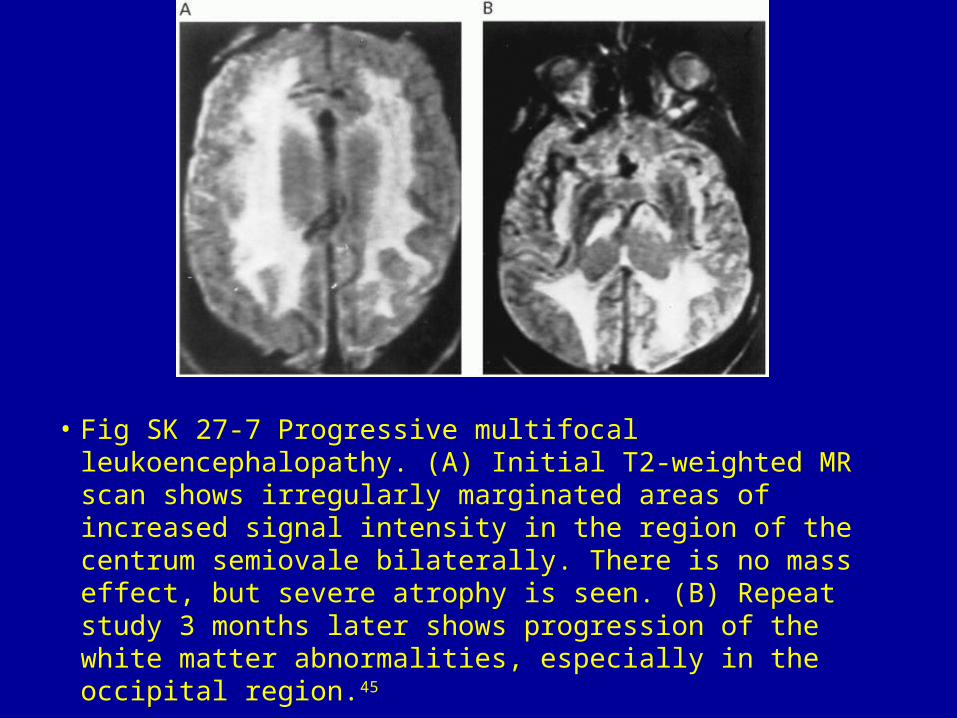
• Fig SK 27-7 Progressive multifocal leukoencephalopathy. (A) Initial T2-weighted MR scan shows irregularly marginated areas of increased signal intensity in the region of the centrum semiovale bilaterally. There is no mass effect, but severe atrophy is seen. (B) Repeat study 3 months later shows progression of the white matter abnormalities, especially in the occipital region.45
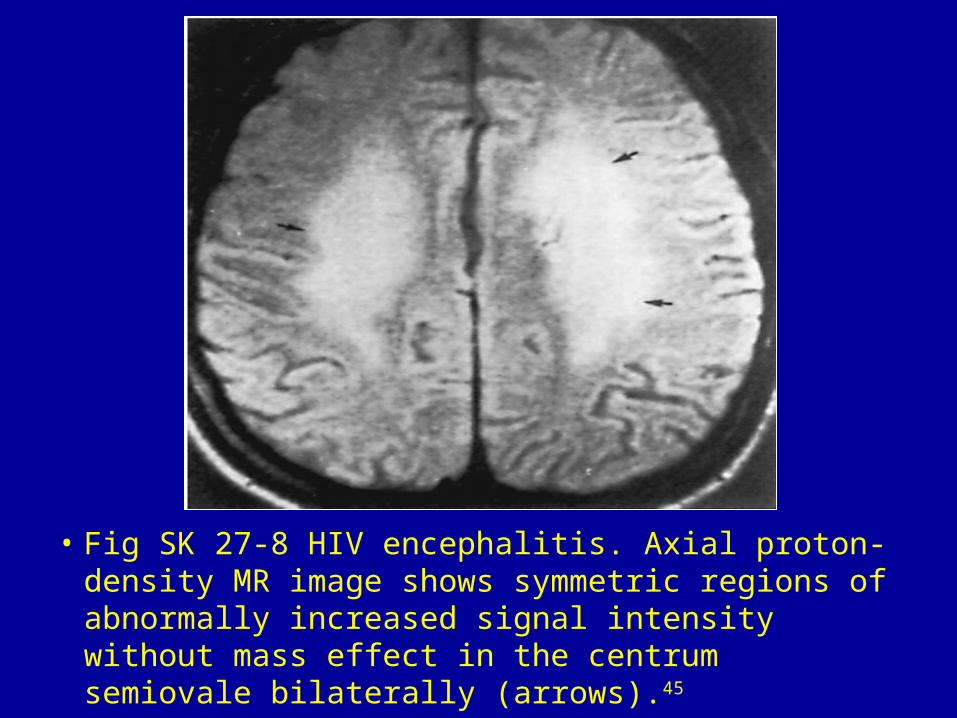
• Fig SK 27-8 HIV encephalitis. Axial proton-density MR image shows symmetric regions of abnormally increased signal intensity without mass effect in the centrum semiovale bilaterally (arrows).45
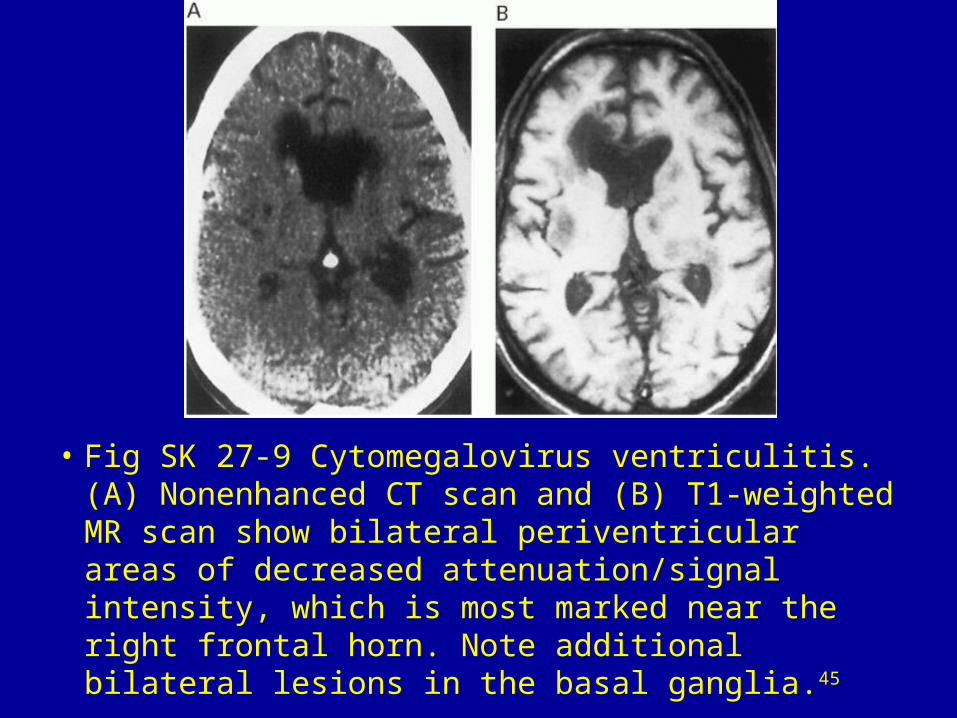
• Fig SK 27-9 Cytomegalovirus ventriculitis. (A) Nonenhanced CT scan and (B) T1-weighted MR scan show bilateral periventricular areas of decreased attenuation/signal intensity, which is most marked near the right frontal horn. Note additional bilateral lesions in the basal ganglia.45

• Fig SK 27-10 Cytomegalovirus. (A) Axial T1-weighted MR image demonstrates an irregular low-signal halo (arrows) surrounding the right occipital horn. There is no evidence of mass effect. (B) Axial proton-density image shows corresponding high signal in the right periatrial white matter (straight arrow). There are similar high-signal foci in the periventricular white matter adjacent to the right frontal horn (curved arrow) and the medial left atrium (open arrow).46