216-2013: Using SAS® to Expand the Application of...
12
Paper 216-2013 Using SAS to Expand the Application of Standard Measures and Guide Statistical Explorations: Creating Healthy Eating Index Scores Using Nutrition Data System for Research Output David A. Ludwig, David C. Landy, Joy M. Kurtz, Tracie L. Miller; Division of Pediatric Clinical Research, University of Miami Miller School of Medicine Abstract New measures, summarizing several variables related to a common health construct are frequently developed in the healthcare industry to provide more valid or complete descriptions of quality and health concepts. We created a SAS® program to calculate a measure of diet quality, the Healthy Eating Index (HEI, http://www.cnpp.usda.gov/HealthyEatingIndex.htm ) using output from a widely applied dietary software package, Nutrition Data System for Research (NDSR, http://www.ncc.umn.edu/products/ndsr.html ). Currently, application of the HEI in research and clinical assessment is limited by the challenges posed in calculating the HEI using the highly complex and detailed NDSR output. The SAS program extracts the required NDSR output files and then calculates the combination of algebraic manipulations and logical statements to obtain HEI scores. We also offer suggestions for increasing usability such as with the %INCLUDE statement and show how the program can be used to explore related statistical issues such as reliability via PROC MIXED. Introduction Composite measures are frequently developed in healthcare and often involve summarizing several variables to provide a more valid or complete description of a concept such as hospital quality or patient health. For instance, new measures may be created to assess adherence to guidelines or to describe how combinations of variables combine to predict risk. Applying a composite measure can be challenging for several reasons. First, the variables comprising the composite may not be readily available in a single data file, such as from a quality improvement report or patient record, or the variables may not have been measured at the appropriate level, such as per procedure versus total stay expenditures. Second, the calculation method may be complex, requiring the performance of algebraic manipulations within a series of logical statements. However, all of these issues can be overcome by creating a SAS program which can not only combine various data sources and summarize data at different levels but which can also automate algebraic calculations and handle complex logical statements. Once created, several issues can limit the application of composite measures both in practice and in research. Issues such as difficulty in the interpretation of the underlying latent concept, questions concerning reliability and validity, and difficulty applying the new measure to specific situations which can be addressed using SAS programs written to focus attention on interpretation and relevant statistical issues. We describe the creation of a SAS program to calculate a measure of diet quality, the Healthy Eating Index (HEI) 2005 (http://www.cnpp.usda.gov/HealthyEatingIndex.htm ), using output from a commonly employed dietary software package, Nutrition Data System for Research (NDSR, http://www.ncc.umn.edu/products/ndsr.html ). Currently, application of the HEI in research is limited by the challenges posed in calculating the HEI using NDSR output. First, the necessary variables are stored in three different output files, two of which are at the individual-day level and one of which is at the food-individual-day level. Second, the calculation process involves a combination of algebraic manipulations and logical statements. In this paper we describe how SAS can be used to overcome these issues. We also offer suggestions for increasing usability such as with the %INCLUDE statement and creating a simplified version utilizing the ability to run a SAS program in batch mode. Finally, we show how the program can be used to explore related statistical issues. Specifically, because the HEI is a ratio of variables at the person-day level, the mean HEI can be calculated as the mean of the individual-day ratios or as the ratio of the means of the individual-days. Finally, when multiple days are recorded per individual, it is possible to estimate the HEI reliability and formulate projections as to the optimum number of daily food recall determinations. Measuring and Analyzing Dietary Data (The HEI 2005 and the NDSR) The HEI 2005 is a composite score calculated from 12 components of food group consumption indexed to the Dietary Guidelines for Americans, 2005. 1 Although there are several methods for obtaining the types, quantity, and frequency of foods consumed by individuals over a given period of time, in general, individuals are asked to recall their food choices, portion sizes, and frequencies and then these reported consumptions are classified into food group components that are scored and summed to provide an overall index of diet quality. In order to obtain an HEI score, reported foods must be analyzed and then classified by either type (e.g., fruits and vegetables) or composition (e.g., oils and sodium). Perhaps the most widely used computer based methodology for this type of classification is the NDSR . This MS Windows based program allows for the detailed inputting of the reported foods and produces several data files contain virtual every known constituent of dietary intake. The dietary information generated from this program can then be used to calculate the HEI. 2 As previously stated, several issues make the calculation of HEI somewhat tedious. First, the HEI scoring algorithm is somewhat complicated. In order to obtain proper values, some components require segmented linear interpolation and/or algebraic solutions. Second, the NDSR generates multiple data files containing a plethora of dietary variables with some of these variables being measured at the level of the individual food though values are needed at the level of the individual per day. These issues make hand calculation of the HEI for other than a few individuals highly impractical. Poster and Video Presentations SAS Global Forum 2013
Transcript of 216-2013: Using SAS® to Expand the Application of...
Paper 216-2013
Using SAS to Expand the Application of Standard Measures and Guide Statistical Explorations: Creating Healthy Eating Index Scores Using Nutrition Data System
for Research Output David A. Ludwig, David C. Landy, Joy M. Kurtz, Tracie L. Miller;
Division of Pediatric Clinical Research, University of Miami Miller School of Medicine
Abstract New measures, summarizing several variables related to a common health construct are frequently developed in the healthcare industry to provide more valid or complete descriptions of quality and health concepts. We created a SAS® program to calculate a measure of diet quality, the Healthy Eating Index (HEI, http://www.cnpp.usda.gov/HealthyEatingIndex.htm) using output from a widely applied dietary software package, Nutrition Data System for Research (NDSR, http://www.ncc.umn.edu/products/ndsr.html). Currently, application of the HEI in research and clinical assessment is limited by the challenges posed in calculating the HEI using the highly complex and detailed NDSR output. The SAS program extracts the required NDSR output files and then calculates the combination of algebraic manipulations and logical statements to obtain HEI scores. We also offer suggestions for increasing usability such as with the %INCLUDE statement and show how the program can be used to explore related statistical issues such as reliability via PROC MIXED.
Introduction Composite measures are frequently developed in healthcare and often involve summarizing several variables to provide a more valid or complete description of a concept such as hospital quality or patient health. For instance, new measures may be created to assess adherence to guidelines or to describe how combinations of variables combine to predict risk. Applying a composite measure can be challenging for several reasons. First, the variables comprising the composite may not be readily available in a single data file, such as from a quality improvement report or patient record, or the variables may not have been measured at the appropriate level, such as per procedure versus total stay expenditures. Second, the calculation method may be complex, requiring the performance of algebraic manipulations within a series of logical statements. However, all of these issues can be overcome by creating a SAS program which can not only combine various data sources and summarize data at different levels but which can also automate algebraic calculations and handle complex logical statements. Once created, several issues can limit the application of composite measures both in practice and in research. Issues such as difficulty in the interpretation of the underlying latent concept, questions concerning reliability and validity, and difficulty applying the new measure to specific situations which can be addressed using SAS programs written to focus attention on interpretation and relevant statistical issues.
We describe the creation of a SAS program to calculate a measure of diet quality, the Healthy Eating Index (HEI) 2005 (http://www.cnpp.usda.gov/HealthyEatingIndex.htm), using output from a commonly employed dietary software package, Nutrition Data System for Research (NDSR, http://www.ncc.umn.edu/products/ndsr.html). Currently, application of the HEI in research is limited by the challenges posed in calculating the HEI using NDSR output. First, the necessary variables are stored in three different output files, two of which are at the individual-day level and one of which is at the food-individual-day level. Second, the calculation process involves a combination of algebraic manipulations and logical statements. In this paper we describe how SAS can be used to overcome these issues. We also offer suggestions for increasing usability such as with the %INCLUDE statement and creating a simplified version utilizing the ability to run a SAS program in batch mode. Finally, we show how the program can be used to explore related statistical issues. Specifically, because the HEI is a ratio of variables at the person-day level, the mean HEI can be calculated as the mean of the individual-day ratios or as the ratio of the means of the individual-days. Finally, when multiple days are recorded per individual, it is possible to estimate the HEI reliability and formulate projections as to the optimum number of daily food recall determinations.
Measuring and Analyzing Dietary Data (The HEI 2005 and the NDSR)
The HEI 2005 is a composite score calculated from 12 components of food group consumption indexed to the Dietary Guidelines for Americans, 2005.1 Although there are several methods for obtaining the types, quantity, and frequency of foods consumed by individuals over a given period of time, in general, individuals are asked to recall their food choices, portion sizes, and frequencies and then these reported consumptions are classified into food group components that are scored and summed to provide an overall index of diet quality. In order to obtain an HEI score, reported foods must be analyzed and then classified by either type (e.g., fruits and vegetables) or composition (e.g., oils and sodium). Perhaps the most widely used computer based methodology for this type of classification is the NDSR . This MS Windows based program allows for the detailed inputting of the reported foods and produces several data files contain virtual every known constituent of dietary intake. The dietary information generated from this program can then be used to calculate the HEI.2
As previously stated, several issues make the calculation of HEI somewhat tedious. First, the HEI scoring algorithm is somewhat complicated. In order to obtain proper values, some components require segmented linear interpolation and/or algebraic solutions. Second, the NDSR generates multiple data files containing a plethora of dietary variables with some of these variables being measured at the level of the individual food though values are needed at the level of the individual per day. These issues make hand calculation of the HEI for other than a few individuals highly impractical.
Poster and Video PresentationsSAS Global Forum 2013
Although simple generic HEI scoring programs have previously been written (http://riskfactor.cancer.gov/tools/hei/tools.html), these programs require a very high degree of dietary data preprocessing. This limits the portability and in turn the utility of these programs by third party users. The following SAS program was constructed to solve this problem. It was written so that the raw data files from the NDSR program can be used without any type of editing or manipulation. All that is required is a basic knowledge of MS Windows (for setting up folders and files), three output files which are generated from the NDSR program (i.e., Book1, Book4, and Book9), and basic SAS software (Cary, NC).
Overview of Using the SAS Program We created a program in SAS that would automate the process of calculating HEI scores and component sub-scores using the unedited NDSR output. To increase usability, we created two SAS program files. The first program (Setup.sas) is meant to be opened and edited by the user (Appendix). This file allows the user to indicate where the NDSR output is located and indicate preferences regarding the calculated HEI data. The second program(Program.sas) contains the code to calculate the HEI component scores and total based on the user specified information. This second file does not need to be edited or even opened by the user.
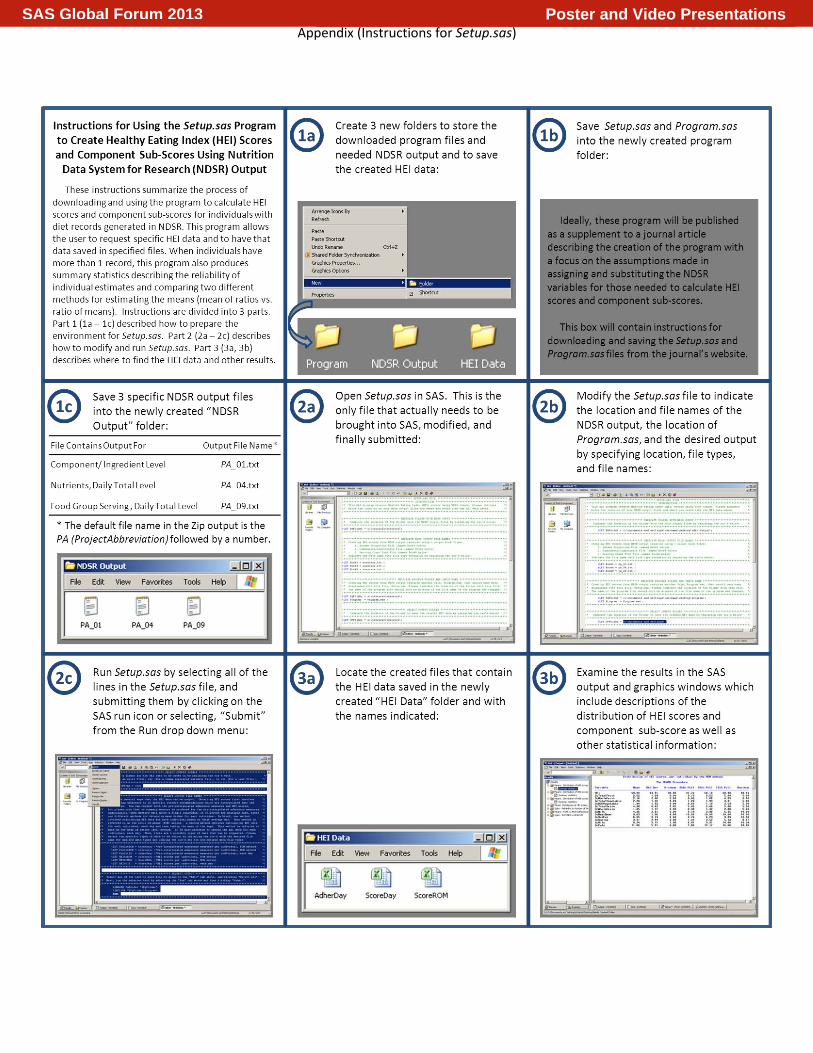
Using these programs simply requires following a series of basic steps which can be divided into 3 parts. First, users prepare the environment for Setup.sas. Second, users modify and run Setup.sas. Third, users open the designated files containing the HEI composite score data and examine the other results. The steps involved in conducting these parts are described in detail below and summarized in an instruction page (Appendix).
Preparing the Environment for Setup.sas (Part 1)
First, the user will need to create three folders on their computer. The folders can be constructed at any location (e.g. Desktop). For simplicity, we recommend naming them, “Program”, “NDSR Output”, and “HEI Data”. Second, the user will need to download and save two files, Setup.sas and Program.sas, in the newly created folder, “Program”. Third, the user will need to save three specific NDSR output files into the newly created folder, “NDSR Output”. Once dietary recall data is imputed into the NDSR program and analyzed, the output (i.e., result files) from this analysis can be requested by the user. When output is requested from NDSR, the user is prompted to give both a location for the output and a file name (Note: there is a default file name provided at the prompt). The file name, however, is not for the names of the files containing the dietary data needed to calculate HEI scores but rather is for a zip file containing these needed data files. By default, the data files are named using the project’s abbreviation which is different for each project and then the number of the file (00 through 19). The files are output by NDSR as text files (.txt). These numbered files always contain the same type of information (ex. the file numbered 01 always contains information at component /ingredient level). The three specific files needed are the Components/Ingredients file (numbered 01), the Nutrients, Daily Total Level file (numbered 04), and the Food Group Servings, Daily Total Level file (numbered 09).These three files are the ones required for the calculation of the HEI. They should be extracted and saved in the “NDSR Output” folder. These raw text files should not be edited in any way.
Modify and Run Setup.sas (Part 2)
First, the user will need to open the file Setup.sasin SAS. This file is used to indicate the location of the NDSR output needed to calculate the HEI scores, where the HEI result (i.e., data) should be saved, as well as specify amongst output options. This Setup.sas file is the only file that actually needs to be brought into SAS, edited and finally submitted. The second file, Program.sas contains the SAS code for performing all the calculations and executing all the decision logic. It does not require any additional information or editing.
Second, the user should follow the instructions in the Setup.sas file. This will lead the user to specify the location of the folder containing the NDSR output files. If named as in the section above, this will be the “NDSR Output” folder. The user should place the location of the folder after the equal sign in the %LET statement which should result in a line of code similar to that below:
%LET BkFolder = c:\documents and settings\username\desktop\ndsr output\;
The user should continue following the instructions in Setup.sas. This will lead the user to specify the names of the 3 specific NDSR output files referenced above. The user should place the names of these files after the appropriate equal signs. This should result in lines of code similar to that below:
%LET Book1 = PA_01.txt; %LET Book4 = PA_04.txt; %LET Book9 = PA_09.txt;
The user should continue following the instructions in Setup.sas. This will lead the user to specify the location of the folder in which the Program.sas file is located which if named as in the above section, will be the “Program” Folder”. Next, the user will indicate the location of the folder in which the HEI data should be saved which if named as in the above section, will be the “HEI Data” folder. Next, the user should indicate the format for the HEI data to be saved. The output files can be formatted as a MS Excel spreadsheet (xls), comma separated (csv), or plain text (txt). Then the user should indicate which types of possible HEI data are wanted by replacing the xxx’s with a file name selected by the user. Besides the standard HEI component scoring and scaling, users can request the raw equivalents per 1000 kcal. These are pre-interpolated values on each of the 12 HEI component sub-scores that measure adherence to specific USDA dietary guidelines. Also, when
Poster and Video PresentationsSAS Global Forum 2013
multiple days are evaluated per individual, the summary statistic which relates the ratio of the component to the energy intake can be calculated in two different ways. One way is to separately average both the component and the energy across days and then form the ratios of these two averages (i.e., ratio of means, ROM). Alternatively, for each subject, the ratio of the component to energy can be calculated separately for each day and these ratios averaged (i.e., mean of ratios, MOR). The merits of these methods primarily depend on the aim of the study and are discussed further below. Thus, six data options are available. This should result in lines of code, each similar to that below:
%LETHEIScMOR =ScoreROM; /*HEI scores for each individual, MOR method */
Third, the user should select all lines in the Setup.sas file by opening the Edit drop down menu and selecting “Select All”, and submit the selected code by opening the Run drop down menu and selecting “Submit”.
Finding the HEI Data and Examining Other Results (Part 3)
Once the program has run, the requested files with the adherence measures and/or HEI scores and component sub-scores, estimated according to the selected method(s), will be saved in the folder indicated for the HEI data which if named as in the section above, will be the “HEI Data” folder. In addition, several results are automatically generated and displayed in the SAS output and graphics windows. Briefly, these results include a description of the distribution of HEI scores and component sub-scores based on the different possible methods of estimation. There are also results comparing the different estimation methods and the reliability of the HEI scores, both of which are discussed in greater in a later section of this paper.
Details and Selected Aspects of Program.sas Program.sas contains the code to perform the actual manipulations of the NDSR output to produce HEI scores and component sub-scores. Program.sas is called upon in the Setup.sas program using the %INCLUDE statement which minimizes the number of files the user interacts with and allows the user to interface with the series of programs in a more controlled atmosphere in which navigation around lengthy code, parts of which may be unfamiliar to some users, is avoided. Below, selected aspects of Program.sas are described in more detail for those interested in the details of the actual SAS programming.
Linking Setup.sas User-Provided Information to Program.sas
The program first links the user-provided information from Setup.sas to actual folder locations and file names in Program.sas:
LIBNAMEBkFolder"&BkFolder"; FILENAME Book9 "&BkFolder&Book9"; FILENAME Book4 "&BkFolder&Book4"; FILENAME Book1 "&BkFolder&Book1"; LIBNAMEOPFolder"&OPFolder"; %LEText= .&OPFrmt; FILENAMEuROM"&OPFolder&PreIntROM&ext"; FILENAMEuMORavg"&OPFolder&PreIntMOR&ext"; FILENAMEuMORpd"&OPFolder&PreIntID&ext"; FILENAME ROM "&OPFolder&HEIScROM&ext"; FILENAMEMORavg"&OPFolder&HEIScMOR&ext"; FILENAMEMORpd"&OPFolder&HEIScID&ext";
Importing the NDSR Data
While there are several options for getting data into SAS, we choose to use the IMPORT procedure to get the NDSR output into SAS because it does not require specifying the variable names in advance. Calculating HEI scores only requires selected variables from the NDSR output files, which are output in all versions of NDSR and assigned the same variable names. However, newer versions of NDSR include additional variables in the output, though these variables are not needed to calculate HEI scores. After importing the data, statements in a DATA step are used to obtain smaller files with only the needed variables retained. Below, we have provided an example of obtaining the information from one of the NDSR output file:
PROCIMPORT DATAFILE=Book1 OUT=BkFolder.Book1 REPLACE DBMS=tab; RUN;
%LET Bk1Vars = Food_Name Food_ID NCCID GFood GFat EtOHg Carbg Energy__kcal;
DATA BkFolder.Book1; SET BkFolder.Book1 (KEEP = Participant_IDDate_of_Intake&Bk1Vars); RUN;
In addition to the NDSR output, information is also needed that links up the ID’s assigned to individual foods by NDSR with their USDA food group code (i.e. NDSR food group cross-reference code book). There are over 27,000 individual foods, and while this data could have
Poster and Video PresentationsSAS Global Forum 2013

been imported, this would have required the user to either download or identify another file. Thus, we choose to get this data into SAS using a the INFILE statement and DATALINES. Below, we have provided the code for inputting this data:
DATA PgFolder.ListBr; INFILE DATALINES DELIMITER='09'x; INPUTFood_ID :6.USDA_Code : 3.; DATALINES; 16517541 [ADDITIONAL Cross-Reference DATA] ; RUN;
Processing Food-Level Data and Converting to Individual-Day Level
HEI scores are calculated using variables that summarize measures over an individual, per day and not per food. However, NDSR output does not provide a summary of the amount of solid fat, oil, or alcohol from beverages consumed by the individual per day. This is in part because NDSR does not specify whether the fat from individual foods should be classified as solid fat or oil. Likewise, NDSR does not classify beverages separately from non-beverages. To generate these variables requires data from the component/ingredient level file, the file numbered 01, which lists the amount of fat per food and the amount of alcohol per food. It is then possible to classify the fat or alcohol appropriately and sum over the individual per day. This is why the USDA food group codes needed to be input, as described above. An additional caveat is that for solid fat, only the fat above the amount found in the lowest fat variety of that food is counted. Thus, in addition to logically classifying the foods, simple algebra is needed to determine the amount of fat for foods classified as solid fat that is counted. The first step in this process is merging the USDA food group codes with the individual foods from the component/ingredient level file. The next step is making the appropriate classification of the individual food and then summing over the person per day. Below we present summary code for how a variable of the solid fat for an individual per day was generated:
DATA BkFolder.Book1_AltNL (WHERE=(Item=1)); MERGE BkFolder.Book1 (IN=ina) PgFolder.ListBr; BYFood_ID; Item = ina; RUN; DATA BkFolder.Book1_EFG (KEEP = Date_of_IntakeParticipant_IDExcessFatG ExcessOilGBEtOHgBCarbg); SET BkFolder.Book1_AltNL; IF NCCID = 2THENExcessFatG = (((GFat/GFood)-(2.63/28.35))*GFood); /*meats*/ ELSEIF NCCID=24THENExcessFatG=(((GFat/GFood)-(0.20/245))*GFood); /*milk*/ ELSEIF NCCID=25THENExcessFatG=GFat; /*creams*/ [ADDITIONAL CLASSIFICATION LOGIC] ELSEExcessFatG= .; RUN; DATA BkFolder.Book1_EFG; SET BkFolder.Book1_EFG; IFExcessFatG<0THENExcessFatG=0; /*corrects for food w/< solid fat than allowed*/ RUN; PROCMEANSNOPRINTDATA=BkFolder.Book1_EFG; BYParticipant_IDDate_of_Intake; VARExcessOilGExcessFatG; OUTPUTOUT=BkFolder.Book1_EFGW SUM(ExcessOilG ExcessFatG BEtOHg BCarbg) = ExcessOilG ExcessFatG BEtOHg BCarbg; RUN;
At this point, all of the variables needed to calculate HEI scores have been put into SAS or generated , so all the variables across datasets can be merged for further analysis.
Calculating Variable Means for Ratio of Means Approach
Before combining the variables, calculating adherence measures, and interpolating those measures into HEI scores and component sub-scores, it is important to consider whether HEI scores are going to be calculated for each individual, each day or whether the HEI scores are going to be calculated for each individual’s average day. As mentioned, NDSR output is at the individual-day level. To calculate HEI scores using each individual’s average day requires averaging over the multiple days within individuals. So that both versions of the HEI scores and
Poster and Video PresentationsSAS Global Forum 2013
component sub-scores are obtained for comparison, all needed variables are averaged within individuals. The differences between these two methods are discussed in greater detail in a later section.
Calculating Adherence Measures and Interpolating HEI Scores
Adherence measures are calculated as the number of servings of specific food groups and the amount of macronutrients standardized relative to measures of total intake. This can involve both the need to add various NDSR output variables together and to convert the NDSR output variable units into the appropriate measure. Once the adherence measures are calculating they are interpolated into HEI component sub-scores. For each adherence measure, a specific number of possible points (0,5, 10, or 20 depending on the component) is associated with the measure and points are assigned at the standard for both the minimum and maximum score. Values between the minimum and maximum scores are interpolated to determine the number of points scored. The component sub-scores are then totaled to provide the HEI score. Below we provide the code for calculating the dark green vegetables sub-score which are nested with in separate DATA steps:
DGOVegetable = ((VEG0100+VEG0200)*.5)/Intake; LegumesCp = ((VEG0700)*.5)/Intake; LegumesOz = ((VEG0700)*3)/Intake; IF ScMeatBean<10 THEN LegumesExtra=0; ELSE IF LegumesOz=0 THEN LegumesExtra=0; ELSE LegumesExtra = ((LegumesOz-(2.5-MeatBean))/LegumesOz)*LegumesCp; IF (DGOVegetable+LegumesExtra)=0 THEN ScDGOVegetable = 0; ELSE IF (DGOVegetable+LegumesExtra)>= .4 THEN ScDGOVegetable = 5; ELSE ScDGOVegetable = ((DGOVegetable+LegumesExtra)/.4)*5;
HEI Data File Selection
While only 6 possible file options can be requested fromthis program and the data needed to generate these files are created regardless of the requested output, programs created to address other situations may result in a greater number of options and may contain analyses dependent on the requested output. In such cases, allowing the user to indicate output preferences may have even greater value. In this case, the code provided below eliminates the need for the userto delete unwanted files or have to rename requested files:
DATA OPFolder.want; IF"&PreIntROM" = 'xxxxxxxx' OR ''THEN d1 = ''; ELSE d1= 'HEIUa'; IF"&PreIntMOR" = 'xxxxxxxx' OR ''THEN d1 = ''; ELSE d2= 'HEIUb'; IF"&PreIntID" ='xxxxxxxx' OR ''THEN d1 = ''; ELSE d3= 'HEIUb0'; IF"&HEIScROM" ='xxxxxxxx' OR ''THEN d1 = ''; ELSE d4= 'HEISa'; IF"&HEIScMOR" ='xxxxxxxx' OR ''THEN d1 = ''; ELSE d5= 'HEISb'; IF"&HEIScID" = 'xxxxxxxx' OR ''THEN d1 = ''; ELSE d6= 'HEISb0'; CALL SYMPUT ('datalist', CATX(' ', d1,d2,d3,d4,d5,d6)); IF"&PreIntROM" = 'xxxxxxxx' OR ''THEN f1 = ''; ELSE f1= "uROM"; IF"&PreIntMOR" = 'xxxxxxxx' OR ''THEN f1 = ''; ELSE f2= "uMORavg"; IF"&PreIntID" ='xxxxxxxx' OR ''THEN f1 = ''; ELSE f3= "uMORpd"; IF"&HEIScROM" ='xxxxxxxx' OR ''THEN f1 = ''; ELSE f4= "ROM"; IF"&HEIScMOR" ='xxxxxxxx' OR ''THEN f1 = ''; ELSE f5= "MORavg"; IF"&HEIScID" = 'xxxxxxxx' OR ''THEN f1 = ''; ELSE f6= "MORpd"; CALL SYMPUT ('filelist', CATX(' ', f1,f2,f3,f4,f5,f6)); RUN; %MACRO Output(); %LET k = %SYSFUNC(COUNTW(&datalist)); %DO i = 1%TO&k; %LET y =%SCAN(&datalist, &i);%LET y2 = %SCAN(&filelist, &i); PROC EXPORT DATA=OPFolder.&yOUTFILE=&y2DBMS=&OPFrmt REPLACE;PUTNAMES=YES; RUN; %END; %MEND; %OUTPUT;
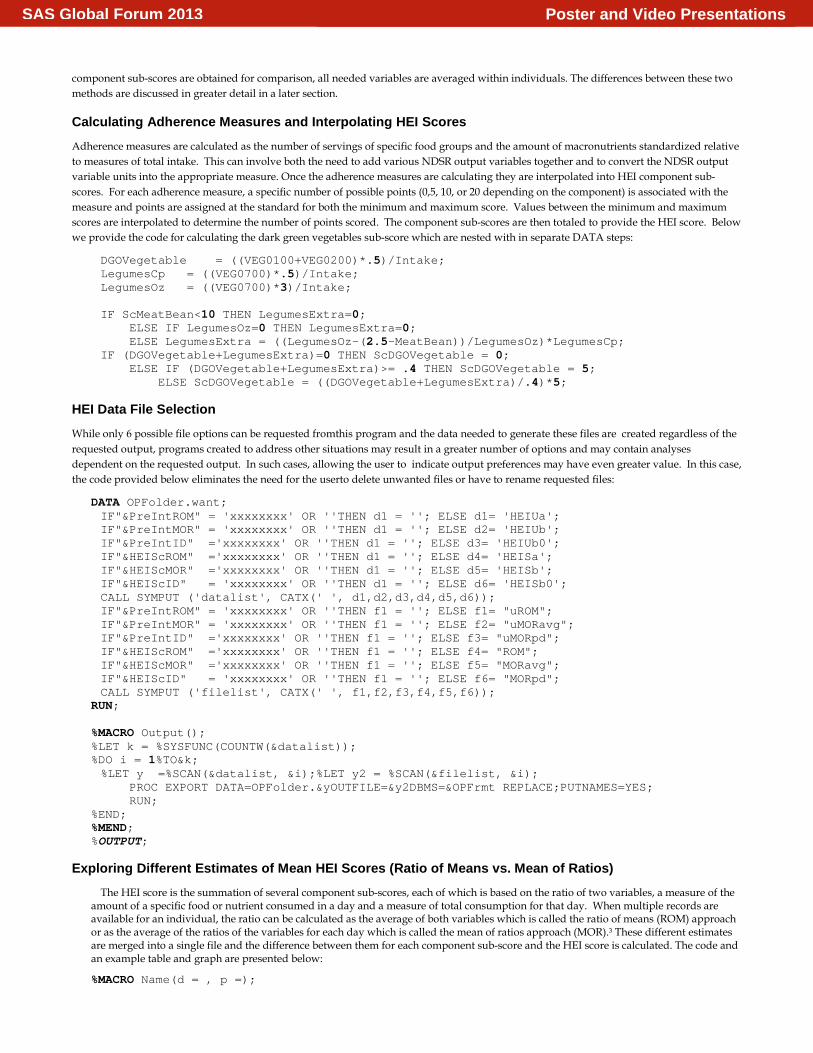
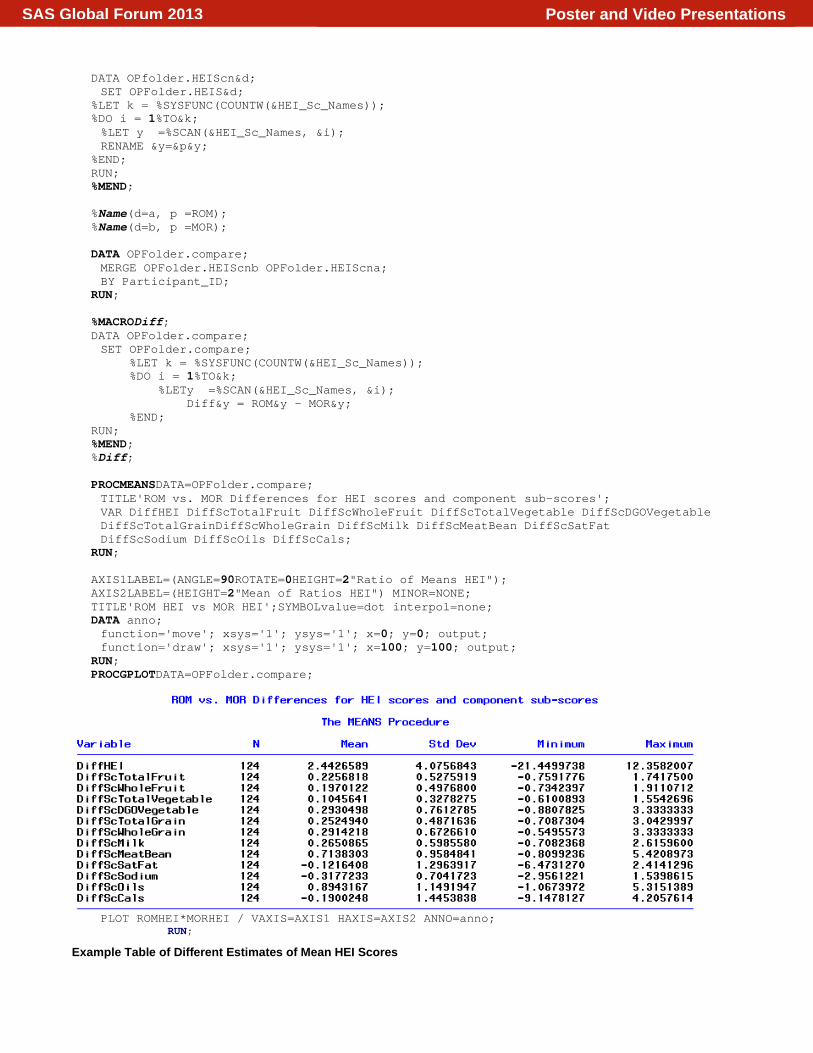
Exploring Different Estimates of Mean HEI Scores (Ratio of Means vs. Mean of Ratios)
The HEI score is the summation of several component sub-scores, each of which is based on the ratio of two variables, a measure of the amount of a specific food or nutrient consumed in a day and a measure of total consumption for that day. When multiple records are available for an individual, the ratio can be calculated as the average of both variables which is called the ratio of means (ROM) approach or as the average of the ratios of the variables for each day which is called the mean of ratios approach (MOR).3 These different estimates are merged into a single file and the difference between them for each component sub-score and the HEI score is calculated. The code and an example table and graph are presented below:
%MACRO Name(d = , p =);
Poster and Video PresentationsSAS Global Forum 2013
DATA OPfolder.HEIScn&d; SET OPFolder.HEIS&d; %LET k = %SYSFUNC(COUNTW(&HEI_Sc_Names)); %DO i = 1%TO&k; %LET y =%SCAN(&HEI_Sc_Names, &i); RENAME &y=&p&y; %END; RUN; %MEND; %Name(d=a, p =ROM); %Name(d=b, p =MOR); DATA OPFolder.compare; MERGE OPFolder.HEIScnb OPFolder.HEIScna; BY Participant_ID; RUN; %MACRODiff; DATA OPFolder.compare; SET OPFolder.compare; %LET k = %SYSFUNC(COUNTW(&HEI_Sc_Names)); %DO i = 1%TO&k; %LETy =%SCAN(&HEI_Sc_Names, &i); Diff&y = ROM&y - MOR&y; %END; RUN; %MEND; %Diff; PROCMEANSDATA=OPFolder.compare; TITLE'ROM vs. MOR Differences for HEI scores and component sub-scores'; VAR DiffHEI DiffScTotalFruit DiffScWholeFruit DiffScTotalVegetable DiffScDGOVegetable DiffScTotalGrainDiffScWholeGrain DiffScMilk DiffScMeatBean DiffScSatFat DiffScSodium DiffScOils DiffScCals; RUN; AXIS1LABEL=(ANGLE=90ROTATE=0HEIGHT=2"Ratio of Means HEI"); AXIS2LABEL=(HEIGHT=2"Mean of Ratios HEI") MINOR=NONE; TITLE'ROM HEI vs MOR HEI';SYMBOLvalue=dot interpol=none; DATA anno; function='move'; xsys='1'; ysys='1'; x=0; y=0; output; function='draw'; xsys='1'; ysys='1'; x=100; y=100; output; RUN; PROCGPLOTDATA=OPFolder.compare;
PLOT ROMHEI*MORHEI / VAXIS=AXIS1 HAXIS=AXIS2 ANNO=anno; RUN;
Example Table of Different Estimates of Mean HEI Scores
Poster and Video PresentationsSAS Global Forum 2013
Example Figure of Different Estimates of Mean HEI Scores
These results show that the ROM approach produces consistently higher estimates of the HEI score compared to the MOR approach. This is consistent with the idea that individuals can consume large amounts of a specific food group one day, the value of which is truncated under the MOR approach but not the ROM approach.
Exploring Study-Specific Reliability
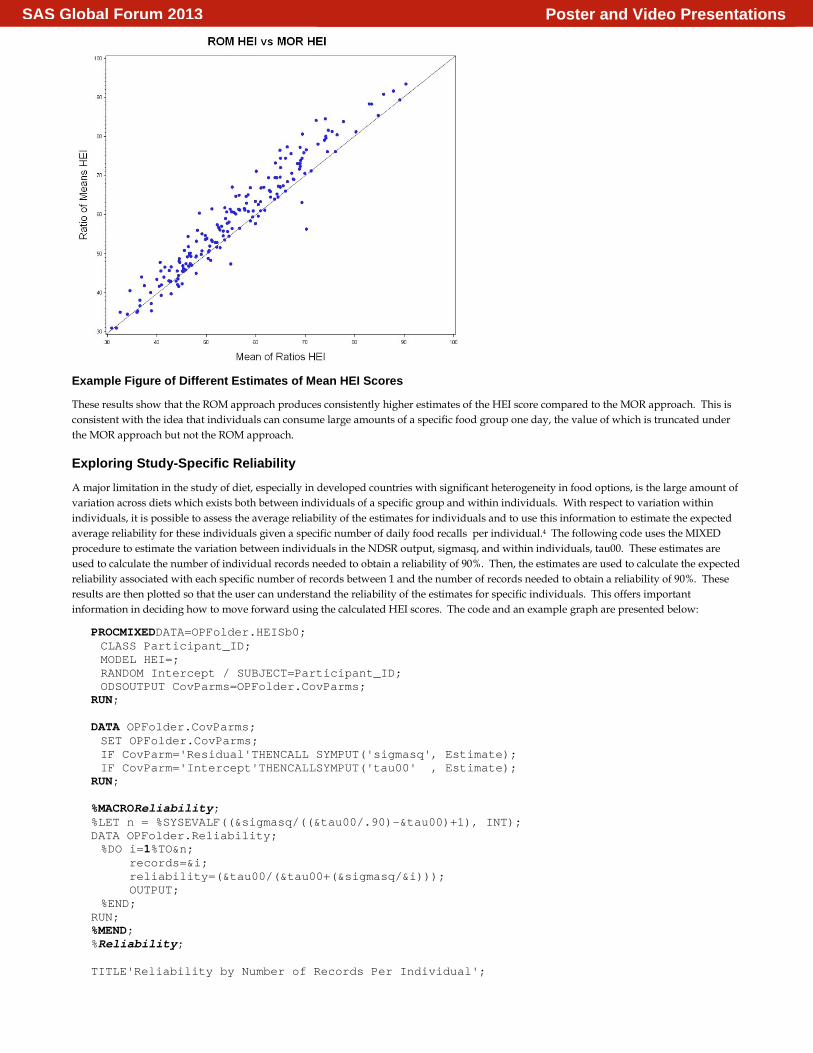
A major limitation in the study of diet, especially in developed countries with significant heterogeneity in food options, is the large amount of variation across diets which exists both between individuals of a specific group and within individuals. With respect to variation within individuals, it is possible to assess the average reliability of the estimates for individuals and to use this information to estimate the expected average reliability for these individuals given a specific number of daily food recalls per individual.4 The following code uses the MIXED procedure to estimate the variation between individuals in the NDSR output, sigmasq, and within individuals, tau00. These estimates are used to calculate the number of individual records needed to obtain a reliability of 90%. Then, the estimates are used to calculate the expected reliability associated with each specific number of records between 1 and the number of records needed to obtain a reliability of 90%. These results are then plotted so that the user can understand the reliability of the estimates for specific individuals. This offers important information in deciding how to move forward using the calculated HEI scores. The code and an example graph are presented below:
PROCMIXEDDATA=OPFolder.HEISb0; CLASS Participant_ID; MODEL HEI=; RANDOM Intercept / SUBJECT=Participant_ID; ODSOUTPUT CovParms=OPFolder.CovParms; RUN; DATA OPFolder.CovParms; SET OPFolder.CovParms; IF CovParm='Residual'THENCALL SYMPUT('sigmasq', Estimate); IF CovParm='Intercept'THENCALLSYMPUT('tau00' , Estimate); RUN; %MACROReliability; %LET n = %SYSEVALF((&sigmasq/((&tau00/.90)-&tau00)+1), INT); DATA OPFolder.Reliability; %DO i=1%TO&n; records=&i; reliability=(&tau00/(&tau00+(&sigmasq/&i))); OUTPUT; %END; RUN; %MEND; %Reliability; TITLE'Reliability by Number of Records Per Individual';
Poster and Video PresentationsSAS Global Forum 2013
AXIS1LABEL=(ANGLE=90ROTATE=0HEIGHT=2"Reliability"); AXIS2LABEL=(HEIGHT=2"Number of Records per Individual") MINOR=NONE; SYMBOLvalue=dot interpol=join; PROCGPLOTDATA=OPFolder.reliability; PLOT reliability*records / VAXIS=AXIS1 HAXIS=AXIS2; RUN;
Example Figure of Reliability In this case, the results provided show that with just three days of diet records per individual, the reliability of the estimate for the individual’s mean HEI score is over 75% suggesting that these estimates may provide sufficient reliability to use these HEI scores in analyses at the individual level.
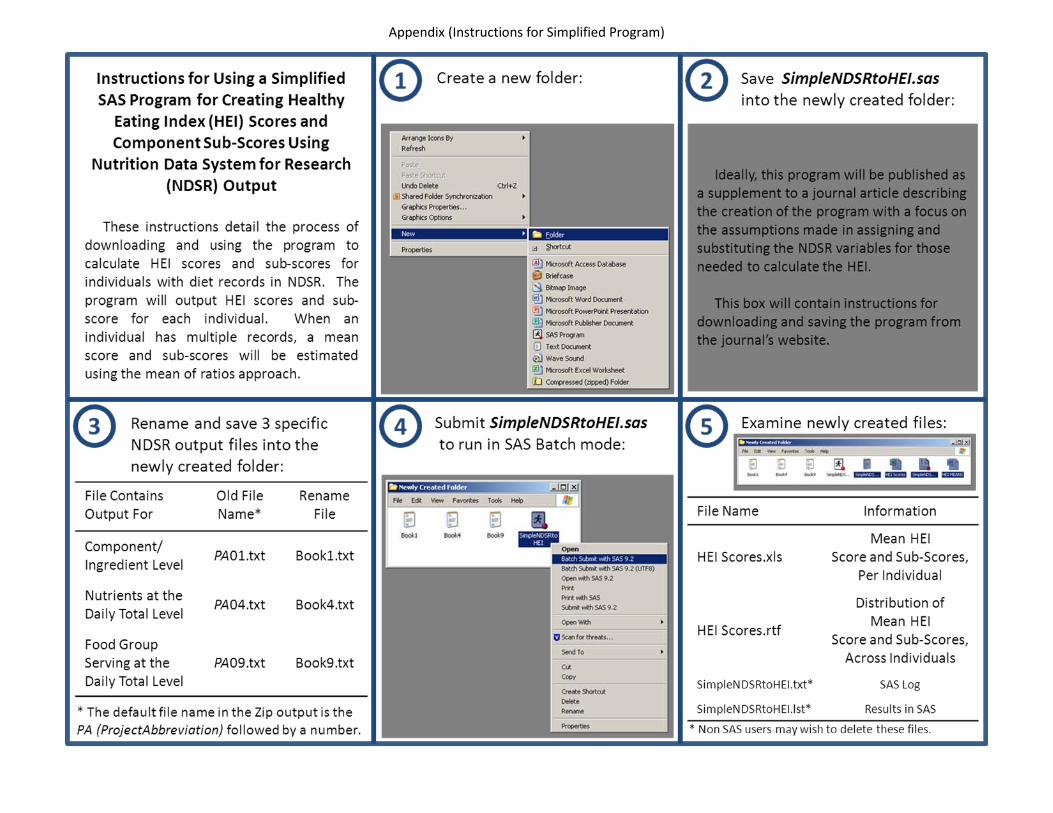
Simplifying the Program The ability to run a SAS program in batch mode provides the opportunity to make a simplified version of the program which is easily accessible to even the most basic users or even non users with access to SAS and also provides more experienced users with a quicker calculation option. Running in batch mode may also be more efficient. By reducing the number of options provided to the user, we were able to make a simplified version of our program that could be applied following a 5-step process (Appendix). The simplification process resulted in the loss of selected features from the original version. This simplification also reduced the number of calculations performed offering the additional benefit of the program running more quickly.
The first thing the simplified program must do is recognize where the NDSR output files are stored as the user is no longer required to provide this information in the setup SAS program. This is performed using the following code which relies on the user having followed instructions 1 through 3 in the Appendix instructions:
%LET currfile=%SYSFUNC(GetOption(SYSIN)); %LET filelgth=%LENGTH(&currfile); %LET pathlgth=&filelgth-19; %LET currpath=%SUBSTR(&currfile,1,&pathlgth); %LET Book1=Book1.txt; %LET Book4=Book4.txt; %LET Book9=Book9.txt; FILENAME Book1 "&currpath&Book1"; FILENAME Book4 "&currpath&Book4"; FILENAME Book9 "&currpath&Book9";
The selected features lost the ability for the user to select the location of the output, the specific output, the file type for the output, and the name of the file names for the output.The location of the output is set to be the folder in which the simplified program is saved. The type of output generated was selected to be the mean HEI score and component sub-scores for each individual estimated using the mean of ratios approach, described in greater detail above. The file type for these scores defaults to aMS-Excel file. Additionally, a rich text file is created
Poster and Video PresentationsSAS Global Forum 2013
and reports a simple summary of the distribution of the HEI scores and sub-scores across individuals. This information as well as the file names are indicated in instruction 5 and produced using the following code:
%LET xlsfile=HEI Scores; PROCEXPORTDATA=HEISb OUTFILE="&currpath&xlsfile"DBMS=xls REPLACE; PUTNAMES=YES; RUN; %LET docfile=HEI MEANS.rtf; ODSRTFFILE="&currpath&docfile"; PROCMEANSDATA=HEISb MEANSTDMINP25P50P75MAXFW=9MAXDEC=2; TITLE'Distribution of HEI scores, per individual by the MOR method'; VAR&HEI_Sc_Names; RUN; ODSRTFCLOSE;
REFERENCES • Guenther PM, Reedy J, Krebs-Smith SM. Development of the Healthy Eating Index-2005. J Am Diet Assoc 2008;108:1896-1901. • Miller PE, Mitchell DC, Harala PL, Pettit JM, Smiciklas-Wright H, Hartman TJ. Development and evaluation of a method for calculating
the Healthy Eating Index-2005 using Nutrition Data System for Research. Public Health Nutr 2011;14:306-13. • Qiao CG, Wood GR, Lai CD, Luo DW. Comparison of two common estimators of the ratio of the means of independent normal variables
in agricultural research. J Appl Math DecisSci 2006;2006:1-14.
ACKNOWLEDGEMENTS This work was funded by grants from the National Institutes of Health (1RO1HD060325 and 1U01HD052104).
CONTACT INFORMATION David A. Ludwig ([email protected]) Division of Pediatric Clinical Research, University of Miami Miller School of Medicine.
David C. Landy ([email protected]) Division of Pediatric Clinical Research, University of Miami Miller School of Medicine.
SAS and all other SAS Institute Inc. product or service names are registered trademarks or trademarks of SAS Institute Inc. in the USA and other countries. ® indicates USA registration.
Other brand and product names are trademarks of their respective companies.
Poster and Video PresentationsSAS Global Forum 2013
Appendix (Instructions for Setup.sas)
Poster and Video PresentationsSAS Global Forum 2013
Appendix (Code in Setup.sas)
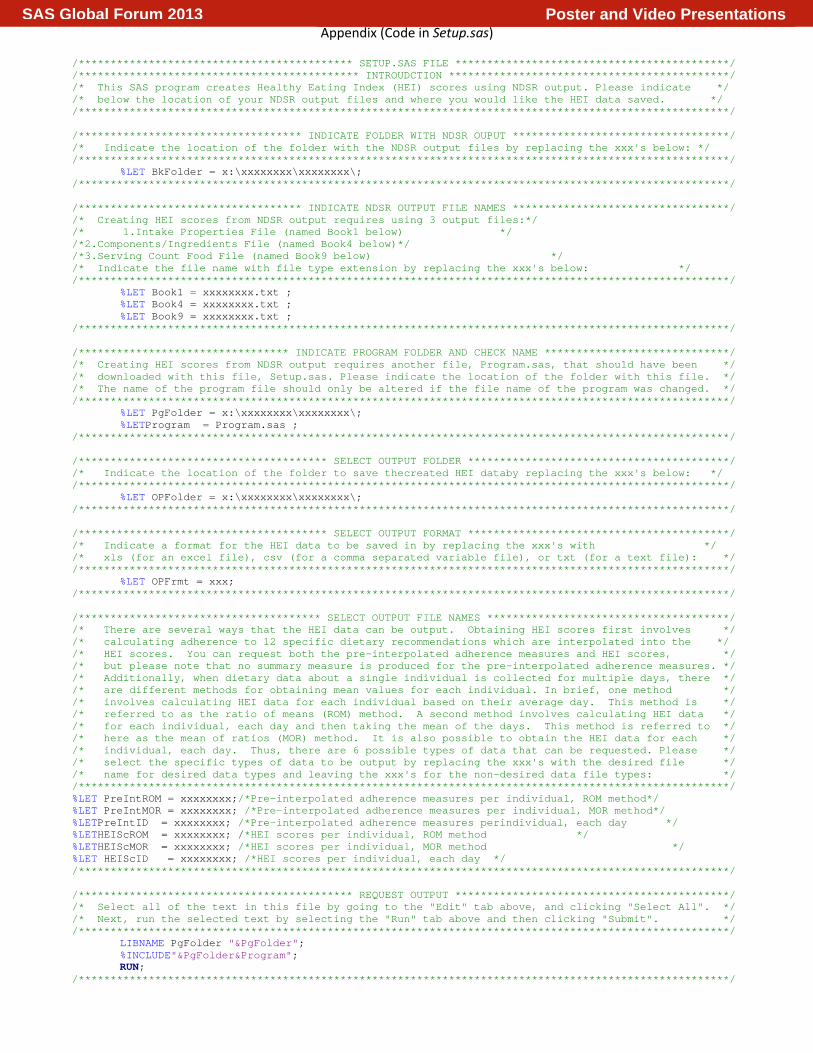
/******************************************* SETUP.SAS FILE *******************************************/ /******************************************** INTROUDCTION ********************************************/ /* This SAS program creates Healthy Eating Index (HEI) scores using NDSR output. Please indicate */ /* below the location of your NDSR output files and where you would like the HEI data saved. */ /******************************************************************************************************/ /*********************************** INDICATE FOLDER WITH NDSR OUPUT **********************************/ /* Indicate the location of the folder with the NDSR output files by replacing the xxx's below: */ /******************************************************************************************************/
%LET BkFolder = x:\xxxxxxxx\xxxxxxxx\; /******************************************************************************************************/ /*********************************** INDICATE NDSR OUTPUT FILE NAMES **********************************/ /* Creating HEI scores from NDSR output requires using 3 output files:*/ /* 1.Intake Properties File (named Book1 below) */ /*2.Components/Ingredients File (named Book4 below)*/ /*3.Serving Count Food File (named Book9 below) */ /* Indicate the file name with file type extension by replacing the xxx's below: */ /******************************************************************************************************/
%LET Book1 = xxxxxxxx.txt ; %LET Book4 = xxxxxxxx.txt ; %LET Book9 = xxxxxxxx.txt ;
/******************************************************************************************************/ /********************************* INDICATE PROGRAM FOLDER AND CHECK NAME *****************************/ /* Creating HEI scores from NDSR output requires another file, Program.sas, that should have been */ /* downloaded with this file, Setup.sas. Please indicate the location of the folder with this file. */ /* The name of the program file should only be altered if the file name of the program was changed. */ /******************************************************************************************************/
%LET PgFolder = x:\xxxxxxxx\xxxxxxxx\; %LETProgram = Program.sas ;
/******************************************************************************************************/ /*************************************** SELECT OUTPUT FOLDER *****************************************/ /* Indicate the location of the folder to save thecreated HEI databy replacing the xxx's below: */ /******************************************************************************************************/
%LET OPFolder = x:\xxxxxxxx\xxxxxxxx\; /******************************************************************************************************/ /*************************************** SELECT OUTPUT FORMAT *****************************************/ /* Indicate a format for the HEI data to be saved in by replacing the xxx's with */ /* xls (for an excel file), csv (for a comma separated variable file), or txt (for a text file): */ /******************************************************************************************************/
%LET OPFrmt = xxx; /******************************************************************************************************/ /************************************** SELECT OUTPUT FILE NAMES **************************************/ /* There are several ways that the HEI data can be output. Obtaining HEI scores first involves */ /* calculating adherence to 12 specific dietary recommendations which are interpolated into the */ /* HEI scores. You can request both the pre-interpolated adherence measures and HEI scores, */ /* but please note that no summary measure is produced for the pre-interpolated adherence measures. */ /* Additionally, when dietary data about a single individual is collected for multiple days, there */ /* are different methods for obtaining mean values for each individual. In brief, one method */ /* involves calculating HEI data for each individual based on their average day. This method is */ /* referred to as the ratio of means (ROM) method. A second method involves calculating HEI data */ /* for each individual, each day and then taking the mean of the days. This method is referred to */ /* here as the mean of ratios (MOR) method. It is also possible to obtain the HEI data for each */ /* individual, each day. Thus, there are 6 possible types of data that can be requested. Please */ /* select the specific types of data to be output by replacing the xxx's with the desired file */ /* name for desired data types and leaving the xxx's for the non-desired data file types: */ /******************************************************************************************************/ %LET PreIntROM = xxxxxxxx;/*Pre-interpolated adherence measures per individual, ROM method*/ %LET PreIntMOR = xxxxxxxx; /*Pre-interpolated adherence measures per individual, MOR method*/ %LETPreIntID = xxxxxxxx; /*Pre-interpolated adherence measures perindividual, each day */ %LETHEIScROM = xxxxxxxx; /*HEI scores per individual, ROM method */ %LETHEIScMOR = xxxxxxxx; /*HEI scores per individual, MOR method */ %LET HEIScID = xxxxxxxx; /*HEI scores per individual, each day */ /******************************************************************************************************/ /******************************************* REQUEST OUTPUT *******************************************/ /* Select all of the text in this file by going to the "Edit" tab above, and clicking "Select All". */ /* Next, run the selected text by selecting the "Run" tab above and then clicking "Submit". */ /******************************************************************************************************/
LIBNAME PgFolder "&PgFolder"; %INCLUDE"&PgFolder&Program"; RUN;
/******************************************************************************************************/
Poster and Video PresentationsSAS Global Forum 2013
Appendix (Instructions for Simplified Program)
Poster and Video PresentationsSAS Global Forum 2013