2030 Target Scoping Plan - California
94
1 2030 Target Scoping Plan October 1, 2015
Transcript of 2030 Target Scoping Plan - California

1
2030 Target Scoping Plan October 1, 2015

Workshop Outline Introduction and Welcome
2030 Target Scoping Plan Overview
Greenhouse Gas Emissions Reduction Focus Areas Short-Lived Climate Pollutants Energy Efficiency Natural and Working Lands Electricity Transportation and Land Use
Economic Analysis
Next Steps
2

50% renewable electricity
An Integrated Plan for Addressing Climate Change
50% reduction
in petroleum use in vehicles
VISION
Reducing Greenhouse Gas Emissions to 40% Below 1990 Levels by 2030
I Double energy
efficiency savings at existing buildings
Carbon sequestration
in the land base
Reduce short-lived
climate pollutants
Safeguard California

CALIFORNIA CLIMATE STRATEGY
Create jobs
• •
Support vulnerable communities
PRINCIPLES
Transform to a clean energy economy
Give consumers clean energy choices
.... ,'l,,t Save water ,,,
Make California

CALIFORNIA CLIMATE STRATEGY
I
SCOPING PLAN
Climate Action Plans
Forest Carbon Plan
SLCP Plan
Cap andTrade Regulation
2040 CA Transportation Plan
LEGISLATION
GGRF Investment Plan
AB758 Energy Efficiency Plan
Healthy Soils Action Plan
Other plans/regulations for renewables, efficiency, transportation, fuels
BUILDING BLOCKS
Partnerships Incentives Voluntary Action Local Action
Research Grants Regulations

2030 Target Scoping Plan Overview
CALIFORNIA AIR RESOURCES BOARD
6

AB 32 Objectives Develop a balanced approach to address climate
change
Improve air quality and public health
Provide a consistent policy approach to drive investment in clean technology
Provide a model for future national and international climate change efforts
Achieve 1990 emissions by 2020; maintain and continue reductions past 2020 to achieve 2030 and 2050 goals
Coordinate efforts across government agencies 7
Overview

Prior Scoping Plans Established new paradigm for climate mitigation
First economy-wide climate change plan
Pioneered the concept of a market-based program supplemented with complementary measures
Sector-by-sector approach
Public outreach and education
Must be updated at least every 5 years
8
Overview

2030 Target Scoping Plan Requirements
Engagement with State Agencies
Engagement with Legislature
Coordination with other plans (i.e. 111(d), Cap & Trade, SIP, Freight Strategy, etc.)
Economic and Technology Advancement Advisory Committee Engagement
Environmental Justice Advisory Committee Engagement
9
Overview
● Public Health Analysis
● Environmental Analysis (CEQA)
● Public Process: Workshops (Sacramento and regional)
● Draft Report / Final Report (targeted measures and estimated emission reductions)

Path to 2050 Greenhouse Gas Target
10
Overview
0
100
200
300
400
500
2000 2010 2020 2030 2040 2050
Calif
orni
a an
nual
GHG
em
issi
ons (
MM
T CO
2e)
Pre-2020 and Post-2020 emissions trajectories
Constant percentage reduction
Constant MMT reduction
-11.4 MMT CO2e per year
-4.7 MMT CO2e per year
-1.0 percent per year
-5.2 percent per year~ 260 MMT CO2e

Guiding Principles Reduce Greenhouse Gas Emissions to 40% Below 1990
Levels by 2030 (Executive Order B-30-15)
Create jobs and support a robust workforce
Save water
Support Disadvantaged Communities
Make California more resilient
Transform to a clean energy economy
Give consumers clean energy choices
11
Overview

Achieving the 2030 Target Continuation of programs established to reach the 2020
GHG emissions reduction target Cap-and-Trade Program Low Carbon Fuel Standard Renewable Portfolio Standard Advanced Clean Cars Program ZEV Program Sustainable Freight Strategy Short-Lived Climate Pollutant Strategy SB 375 Sustainable Communities Strategy
12
Overview

Measure Development Plan Governor’s Office pillars framework
Reduce petroleum use Increase renewable electricity Increase building energy efficiency Reduce short-lived climate pollutants Ensure natural/working lands are carbon sink
Sector oriented measures
Maximize GHG reductions across all areas Realize cobenefits at large industrial sources
Multi-agency collaborative process
Stakeholder input Public workshops with formal and informal comment periods
13
Overview

Elements of 2030 Strategy
14
Overview
● Focus areas within pillars framework – Energy – Green buildings – Transportation – Water – Natural and working lands – Agriculture – Waste management – Short-lived climate pollutants
● Maximize synergies among sectors

Advisory Groups Economic and Technology Advancement
Advisory Committee Provide input on tools and modeling assumptions to
evaluate economic impact of Scoping Plan
Environmental Justice Advisory Committee September 25, 2015: Board re-convened EJAC for 2030
Target Scoping Plan and approved new members
15
Overview

Environmental Justice Advisory Committee AB 32 calls for an Environmental Justice Advisory
Committee (EJAC) to advise the Board in developing the Scoping Plan and any other pertinent matter in implementing the Act From communities in State with the most significant exposure
to air pollution (i.e., communities with minority populations or low-income populations or both)
Nine existing members appointed by Board in 2013, four new members appointed September 2015
Committee meetings are open to the public and include a public comment period
http://www.arb.ca.gov/cc/ejac/ejac.htm
16

Agency Perspectives GHG Reduction Focus Areas
17
Short-Lived Climate Pollutants
Energy Efficiency
Natural and Working Lands
Electricity
Transportation and Land Use

GHG Reduction Focus Areas
Short-Lived Climate Pollutants
18
Ca liforn ia Environm ental Protection A.g ency
0 Air Resources Board
Cal Recycle~
" J - cdfa ~
CAllfOUII A DEPARTMENT OF FOOD & AGRICULTURE

Short-Lived Climate Pollutants ARB developing Short-Lived Climate Pollutant Reduction
Strategy
Recommended action in the 2014 Scoping Plan Update
Required by Senate Bill 605
One of Governor’s five pillars to meet 2030 GHG goal
Concept Paper released for public comment in May 2015
Draft Strategy just released for public comment and to be discussed at workshops on October 13 (Sacramento), October 14 (South Coast), and October 19 (San Joaquin Valley)
19
Short-Lived Climate Pollutants e

GHG Reduction Focus Areas
Energy Efficiency
20
~ CALIFORNIA ~ ENERGY COMMISSION
California Publlic Utililie Commission
Ca liforn ia Environmental Protection Ag ency
0 .....:. Air Resources Board

Scope
Very large, cross sector potential GHG reductions Energy used by buildings ~25% of GHG emissions Buildings use ~68% of electricity & ~55% of natural gas
EE almost always the most cost effective approach Less costly to avoid consumption compared to generation
Improving existing buildings is critical to 2030 goals Current homes will be ~87% of housing in 2030 Current businesses will be ~80% of commercial sq ft in 2030
2030 goal requires full offset of demographic and economic driven load growth plus begin to reduce total energy consumption
21
Energy Efficiency

2020 Status Update
Appliance standards – state & federal TVs, battery chargers, water, LEDs, computer/displays, HVAC
Utility energy efficiency programs CPUC approves budget and oversees IOU EE programs POUs report progress to CEC
Building standards Update effective 7/1/2014; next update expected 1/1/2017
Energy Services Assistance Program & Weatherization Assistance Program ensure services for disadvantaged communities
Clean Energy Jobs Act (Prop. 39) for K-14 public schools 22
Energy Efficiency

Legislative Update
SB 350 Establish annual targets for statewide EE savings and
demand reduction to achieve doubling of savings by 2030 “Measure” EE savings using normalized metered
consumption where feasible and cost-effective
AB 802 Incentives for existing buildings coming up to current code Energy performance benchmarking for large buildings Increased energy usage data access for CEC to improve
forecasting capabilities
23
Energy Efficiency

Vision
Broad market based demand for energy efficiency services
Innovative business solutions deliver savings
Efficiency valued as a real estate attribute
Affordable financing available for all Californians
Efficiency procured as a clean distributed energy resource, analogous to generation
24
Energy Efficiency

Implementation Tools
Continued delivery of validated savings from cost-effective utility EE programs and codes & standards Appliance standards to address rapidly growing plug loads Zero net energy new construction policy Complementary utility programs and codes and standards to
steadily improve existing buildings Existing Buildings Energy Efficiency Action Plan
Emerging technologies and R &D LEDs Highly efficient heat pumps
Market based approaches that attract private capital and enable innovative business models and financing
25
Energy Efficiency

Overlap with Other Sectors
Electricity sector is primary overlap Increasing EE reduces electricity infrastructure needs Increasing EE lowers renewable energy procurement
requirements Potential for electrification of end uses that are primarily
natural gas today (water heating, space heating)
Transportation sector is secondary overlap Increasing EE creates headroom lessening infrastructure
build out for electrified transportation
26
Energy Efficiency

Overlap with Other Sectors
Electricity sector is primary overlap Increasing EE reduces electricity infrastructure needs Increasing EE lowers renewable energy procurement
requirements
Transportation sector is secondary overlap Increasing EE creates ‘space’ that lessens
27
Energy Efficiency
Source: Wei et al., 2013
450,000
400,000
350,000
-.s:: 3: 300,000 C, -"'C ~ 250,000 E cu ';_ 200,000 'tj 'i:
~ 150,000 w
100,000
50,000
0 2011 2050 2050
Frozen Compliant Efficiency Case
,:, c::: c::: 0 0 ·-.... E 8 cu $ Q
~ - ·-0 .... c::: \J
cu 0 -·- cu .... :s E ,:, 0 q: ~
■Transportation Electrification
■ I ndustria I Electrification
■ Water Heating Electrification
■Space Heating Electrification
■ I ndustria Idema nd
■ Building Water Heating
■ Building Space Heating
■ Building Lighting, Office, and Other
■ Building Cooling and Ventilation
■ Building Cooking
■ Building Clothes and Dish Washing
Other

Green Buildings – Scope
Energy Efficient AND Conserve Water Recycle and Prevent Waste Reduce Transportation
Impacts Contribute to Cool
Communities
Comprehensive approach to support climate goals
Strategy focused on new and existing buildings
28
Green Buildings

2020 Status Update
29
Green Buildings
Measure Update State Leading by Example On track to meet or exceed goals Green Building Standards Code Mandatory requirements and
voluntary “reach” standards Beyond Code Local governments advancing
innovative programs Existing Building Retrofits Roadmap to action

Implementation Tools
Strengthen the CALGreen Code
Expand voluntary efforts
Advance green building rating systems
Expand emphasis of existing buildings
Augment existing incentive programs
Continue research activities
30
Green Buildings

Overlap with Other Sectors
31
Green Buildings
• GHG reductions counted under
energy efficiency measure Energy
• Perform much better in certified green buildings Water & Waste
• Dominates carbon footprint of buildings Transportation
• Achieve significant GHG savings
Certified Green Buildings

Mid- and Long-Term Vision
Vision for 2030 Build upon ZNE and green building programs Establish goals and a path towards zero carbon buildings
Vision for 2050 Buildings generate zero
or near-zero GHG emissions over the course of the year
32
Green Buildings

Questions & Comments ENERGY EFFICIENCY
33

GHG Reduction Focus Areas
Natural & Working Lands
34
Ca liforn ia Environmental Protection Ag ency
0 Air Resources Board " - cdfa ~
CALI FORNIA DEPARTMENT OF FOOD & AGRICULTURE

Scope
35
Natural and Working Lands
Photo Credits: USDA NRCS, USDA forest Service
Forests
Rangeland
Wetlands
Farmland

Private Lands 47% Federal
Lands 48%
Other Public Lands (State, county,
muni, etc.) 5%
Land by Major Ownership
Scope
36
Natural and Working Lands
.
~iJ _ I
( t r : eq,,
I
LAND COVER Multi-Source Datil Compiled in 2006
fo,ntt.nd Fornla,dAa,~ --- ------ ---- --- --□- □--L □- c::i -n - • -
□-·--·-------------·--·-
/-_ - ~I- -,---_ , --------j----- ~ i-~

The Value California’s land base stores carbon below ground, in soil and root
systems, and above ground, in trees, shrubs, grasses and other plant biomass
Healthy and resilient natural and working lands provide sustainable public benefits in addition to carbon sequestration, such as water filtration, improved air quality, wildlife habitat, temperature moderation through shading, and soil fertility that supports food production
Conservation of natural and working lands supports sustainable communities
Natural and working lands provide jobs, support regional economies and improve quality of life for all California residents.
37
Natural and Working Lands 0

These Values are Threatened
Land Conversion for Development
Degradation
Drought
Sustained Heat
Fire
38
Natural and Working Lands
\ y
}
0

2020 Status Update
Investments Land Conservation Habitat Restoration Enhanced Land Management New Technology Agricultural Water Use Efficiency Dairy Digesters
39
Natural and Working Lands 0

2020 Status Update
Planning Forest Carbon Plan Bioenergy Action Plan Water Action Plan State Wildlife Action Plan General Plan Guidelines Safeguarding California
40
Natural and Working Lands 0
2020 Status Update
Collaboration Forest Fire Risk Reduction Watershed Improvement Program Natural Disaster Resiliency Competition Healthy Soils Initiative
41
Natural and Working Lands 0

Vision 2030 and 2050
42
Protect Minimize Conversion
Enhance Carbon Sequestration Potential
Innovate Across Sectors
Develop Sequestration Targets
Align Climate Targets with Co-Benefits
Natural and Working Lands 0

Implementation Tools: Protect
Sustainable Agricultural Lands Conservation Program
Forest Legacy Program
Land Use Planning
43
Natural and Working Lands 0

Implementation Tools: Enhance
Management for Forest Health: Reforestation, Insect and Disease Infestations, High Fire Risk
Areas
Wetland Restoration
Healthy Soils Initiative Building soil organic matter to sequester carbon, increase
water retention, improve air and water quality, reduce sediment erosion and dust, improve biological diversity and improve plant health and yields.
CDFA Fertilizer Research and Education Program
44
Natural and Working Lands 0

Implementation Tools: Innovate
Biomass Waste Diversion Bioenergy Biofuels Compost
Urban Greening Energy Efficiency Active Transportation
45
Natural and Working Lands 0

46
Forest Management & Bioenergy
Land Protection & Avoided VMT; Urban Greening
Biomass Diversion & SLCP Reductions
Ag & Forest Waste Diversion to Biofuels

Questions & Comments Natural and Working Lands
47

GHG Reduction Focus Areas
Electricity
48
~ CALIFORNIA iil,1& ENERGY COMMISSION
California r..-..~ -· · - Public Utillities .
~ Commission ~
Ca liforn ia Environmenta l Protection Agency
0 Air Resources Board

Electricity Sector in California
49
Electricity
Total Renewable Generation (GWh)
Biomass
Geothermal
Small Hydro
Solar
Wind
59,750 GWh
Total California Generation (GWh)
Coal
Large Hydro
Renewables
Nuclear
Natural Gas
Unspecified Sources ofPower
296,800 GWh
Instate: 198,900 GWh Imports: 97,900 GWh Instate 44,850 GWh Imports: 14,900 GWh
■
■
■
■
■
■
■
■
■
■
■

Focus Area Description & Scope
50
Electricity
GHG Emissions Statewide
20% from electricity sector
About ½ from out-of-state electricity
37% from transportation
Executive Order B-30-15 sets statewide goal to reduce GHG emissions 40% below 1990 levels by 2030
2013 GHG Emissions by Sector Million Metric Tonnes of CO Equi lent M ITCO z!?)
Total =459 r.11.nco e
■ Electric" Generati n - In State
Electric" Generati n - Imports
■ lndustri·
gricultur·
■ Residential
Commerci·
■ Tr ns ort"iti on
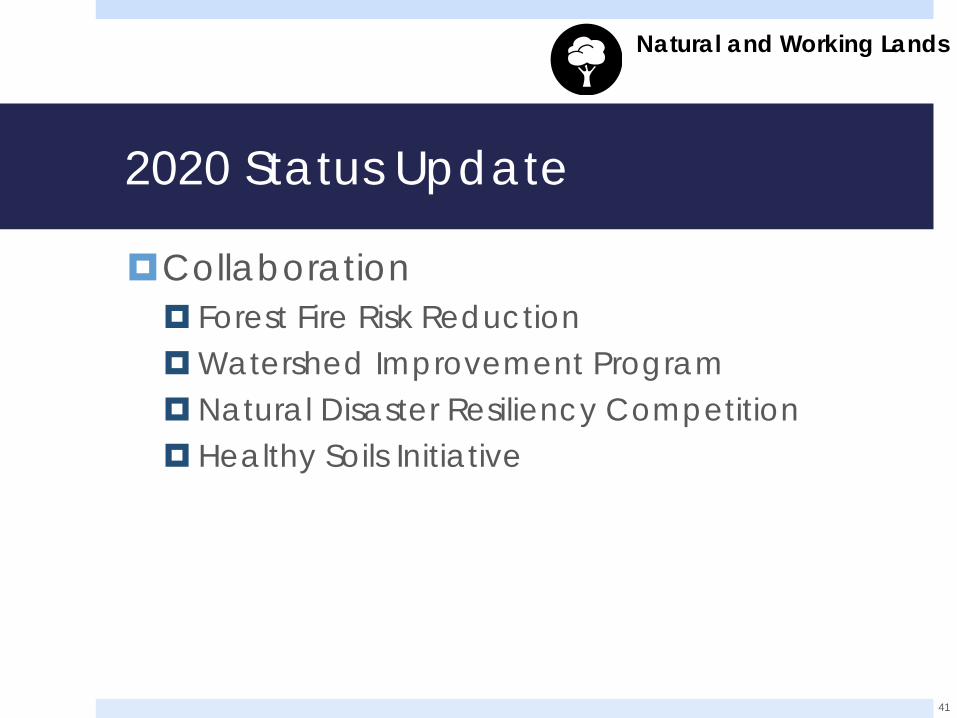
Vision to 2020 Electricity sector is about 20% below 1990 GHG emission
levels
From 2008 to 2013: Renewable generation almost doubled Coal generation reduced by more than half GHG emissions reduced by a quarter
51
Electricity
32,500 GWh • 2008 • .. 55,800 GWh 23,200 GWh 2013 .. • 2008 2013 55,700 GWh
121.5 MMT CO ,c 90.5 MMT CO ,e
RENEWABLE GENERATION 2008 2013
COAL GENERATION GHG EMISSIONS

Annual and Expected Energy from Coal Used to Serve California, 1996 – 2026 (Includes Imports)
52
Electricity
0
5,000
10,000
15,000
20,000
25,000
30,000
35,000
0%
2%
4%
6%
8%
10%
12%
1996
1997
1998
1999
2000
2001
2002
2003
2004
2005
2006
2007
2008
2009
2010
2011
2012
2013
2014
2015
2016
2017
2018
2019
2020
2021
2022
2023
2024
2025
2026
Coal and Petcoke: Energy (Gigawatt-Hours)
Coal
and
Pet
coke
: Sha
re o
f Ene
rgy U
sed
to Se
rve
Calif
orni
a Loa
ds
Share
Energy
Mojave Closure (EIA Summer
Capacity 1,580 MW)
Temporary loss of Intermountain Unit 1 (EIA Summer Capacity
900 MW)
Intermountain Repowers to Natural Gas. (From EIA Summer Capacity of 1,800 MW
to 1,200 MW Combined Cycle)
Actual Expected
2014
~~I : ...__I______.
~
-
: .___I __ ____,
'

Source: CEC Tracking Progress Web Page
Electricity
California Renewable Energy Generation by Resource Type (In-state And Out-of-state)
~
== (!)
2006
20% by 2010 RPS CSI Initiated
Global Warming Solutions Act of 2006
40,000 +---------- 20D2
RPS Established (20% by 2017)
10,000
0 __ .,......,----,-....,...-,--....--........ ----.---,-...,........--,.......---,---,-"T"'""T""""il--r----r---,--.,......,----,---,-_-.--,.......
1983 1990 2000 2010 2014
Solar
Wind
■ Geothermal
■ Small Hydro
Biomass

Achieving 2020 Goals
Electricity sector is about 20% below 1990 GHG emission levels
Energy/Water Nexus
GHG reduction/climate programs Renewables Portfolio Standard Customer-side distributed generation programs Cap-and-Trade Combined Heat and Power Programs Energy Efficiency Electric Vehicle Programs Integrating variable resources
54
Electricity

SB 350, De León
Increases the 33% RPS to 50% RPS
Paves the way for transformation of the California ISO into a regional organization
Requires integrated resource plans
Requires studies on low-income customers’ access and barriers to clean technologies
Ensure low-income residents benefit from clean energy policies
55
Electricity

50% Renewables and Reliability
Increasing renewables beyond 33% creates integration challenges
Overgeneration expected at some times-of-day
Flexible supply and demand needed
Regional marketplace supports renewable integration
56
Electricity
Solutions
Target energy efficiency
Increase storage and demand response
Enable economic dispatch of renewables
Decarbonize transportation fuels
Retrofit existing power plants
Align time of-use rates with system conditions
Diversify resource portfolio
Deepen regional coordination

Energy Imbalance Market
57
Electricity
PacifiCorp
Puget Sound Energy
California ISO
■ EIM entity
■ Planned EIM entry 2015
■ Planned EIM entry 2016
■ Expressed interest in joining EIM

Implementation Tools
Market-Based Mechanisms
Cap-and-Trade
Planning Initiatives
Comprehensive clean energy procurement
RETI 2.0
Regional grid
58
Electricity

Implementation Tools
Research and Development
Synchrophasors
Improved forecasting and grid modeling
Microgrids
Energy storage
Demand response
59
Electricity

Questions & Comments ELECTRICITY
60

GHG Reduction Focus Areas
Transportation and Land Use
61
Californ ia Environmental Protection Ag ency
0 Air Resources Board
Et;· ~ ategic Growth CouncD lb/f:ran5'
CALIFORNIA ENERGY COMMISSION
STA CAUFORNIA ST.ATE mANSPOIH"ATtON AGEN'C'f
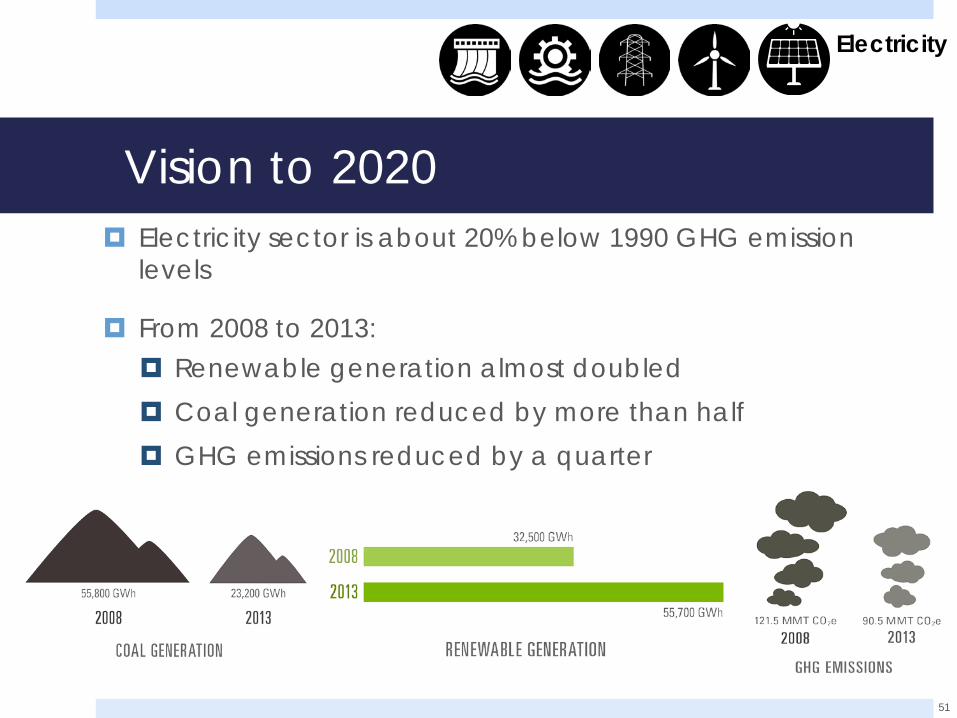
Land Use
Infrastructure
The Transportation Sector
62
Transportation and Land Use
Vehicle Technology
Fuel Use
An Interwoven Transportation “System”

63
Vehicle Tech
Aerodynamics, Weight, tires
Conventional powertrain improvements
Hybrids
Battery EVs
Fuel Cell EVs
Fuel Use
Liquid fuels (fossil and renewable sources)
Electricity
Gaseous fuels (hydrogen, natural gas)
Land Use
Infill, mixed use
Transit oriented development
Infrastructure
High-Speed Rail
Integrated mass transit systems
Bike and pedestrian facilities
Freight facilities
Transportation and Land Use
Focus Area Description & Scope

Achieving 2020 Goals
64
Vehicle Technology:
LDV: Advanced Clean Cars (LEV GHG, ZEV)
HDV: Phase 1 vehicle GHG standards
HDV: Advanced Clean Transit rule
HDV: Zero emission airport shuttles, last mile delivery
LDV & HDV Incentive programs, demonstrations, etc
Marine: Electric shore power at dock
Rail: Commuter rail enhancements (e.g. electric Caltrain)
Numerous other policy actions enacted to address regional ozone and local pollutants
Transportation and Land Use

Achieving 2020 Goals
65
Fuel Use (Supply/Distribution):
Low Carbon Fuel Standard (LCFS)
Cap-and-Trade
Renewable electricity and hydrogen supply requirements
Hydrogen fueling infrastructure (planning, state $)
Electric utility EV rate setting
Electric utility EV infrastructure investments
Transportation and Land Use

Achieving 2020 Goals
66
Land Use:
SB375 Sustainable Communities Strategies (SCS)
GHG reduction targets for 2020 and 2035
SCSs deploy strategies reducing trips and trip length
Results in more compact urban form, transit oriented development, transportation choices
CEQA streamlining encourages more infill and TOD
SB 743, Shift to VMT metric
Transportation and Land Use

Achieving 2020 Goals
67
Infrastructure:
Expansion and integration of rail and transit systems across the state
Development and implementation of a sustainable freight plan pursuant to EO 32-15
Active Transportation Program
Transportation and Land Use

Vision for 2030 and 2050
Vehicle Technology:
Continued efficiency gains
Electric drivetrains (LDVs, HDVs)
Rail efficiency and electrification, expansion at ports
High-Speed Rail with electrified locomotives
Aviation aircraft efficiency and smart routing
Vehicle automation (LDVs, HDVs)
68
Transportation and Land Use

Vision for 2030 and 2050
69
Fuel Use (Supply/Distribution):
Large expansion of renewable fuels in-state
Continued growth in natural gas (especially renewable natural gas)
Expanded use of electricity and hydrogen
Transportation and Land Use

Vision for 2030 and 2050
70
Land Use:
Continue to support planning to reduce vehicle activity by 2035 and beyond
Incentivize and catalyze compact development
Encourage local government implementation of regional SCSs
Provide guidance for sustainable development practices – General Plan Guidelines update
Transportation and Land Use

Vision for 2030 and 2050
71
Infrastructure:
High-Speed Rail phase I in service by 2030, with mode shift from cars and aircraft
Infrastructure supportive of freight efficiency
Integrated and robust local/regional transit networks –transit linked with an integrated schedule and a single ticket
Improved bike and pedestrian facilities for safety and increased mode share
Road surface innovations to reduce fuel consumption and improve ecosystem resilience
Transportation and Land Use

Vision for 2030 and 2050
72
Image Credits- Urban Advantage, Roma Design Group, City of Dana Point
Transportation and Land Use

Vision for 2030 and 2050
73
Image Credits- Urban Advantage, Roma Design Group, City of Dana Point
Transportation and Land Use

Vision for 2030 and 2050
74
Image Credits- Urban Advantage, Roma Design Group, City of Dana Point
Transportation and Land Use

Implementation Tools
75
Vehicle Technology:
LDV: Advanced Clean Cars 2 (post 2025)
HDV: Phase 2 GHG vehicle standards, possibly Phase 3
LDV & HDV: Expanded incentives & demonstrations
Zero emission rail and transit vehicles, state and Federal $
Transportation and Land Use

Implementation Tools
76
Fuel Use (Supply/Distribution):
Market-Based Mechanisms Low Carbon Fuel Standard Cap-and-Trade
ISO and PUC policies to foster “vehicle to grid” services
Transportation and Land Use

Implementation Tools
77
Land Use: SB375
Financing tools for infill development
Improve technical modeling tools
Provide tools and resources for local SCS implementation
Update targets in 2016
Transportation and Land Use

Implementation Tools
78
Infrastructure
Financing tools for transportation infrastructure that reduces emissions
Operating support for transit to get better use of existing infrastructure
Active Transportation Program
Freight infrastructure capital improvement in line with the sustainable freight strategy
Transportation and Land Use

Interaction with Other Sectors
79
Trans fuel production is from industrial sector Refineries, Oil/Gas wells, biofuel production, electricity
“VGI” – Vehicle Grid Interaction (electricity) Vehicle load demand response Vehicle to grid storage and grid services
Biofuel feedstock from Agriculture & Waste sectors Farmed crops, WWTP gas, landfill gas, forest thinings
Energy – Water Nexus Water requirements to produce fuels
Transportation and Land Use

Interaction with Other Sectors
80
Multiple Benefits of Sustainable Development
Water and Resource Conservation
Economic Health
Public Health
Equity
Energy Use in Buildings
Municipal Fiscal Sustainability
Household and Transportation Costs
Availability of Workforce Housing for Economic Growth
Transportation and Land Use

Questions & Comments TRANSPORTATION AND LAND USE
ALL FOCUS AREAS
81

Economic Analysis CALIFORNIA AIR RESOURCES BOARD
82

Goal
Evaluate the economic impact of options for achieving the 2030 GHG target Estimate the economic impact of various technology
pathways and carbon pricing Inform measure development Assess the economic impact of options for achieving the
2030 GHG emission target on the California economy, California businesses, and individuals
83
Economic Analysis

Technology Pathways
Potential pathways Combinations of candidate measures Evaluate:
Adoption rates: stock rollover Emissions Costs and savings Cross-sector interactions
Key Drivers: Reference scenario conditions Technology attributes: availability; cost; performance
84
Economic Analysis

Carbon Pricing
Define carbon pricing in the macroeconomic analysis Changes relative prices in the economy Moves money in the economy
Evaluate: Structural responses Macroeconomic indicators Emissions feedback
85
Economic Analysis

Models Energy and Environmental Economics Pathways Model
Economy-wide stock rollover model Define technology pathways for achieving emission
targets Estimate the costs and savings of the pathways
Regional Economic Models, Inc. (REMI) Input-Output based dynamic general equilibrium model Estimate macroeconomic impact of technology costs and
savings Estimate the macroeconomic impact and macroeconomic
adjustments due to carbon pricing
86
Economic Analysis

Economic and Technology Advisors
87
Experts in economics and modeling
Serve in an advisory capacity in the assessment of the economic impacts of the 2030 Scoping Plan
Coordinate with California agencies and external researchers
Conduct their activities in public meetings
Economic Analysis

Economic Advisor Scope of Work
Provide feedback on the proposed analytical methods
Review the economic and technical assumptions and methods in the technology pathways analyses
Review the assumptions and methods in the macroeconomic analyses
Review and comment on the overall analyses
88
Economic Analysis

Questions & Comments ECONOMIC ANALYSIS
89

Next Steps CALIFORNIA AIR RESOURCES BOARD
90

Tentative Schedule First Board update – November 19, 2015
Draft 2030 Target Scoping Plan – Spring 2016
Regional workshops – Fall 2015 Bay Area, Los Angeles, Central Valley
Technical Workshops – Fall 2015 to Mid 2016 Economic/environmental analyses
Final 2030 Target Scoping Plan presented to Board – Fall 2016
91
Next Steps

Public Comments To facilitate consideration by state agencies
ahead of measure specific workshops*, please provide comments by October 16, 2015
Links to submit both written comments and view all comments received can be found at: http://www.arb.ca.gov/cc/cc.htm
*There will be additional opportunities to comment at these workshops
92
Next Steps

Contact Information
93
Next Steps
Jakub Zielkiewicz [email protected] (916) 445-6018 • Electricity • Transportation and Land Use
Sara Nichols [email protected] (916) 445-1952 • Natural & Working Lands • Short-lived Climate Pollutants
Stephanie Kato [email protected] (916) 324-1840 • Energy Efficiency • Waste Sector
Trish Johnson [email protected] (916) 445-3365 • Environmental Justice Advisory
Committee Emily Wimberger [email protected] (916) 327-5932 Economic Analysis
Michael Gibbs [email protected] (916) 445-4299 Rajinder Sahota [email protected] (916) 323-8503

California Publlic Utilitie Commission
Cal Recycle~
' J
. . fA S lATE TRANSPOfffATION AGENCY" - ,cdfa
• · lb/trans·
~ C ALI FORl'IIA DEPARlMENT OF FOOD & "GRICUL lURE
Ca liforn ia Ernrironmentail Protection Ag ency
e Air Resources Board
~ ic Growth CouncD


![Air Traffic Management 2030 Strategy: Scoping StudyAir Traffic Management 2030 Strategy ± Scoping Study Final Report Author [Redacted1], Helios Aerospace Boulevard ... An airport](https://static.fdocuments.in/doc/165x107/5e7b9e914567854e9d6599b7/air-traffic-management-2030-strategy-scoping-air-traffic-management-2030-strategy.jpg)