2021 ADOPTED BUDGET - Fort Collins, Colorado
24
2021 ADOPTED BUDGET IN BRIEF 1 ADOPTED BUDGET BUDGET IN BRIEF 2021
Transcript of 2021 ADOPTED BUDGET - Fort Collins, Colorado

2021 ADOPTED BUDGET IN BRIEF 1
ADOPTED BUDGETBUDGET IN BRIEF
2021

CITY OF FORT COLLINS
INTRODUCING THE NEW
CITY OF FORT COLLINS
2021 BUDGET IN BRIEF
The City of Fort Collins values listening to the community and making improvements based on feedback. When the 2021 Recommended Budget was released last fall, the City heard clearly that the budget information isn’t accessible to many community members.
WHAT WE HEARD• The City’s traditional budget documents are too long and filled with confusing words and jargon.
• Most of the budget information is provided only in English and requires internet access to view.
OUR RESPONSEThis new Budget in Brief, published in Spanish and English, was created in response. It is intended to be easier to read and understand. Copies are available upon request and will be made available, while supplies last, in the City Clerk’s Office at 300 Laporte Avenue, when the office is reopened to the public.
After viewing it, we encourage you to provide feedback for further improvements. Your feedback will be used in the next Budget in Brief for the 2022 City Manager’s Recommended Budget, which will be available in early September 2021.*
At that time, the “Outcome Pages” in this document are intended to also be printed for distribution across the community, along with information on how residents and businesses can provide feedback.
*See the last page for how to provide feedback.

2021 ADOPTED BUDGET IN BRIEF 1
Neighborhood Livability & Social Health
Fort Collins provides a high-quality built environment, supports connected neighborhoods, seeks to advance equity and affordability, and fosters the social health of the community.
Culture & Recreation
Fort Collins provides and maximizes access to diverse cultural and recreational amenities.
Economic Health
Fort Collins promotes a healthy, sustainable economy reflecting community values.
Environmental Health
Fort Collins promotes, protects and enhances a healthy and sustainable environment.
Safe Community
Fort Collins provides a safe place to live, work, learn and play.
Transportation & Mobility
Fort Collins provides a transportation system that moves people and goods safely and efficiently while being accessible, reliable and convenient.
High Performing Government
Fort Collins exemplifies an efficient, innovative, transparent, effective and collaborative city government.
2021 BUDGET OUTCOMES AND THEMESThe City of Fort Collins uses a budgeting process called Budgeting for Outcomes, where the focus is on the programs and services provided to the community, rather than the traditional approach of budgeting by department. By focusing on achieving these Outcomes, this twist on budgeting gives results that are more meaningful to residents and businesses. Budget requests (which are also called ‘Offers’) for programs and services are created by City staff and must align with the following Outcomes:

2 CITY OF FORT COLLINS
The 2021 Adopted Budget gets its name because it has been adopted, or approved, by majority vote of the City’s elected officials (the 7 residents who make up the City Council). This budget includes the following themes:
1. MINIMIZING IMPACTS TO SERVICE DELIVERY
Maintaining around-the-clock City operations and providing uninterrupted services to the community was even more important due to the impacts of the pandemic. In order to balance the budget, you may notice some services are not being offered, or are being offered at a reduced level, like sweeping streets twice a year instead of four times. Where possible, reductions were aligned with either reduced demand or required service reductions due to COVID-19 and related health orders.
2. STRATEGIC SERVICE ENHANCEMENTS AND REDEPLOYMENTS
Based on the City’s financial situation, very few budget requests (Offers) for additional for additional funding were submitted. The requests considered where chosen for their ability to advance Council priorities or to address critical service needs in our community. A new type of Offer, called a “Redeploy,” was created to clearly show instances where money was reduced in one area and shifted to another, higher priority focus.
3. FOCUS ON COUNCIL PRIORITIES AND SUPPORT EQUITY ADVANCEMENT
While budget constraints resulted in reductions, staff and leadership were intentional in the decision-making process to maintain programs, positions, and projects that advance Council priorities* and support equity advancement.
* The adopted Council Priorities Dashboard can be viewed online at fcgov.com/council/files/council-priorities.pdf

2021 ADOPTED BUDGET IN BRIEF 3
4. CAPITAL PROJECT INVESTMENTS – CURRENT AND FUTURE
Capital projects are things to improve or maintain City property. For example, construction of a new building, road or bridge is a capital project. Similarly, existing City property like sidewalks, water pipes, and electrical lines require maintenance and will eventually need replaced. Key projects outlined in City Plan and the 2020 Strategic Plan were deliberately selected for funding in the 2021 Budget. The City selected projects that could 1) qualify for grant or federal funding, 2) provide critical asset maintenance or replacement, and 3) support community and City Council priorities. Getting capital projects to a ‘shovel ready’ state was also an important consideration for potential future federal stimulus funding.
5. DIFFICULT TRADE-OFFS
When determining which services to scale back, attention was placed on areas with reduced service levels due to the COVID-19 pandemic. In many cases, reduced demand was a deciding factor for which programs saw reductions. Trade-offs were also made in areas where the cost of maintenance could be delayed to future years.
6. MAINTAIN FOCUS ON OUR WORKFORCE
As one of the largest employers in the Fort Collins community, it was important for the City to maintain the integrity of the City’s workforce. Concentrated effort was placed to avoid layoffs and furloughs where possible. One way this was achieved was to include a hiring freeze for over 35 positions in an effort to save about $3 million.

4 CITY OF FORT COLLINS
PROCESS OVERVIEW AND TIMELINEThe City’s traditional two-year budget process is shown below. Note: Council will approve two back-to-back, one-year budgets for 2021 (in November 2020) and 2022 (in November 2021) due to the pandemic.
ODD YEARSApr-Jun Council elections and adoption of Council Priorities Dashboard
Sep-Nov Community engagement and input on the next Strategic Plan This is the 1st opportunity for the public to provide input before staff begins
to develop requests (Offers) for the next budget
Nov-Feb Staff drafts plan / February review at Council work session
EVEN YEARS March Public comment available during 1st and 2nd Reading of the Strategic Plan This is the 2nd opportunity for the public to provide input
Mar-Apr City staff forecast revenue and draft budget requests (aka Offers)
May-Jul Public engagement on budget requests (aka Offers) competing for funding This is the 3rd opportunity for the public to provide input
BFO Teams review budget requests and prioritize by Outcome
Aug Executive team finalizes decisions for the Recommended Budget
Sept By law (through City Charter) the Recommended Budget must be presented to the public before Labor Day
Sept-Oct Public engagement on the Recommended Budget and two Public Hearings This is the 4th opportunity for the public to provide input
Council work sessions to discuss the Recommended Budget
Nov Public comment available during 1st and 2nd Reading of the Budget This is the 5th opportunity for the public to provide input
By law (through City Charter) the Budget must be adopted by Nov 30
Jan Feb Mar Apr May Jun Jul Aug Sep Oct Nov Dec
Odd
Yea
rsEv
en Y
ears Strategic Plan
Council Election, Retreat Priority Adoption
& Onboarding
Budgeting for Outcomes
Strategic Plan

2021 ADOPTED BUDGET IN BRIEF 5
6 CITY OF FORT COLLINS
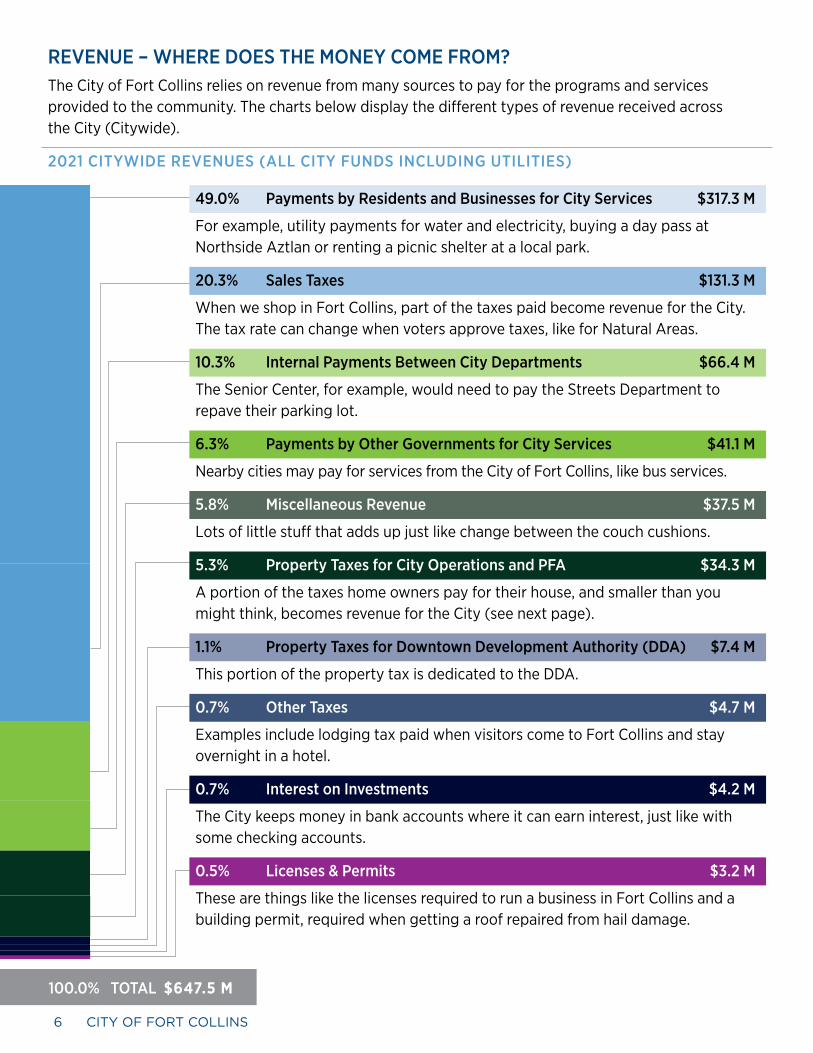
REVENUE – WHERE DOES THE MONEY COME FROM?The City of Fort Collins relies on revenue from many sources to pay for the programs and services provided to the community. The charts below display the different types of revenue received across the City (Citywide).
2021 CITYWIDE REVENUES (ALL CITY FUNDS INCLUDING UTILITIES)
ESTE
S PA
RK
TRI-C
OUNT
Y
SAN
GRE
DE C
RIST
O
BLAC
K HI
LLS
ENER
GY
SAN
ISAB
EL
GUNN
ISON
CON
TY E
A
SAN
MIG
UEL
PA
EMIP
IRE
EA
SAN
LUIS
VAL
LEY
REA
YAM
PA V
ALLE
Y EA
MOU
NTAI
N VI
EW E
A
LA P
LATA
DELT
A-M
ONTR
OSE
EA
GRAN
D VA
LLEY
RPL
INTE
RMOU
NTAI
N RE
A
UNIT
ED P
OWER
POUD
RE V
ALLE
Y RE
A
HOLY
CRO
SS E
A
COLO
RADO
SPR
INGS
FOUN
TAIN
LOVE
LAND
FORT
COL
LINS
- 20
21
FORT
COL
LINS
- 20
20
LONG
MON
T
MOO
N LA
KE
$140
$120
$100
$80
$60
$40
$20
$
RESIDENTIAL ELECTRIC COST COMPARISON(700 kWh per month)
49.0% Payments by Residents and Businesses for City Services $317.3 M
For example, utility payments for water and electricity, buying a day pass at Northside Aztlan or renting a picnic shelter at a local park.
20.3% Sales Taxes $131.3 M
When we shop in Fort Collins, part of the taxes paid become revenue for the City. The tax rate can change when voters approve taxes, like for Natural Areas.
10.3% Internal Payments Between City Departments $66.4 M
The Senior Center, for example, would need to pay the Streets Department to repave their parking lot.
6.3% Payments by Other Governments for City Services $41.1 M
Nearby cities may pay for services from the City of Fort Collins, like bus services.
5.8% Miscellaneous Revenue $37.5 M
Lots of little stuff that adds up just like change between the couch cushions.
5.3% Property Taxes for City Operations and PFA $34.3 M
A portion of the taxes home owners pay for their house, and smaller than you might think, becomes revenue for the City (see next page).
1.1% Property Taxes for Downtown Development Authority (DDA) $7.4 M
This portion of the property tax is dedicated to the DDA.
0.7% Other Taxes $4.7 M
Examples include lodging tax paid when visitors come to Fort Collins and stay overnight in a hotel.
0.7% Interest on Investments $4.2 M
The City keeps money in bank accounts where it can earn interest, just like with some checking accounts.
0.5% Licenses & Permits $3.2 M
These are things like the licenses required to run a business in Fort Collins and a building permit, required when getting a roof repaired from hail damage.
100.0% TOTAL $647.5 M

2021 ADOPTED BUDGET IN BRIEF 7
LARIMER COUNTY PROPERTY TAX BREAKDOWN
As shown on the General Fund revenue chart, Property Tax is an important source of revenue. However, many people may not know that the City of Fort Collins actually receives only 10.5% of the total Property Tax collected and of that amount the City contributes two-thirds of it to the Poudre Fire Authority (PFA) . Thus, only 3.5% of Property Tax directly pays for City operations.
UTILITY RATE CHANGES
Of the City’s four utility rates, two are changing in 2021. Water rates are increasing 2% due to the impacts from the 2020 regional fires in the Cache la Poudre River basin, a critical source of drinking water for City water customers. The average electric rate will increase 3% in order to keep the electrical system working effectively and prepare for future electrical repair, replacement, and construction. The bar chart below shows the City of Fort Collins electric rates compared to other Colorado utilities who serve over 7,500 customers. The green bar shows the amount after including the rate increase for 2021.
ESTE
S PA
RK
TRI-C
OUNT
Y
SAN
GRE
DE C
RIST
O
BLAC
K HI
LLS
ENER
GY
SAN
ISAB
EL
GUNN
ISON
CON
TY E
A
SAN
MIG
UEL
PA
EMIP
IRE
EA
SAN
LUIS
VAL
LEY
REA
YAM
PA V
ALLE
Y EA
MOU
NTAI
N VI
EW E
A
LA P
LATA
DELT
A-M
ONTR
OSE
EA
GRAN
D VA
LLEY
RPL
INTE
RMOU
NTAI
N RE
A
UNIT
ED P
OWER
POUD
RE V
ALLE
Y RE
A
HOLY
CRO
SS E
A
COLO
RADO
SPR
INGS
FOUN
TAIN
LOVE
LAND
FORT
COL
LINS
- 20
21
FORT
COL
LINS
- 20
20
LONG
MON
T
MOO
N LA
KE
$140
$120
$100
$80
$60
$40
$20
$
RESIDENTIAL ELECTRIC COST COMPARISON(700 kWh per month)
Utility Rate Adjustments 2019 2020 2021
Electric 5.0% 5.0% 3.0%
Water 0.0% 0.0% 2.0%
Wastewater 0.0% 0.0% 0.0%
Stormwater 2.0% 2.0% 0.0%
• Colorado Utilities with more than 7,500 residential meters• Source: Colorado Association of Municipal Utilities, January 2020 data• Not all cities have their own electric utility.
58.8 % Poudre School District
24% Larimer County
7.0% City contribution to PFA
3.5% Other
3.5% City operations
3.2% Library District

8 CITY OF FORT COLLINS
0 50 100 150 200
HIGH PERFORMING GOVERNMENT
TRANSPORTATION & MOBILITY
SAFE COMMUNITY
ENVIRONMENTAL HEALTH
ECONOMIC HEALTH
CUTLURE & RECREATION
NEIGHBORHOOD LIVABILITY & SOCIAL HEALTH
OTHER FUNDS
GENERAL FUND
NEIGHBORHOOD LIVABILITY & SOCIAL HEALTH: 16.6M
CUTLURE & RECREATION: 37.9M
TRANSPORTATION& MOBILITY: 75.7M
ENVIRONMENTALHEALTH: 78.7M2
SAFE COMMUNITY: 98.3M3
HIGH PERFORMING GOVERNMENT: 111.0M
ECONOMIC HEALTH : 168.6M1
111.0M
75.7M
98.3M3
78.7M2
168.6M1
37.9M
16.6M
EXPENSES – WHERE DOES THE MONEY GO?Citywide expenses are shown in the charts below. These costs are necessary to provide the programs and services funded in the budget.
2021 CITYWIDE EXPENSES (ALL CITY FUNDS INCLUDING UTILITIES) $700.3 MILLION
The bar chart below displays how the budgeted expenses are spread across the City’s seven Outcomes. The colored portion of each bar represents the amount specific to the General Fund, which is the bucket of money with the least restrictions on how it can be spent.
TOTAL EXPENSES BY OUTCOME$700.3 MILLION*
* In addition to the seven Outcomes, the total allocation by results also includes $113.5M in 2021 for items like transfers between funds, debt service, payments to retirees and insurance costs.
* Internal Payments Between City Departments are also called Transfers, which is like moving dollars from one bucket of money to another. The most common example is the contribution from the General Fund to other City funds to help pay for their programs and services.
Other Supplies 3.7% Debt Service
4.2%
Capital, Including Land, Buildings,Vehicles, Large Machinery, etc.
5.9%
Other Expenses6.6%
Internal PaymentsBetween City Departments*
9.5%
Energy Purchased from Platte River Power Authority
14.1% Employee Pay & Benefits24.4%
Services Purchased From ExternalBusinesses, Including Local
31.6%

2021 ADOPTED BUDGET IN BRIEF 9
EXPENSES BY OUTCOME
Budgeting for Outcomes, or BFO, is the process the City uses to create the budget. The programs and services included in it are grouped into the Outcomes, described on page 1. The following pages are separated into those seven Outcomes. Each page shows the ongoing programs and services which were approved for continued funding. The bottom of each page displays any additional funding for services in that Outcome, as well as reductions necessary to balance the budget.
The General Fund is the bucket of money with the least restrictions on how it can be used. An example of such a restriction is the Golf Fund where the revenue from rounds of golf can only be spent on golf-related expenses.
The City has the most choices in how to budget General Fund money. For 2021, the cost to provide City programs, services and operations is shown in the following pie chart.
Capital, Including Land, Buildings, Vehicles, Large Machinery, etc. 0.8%
Other Expenses 2.6% Other Supplies 3.1%
Internal Payments Between City Departments* 20.1%
Services Purchased from ExternalBusinesses, Including Local30.8%
Employee Pay & Benefits 42.7%
2021 GENERAL FUND EXPENSES$182.4 MILLION
* Internal Payments Between City Departments are also called Transfers, which is like moving dollars from one bucket of money to another. The most common example is the contribution from the General Fund to other City funds to help pay for their programs and services.
10 CITY OF FORT COLLINS
Affordable Housing and Human Services Program
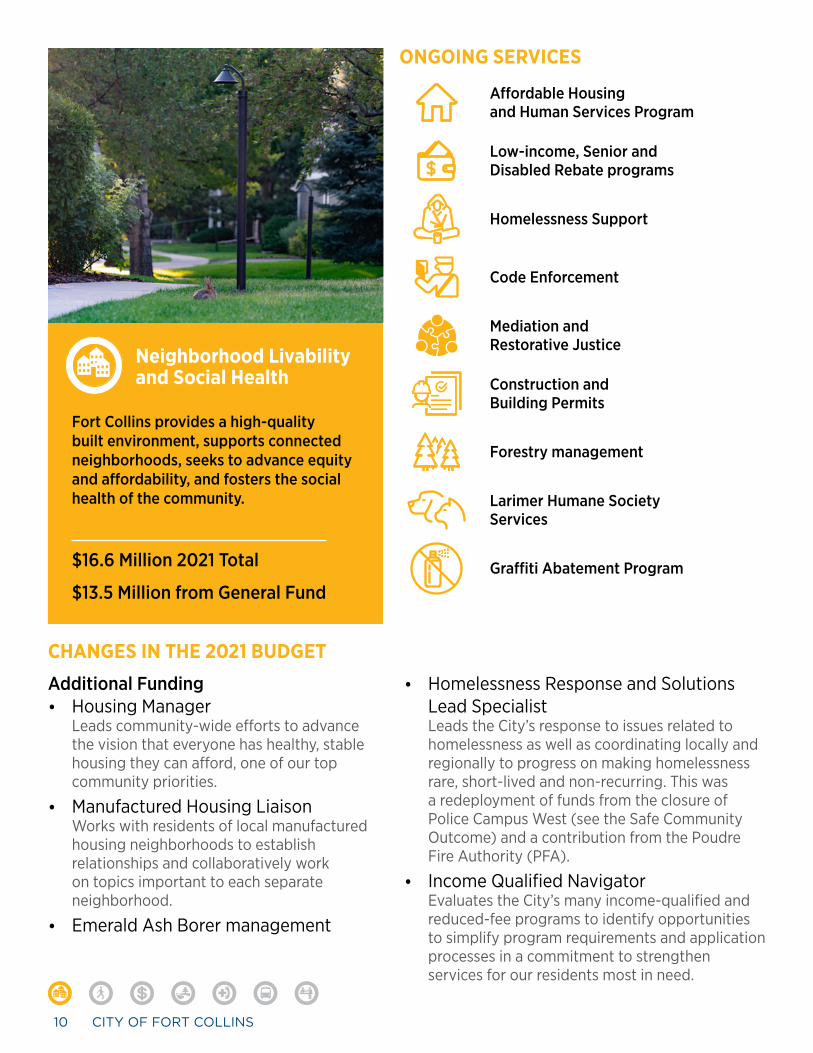
Neighborhood Livability and Social Health
Fort Collins provides a high-quality built environment, supports connected neighborhoods, seeks to advance equity and affordability, and fosters the social health of the community.
$16.6 Million 2021 Total
$13.5 Million from General Fund
Additional Funding• Housing Manager
Leads community-wide efforts to advance the vision that everyone has healthy, stable housing they can afford, one of our top community priorities.
• Manufactured Housing Liaison Works with residents of local manufactured housing neighborhoods to establish relationships and collaboratively work on topics important to each separate neighborhood.
• Emerald Ash Borer management
Low-income, Senior and Disabled Rebate programs
Homelessness Support
Code Enforcement
Mediation and Restorative Justice
Construction and Building Permits
Forestry management
Larimer Humane Society Services
Graffiti Abatement Program
ONGOING SERVICES
CHANGES IN THE 2021 BUDGET
• Homelessness Response and Solutions Lead Specialist Leads the City’s response to issues related to homelessness as well as coordinating locally and regionally to progress on making homelessness rare, short-lived and non-recurring. This was a redeployment of funds from the closure of Police Campus West (see the Safe Community Outcome) and a contribution from the Poudre Fire Authority (PFA).
• Income Qualified Navigator Evaluates the City’s many income-qualified and reduced-fee programs to identify opportunities to simplify program requirements and application processes in a commitment to strengthen services for our residents most in need.
2021 ADOPTED BUDGET IN BRIEF 11
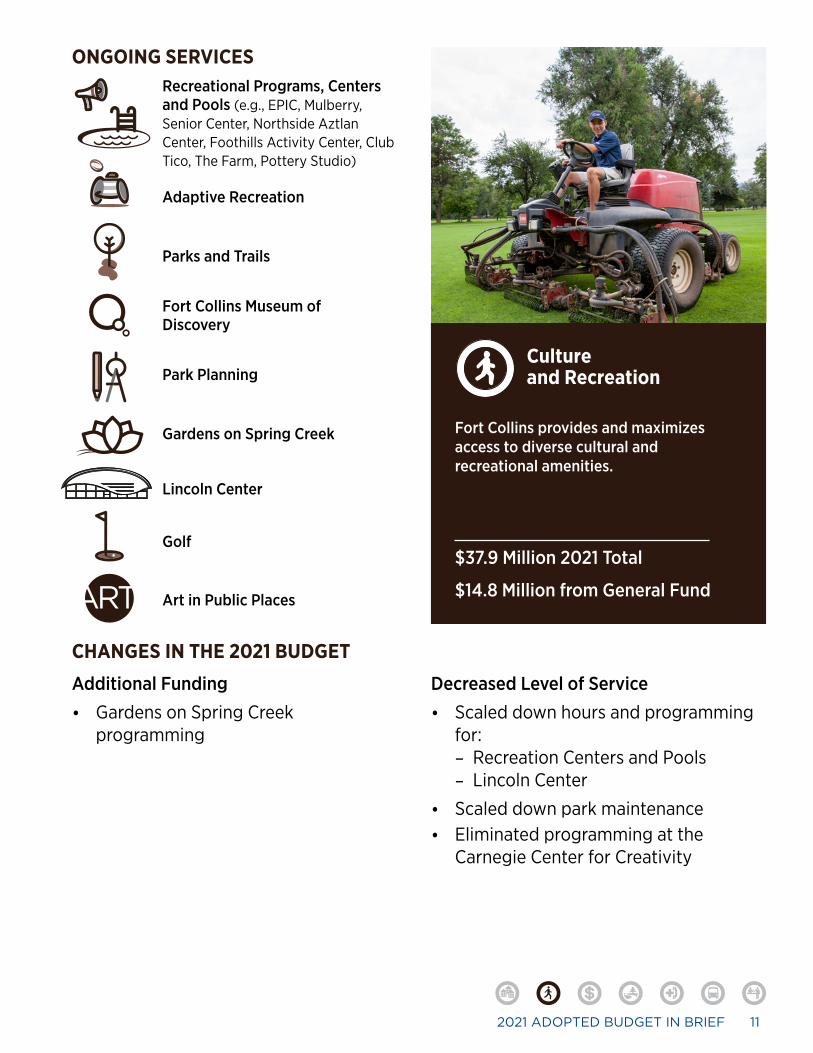
Culture and Recreation
Fort Collins provides and maximizes access to diverse cultural and recreational amenities.
$37.9 Million 2021 Total
$14.8 Million from General Fund
Recreational Programs, Centers and Pools (e.g., EPIC, Mulberry, Senior Center, Northside Aztlan Center, Foothills Activity Center, Club Tico, The Farm, Pottery Studio)
Additional Funding
• Gardens on Spring Creek programming
Adaptive Recreation
Parks and Trails
Fort Collins Museum of Discovery
Park Planning
Gardens on Spring Creek
Lincoln Center
Golf
Art in Public Places
ONGOING SERVICES
Decreased Level of Service
• Scaled down hours and programming for:
– Recreation Centers and Pools – Lincoln Center
• Scaled down park maintenance• Eliminated programming at the
Carnegie Center for Creativity
CHANGES IN THE 2021 BUDGET

12 CITY OF FORT COLLINS
Business Support
Economic Health
Fort Collins promotes a healthy, sustainable economy reflecting community values.
$168.6 Million 2021 Total
$4.4 Million from General Fund
Additional Funding
• Electric Utility capital projects and equipment
• Business Assistance and Economic Recovery programming
• Downtown sidewalk, curb and alley improvements
• Oak Street Plaza Renovation• Staffing for Connexion (high-speed internet)
Downtown Landscaping and Maintenance
Downtown Holiday Lighting
Electric Utility Services
Broadband
Urban Renewal Authority
Downtown Development Authority
ONGOING SERVICES
Decreased Level of Service
• Scaled down service and maintenance of Downtown parks
• Scaled down support for Downtown events
CHANGES IN THE 2021 BUDGET

2021 ADOPTED BUDGET IN BRIEF 13
Environmental Health
Fort Collins promotes, protects and enhances a healthy and sustainable environment.
$78.7 Million 2021 Total
$2 Million from General Fund
Additional Funding
• Water Utility capital projects and equipment
• Wastewater Utility capital projects and equipment
• Investments in the EPIC Loans Program for home energy efficiency and solar rebates
Waste Reduction and Recycling (Timberline Recycling Center)
ONGOING SERVICES
Decreased Level of Service
• Eliminated Household Hazardous Waste events
• Scaled Down Outreach and Education for Waste Reduction and Recycling
• Eliminated Holiday Tree Recycling Program
CHANGES IN THE 2021 BUDGET
Natural Areas and Nature in the City
Indoor and Outdoor Air Quality
Climate Action Plan
City Sustainability
Wastewater Utility Services
Water Utility Services
Conservation of Water and Electricity

14 CITY OF FORT COLLINS
Emergency Prevention and Response
Safe Community
Fort Collins provides a safe place to live, work, learn and play.
$98.3 Million 2021 Total
$81.7 Million from General Fund
Additional Funding
• Municipal Court Staffing• Hazardous material removal from
public spaces• Stormwater Utility capital projects
and equipment
Fire Protection and Prevention
911 Dispatch and Police Records
Community Policing
Police Patrol and K9 Unit
Municipal Court
Stormwater Utility Services
Cybersecurity and Protecting Customer Information
Natural Areas and Parks Rangers
West Nile Virus Program
ONGOING SERVICES
Decreased Level of Service
• Closed Campus West Police Office• Scaled down West Nile Virus
education and outreach
CHANGES IN THE 2021 BUDGET
2021 ADOPTED BUDGET IN BRIEF 15
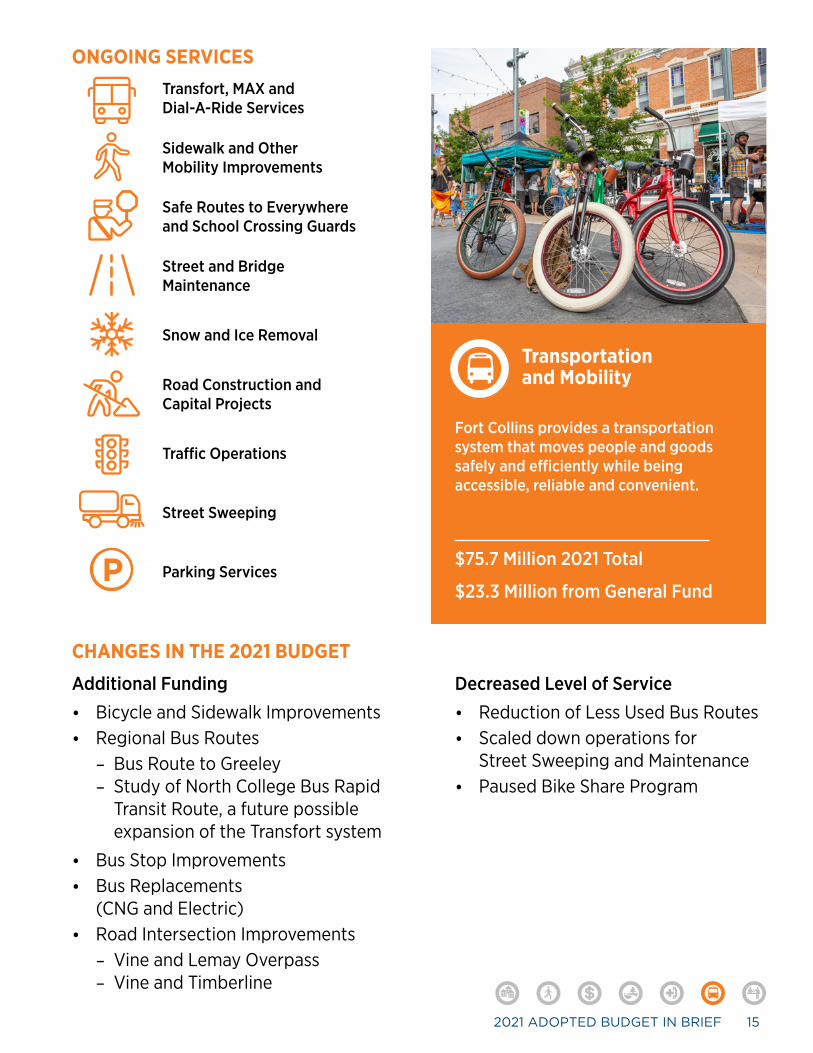
Transportation and Mobility
Fort Collins provides a transportation system that moves people and goods safely and efficiently while being accessible, reliable and convenient.
$75.7 Million 2021 Total
$23.3 Million from General Fund
Transfort, MAX and Dial-A-Ride Services
Additional Funding
• Bicycle and Sidewalk Improvements• Regional Bus Routes
– Bus Route to Greeley – Study of North College Bus Rapid
Transit Route, a future possible expansion of the Transfort system
• Bus Stop Improvements• Bus Replacements
(CNG and Electric)• Road Intersection Improvements
– Vine and Lemay Overpass – Vine and Timberline
Sidewalk and Other Mobility Improvements
Safe Routes to Everywhere and School Crossing Guards
Street and Bridge Maintenance
Snow and Ice Removal
Road Construction and Capital Projects
Traffic Operations
Street Sweeping
Parking Services
ONGOING SERVICES
Decreased Level of Service
• Reduction of Less Used Bus Routes• Scaled down operations for
Street Sweeping and Maintenance• Paused Bike Share Program
CHANGES IN THE 2021 BUDGET

16 CITY OF FORT COLLINS
High Performing Government
Fort Collins exemplifies an efficient, innovative, transparent, effective and collaborative city government.
$110.0 MIllion 2021 Total$31.2 MIllion from General Fund
Additional Funding
• Improvements to the Utility Billing System
FCTV, Communications and Public Engagement
ONGOING SERVICES
Decreased Expenses• Hiring Freeze• No salary increases, except for
contractual agreements• Employee Conference and Travel • Supplies and Equipment• City Vehicle Fuel Savings• Food for volunteer Boards
and Commissions• Temporary Pause on Employee
Non-Essential Training• Reduced hours of Downtown Restrooms
CHANGES IN THE 2021 BUDGET
City Vehicles and Buildings
Utility Customer Service
Special Events and Volunteer Coordination
Business Licenses and Sales Tax Collection
Purchasing of Equipment and Services
Employment Services
Passports
City Council and Elections

2021 ADOPTED BUDGET IN BRIEF 17
2021 CAPITAL PROJECTSCapital projects for new construction and maintenance of existing assets, like roads, bridges, sidewalks, underground pipes, parks and trails are included in the 2021 Budget. This map shows capital projects that have a primary location that could be easily displayed, and special attention has been called out for key strategic projects of interest to community members. In addition to the projects called out in the legend below, the 2021 Budget includes projects funded by the 2015 Community Capital Improvement Tax (CCIP). These are often spread out over Fort Collins like sidewalk, bicycle, and bus stop improvements, as well as Art in Public Places, and are not easily shown on a map.
Service Layer Credits: World TopographicMap: County of Larimer, Bureau of LandManagement, Esri, HERE, Garmin,INCREMENT P, USGS, METI/NASA, NGA,EPA, USDAWorld Topographic Map: City of Fort Collins,County of Larimer, Bureau of LandManagement, Esri, HERE, Garmin,
14.18
14.14
14.11
12.89
14.7
14.1312.87
43.1
14.12
14.16
26.11
40.6
1.4
1.4
1.11 1.12
1.13
1.13
1.13
11.18 12.81
12.23
43.2, 43.3
43.2
14.11
43.2
43.1
43.2
43.2
43.3
12.29
26.11
2021 Capital ProjectsIn City Managers Recommended Budget
Printed: October 07, 2020
Capital Projects
Community ServicesDowntown General Improvement DistrictPlanning, Development, and TransportationUtility Services
Community ServicesDowntown General Improvement DistrictUtility Services
©
12.82
Meadow Springs Ranch
##.# = Offer number
BUDGET REQUEST (OFFER) AND ID #• New parks and recreational trails
(43.1 – 43.3)
• Oak Street Plaza Renovation (40.6)
• Intersection Improvements including: – Vine and Lemay (1.11) – Vine and Timberline (1.12) – College and Trilby (1.4)
• College Avenue Signal Light Improvements (1.13)
• Projects in green represent Downtown improvements
• Projects in darker blue represent numerous projects within the electric, water, wastewater and stormwater utilities
Note: Additional information about these specific projects, as well as the programs and services listed on the previous pages, is available in our comprehensive budget document. Go to fcgov.com/budget, open the 2021 Adopted Budget and search for the Offer ID # to read the project description.

18 CITY OF FORT COLLINS
DEPARTMENT VIEW OF BUDGETED EXPENSESThe City of Fort Collins budgets based on the programs and services provided to the community, rather than the traditional organizational or departmental approaches much more commonly used across the country. The table below, however, has been created to provide that traditional display.
EXPENSES BY CITY DEPARTMENTActual 2019
2020 Original Budget
2021 Original Budget
% Change from 2020
COMMUNITY SERVICESRecreation 8,888,553 9,538,350 8,184,345 -14.2%Community Services Admin 358,783 364,038 297,801 -18.2%Park Planning & Development 10,348,670 5,128,169 8,059,110 57.2%Cultural Services 9,423,144 8,122,117 7,796,934 -4.0%Parks 17,817,514 18,546,675 18,039,296 -2.7%Natural Areas 12,531,014 13,284,916 12,861,340 -3.2%Subtotal of Community Services 59,367,678 54,984,265 55,238,826 0.5%
PLANNING, DEVELOPMENT & TRANSPORTATION (PDT) SERVICESPDT Administration 1,704,111 1,565,079 1,614,864 3.2%Transfort / Parking Services 27,850,417 23,856,822 25,459,813 6.7%Comm Dev & Neighborhood Svcs 9,289,309 9,052,420 8,524,561 -5.8%FC Moves 1,587,763 1,648,979 1,659,092 0.6%Streets 26,314,049 25,238,616 23,961,509 -5.1%Traffic 4,114,728 4,811,101 4,385,551 -8.8%Engineering 21,377,847 13,301,566 20,941,660 57.4%Subtotal of PDT Services 92,238,224 79,474,583 86,547,050 8.9%
SUSTAINABILITY SERVICESEconomic Health Office 2,058,873 1,459,275 1,694,304 16.1%Social Sustainability* 2,605,343 2,932,636 3,229,994 10.1%Environmental Services 2,283,106 2,197,939 1,980,468 -9.9%Sustainability Services Admin 491,705 508,874 518,646 1.9%Urban Renewal Authority 4,197,833 4,844,866 5,068,599 4.6%Subtotal of Sustainability Services 11,636,861 11,943,590 12,492,011 4.6%UTILITY SERVICESElectric and Telecommunications 170,945,280 156,958,457 154,275,681 -1.7%Water 37,625,552 28,416,806 34,791,438 22.4%Wastewater 26,263,519 21,607,938 29,583,422 36.9%Stormwater 17,444,443 16,048,134 19,709,478 22.8%Customer Service and Administration 14,616,645 16,808,259 16,812,870 0.0%
Subtotal of Utility Services 266,895,439 239,839,594 255,172,889 6.4%
Parks & Trails Capital Projects
Transportation Capital Projects
Downtown Capital Projects and Pandemic Response
Water Utility Capital Projects
Affordable Housing and Homelessness Initiatives
Wastewater Utility Capital Projects
Stormwater Utility Capital Projects
* Social Sustainability also receives federal funding, recently amounting to over $2 million a year. These moneys are typically approved by Council in the summer months and are used to support nonprofits providing human services in our community, as well as affordable housing projects.

2021 ADOPTED BUDGET IN BRIEF 19
Actual 2019
2020 Original Budget
2021 Original Budget
% Change from 2020
POLICE SERVICESInvestigations 7,959,179 8,237,339 8,514,216 3.4%Police Information Services 9,934,545 8,444,475 7,593,040 -10.1%Patrol 18,462,195 19,694,858 17,356,259 -11.9%Community and Special Services 8,140,799 7,685,009 9,398,097 22.3%Office of the Chief 5,689,775 4,098,291 4,869,992 18.8%Subtotal of Police Services 50,186,493 48,159,972 47,731,604 -0.9%
INFORMATION AND EMPLOYEE SERVICESInformation Technology 10,080,931 10,594,980 9,681,470 -8.6%Comm. & Public Involvement 3,359,354 2,995,402 3,025,540 1.0%Human Resources 33,426,438 41,807,198 38,885,821 -7.0%Operation Services 23,732,240 25,866,180 21,543,159 -16.7%Subtotal of Info. & Emp. Services 70,598,962 81,263,760 73,135,990 -10.0%
FINANCIAL SERVICESFinance Administration 1,125,858 1,196,611 1,278,885 6.9%Accounting and Treasury 1,498,071 1,516,916 1,566,848 3.3%Budget 514,852 551,718 581,742 5.4%Purchasing 577,091 551,612 601,778 9.1%Safety, Security, & Risk Mgmt. 6,662,038 4,470,669 5,098,182 14.0%Sales Tax 883,976 922,181 911,079 -1.2%Subtotal of Financial Services 11,261,885 9,209,707 10,038,514 9.0%
EXECUTIVE, LEGAL AND JUDICIAL (ELJ) SERVICESCity Clerk's Office 1,128,105 1,036,035 1,289,713 24.5%City Council 218,441 179,736 182,790 1.7%City Manager's Office 2,752,690 2,821,202 2,873,036 1.8%City Attorney's Office 2,702,177 2,802,044 2,861,018 2.1%Municipal Court 1,139,727 1,292,855 1,393,977 7.8%Subtotal of ELJ Services 7,941,140 8,131,872 8,600,534 5.8%
OTHER EXPENSESDebt & Other Uses 33,819,241 22,954,481 29,720,032 29.5%Not Specific to a Department 6,919,054 8,198,402 7,749,983 -5.5%Transfers Between Funds 78,716,537 52,607,399 66,442,691 26.3%Poudre Fire Authority 29,824,491 30,842,208 30,987,586 0.5%Downtown Development Authority (DDA) 2,870,042 11,277,574 16,452,894 45.9%
Subtotal of Other Expenses 152,149,365 125,880,064 151,353,186 20.2%
TOTAL $722,276,048 $658,887,407 $700,310,604 6.3%
Departmental Shifts - Total Police Decreased 0.9%
Insurance Premium Increases due to Hail Damage Claims
April 2021 City Election (Occurs Every Two Years)
Broadband Debt Payments and Electric Customer Loan Program (Epic Loans)
Governmental Accounting Requirements( Not an Actual Expense)
Budget Determined by DDA Board of Directors

20 CITY OF FORT COLLINS
SUMMARY OF CHANGES TO STAFFINGEach budget cycle typically includes changes to staffing levels necessary to support service delivery to the community. The 2021 adopted budget includes a net increase of 16.4 City staff members, detailed in the table below. Of that net increase, 13 of the additional staff are permanent positions in utilities; specifically, for Connexion, the City’s expanding internet service provider.
Service Area
Classified Employees and Unclassified Management Contractual Employees Net Increase
(Decrease) in staffingAdditions Reductions Additions Reductions
Community Services 1.0 2.0 (2.0) 1.0
Executive Services (0.6) (0.6)
Financial Services 1.0 (1.0) 0.0
Information and Employee Services 1.0 1.0
Planning, Development and Transportation Services 3.0 (4.0) (1.0)
Sustainability Services 2.0 1.0 (2.0) 1.0
Utility Services 13.0 3.0 (1.0) 15.0
Total 21.0 (0.6) 6.0 (10.0) 16.4

2021 ADOPTED BUDGET IN BRIEF 21
CONTACT INFORMATION AND REQUESTED FEEDBACKThis document is viewable online at fcgov.com/budget. Please send any questions or comments about this document or the City’s overall budget process, as well as requests for printed copies, to:
Lawrence PollackBudget Director(970) [email protected]
As noted in the introduction, the City of Fort Collins values listening to the community and making improvements based on feedback.
After viewing this document, we encourage you to provide feedback to the staff person noted above for improvements to this document in the future.

Auxiliary aids and services are available for persons with disabilities. V/TDD: 711 21-23000