2021-2060 Population Forecasts
48
2021-2060 Population Forecasts LONG-TERM PROJECTIONS FOR CLARK COUNTY, NEVADA June 2021 Prepared by Center for Business and Economic Research Prepared for Regional Transportation Commission of Southern Nevada, Southern Nevada Water Authority, Southern Nevada Regional Planning Coalition, and members of the Forecasting Group
Transcript of 2021-2060 Population Forecasts

2021-2060Population ForecastsLONG-TERM PROJECTIONS FOR CLARK COUNTY, NEVADA
June 2021
Prepared byCenter for Business and Economic Research
Prepared forRegional Transportation Commission of Southern Nevada,Southern Nevada Water Authority,Southern Nevada Regional Planning Coalition,and members of the Forecasting Group

Prepared for
Regional Transportation Commission of Southern Nevada,
Southern Nevada Regional Planning Coalition,
Southern Nevada Water Authority,
and members of the Forecasting Group.
Copyright ©2021 by the UNLV Center for Business and Economic Research
The views expressed represent those of the authors and do not necessarily represent those of the University of
Nevada, Las Vegas, or the Nevada System of Higher Education.
University of Nevada, Las Vegas
Box 456002
4505 S. Maryland Parkway
Las Vegas, Nevada 89154-6002
(702) 895-3191
http://cber.unlv.edu

2021 Clark County Population Forecasts
i cber.unlv.edu
Executive Summary
Each year, the Regional Transportation Commission of Southern Nevada (RTC), the Southern Nevada
Regional Planning Coalition (SNRPC), the Southern Nevada Water Authority (SNWA), a group of
community demographers and analysts, and the Center for Business and Economic Research (CBER) at
the University of Nevada, Las Vegas work together to develop a long-term forecast of Clark County's
population and its growth that is consistent with the structural economic characteristics of the county.
Toward this end, we employ a general-equilibrium demographic and economic model developed by
Regional Economic Models, Inc. (REMI), specifically for Clark County.
We recalibrate the REMI model to incorporate the most recent available information regarding
local employment and its growth and local public and private investment projects. The resulting long-term
forecast predicts positive population growth throughout the range of the forecast. SNRPC estimates that
Clark County population was 2.38 million in 2020, a strong increase of 2.2 percent despite the COVID-19
outbreak. We expect that Clark County’s population will reach approximately 3.02 million by 2035 and
nearly 3.38 million by 2060.
Table 1 summarizes the population forecast. In the short term, the population in Clark County is
predicted to grow strongly in the short term, boosted by the local economic recovery, at rates of 1.7, 2.2,
2.4, and 2.3 percent, respectively, in 2021, 2022, 2023, and 2024. The short-term forecasts, however,
exhibit higher uncertainty due to the risks of potential viral mutations and their unpredictable effect on
the continuation of the pandemic and, thus, on the future path of the economy. Despite short-term
economic uncertainties and modeling difficulties, this forecast provides information for medium- to long-
term planning purposes. In the medium term, the population growth rate is expected to show modest
growth, but the growth rate beginning in 2024 will decline over time. In the long term, its growth rate
tapers off as Clark County’s maturing economy attracts fewer “net” economic and international migrants
(i.e., in-migrants minus out-migrants). In addition, the population ages over time. As a result, the rate of
growth, which exceeded the national average over the past 50 years, moderates and eventually moves
below the national rate of growth. That is, by 2050, the population growth rate falls to marginally below
the projected long-term national population growth rate.1 As the Clark County economy continues to
mature, the population growth stabilizes around 0.2 percent after 2056.
1 Source: https://www.census.gov/data/tables/2017/demo/popproj/2017-summary-tables.html

2021 Clark County Population Forecasts
ii cber.unlv.edu
As with any forecast, potential risks exist that could lead to either an over- or under-forecast of
population and its growth rate. Since the downside risk to our employment forecast exceeds the upside
risk, the risk of over-forecasting population and its growth rate exceeds the risk of under-forecasting in
the near term due to the uncertainties associated with potential viral mutations and a slowing vaccination
rate. That is, if the current economic recovery faces an unexpected new variant that results in large
increases of cases, for example, as seen in India, that could cause a slowing of the economic recovery. The
economic uncertainty for the short term remains at a high-level as we have never experienced an
economic downturn caused by public health crisis. Our long-term forecasts, however, exclude business-
cycle, seasonal, and irregular events, which respond to short-run risks. In summary, our forecasts primarily
provide a long-term planning tool that address the trend movements in population, excluding the short-
run business-cycle, seasonal, and irregular effects.

2021 Clark County Population Forecasts
iii cber.unlv.edu
Table 1. Clark County Final Population Forecast: 2010-2060
Year Population
Forecast Change in Population
Forecast Growth in Population
Forecast
2010 1,951,269* -55,078 -2.7%
2011 1,966,630** 15,361 0.8%
2012 2,008,654** 42,024 2.1%
2013 2,062,253** 53,599 2.7%
2014 2,102,238** 39,985 1.9%
2015 2,147,641** 45,403 2.2%
2016 2,205,207** 57,566 2.7%
2017 2,248,390** 43,183 2.0%
2018 2,284,616** 36,226 1.6%
2019 2,325,798** 41,182 1.8%
2020 2,376,683** 50,885 2.2%
2021 2,417,000 40,317 1.7%
2022 2,470,000 53,000 2.2%
2023 2,529,000 59,000 2.4%
2024 2,587,000 58,000 2.3%
2025 2,640,000 53,000 2.0%
2026 2,691,000 51,000 1.9%
2027 2,738,000 47,000 1.7%
2028 2,782,000 44,000 1.6%
2029 2,822,000 40,000 1.4%
2030 2,859,000 37,000 1.3%
2031 2,894,000 35,000 1.2%
2032 2,928,000 34,000 1.2%
2033 2,959,000 31,000 1.1%
2034 2,989,000 30,000 1.0%
2035 3,018,000 29,000 1.0%
2040 3,138,000 21,000 0.7%
2045 3,228,000 16,000 0.5%
2050 3,296,000 12,000 0.4%
2055 3,345,000 9,000 0.3%
2060 3,383,000 6,000 0.2% *2010 U.S. Census. ** SNRPC consensus population estimate. Note: The changes and growth rates in population forecasts after 2035 are not cumulative. The forecast changes and growth
rates represent the annual values. See Table C2 for the complete set of forecasts.

2021 Clark County Population Forecasts
iv cber.unlv.edu
TABLE OF CONTENTS
Executive Summary ....................................................................................................................... i
I. Introduction......................................................................................................................... 1
II. Comparison of REMI Models: Current and Previous Year .................................................. 2
III. Recalibrating the Model ...................................................................................................... 8
A. Adjustment of the national economic forecast ............................................................ 8
B. Rebasing the population forecast ................................................................................. 9
C. Employment adjustment .............................................................................................. 9
D. Hotel room adjustment ..............................................................................................13
E. Transportation and infrastructure improvements .....................................................15
IV. Analysis of the Economic and Demographic Forecast ......................................................16
A. Population ..................................................................................................................17
B. Employment ................................................................................................................19
C. Gross domestic product ..............................................................................................20
V. Comparing the Current Forecast with Forecasts of Previous Years ..................................21
VI. Risks to the Forecast .........................................................................................................22
VII. Conclusion .........................................................................................................................24
Appendices:................................................................................................................................25
Appendix A: Computation of the Jobs-to-Room Ratio ......................................................25
Appendix B: Hotel/Motel Room Construction ..................................................................27
Appendix C: Detailed Report Tables ..................................................................................28

2021 Clark County Population Forecasts
v cber.unlv.edu
LIST OF TABLES
Table 1. Clark County Final Population Forecast: 2010-2060 ...................................................... iii
Table 2. Clark County REMI Out-of-the-Box Forecast Comparison: LHY2018 and
LHY2017 ........................................................................................................................... 7
Table 3. Clark County Employment Levels (in 000s) before and after
BEA Adjustment for 2019 .............................................................................................. 10
Table 4. Employment Growth Rates for Clark County before DETR Adjustment for 2020 ......... 11
Table 5. Model Job Adjustments (in 000s) for 2019 and 2020 ................................................... 12
Table 6. Expected Additional Employment due to New Rooms: Projections for 2021-2025 ..... 14
Table 7. Population History, REMI Forecasts, and Final Rebased Forecasts ............................... 17
Table 8. Employment Forecasts .................................................................................................. 19
Table 9. Gross Domestic Product Forecasts (Billions of Fixed 2021 Dollar) ................................ 20
Table A1. Computation of the Jobs-to-Room Ratio by Sequence (1) – (5) ................................ 25
Table B1. Expected Hotel/Motel Room Construction from 2021 and 2025 ............................... 27
Table C1. Out-of-the-Box Clark County Population and Population Growth Forecasts
from REMI Models LHY2018 and LHY2017 .................................................................... 28
Table C2. Detailed Final Clark County Population Forecast: 2010-2060 ..................................... 29
Table C3. Economic Forecast ....................................................................................................... 30
Table C4. Employment (in thousands) ........................................................................................ 31
Table C5. Gross Domestic Product (billions of fixed 2021 $) ...................................................... 33
Table C6. Income (billions of fixed 2021 $) ................................................................................. 35
Table C7. Population and Labor Force (in thousands) ................................................................ 37
Table C8. Demographics (in thousands) ...................................................................................... 38

2021 Clark County Population Forecasts
vi cber.unlv.edu
LIST OF FIGURES
Figure 1. Clark County Population Forecasts: REMI Out-of-the-Box
LHY2018 and LHY2017: 2021-2060 ................................................................................. 4
Figure 2. Clark County Population-Growth-Rate Forecasts: REMI Out-of-the-Box
LHY2018 and LHY2017: 2021-2060 ................................................................................. 5
Figure 3. Clark County Net Migrant and Net Economic Migrant Forecasts:
REMI Out-of-the-Box LHY2018 and LHY2017: 2021-2060 ............................................... 5
Figure 4. Clark County Net International Migrant Forecasts: REMI Out-of-the-Box
LHY2018 and LHY2017: 2021-2060 ................................................................................. 6
Figure 5. U.S. real GDP Forecasts: RSQE vs. REMI Out-of-the-Box from 2020 to 2022 ................ 8
Figure 6. The Estimated Federal Funding Allocation for the Regional Transportation
Plan for Southern Nevada 2021-2050 ........................................................................... 16
Figure 7. Share of Clark County International Migration, Total Births, and Total Deaths .......... 18
Figure 8. Clark County Historical Population-Growth-Rate Forecasts: 2021-2035 ..................... 21
Figure B1. Expected Hotel/Motel Room Construction by Area from 2021 and 2025 ................. 27

2021 Clark County Population Forecasts
vii cber.unlv.edu
Acknowledgements
CBER thanks the members of the Population Forecasting Group for comments on earlier versions of this
report.

2021 Clark County Population Forecasts
1 cber.unlv.edu
I. Introduction
Each year, the Regional Transportation Commission (RTC), the Southern Nevada Regional Planning
Coalition (SNRPC), the Southern Nevada Water Authority (SNWA), a group of community demographers
and analysts, and the Center for Business and Economic Research (CBER) at the University of Nevada, Las
Vegas work together to provide a long-term forecast of economic and demographic variables influencing
Clark County. The primary goal is to develop a long-term forecast of the Clark County population and its
growth that is consistent with the structural economic characteristics of the county. Toward this end, we
employ a general-equilibrium demographic and economic model developed by Regional Economic
Models, Inc. (REMI), specifically for Clark County.
The REMI model is a state-of-the-art econometric forecasting model that accounts for dynamic
feedback between economic and demographic variables. Special features allow the user to update the
model to include the most current economic information. CBER recalibrates the model using information
on recent local employment levels, the most recent national Gross Domestic Product (GDP) forecast, and
spending on local capital projects.
The model employed divides Nevada into five regions: Clark County; Nye County; Lincoln County;
Washoe County; and the remaining counties, which are combined to form a fifth region. These regions
are modeled using the U.S. economy as a backdrop. The model contains over 100 economic and
demographic relationships that are carefully constructed to represent concisely the Clark County
economy. The model includes equations to account for migration and trade between Nevada counties
and other states and counties in the country.
The demographic and economic data used to construct the model begin in 2001 and end in 2018.
The most important variables include the aggregate totals of employment, the labor force, and
population. The economic data for the most recent version of the model (REMI PI+ v2.4) are consistent
with the North American Industry Classification System (NAICS). The REMI PI+ v2.4 model was released in
2020. Hence, the model’s most recent data are from 2018, since the Bureau of Economic Analysis (BEA)
personal-income data only become available with a two-year lag. The availability of the most recent
income data sets the last year of history with each release of an updated model.
The REMI model is the best model available for describing how economies interact
geographically.2 These interactions may take place within a single economy (such as the interaction
2 See Schwer, R. K. and D. Rickman (1995), “A comparison of the multipliers of IMPLAN, REMI and RIMS II: Benchmarking ready-made models for comparison,” The Annals of Regional Science, 29(4), 363-374.

2021 Clark County Population Forecasts
2 cber.unlv.edu
between house-price growth and employment growth in Clark County) or between two economies (such
as the interaction between Southern Nevada and Southern California through migration flows). These and
over 100 other interactions contained within the model are too complex to consider modeling on our
own. Rather, we turn to the REMI model because it has a solid foundation in economic theory and the
principles of general-equilibrium-based growth and distribution theory, yet it still offers the flexibility
required to model a regional economy like Clark County.
To guarantee that the model incorporates the most recent data, we make a series of adjustments
to the model. In this way, we ensure that the forecast model includes the best available information when
making the final forecast. First, we update the model’s national GDP forecast using the latest available
national economic forecast from REMI, which contains the most recent national forecasts from the
University of Michigan’s Research Seminar in Quantitative Economics (RSQE) as well as the Congressional
Budget Office (CBO)’s Economic Outlook. Second, we rebase the population forecast to the most recent
population estimate for Clark County available from SNRPC. Third, we update the model with current
employment data from the Bureau of Economic Analysis (BEA) and the Nevada Department of
Employment, Training and Rehabilitation (DETR). Fourth, we adjust future hotel employment based on
the expected number of hotel rooms that will be added in the near future. Lastly, we include planned new
investment in public infrastructure in the model using information from the RTC.
This report proceeds as follows. Section II examines the changes in the REMI model from the prior
year’s model. Section III presents sequentially the changes made to update the model and tailor it to local
information. Section IV reports the population forecast and gives a brief discussion of the economic
environment surrounding the forecast. Section V compares the population growth rate forecast with the
previous years’ forecast. Section VI discusses the risks to the forecast. Finally, section VII concludes.
II. Comparison of REMI Models: Current and Previous Year
Based on our past practice, we begin by comparing the most recent REMI out-of-the-box benchmark
forecast prior to any model adjustments with the corresponding out-of-the-box forecasts from the REMI
models used in prior reports. This gives us the opportunity to examine how the new model differs from
previous versions and to explore the basis of these differences.
The most recent data used to develop this year’s model end with data from 2018. Thus, we refer
to the current model by its last historical year 2018 (LHY2018) and the previous model by its last historical
year 2017 (LHY2017).

2021 Clark County Population Forecasts
3 cber.unlv.edu
Each year, the REMI staff and users discuss how the model works and propose adjustments and
changes for improvement. The newest REMI model, PI+ v2.4 offers one major improvement: it includes a
recent BLS employment projection from 2018 to 20283 as well as BEA GDP data by county and major
industry. In addition, the new REMI model contains the most recent data history for 2018 and a revision
of historical data back to 2001.
REMI uses the BLS employment projections, which provide insight to guide its employment and
labor force growth rates in the future. BLS insists that the U.S. will exhibit slower growth in the labor force
for the period from 2018 to 2028 because of an aging population and slower population growth; thus,
they expect fewer people in the labor force than previous estimates. In addition, BLS projects that the
health care sector and related industries and occupations will experience high demand due to an aging
population. That is, more than 40 percent of the jobs added from 2018 to 2028 will come from the
healthcare and social assistance sector. As a result, the employment to population ratio and the
employment in the health care sector for both the United States and Clark County are revised upward.
The new REMI model also contains BEA GDP data by county and major industry, since the BEA
now provides GDP statistics by county for a more detailed list of industries from 2001 to 2018,4 which
extended the previous data source that REMI used. Prior to this change, REMI constructed county-level
data for a more detailed list of industries based on available state and national data. As the Las Vegas
economy proves more unique compared to other regions in other states and in Nevada, more detailed
and accurate estimates seem partly to cause the upward revisions in historical average compensation
rates for the leisure and hospitality, utility, management of companies and enterprises sectors, and so on.
This aligns with the explanation from BEA that GDP by county statistics along with BEA’s county estimates
of personal income offer a more complete picture of local area economic conditions. Average
compensation rates provide one of the important factors for economic migration, which largely
contributes to local population growth. These updates lead to differences in the out-of-the-box
population forecasts between the LHY2018 and LHY2017 models.
Figures 1 and 2 compare the LHY2018 and LHY2017 population forecasts from the out-of-the-box
models (i.e., before any updating for employment, infrastructure projects, the national GDP forecast,
etc.).5 The out-of-the-box population forecast arising from the LHY2018 model predicts higher population
3 https://www.bls.gov/opub/mlr/2019/article/projections-overview-and-highlights-2018-28.htm 4 https://www.bea.gov/news/2019/local-area-gross-domestic-product-2018. 5 The detailed out-of-the-box results through 2060 appear in Table C1 of the Appendix C.

2021 Clark County Population Forecasts
4 cber.unlv.edu
levels than the LHY2017 model through 2060, except for the period from 2021 to 2024. Regarding
population levels, the out-of-the-box model forecasts population in the LHY2018 model for 2021 is
approximately 17,300 lower than the LHY2017 model. This gap, however, diminishes over the period
between 2021 to 2024, and the out-of-the box forecasted population in LHY2018 overtakes the forecast
from LHY2017 in 2025. The forecasts from the LHY2018 model show a higher level thereafter, and the
out-of-the-box model forecasts population in the LHY2018 model to exceed the LHY2017 model by 50,600
in 2060.
The forecasted population growth rates for the LHY2018 and LHY2017 models generally decline
over the entire forecast horizon through 2060 (Figure 2). The LHY2018 model forecasts a growth rate of
population that exceeds the growth rate of the LHY2017 model until 2045. The LHY2018 forecasted
growth rate of population, however, falls below the growth rate of LHY2017 starting in 2046. These lower
growth rates from the LHY2018 model from 2046 mainly reflect lower net migrants for the LHY2018 model
compared to the LHY2017 model from 2049 due to significant lower international immigration forecasts
for the FHY2018 model (Figure 3) as well as lower birth rate forecasts for the LHY2018 model compared
to the LHY2017 model for the entire forecast horizon.
Figure 1. Clark County Population Forecasts: REMI Out-of-the-Box LHY2018 and LHY2017: 2021-2060
Note: Out-of-the-box refers to the model prior to recalibration. These numbers are not the final forecast.

2021 Clark County Population Forecasts
5 cber.unlv.edu
Figure 2. Clark County Population-Growth-Rate Forecasts: REMI Out-of-the-Box LHY2018 and LHY2017: 2021-2060
Note: Out-of-the-box refers to the model prior to recalibration. These numbers are not the final forecast.
Figure 3. Clark County Net Migrant and Net Economic Migrant Forecasts: REMI Out-of-the-Box LHY2018 and LHY2017: 2021-2060
Note: Out-of-the-box refers to the model prior to recalibration. These numbers are not the final forecast.

2021 Clark County Population Forecasts
6 cber.unlv.edu
The lower number of net migrants6 mainly reflects the reduced projections in net international
migration for the LHY2018 relative to the LHY2017 models. Figure 4 shows that net international
migration projections for LHY 2018 are much lower than those from LHY2017 by approximately 3,000 to
4,000 for each forecasted year. Higher projections of economic migration in the LHY2017 model lead to
gains in net migration projections for the LHY2018 model compared to the LHY2017 model until 2048, as
the losses from net international migration only partly offset the gains. Reduced international migration
projections in the LHY2018 model, however, totally offset the gains from economic migration and produce
a lower level of net migration in the LHY2018 model after 2049.
Figure 4. Clark County Net International Migrant Forecasts: REMI Out-of-the-Box LHY2018 and LHY2017:
2021-2060
Note: Out-of-the-box refers to the model prior to recalibration. These numbers are not the final forecast.
Clark County’s net international migration projections in the LHY2018 model show much lower
levels compared to the LHY2017 model. This reflected the downward-revised international migration
6 The REMI model defines four components of net migration: economic, retired, special, and international migration. Economic migrants are those who are under the age of 65 and emigrate from other regions to improve their living standards and to seek better job opportunities. Retired migrants are those who are aged 65 and older and move from one region to another and do not respond to economic conditions. The REMI model explains that economic migrants are the difference between the net domestic migrants and the net retired migrants. Special migrants are prisoners, college students, and military personnel and their dependents. Finally, net international migration is defined as migrants who move from outside and into the 50 states and the District of Columbia, which includes migrants relocated from Puerto Rico and U.S. territories, Armed Forces, permanent and temporary migrants such as students, refugees, and illegal migrants.

2021 Clark County Population Forecasts
7 cber.unlv.edu
estimates for Clark County by the Census, as REMI uses Census estimates for international migration
estimates. Therefore, the average international immigrant from 2011 to 2017 revised down to
approximately 3,600 persons for the LHY2018 model, which is about the half of 6,500 persons from the
LHY2017 model. As a result, net international migration projections for the LHY2018 model were revised
down significantly compared to the LHY2017 model. That is, on average, Clark County expects to gain
approximately 3,400 net international migrants per year from 2021 to 2060 with the LHY2018 model,
which is 53.1 percent lower than the average projection of 7,300 per year by the LHY2017 model.
Table 2. Clark County REMI Out-of-the-Box Forecast Comparison: LHY2018 and LHY2017
2021 2060
LHY2018 LHY2017 Change to forecast
LHY2018 LHY2017 Change to forecast
Population (Thousands) 2,363.10 2,380.43 -0.7% 3,111.83 3,061.23 1.7% Total Employment (Thousands) 1,400.28 1,379.39 1.5% 1,660.60 1,598.51 3.9% Total Employment as % of Nation 0.69 0.68 1.2% 0.72 0.68 3.2% Gross Domestic Product (Billions of Fixed 2012 Dollars) 117.62 117.49 0.1% 233.42 231.91 0.7% Gross Regional Product as % of Nation 0.60 0.60 0.8% 0.61 0.60 1.2% Migrants (Thousands) Economic Migrants 25.93 16.44 57.7% 1.34 -2.26 159.5% Retired Migrants 5.68 5.71 -0.5% 8.67 8.78 -1.3% International Migrants 3.55 7.56 -53.1% 3.33 7.09 -53.1% Population by Age (Thousands)
Ages 0-14 447.85 451.19 -0.7% 471.39 472.33 -0.2% Ages 15-24 288.19 295.11 -2.3% 334.21 331.54 0.8% Ages 25-64 1,249.30 1,252.67 -0.3% 1,467.37 1,440.78 1.8% Ages 64+ 377.77 381.45 -1.0% 838.87 816.59 2.7%
Note: The numbers for both LHY 2018 and LHY 2017 models refer to the models prior to adjustments.
Table 2 compares the REMI out-of-the-box economic and demographic forecasts between the
LHY2018 and LHY2017 models for the period between 2021 and 2060. The LHY2018 out-of-the-box model
predicts a stronger Clark County economy in 2060, compared to the LHY2017 out-of-the-box model in
terms of total population, employment, and real GDP. Moreover, the LHY2018 out-of-the box model
projects a larger Clark County economy as a percentage of the nation in 2060 compared to the out-of-the-
box LHY2017 model. Net economic migration for the LHY2018 model in 2060 is higher than the level from
the LHY2017 model, which suggests Clark County economy attracts those of working age compared to the
average of the U.S. economy for the entire forecast horizon. Higher levels of the net economic migration
projections for the LHY2018 model contribute to a larger projected population between ages 15 and 65
compared to the LHY2017 model, which is a positive asset for Clark County in that they not only contribute
to the local human capital resources but also boost the development of local businesses.

2021 Clark County Population Forecasts
8 cber.unlv.edu
III. Recalibrating the Model
As noted previously, county-level personal income data only become available with a two-year lag. As a
result, the REMI model also imposes a two-year lag on all its data history that ends with 2018 data for the
current model, PI+ v2.4, released in 2020. To update the model, we incorporate available, pertinent model
information, including the most recent national GDP forecast, most recent employment figures and
forecasts, and spending on public and private capital projects to reflect local information in the forecast.
We describe each update in sequence.
A. Adjustment of the national economic forecast
As the U.S. economy faced an unprecedented event with the COVID-19 pandemic, REMI started to release
quarterly economic forecast updates to ensure that the REMI model remains up to date with the most
recent available data. We, therefore, update our current REMI model, PI+ v2.4 with REMI’s March
Economic Forecast Update. REMI’s March economic forecast update was released in March 2021 and
includes several available data series. First, the update includes the 2019-2020 historical national data
from BEA released on January 28, 2021. Second, the update contains the most recent national GDP
forecast from RSQE for the near term, published on February 19, 2021. Finally, the update incorporates
the CBO’s Budget and Economic Outlook from 2021 to 2031, which was released in January and February
2021.
Figure 5. U.S. real GDP Forecasts: RSQE vs. REMI Out-of-the-Box from 2020 to 2022
Note: REMI out-of-the-box growth rates from 2020 to 2022 reflect the RSQE’s March 2020 prolonged fallout forecasts. For BEA & RSQE, the growth rate for 2020 is based on the BEA estimate, but the growth rates for 2021 and 2022 show the projections by RSQE.
-3.5
%
4.8
%
3.9
%
-1.6
%
3.2
%
2.1
%
2 0 2 0 2 0 2 1 2 0 2 2
BEA & RSQE Out-of-the-box

2021 Clark County Population Forecasts
9 cber.unlv.edu
In 2020, national real GDP plummeted by 3.5 percent, a significantly larger drop than the 1.6
percent decline expected by RSQE (Figure 5). The out-of-the-box GDP forecasts are based on RSQE’s
forecasts from March 2020, which were released just after the COVID-19 outbreak. As the COVID-19
recession was deeper than expected the GDP forecasts for 2021 and 2022 are revised upward to 4.8 and
3.9 percent, respectively, from 3.2 and 2.1 percent. This proves the need of updates for the REMI model
due to the rapidly changing economic conditions caused by COVID-19 and, therefore, we incorporate the
March Economic Forecast Update from REMI into the model.
B. Rebasing the population forecast
We rebase the population forecast using the population update feature in the REMI model. We update
the population in 2020 based on the most recent SNRPC Clark County population estimates, that is 2.38
million, a strong 2.2 percent increase from 2019 despite the COVID-19 outbreak. In addition, we update
the population levels in 2021 and 2022 to reflect the population growth-rate forecast from CBER’s 2021
Economic Outlook, which was published in December 2020. The latter adjustment incorporates the views
of local economic experts at CBER for the short-term population forecasts. CBER projects that the Clark
County population will grow by 1.7 and 2.2 percent, respectively, in 2021 and 2022. We use these
forecasted population levels to update the population data in the REMI model, and then use the baseline
forecast for the subsequent adjustments.
C. Employment adjustment
The county-level employment data in REMI come from the BEA’s local area personal income data, which
are only provided for 23 sectors. Even though BEA reports the county-level employment data for 23
sectors, BEA supplies the county-level wage data for 70 sectors. This means that REMI calculates
employment for 70 sectors by incorporating the county-level wage data. Although the most recent
historical year in the model’s employment data is 2018, BEA employment data are available for 2019.
REMI forecasted that Clark County employment would increase by 2.1 percent in 2019, while the BEA
estimated that employment climbed strongly by 3.2 percent from 2018 to 2019. In addition, the
employment for the 23 sectors was revised, which resulted in an upward revision of total employment for
2018. That is, REMI indicates that the employment equals 1,351 thousand in 2018, which revises up to
1,355 thousand according to BEA. Therefore, we update the model’s employment data with the most
recent BEA estimates for the 23 sectors in 2019.

2021 Clark County Population Forecasts
10 cber.unlv.edu
Table 3. Clark County Employment Levels (in 000s) before and after BEA Adjustment for 2019
INDUSTRIAL CLASSIFICATION REMI BASELINE FORECASTS BEA ESTIMATES
History 2018 2019 2018 2019
Natural Resources 3.0 3.0 2.3 2.2
Construction 76.3 76.6 77.1 83.6
Manufacturing 28.6 29.1 28.5 29.6
Retail and Wholesale 160.8 164.7 162.4 164.1
Transportation and Public Utilities 92.3 94.6 83.6 91.6
Finance, Insurance & Real Estate 144.4 145.8 147.5 152.8
Services 727.6 742.8 733.3 751.7
Government 117.2 119.3 119.7 121.8
Farm 0.4 0.4 0.4 0.4
Total 1350.6 1376.4 1354.8 1397.9 Note: BEA estimates are also adjusted employment. BEA revised its estimates for 2018. The difference between REMI’s history data and BEA estimates is due to BEA’s revisions.
Table 3 shows adjusted employment levels for 2019 after updating BEA estimates. REMI under-
forecasted the Clark County employment for 2019 by 1.6 percent or 21,500 jobs. In addition, BEA revised
the Clark County employment estimate for 2018, which suggests that the Southern Nevada economy
experienced a strong employment gain of 4.0 percent instead of 3.4 percent7. Most sectors of Southern
Nevada’s economy experienced positive job growth in 2019. Strong employment gains occurred in key
sectors such as construction, manufacturing, wholesale trade, transportation and warehousing, finance
and insurance, administrative and support, and waste management, education, health care and social
assistance, gaming, and professional and technical services. Overall, Southern Nevada’s economy gained
roughly 43,000 jobs in 2019. We also update the model’s employment data for 2020 as most wage and
salary employment data are available from the Nevada DETR for 2020. We, therefore, update the model
to account for the most recent information.
The latest growth rates for the REMI model forecasts as well as recent DETR estimates appear in
Table 4. The actual growth rates from DETR differ from the REMI forecasts, suggesting a need for
adjustment. That is, the growth rate estimates by DETR of total employment are modestly below the REMI
forecasts by 0.82 percent in 2020 despite the fact that the REMI forecasts shown in Table 4 also includes
the REMI March Economic Forecasts. The employment update proceeds as follows: First, we substitute
BEA employment by 23 sectors into the REMI model and get the 70-sector estimation from the REMI
model for 2019. Second, we compute the annual percentage change using DETR data and apply them to
produce new estimates for 2020. This procedure implicitly assumes that the proportion of self-employed
7 According to REMI’s historical data, Clark County employment increased by 3.4 percent in 2018.

2021 Clark County Population Forecasts
11 cber.unlv.edu
in each industry classification grows at the same rate as does the ratio between full- and part-time
workers.
Table 4. Employment Growth Rates for Clark County before DETR Adjustment for 2020
INDUSTRIAL CLASSIDICATION REMI FORECASTS* DETR ESTIMATES
Construction -5.64% -3.29% Wholesale Trade -6.78% -6.50% Retail Trade -1.05% -5.93% Transit, Ground Passenger Transportation -25.12% -39.39% Monetary Authorities, Et Al. -5.70% 3.68% Ins Carriers, Related Activities -5.49% 1.65% Real Estate -2.84% -11.06% Professional, Technical Services -6.51% -2.42% Management of Companies -7.58% -14.29% Administrative, Support Services -9.71% -15.93% Ambulatory Health Care Services -7.47% -1.37% Hospitals -10.37% -0.43% Amusement, Gambling, And Recreation -36.80% -24.10% Accommodation -29.62% -35.29% Food Services, Drinking Places -16.31% -21.23% State & Local Government -4.26% -3.98% Total -11.84% -12.66%
*The 2020 REMI forecasts are updated with the REMI March Economic Forecasts.
Note: The total growth rates for DETR estimates are calculated after adjusting the employment forecasts with the DETR data for available sectors. Therefore, they do not represent actual DETR’s growth rate estimates.
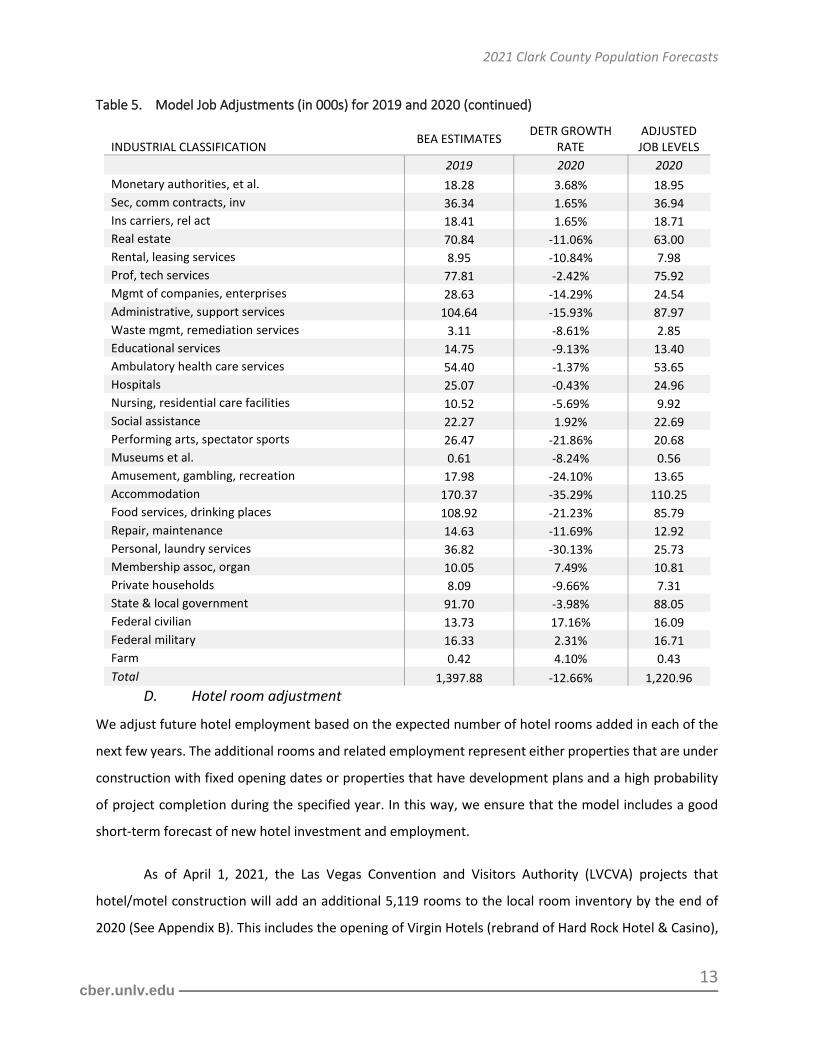
Table 5 reports the updated employment data by category for the model. The Clark County job
growth numbers in 2020 shows that local economic conditions suffered severely from the COVID-19
recession as the Las Vegas economy largely depends on tourism. Even though almost all sectors
experienced losses, the largest sectoral decreases in employment occurred in key sectors such as transit
and ground passenger transportation, accommodation, gaming, and food services as the COVID-19
pandemic harshly hit sectors which require face-to-face contact. As a result, Southern Nevada’s economy
lost roughly 177,000 jobs in 2020.

2021 Clark County Population Forecasts
12 cber.unlv.edu
Table 5. Model Job Adjustments (in 000s) for 2019 and 2020
INDUSTRIAL CLASSIFICATION BEA ESTIMATES
DETR GROWTH RATE
ADJUSTED JOB LEVELS
2019 2020 2020
Forestry et al. 0.36 -11.63% 0.32
Support act for agriculture and forestry 0.09 -2.33% 0.08
Oil, gas extraction 0.04 -11.43% 0.03
Mining (except oil, gas) 1.65 -11.55% 1.46
Support activities for mining 0.02 -23.81% 0.02
Utilities 2.79 -7.66% 2.58
Construction 83.63 -3.29% 80.87
Wood product manufacturing 0.59 -5.78% 0.55
Nonmetallic mineral prod manufacturing 2.59 -7.15% 2.40
Primary metal manufacturing 0.62 -12.40% 0.54
Fabricated metal prod manufacturing 2.63 -7.74% 2.43
Machinery manufacturing 0.70 -12.89% 0.61
Computer, electronic prod manufacturing 0.62 -1.13% 0.61
Electrical equip, appliance manufacturing 1.09 -6.58% 1.02
Motor vehicle manufacturing 0.36 -6.11% 0.34
Trans equip mfg exc motor vehicle 0.31 -7.21% 0.28
Furniture, related prod manufacturing 1.34 -1.12% 1.33
Miscellaneous manufacturing 6.38 0.11% 6.39
Food manufacturing 4.08 -1.67% 4.02
Beverage, tobacco prod manufacturing 0.63 1.12% 0.63
Textile mills; textile prod mills 0.48 -7.11% 0.44
Apparel manufacturing 0.49 -6.68% 0.46
Paper manufacturing 0.54 -8.57% 0.49
Printing, related supp act 2.98 -10.45% 2.67
Petroleum, coal prod manufacturing 0.05 -13.04% 0.04
Chemical manufacturing 1.28 -0.08% 1.28
Plastics, rubber prod manufacturing 1.89 -4.66% 1.80
Wholesale trade 29.89 -6.50% 27.95
Retail trade 134.23 -5.93% 126.28
Air transportation 8.63 -33.38% 5.75
Rail transportation 0.23 -7.79% 0.21
Water transportation 0.15 -41.38% 0.09
Truck transportation 6.70 -6.25% 6.29
Couriers and messengers 7.86 -6.16% 7.37
Transit, ground pass transportation 41.15 -39.39% 24.94
Pipeline transportation 0.04 -8.33% 0.03
Scenic, sightseeing transportation; supp 8.50 -15.84% 7.15
Warehousing, storage 15.59 -4.62% 14.87
Publishing, except internet 2.89 -3.60% 2.78
Motion picture, sound rec 3.96 -7.56% 3.66
Data processing, hosting, and rel services 3.72 -4.46% 3.56
Broadcasting, except int; 1.64 -8.88% 1.50
Telecommunications 4.39 0.00% 4.39
2021 Clark County Population Forecasts
13 cber.unlv.edu
Table 5. Model Job Adjustments (in 000s) for 2019 and 2020 (continued)
INDUSTRIAL CLASSIFICATION BEA ESTIMATES
DETR GROWTH RATE
ADJUSTED JOB LEVELS
2019 2020 2020
Monetary authorities, et al. 18.28 3.68% 18.95
Sec, comm contracts, inv 36.34 1.65% 36.94
Ins carriers, rel act 18.41 1.65% 18.71
Real estate 70.84 -11.06% 63.00
Rental, leasing services 8.95 -10.84% 7.98
Prof, tech services 77.81 -2.42% 75.92
Mgmt of companies, enterprises 28.63 -14.29% 24.54
Administrative, support services 104.64 -15.93% 87.97
Waste mgmt, remediation services 3.11 -8.61% 2.85
Educational services 14.75 -9.13% 13.40
Ambulatory health care services 54.40 -1.37% 53.65
Hospitals 25.07 -0.43% 24.96
Nursing, residential care facilities 10.52 -5.69% 9.92
Social assistance 22.27 1.92% 22.69
Performing arts, spectator sports 26.47 -21.86% 20.68
Museums et al. 0.61 -8.24% 0.56
Amusement, gambling, recreation 17.98 -24.10% 13.65
Accommodation 170.37 -35.29% 110.25
Food services, drinking places 108.92 -21.23% 85.79
Repair, maintenance 14.63 -11.69% 12.92
Personal, laundry services 36.82 -30.13% 25.73
Membership assoc, organ 10.05 7.49% 10.81
Private households 8.09 -9.66% 7.31
State & local government 91.70 -3.98% 88.05
Federal civilian 13.73 17.16% 16.09
Federal military 16.33 2.31% 16.71
Farm 0.42 4.10% 0.43
Total 1,397.88 -12.66% 1,220.96
D. Hotel room adjustment
We adjust future hotel employment based on the expected number of hotel rooms added in each of the
next few years. The additional rooms and related employment represent either properties that are under
construction with fixed opening dates or properties that have development plans and a high probability
of project completion during the specified year. In this way, we ensure that the model includes a good
short-term forecast of new hotel investment and employment.
As of April 1, 2021, the Las Vegas Convention and Visitors Authority (LVCVA) projects that
hotel/motel construction will add an additional 5,119 rooms to the local room inventory by the end of
2020 (See Appendix B). This includes the opening of Virgin Hotels (rebrand of Hard Rock Hotel & Casino),

2021 Clark County Population Forecasts
14 cber.unlv.edu
Resorts World, Hotel Cloé, and Skyline Hotel & Casino. In 2022, the LVCVA projects an additional 1,151
hotel/motel rooms will add to the room inventory. This includes the opening of Delta Hotels by Marriott,
TownePlace Suites, Springhill by Marriott Airport, and Astral Las Vegas. In 2023, the LVCVA expects to see
an additional 4,810 rooms added to the room stock by the Drew Las Vegas, Element Las Vegas Airport,
SpringHill Suites Marriott, Element Las Vegas, Aloft Hotel, and two properties for AC Hotel by Marriot.
Finally, the LVCVA expects to see an additional 720 rooms added to inventory in 2024 by Majestic Las
Vegas, and an additional 700 hotel/motel rooms added to inventory in 2025 by Mardi Gras Hotel and
Casino. Overall, Las Vegas is expected to see an additional 12,500 hotel/motel rooms added to inventory
by the end of 2025, which is a strong 8.6 percent increase compared to the current available room
inventory8 despite the severe COVID-19 recession in the tourism sector.
Table 6. Expected Additional Employment due to New Rooms: Projections for 2021-2025
Year LVCVA Projections REMI New
Jobs Needed
Cumulative Additional REMI New
Jobs
2021 5119 7679 7679
2022 1151 1727 9405
2023 4810 7215 16620
2024 720 1080 17700
2025 700 1050 18750 Note: REMI New Jobs Needed are calculated by using a jobs-to-room multiplier of 1.5. We calibrated cumulative additional REMI new jobs in the REMI model.
The model adjustment for new hotel construction uses a jobs-to-room ratio of 1.5, which we
calculated as follows.9 First, we expect new hotel rooms to create new jobs in hotel services. Using
historical information from 2010-2019, we take the historical average ratio of annual accommodation
employment from the Bureau of Labor Statistics (BLS) divided by the total number of hotel rooms. From
this calculation, we generate a jobs-to-room multiplier of roughly 1.1 for hotel services. New hotel rooms
will also generate secondary economic activity and, hence, additional jobs in other sectors. For example,
increased tourism activity from new hotel rooms will also increase the demand for food services and other
tourism-related industries. We account for these new jobs as follows. We use each industry’s location
quotient10 to estimate the portion of the industry’s employment attributable to tourism activity. We,
8 As of February 2021, Las Vegas had 145,308 available rooms in inventory according to the LVCVA. 9 The detailed computation of the jobs-to-room ratio appears in Appendix A. 10 The Location Quotient (LQ) compares Clark County’s employment in a given industry sector to that of the nation. An LQ greater than 1 indicates that the area has proportionately more workers than the nation employed in that specific industry sector. This

2021 Clark County Population Forecasts
15 cber.unlv.edu
then, take the historical average ratio of the annual employment in each of these sectors, which is
attributable to tourism activity, divided by the total hotel rooms. The sum of the ratios for the food
services and other tourism-related industries is approximately 0.4. This, together with the jobs-to-room
multiplier of 1.1 for hotel services, produces the overall jobs-to-room ratio of 1.5. We, then, use the jobs-
to-room multiplier as the multiplicand times the number of additional rooms, producing a cumulative
increase of about 19,000 jobs by 2025 (Table 6).
This method differs from our prior reports before 2020 in that the previous method only included
the number of additional jobs over and above the rooms and jobs already accounted for in the model.
Previously, we assumed that the existing number of rooms will be managed by the same number of hotel
jobs for the projected period by the LVCVA. That is, an increase or decrease in REMI jobs must first be
completely offset, and only then we do calibrate projected additional jobs into the REMI model. This
method works if the tourism sector remained unchanged in terms of its productivity and environment.
Due to the economic downturn caused by the COVID-19 pandemic, however, we lost a significant number
of hospitality jobs, and the recovery in the tourism sector lags far behind compared to other sectors as it
is directly affected by business restrictions related to COVID-19. Clark County, however, recently showed
early signs of an uplift in the local tourism sector. This means that an increase in REMI jobs is more likely
due to the recovery of the tourism sector. Therefore, completely offsetting an increase in the REMI jobs
with expected additional jobs due to the new hotel rooms will likely cause a distorted result. We,
therefore, decided to once again this year use the same method we used in the 2020 CBER Population
Forecast.
E. Transportation and infrastructure improvements
Clark County continues to invest in transportation infrastructure such as roads, highways, and mass
transit. The REMI model assumes that public-infrastructure investment will follow a path consistent with
the model history. Thus, some local spending on public infrastructure, such as road building and additional
services, is built into the model. One-time monies, however, tend to come from outside the region (e.g.,
federal transportation funding). We adjust the model to incorporate these large transportation projects
in the forecast.
implies that the area is producing more than is consumed by its residents. Hence, the portion of the LQ that is above 1 represents the proportion of the industry’s employment attributable to tourism activity.

2021 Clark County Population Forecasts
16 cber.unlv.edu
The estimated federal funding in transportation-infrastructure investment is about $4.6 billion
between 2021 and 2050 (Figure 6). We annualize expected transportation-infrastructure expenditures
from RTC of Southern Nevada and include them in the REMI model as new construction projects. In
addition, we assume that federal funding in transportation-infrastructure investment after 2050 will
continue with a reasonable expectation that the federal funding will not fall to zero. Rather, we apply the
flat amount of federal funding after 2050, where the REMI model adjusts this amount for inflation.
Figure 6. The Estimated Federal Funding Allocation for the Regional Transportation Plan for Southern Nevada 2021-2050
Note: The amount shown above only includes federal funding and is displayed in millions. Source: The Regional Transportation Commission (RTC) of Southern Nevada
IV. Analysis of the Economic and Demographic Forecast
The forecast predicts significant rates of population growth for Southern Nevada in the near term and
then moderating rates of growth over the forecast period extending out to 2060. The rate of growth,
which decidedly exceeded the national average over the past 50 years, moderates and eventually moves
below the national rate of growth as the Southern Nevada economy matures and the Clark County
population ages compared to the United States with a smaller share of international migration over the
forecasting horizon. The economic forecast calls for the continuation of the economic expansion over the
forecast horizon. Tables 7, 8, and 9, respectively, report the final population, employment, and real GDP
predictions for Clark County from the calibrated model.

2021 Clark County Population Forecasts
17 cber.unlv.edu
A. Population
In the short term, the current forecast predicts strong rates of population growth in Southern Nevada.
The population in Clark County is predicted to grow at rates of 1.7 percent in 2021, 2.2 percent in 2022,
2.4 percent in 2023, and 2.3 percent in 2024 as the Clark County economy recovers from the COVID-19
recession (Table 7). The population growth rates in the medium term are expected to be robust but will
decline over time. By 2050, the population growth rate falls to 0.37 percent, slightly below the projected11
national population growth rate of 0.39 percent. The population growth rate falls further to 0.2 percent
by 2060, which is slightly lower than the projected national population growth of 0.4 percent in 2060.
Table 7. Population History, REMI Forecasts, and Final Rebased Forecasts
YEAR REMI FORECAST* REBASED
FORECAST CHANGE IN POPULATION
REBASED FORECAST GROWTH IN POPULATION
REBASED FORECAST
2020 2,319,000 2,376,683** 50,885 2.2%
2021 2,363,000 2,417,000 40,317 1.7%
2022 2,406,000 2,470,000 53,000 2.2%
2023 2,447,000 2,529,000 59,000 2.4%
2024 2,486,000 2,587,000 58,000 2.3%
2025 2,523,000 2,640,000 53,000 2.0%
2026 2,559,000 2,691,000 51,000 1.9%
2027 2,594,000 2,738,000 47,000 1.7%
2028 2,626,000 2,782,000 44,000 1.6%
2029 2,656,000 2,822,000 40,000 1.4%
2030 2,686,000 2,859,000 37,000 1.3%
2031 2,714,000 2,894,000 35,000 1.2%
2032 2,740,000 2,928,000 34,000 1.2%
2033 2,766,000 2,959,000 31,000 1.1%
2034 2,790,000 2,989,000 30,000 1.0%
2035 2,813,000 3,018,000 29,000 1.0%
2040 2,911,000 3,138,000 21,000 0.7%
2045 2,983,000 3,228,000 16,000 0.5%
2050 3,038,000 3,296,000 12,000 0.4%
2055 3,081,000 3,345,000 9,000 0.3%
2060 3,112,000 3,383,000 6,000 0.2%
* This forecast refers to the model prior to recalibration. ** Southern Nevada consensus population estimate. Note: A table detailing the rebased population forecast appears in the Appendix C–Table C2.
11 https://www.census.gov/data/tables/2017/demo/popproj/2017-summary-tables.html.

2021 Clark County Population Forecasts
18 cber.unlv.edu
To understand why the projected national population growth rate surpasses the Clark County
growth rate, we examine what the REMI model predicts regarding Clark County population components
for the forecasting horizon compared to those of the United States. As shown in Figure 7, the model
predicts a marginally decreasing proportion of international migrants for Clark County compared to the
United States. That is, the proportion of international migrants for Clark County compared to the United
States will be 0.32 percent in 2022 but gradually decrease to 0.30 percent in 2060. Although the share of
Clark County total births increases in the medium term thanks to over 10,000 net economic migrants per
year until 2039, it decreases after 2042 with declining net economic migration. Moreover, the share of
Clark County total deaths increases over the forecasting horizon. This indicates that Clark County
population will age compared to the national average. We also stress that the forecasted growth rates
experience increasing uncertainty as the projection extends further into the future that may ultimately
lead to higher or lower forecasts with extremely high uncertainty of the current economic situation due
to COVID-19. We discuss the potential sources for these uncertainties in section VI, which addresses the
risks to the forecast.
Figure 7. Share of Clark County International Migration, Total Births, and Total Deaths
Note: Forecasts refer to the model after recalibration.
We forecast that Clark County will add roughly 40,300 new residents in 2021. The forecast then
predicts that population growth will be stronger in the near term as the local economy recovers from the
COVID-19 pandemic. Population growth, however, will slow in the future as the population ages and the
local economy becomes less competitive in drawing more economic and international migrants when
0.2%
0.3%
0.4%
0.5%
0.6%
0.7%
0.8%
0.9%
1.0%
1.1%
20
22
20
24
20
26
20
28
20
30
20
32
20
34
20
36
20
38
20
40
20
42
20
44
20
46
20
48
20
50
20
52
20
54
20
56
20
58
20
60
PR
OP
OR
TIO
N C
OM
PA
RED
TO
TH
E U
.S.
International Migration Total Deaths Total Births

2021 Clark County Population Forecasts
19 cber.unlv.edu
compared to the average for the United States as a whole. The population forecast predicts that the Clark
County population will increase to roughly 3.38 million by 2060.
B. Employment
The forecast predicts a robust economic recovery for Southern Nevada in 2021. We forecast that the Las
Vegas economy will experience a gain of 70,000 jobs or 5.7 percent of total jobs in 2021, as the economic
recovery gains momentum with current vaccination efforts. See Table 8.12 We predict that the local
economic recovery will continue until 2024, by adding 33,000, 59,000 and 63,000 jobs in 2022, 2023, and
2024, respectively. The forecast predicts a full recovery of the local employment by 2024. The
employment growth rate then will gradually decrease over time and stabilize at around 0.1 percent as the
Southern Nevada economy matures.
Table 8. Employment Forecasts
YEAR EMPLOYMENT
FORECAST CHANGE IN EMPLOYMENT
FORECAST GROWTH IN
EMPLOYMENT FORECAST EMPLOYMENT-
POPULATION FORECAST
2020 1,221,000 -177,000 -12.7% 0.51
2021 1,291,000 70,000 5.7% 0.53
2022 1,324,000 33,000 2.6% 0.54
2023 1,383,000 59,000 4.5% 0.55
2024 1,446,000 63,000 4.6% 0.56
2025 1,472,000 26,000 1.8% 0.56
2026 1,493,000 21,000 1.4% 0.56
2027 1,507,000 14,000 0.9% 0.55
2028 1,516,000 9,000 0.6% 0.55
2029 1,522,000 6,000 0.4% 0.54
2030 1,527,000 5,000 0.3% 0.53
2031 1,535,000 8,000 0.5% 0.53
2032 1,543,000 8,000 0.5% 0.53
2033 1,551,000 8,000 0.5% 0.52
2034 1,559,000 8,000 0.5% 0.52
2035 1,567,000 8,000 0.5% 0.52
2040 1,600,000 6,000 0.4% 0.51
2045 1,634,000 7,000 0.4% 0.51
2050 1,672,000 6,000 0.4% 0.51
2055 1,701,000 5,000 0.3% 0.51
2060 1,718,000 2,000 0.1% 0.51
12 Unadjusted employment forecasts are shown in Appendix C.
2021 Clark County Population Forecasts
20 cber.unlv.edu
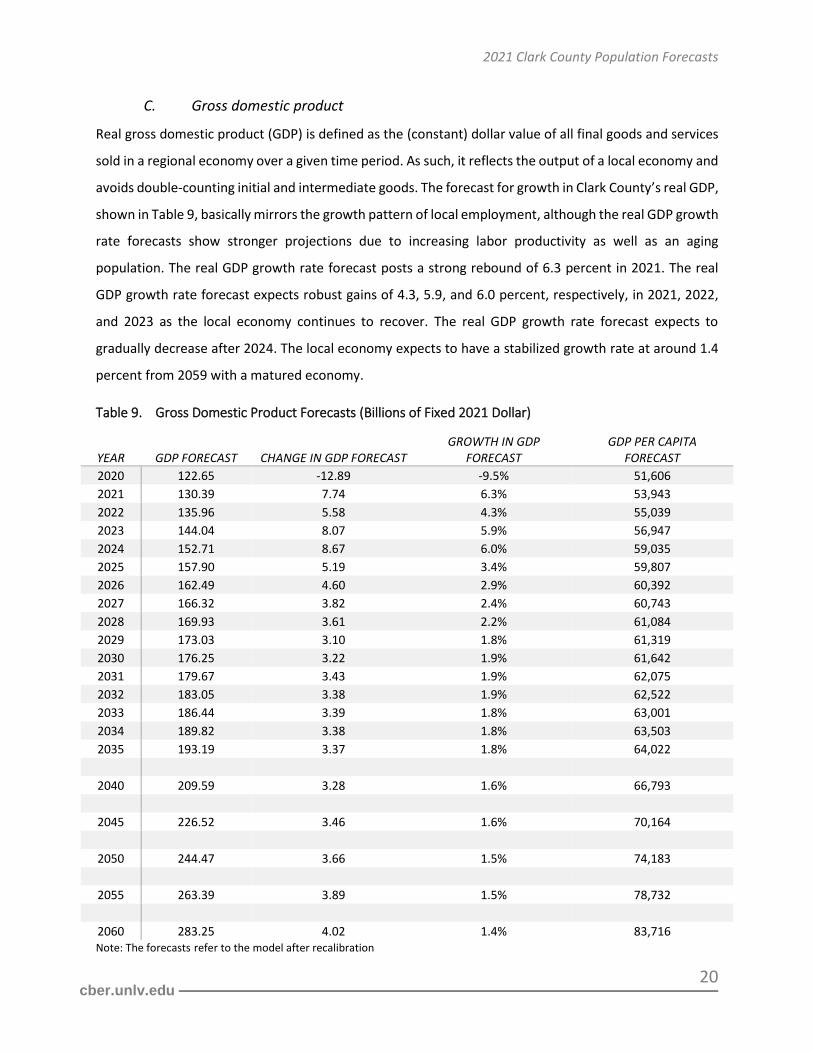
C. Gross domestic product
Real gross domestic product (GDP) is defined as the (constant) dollar value of all final goods and services
sold in a regional economy over a given time period. As such, it reflects the output of a local economy and
avoids double-counting initial and intermediate goods. The forecast for growth in Clark County’s real GDP,
shown in Table 9, basically mirrors the growth pattern of local employment, although the real GDP growth
rate forecasts show stronger projections due to increasing labor productivity as well as an aging
population. The real GDP growth rate forecast posts a strong rebound of 6.3 percent in 2021. The real
GDP growth rate forecast expects robust gains of 4.3, 5.9, and 6.0 percent, respectively, in 2021, 2022,
and 2023 as the local economy continues to recover. The real GDP growth rate forecast expects to
gradually decrease after 2024. The local economy expects to have a stabilized growth rate at around 1.4
percent from 2059 with a matured economy.
Table 9. Gross Domestic Product Forecasts (Billions of Fixed 2021 Dollar)
YEAR GDP FORECAST CHANGE IN GDP FORECAST GROWTH IN GDP
FORECAST GDP PER CAPITA
FORECAST
2020 122.65 -12.89 -9.5% 51,606
2021 130.39 7.74 6.3% 53,943
2022 135.96 5.58 4.3% 55,039
2023 144.04 8.07 5.9% 56,947
2024 152.71 8.67 6.0% 59,035
2025 157.90 5.19 3.4% 59,807
2026 162.49 4.60 2.9% 60,392
2027 166.32 3.82 2.4% 60,743
2028 169.93 3.61 2.2% 61,084
2029 173.03 3.10 1.8% 61,319
2030 176.25 3.22 1.9% 61,642
2031 179.67 3.43 1.9% 62,075
2032 183.05 3.38 1.9% 62,522
2033 186.44 3.39 1.8% 63,001
2034 189.82 3.38 1.8% 63,503
2035 193.19 3.37 1.8% 64,022
2040 209.59 3.28 1.6% 66,793
2045 226.52 3.46 1.6% 70,164
2050 244.47 3.66 1.5% 74,183
2055 263.39 3.89 1.5% 78,732
2060 283.25 4.02 1.4% 83,716 Note: The forecasts refer to the model after recalibration

2021 Clark County Population Forecasts
21 cber.unlv.edu
V. Comparing the Current Forecast with Forecasts of Previous Years
This section compares this year’s final population growth-rate forecast with the final population growth-
rate forecasts from previous years. This exercise assesses the consistency of the forecast methodology
and examines the variability in the population growth-rate forecasts over the last six years.
Figure 8. Clark County Historical Population-Growth-Rate Forecasts: 2021-2035
Figure 8 shows the population growth-rate forecasts generated from the 2016 to 2021 population
forecast analyses as well as the standard deviation of the population-growth-rate forecast in the last 21
years (2001-2021).13 The population growth-rate forecasts exhibit a similar level of variability from 2021
to 2035 as they remain around at 0.3 percent.. The standard deviation of the population growth-rate
forecast for the year 2021 is roughly 0.3 percent. The variability among the population growth-rate
forecasts remains around 0.3 percent in the long run. By 2030, the average of the forecasted growth rates
converges to about 1.1 percent. Our forecasts prove their consistency and primarily provide long-run
planning tools in that the long-term growth predictions obtained during the last 20 years remain within
the same degree of consistency.
13 The standard deviation measures the variability among data points. For data that follow a normal distribution, 99.7 percent of data points will fall within approximately 3 standard deviations of the mean.

2021 Clark County Population Forecasts
22 cber.unlv.edu
VI. Risks to the Forecast
Our Southern Nevada population forecasts rest on economic and demographic models embedded in the
structural model for Clark County as produced by REMI. This structure provides long-term forecasts that
exclude the noise that one finds in time-series data–that is, business-cycle, seasonal, and irregular events.
In addition, the uncertainty of the forecasts rises the further into the future that the forecasts extend. For
example, forecasts of population growth for the next two years see a much smaller range over which the
forecast may actually vary than the range for our forecasts 40 years into the future.14
The main risks to the population forecasts arise from short-term fluctuations in both U.S. and
Southern Nevada economic conditions. Based on our assessment of national and regional trends, we
believe that the Southern Nevada economy will benefit from the current vaccination efforts and will
experience a robust recovery in the near term. The speed of the recovery remains uncertain as the local
economy is still vulnerable to COVID-19 due to its tourism-dependent economy. That is, the local
economic recovery can be stalled by potential viral mutations. We, however, currently see early signs of
renewed recovery after the summer, fall, and winter pause as more people get vaccinated. That is, Clark
County visitor volume and McCarran air passengers soared by 43.8 and 59.6 percent from February to
March, benefitting from eased COVID-19 related restrictions as more people get vaccinated. Las Vegas
tourism started to show a strong recovery which could help to boost the mid-week hotel/motel occupancy
rates as conventions could safely return to in-person services. Nevertheless, the recent slowing
vaccination rate in the United States could deter the recovery speed and the return to normality.
As the majority of Clark County visitors come from the United States, the speed of the recovery
of the Southern Nevada economy will largely hinge on the U.S. economic performance. The U.S. economy
recently showed signs of strong improvement benefiting from the $1.9 trillion relief package and ongoing
vaccination efforts. The U.S. economy, however, recently experienced rising interest rates and signs of
inflation, which can cause headwinds as the Federal Reserve policy makers may need to make decisions
to taper. Economic growth in the rest of the world may also influence U.S. economic growth. The world
14 The discussions in this and the immediate prior paragraphs may seem inconsistent. The discussion, however, focuses on two different issues. In the current paragraph, the uncertainty focuses on the range around an existing forecast within which we can expect the actual value to lie with some probability. For example, a typical range covers 95 percent of actual outcomes. In a statistical sense, the discussion involves confidence bands. The further into the future that the research tries to forecast, the larger the range of the confidence bands needs to be to capture 95 percent of potential outcomes. In the prior paragraph, the standard deviation came from a series of different vintage REMI forecasts. The economic and demographic structure of the REMI model leads to convergence over time. That is, the economic migrants respond to economic incentives. Then, the movement of economic migrants will tend to reduce and eliminate the economic incentive for more migrants to move in the longer run. That is, excessive growth relative to national growth disappears as the incentives for economic migration diminish.

2021 Clark County Population Forecasts
23 cber.unlv.edu
economy seems to show positive signs of recovery boosted by the rollout of the COVID-19 vaccine and
additional fiscal stimulus, but the speed of the vaccine rollout is slower than the U.S., which brings concern
of potential viral mutations, which could deter the speed of the U.S. economic recovery. In addition, the
lower vaccination rate in other countries will slow the recovery of our tourism sector as international
visitors accounted for 14 percent of total visitors to Las Vegas in 2019.15
The future diversification of the local economy may provide a positive upside risk in terms of long-
term population growth. In a Brookings Institution report,16 Las Vegas ranked 96th out of 100 metropolitan
areas based on improvement in prosperity (changes in productivity, average wealth and income, and
standard of living). The report emphasizes that high-tech-, research-, and capital-intensive-based
economies grow faster than regions that rely on the hospitality and retail sectors for their economic
growth. An updated report,17 however, indicates that the effort to improve economic diversification has
barely occurred as Las Vegas, ranking 53rd out of 53 very large metro areas in prosperity. Washoe County,
which partly succeeded in diversifying its economy after the Great Recession,18 posted less vulnerabilities
with the COVID-19 recession compared to Clark County. That is, Washoe County employment fell by 5.2
percent in 2020, while Clark County employment plummeted by 12.2 percent. Moreover, taxable sales in
Washoe County already recovered and surpassed its pre-pandemic levels, while Clark County’s taxable
sales still remain lower than its pre-pandemic levels. We witnessed the vulnerability of the local economy
during the Great Recession because of our tourism-based economy, and we still see the same weakness
throughout the economic downturn due to the COVID-19 pandemic.
Finally, another health crisis or terrorist event similar to the Mandalay Bay shooting on October
1, 2017 could significantly lower future economic growth and, thus, the population growth. Possible virus
mutations currently give a downside risk in the near future.
In summary, although we feel that the population forecast is sound, risks exist that could lead to
either over- or under-forecasted population growth. Our employment forecasts seem conservative based
on the most recent employment data. Nonetheless, we still believe that the downside risk may exceed
15 https://assets.simpleviewcms.com/simpleview/image/upload/v1/clients/lasvegas/2019_XTAB_LasVegasVPS_Matrix_Snapshot_a707e2cf-87d5-48e1-bca6-18e0a2d275c7.pdf. 16 Source: The Brookings Institution (2017), Metro Monitor. 17 Source: The Brookings Institution (2020), Metro Monitor. 18 According to Brookings Mountain West and the Lincy Institute, Las Vegas-Henderson-Paradise experienced -3.7, -0.5, and -9.3 percent growth in productivity, average annual wage, and standard of living from 2008 to 2018, while Reno gained by 4.0, 5.4 and 4.9 percent, respectively, during the same period.

2021 Clark County Population Forecasts
24 cber.unlv.edu
the upside risk for the Southern Nevada economy, which means that the risk of overestimating population
growth may exceed the risk of its underestimation in the near term due to potential risks of viral mutations
and their unpredictable effect on the economy. The economic uncertainty for the short term remains at
a high-level, however, as we have never experienced an economic downturn caused by a public health
crisis with massive shutdowns. We reiterate that our long-term forecasts exclude business-cycle, seasonal,
and irregular events, which respond more to these short-run risks. Our long-term forecasts are designed
to aid in the process of long-term planning.
VII. Conclusion
The latest REMI model projects long-term population growth patterns that are consistent with previous
population forecasts. Overall, the population forecast is higher than last year’s forecast. These patterns
reflect the new data incorporated into the model and major adjustments with current employment and
population data. We note that despite short-term economic uncertainties and model difficulties, the long-
term population forecast, which is our primary focus in this forecasting exercise, remains consistent with
past forecasts. By 2035, we predict that Clark County’s population will reach about 3.02 million. In 2060,
Clark County is expected to hit slightly above 3.38 million residents.

2021 Clark County Population Forecasts
25 cber.unlv.edu
Appendices:
Appendix A: Computation of the Jobs-to-Room Ratio
The adjustment for new hotel construction uses a ratio of jobs to rooms. Two issues arise in the
computation of the jobs-to-room ratio. First, we expect new hotel rooms to create new jobs in hotel
services. Second, new hotel rooms will also generate economic activity and, hence, additional jobs in other
sectors. Increased tourism activity from new hotel rooms will increase the demand for food services and
other tourism-related industries. Hence, we need an approach that accounts for these two issues. We
propose the following formula:
Table A1. Computation of the Jobs-to-Room Ratio by Sequence (1) – (5)
(1) Employment (thousands) Industrial Classification 2010 2011 2012 2013 2014 2015 2016 2017 2018 2019
Accommodation 163.4 165.7 164.6 164.9 170.6 168.9 166.4 165.5 165.0 163.4
Clothing and clothing accessories 16.8 17.4 18.3 18.5 19.0 19.2 18.5 19.3 18.9 18.5
Transit, ground pass transportation 12.4 12.9 13.3 13.4 14.0 14.2 13.4 12.4 11.0 9.9
Arts, entertainment, and recreation 15.8 16.9 17.5 17.8 18.7 19.3 20.5 21.3 22.6 23.5
Food service and drinking places 74.2 77.0 79.4 84.5 89.3 94.1 98.8 101.9 103.5 106.6 Source: Quarterly Census of Employment and Wages, U.S. Bureau of Labor Statistics
(2) Proportion of employment due to tourism* (=Location quotient**-1) Industrial Classification 2010 2011 2012 2013 2014 2015 2016 2017 2018 2019
Accommodation 1.00 1.00 1.00 1.00 1.00 1.00 1.00 1.00 1.00 1.00 Clothing and clothing accessories 0.84 0.96 1.00 1.00 1.00 1.00 0.98 0.98 0.94 0.95 Transit, ground pass transportation 1.00 1.00 1.00 1.00 1.00 1.00 1.00 1.00 1.00 1.00 Arts, entertainment, and recreation 0.26 0.34 0.36 0.33 0.32 0.30 0.32 0.31 0.33 0.33 Food service and drinking places 0.20 0.23 0.22 0.24 0.24 0.24 0.25 0.24 0.22 0.22
* Maximum value = 1. Minimum value = 0. ** The Location Quotient (LQ) compares Clark County’s employment in a given industry sector to that of the nation. An LQ greater than 1 indicates that the area has proportionately more workers than the nation employed in that specific industry sector. This implies that the area is producing more than is consumed by its residents. The portion of the LQ that is above 1 represents the proportion of the industry’s employment attributable to tourism activity.

2021 Clark County Population Forecasts
26 cber.unlv.edu
(3) Employment due to tourism (thousands) = (1) x (2) Industrial Classification 2010 2011 2012 2013 2014 2015 2016 2017 2018 2019
Accommodation 163.4 165.7 164.6 164.9 170.6 168.9 166.4 165.5 165.0 163.4 Clothing and clothing accessories 14.2 16.7 18.3 18.5 19.0 19.2 18.1 18.9 17.9 17.5 Transit, ground pass transportation 12.4 12.9 13.3 13.4 14.0 14.2 13.4 12.4 11.0 9.9 Arts, entertainment, and recreation 4.0 5.7 6.2 5.8 6.0 5.8 6.5 6.7 7.5 7.7 Food service and drinking places 14.7 17.4 17.4 20.3 21.6 22.9 24.4 24.6 22.6 23.4 Total employment due to Tourism* 208.7 218.3 219.9 223.0 231.1 231.0 228.7 228.1 228.1 222.0
* The numbers may not sum to the total because of rounding.
(4) LVCVA hotel room count (thousands) 2010 2011 2012 2013 2014 2015 2016 2017 2018 2019
Average room inventory 148.4 149.6 150.5 150.1 150.1 149.6 148.7 147.3 147.4 148.9
(5) Employment due to a hotel room = (3)*/(4) 2010 2011 2012 2013 2014 2015 2016 2017 2018 2019 Average**
Jobs-to-room ratio 1.41 1.46 1.46 1.49 1.54 1.54 1.54 1.55 1.52 1.49 1.5 *Total employment due to tourism. **Averaged jobs-to-room ratio from 2010 to 2019.

2021 Clark County Population Forecasts
27 cber.unlv.edu
Appendix B: Hotel/Motel Room Construction
Table B1. Expected Hotel/Motel Room Construction from 2021 to 2025
Complete Year Hotel Name Project Details Hotel Rooms
2021 Virgin Hotels, Curio Collection by Hilton Rebrand 1,504
2021 Resort World Las Vegas New property 3,500
2021 Hotel Cloé New property 74
2021 Skyline Hotel & Casino Additional rooms 41
2022 Delta Hotels by Marriott New property 284
2022 TownePlace Suites New property 120
2022 SpringHill Suites Marriott Airport New property 127
2022 Astral Las Vegas New property 620
2023 Element Las Vegas Airport New property 119
2023 SpringHill Suites Marriott New property 170
2023 AC Hotel by Marriott (Polaris/Dewey) New property 225
2023 AC Hotel by Marriott (Grand Ctrl Pkwy/Symphony Pk)
New property 322
2023 Element Las Vegas New property 119
2023 Aloft Hotel New property 136
2023 Drew Las Vegas Redeveloped resort 3,719
2024 Majestic Las Vegas New property 720
2025 Mardi Gras Hotel and Casino Redevelopment 700
Note: The total number of additional rooms from 2021 to 2025 equals 12,500. Source: Las Vegas Convention and Visitor Authority
Figure B1. Expected Hotel/Motel Room Construction by Area from 2021 to 2025
Source: Las Vegas Convention and Visitor Authority; CBER

2021 Clark County Population Forecasts
28 cber.unlv.edu
Appendix C: Detailed Report Tables
Table C1. Out-of-the-Box Clark County Population and Population Growth Forecasts from REMI Models LHY2018 and LHY2017
YEAR LHY2018 POPULATION (THOUSANDS)
LHY2017 POPULATION (THOUSANDS)
LHY2018 POPULATION GROWTH
LHY2017 POPULATION GROWTH
2021 2,363 2,380 1.9% 1.7%
2022 2,406 2,418 1.8% 1.6%
2023 2,447 2,455 1.7% 1.5%
2024 2,486 2,489 1.6% 1.4%
2025 2,523 2,521 1.5% 1.3%
2026 2,559 2,552 1.4% 1.2%
2027 2,594 2,581 1.4% 1.1%
2028 2,626 2,608 1.2% 1.0%
2029 2,656 2,634 1.1% 1.0%
2030 2,686 2,658 1.1% 0.9%
2031 2,714 2,681 1.0% 0.9%
2032 2,740 2,703 1.0% 0.8%
2033 2,766 2,723 0.9% 0.7%
2034 2,790 2,743 0.9% 0.7%
2035 2,813 2,762 0.8% 0.7%
2039
2040 2,911 2,844 0.6% 0.5%
2044
2045 2,983 2,911 0.4% 0.4%
2049
2050 3,038 2,969 0.3% 0.4%
2055 3,020 3,020 0.2% 0.3%
2060 3,112 3,061 0.2% 0.2%
Note: Out-of-the-box refers to the model prior to recalibration. These numbers are not the final forecast.

2021 Clark County Population Forecasts
29 cber.unlv.edu
Table C2. Detailed Final Clark County Population Forecast: 2010 – 2060
YEAR POPULATION FORECAST CHANGE IN POPULATION
FORECAST GROWTH IN POPULATION
(PERCENT) 2010 1,951,269* -55,078 -2.7%
2011 1,966,630** 15,361 0.8%
2012 2,008,654** 42,024 2.1%
2013 2,062,253** 53,599 2.7%
2014 2,102,238** 39,985 2.0%
2015 2,147,641** 45,403 2.2%
2016 2,205,207** 57,566 2.7%
2017 2,248,390** 43,183 2.0%
2018 2,284,616** 36,226 1.6%
2019 2,325,798** 41,182 1.8%
2020 2,376,683** 50,885 2.2%
2021 2,417,000 40,317 1.7%
2022 2,470,000 53,000 2.2%
2023 2,529,000 59,000 2.4%
2024 2,587,000 58,000 2.3%
2025 2,640,000 53,000 2.0%
2026 2,691,000 51,000 1.9%
2027 2,738,000 47,000 1.7%
2028 2,782,000 44,000 1.6%
2029 2,822,000 40,000 1.4%
2030 2,859,000 37,000 1.3%
2031 2,894,000 35,000 1.2%
2032 2,928,000 34,000 1.2%
2033 2,959,000 31,000 1.1%
2034 2,989,000 30,000 1.0%
2035 3,018,000 29,000 1.0%
2036 3,044,000 26,000 0.9%
2037 3,070,000 26,000 0.9%
2038 3,094,000 24,000 0.8%
2039 3,117,000 23,000 0.7%
2040 3,138,000 21,000 0.7%
2041 3,158,000 20,000 0.6%
2042 3,177,000 19,000 0.6%
2043 3,195,000 18,000 0.6%
2044 3,212,000 17,000 0.5%
2045 3,228,000 16,000 0.5%
2046 3,244,000 16,000 0.5%
2047 3,258,000 14,000 0.4%
2048 3,271,000 13,000 0.4%
2049 3,284,000 13,000 0.4%
2050 3,296,000 12,000 0.4%
2051 3,307,000 11,000 0.3%
2052 3,317,000 10,000 0.3%
2053 3,327,000 10,000 0.3%
2054 3,336,000 9,000 0.3%
2055 3,345,000 9,000 0.3%
2056 3,354,000 9,000 0.3%
2057 3,362,000 8,000 0.2%
2058 3,370,000 8,000 0.2%
2059 3,377,000 7,000 0.2%
2060 3,383,000 6,000 0.2%
* 2010 U.S. Census. ** SNRPC consensus population estimate. Note: The average annual forecasted growth rate is 0.9 percent.

2021 Clark County Population Forecasts
30 cber.unlv.edu
Table C3. Economic Forecast
Variable Unit 2021 2022 2023 2024 2025 2026 2027 2028
Total Employment Thousands (Jobs) 1290.51 1323.73 1383.27 1445.87 1472.06 1493.41 1507.07 1516.42
Private Non-Farm Employment Thousands (Jobs) 1166.62 1196.89 1255.53 1315.91 1340.39 1359.75 1371.87 1380.07
Residence-Adjusted Employment Thousands 1261.17 1294.17 1353.07 1414.78 1440.80 1462.20 1476.03 1485.57
Population Thousands 2417.09 2470.26 2529.28 2586.78 2640.11 2690.68 2738.05 2781.84
Labor Force Thousands 1146.12 1167.53 1191.36 1225.34 1254.00 1280.86 1304.26 1324.64
Gross Domestic Product Billions of Fixed (2021) $ 130.39 135.96 144.04 152.71 157.90 162.49 166.32 169.93
Output Billions of Fixed (2021) $ 216.41 225.42 238.49 252.45 260.44 267.38 272.91 277.94
Value Added Billions of Fixed (2021) $ 130.39 135.96 144.04 152.71 157.90 162.49 166.32 169.93
Personal Income Billions of Fixed (2021) $ 126.27 123.38 127.60 133.00 137.80 142.54 147.07 152.54
Disposable Personal Income Billions of Fixed (2021) $ 113.97 110.12 113.92 118.85 123.25 126.52 129.86 135.04
PCE-Price Index 2012=100 (Nation) 113.47 115.72 118.01 120.78 123.64 126.37 129.13 131.90
Variable Unit 2029 2030 3035 2040 2045 2050 2055 2060
Total Employment Thousands (Jobs) 1521.66 1527.49 1566.54 1599.64 1633.91 1672.43 1700.70 1717.93
Private Non-Farm Employment Thousands (Jobs) 1384.37 1389.43 1425.23 1457.06 1490.91 1529.32 1558.92 1578.68
Residence-Adjusted Employment Thousands 1491.12 1497.25 1536.97 1570.30 1604.55 1642.88 1671.18 1688.62
Population Thousands 2821.73 2859.19 3017.56 3137.98 3228.37 3295.50 3345.44 3383.45
Labor Force Thousands 1338.51 1350.03 1399.04 1436.58 1467.69 1493.85 1511.38 1521.84
Gross Domestic Product Billions of Fixed (2021) $ 173.03 176.25 193.19 209.59 226.52 244.47 263.39 283.25
Output Billions of Fixed (2021) $ 282.38 287.10 314.35 346.34 381.54 420.16 462.03 507.34
Value Added Billions of Fixed (2021) $ 173.03 176.25 193.19 209.59 226.52 244.47 263.39 283.25
Personal Income Billions of Fixed (2021) $ 155.90 161.48 184.20 206.96 231.24 257.36 285.11 314.00
Disposable Personal Income Billions of Fixed (2021) $ 138.04 143.25 163.68 184.01 205.72 229.09 253.95 279.86
PCE-Price Index 2012=100 (Nation) 134.66 137.40 151.85 167.97 185.79 205.46 227.17 251.13

2021 Clark County Population Forecasts
31 cber.unlv.edu
Table C4. Employment (in thousands)
Variable 2021 2022 2023 2024 2025 2026 2027 2028
Private Non-Farm 1290.51 1323.73 1383.27 1445.87 1472.06 1493.41 1507.07 1516.42
Forestry, Fishing, Other 0.42 0.43 0.45 0.47 0.48 0.48 0.48 0.48
Mining 1.57 1.64 1.72 1.83 1.86 1.90 1.92 1.93
Utilities 2.68 2.71 2.77 2.84 2.87 2.88 2.88 2.88
Construction 90.13 92.02 97.16 105.70 106.56 109.11 110.75 111.06
Manufacturing 29.28 29.50 29.74 29.98 30.10 30.18 30.12 30.05
Wholesale Trade 29.83 29.72 29.76 30.06 30.16 30.20 30.16 30.11
Retail Trade 131.85 129.31 129.38 130.66 131.35 131.70 131.74 131.81
Transportation and Warehousing 69.97 71.82 75.77 80.35 82.54 83.91 84.65 85.19
Information 16.56 16.74 16.77 16.89 16.85 16.74 16.60 16.44
Finance and Insurance 76.96 77.48 78.47 79.81 80.60 81.17 81.43 81.67
Real Estate and Rental and Leasing 74.59 76.16 78.06 80.38 82.02 83.38 84.33 85.07
Professional and Technical Services 80.00 82.68 84.86 87.65 89.27 90.63 91.73 92.59
Management of Companies and Enterprises 25.58 26.11 26.41 26.69 26.92 27.02 27.03 27.01
Admin and Waste Services 95.98 98.57 102.21 106.15 108.21 109.72 110.73 111.51
Educational Services 14.23 14.76 15.36 16.07 16.41 16.66 16.85 17.02
Health Care and Social Assistance 118.55 122.40 126.92 132.15 136.88 141.11 144.46 147.38
Arts, Entertainment, and Recreation 36.56 38.13 42.92 47.66 48.38 48.84 49.07 49.19
Accommodation and Food Services 211.47 222.91 248.31 268.64 275.69 279.57 281.54 282.32
Other Services (except public administration) 60.41 63.81 68.50 71.93 73.25 74.55 75.42 76.38
Government 123.48 126.43 127.32 129.54 131.26 133.24 134.78 135.93
State and local 90.47 93.64 95.47 98.77 101.58 103.76 105.49 106.87
Federal civilian 16.09 15.87 15.22 14.30 13.28 13.14 12.99 12.81
Federal military 16.93 16.92 16.63 16.47 16.40 16.34 16.31 16.26
Farm 0.41 0.41 0.42 0.42 0.42 0.42 0.42 0.42
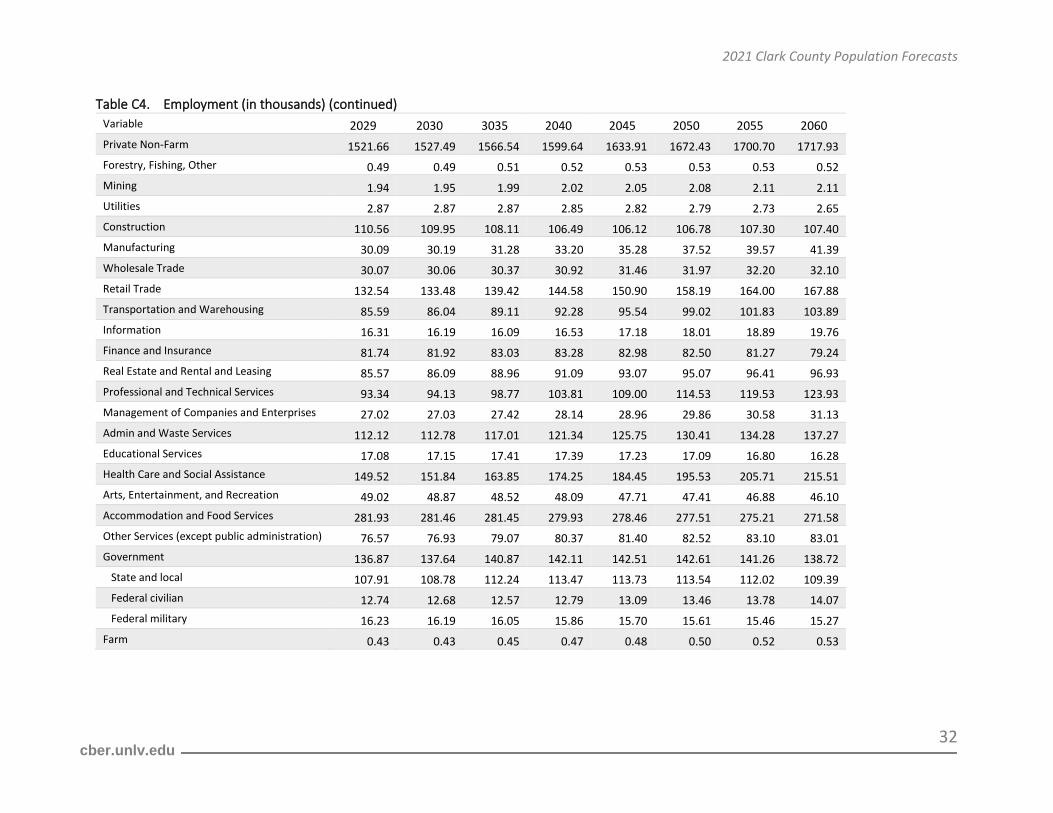
2021 Clark County Population Forecasts
32 cber.unlv.edu
Table C4. Employment (in thousands) (continued)
Variable 2029 2030 3035 2040 2045 2050 2055 2060
Private Non-Farm 1521.66 1527.49 1566.54 1599.64 1633.91 1672.43 1700.70 1717.93
Forestry, Fishing, Other 0.49 0.49 0.51 0.52 0.53 0.53 0.53 0.52
Mining 1.94 1.95 1.99 2.02 2.05 2.08 2.11 2.11
Utilities 2.87 2.87 2.87 2.85 2.82 2.79 2.73 2.65
Construction 110.56 109.95 108.11 106.49 106.12 106.78 107.30 107.40
Manufacturing 30.09 30.19 31.28 33.20 35.28 37.52 39.57 41.39
Wholesale Trade 30.07 30.06 30.37 30.92 31.46 31.97 32.20 32.10
Retail Trade 132.54 133.48 139.42 144.58 150.90 158.19 164.00 167.88
Transportation and Warehousing 85.59 86.04 89.11 92.28 95.54 99.02 101.83 103.89
Information 16.31 16.19 16.09 16.53 17.18 18.01 18.89 19.76
Finance and Insurance 81.74 81.92 83.03 83.28 82.98 82.50 81.27 79.24
Real Estate and Rental and Leasing 85.57 86.09 88.96 91.09 93.07 95.07 96.41 96.93
Professional and Technical Services 93.34 94.13 98.77 103.81 109.00 114.53 119.53 123.93
Management of Companies and Enterprises 27.02 27.03 27.42 28.14 28.96 29.86 30.58 31.13
Admin and Waste Services 112.12 112.78 117.01 121.34 125.75 130.41 134.28 137.27
Educational Services 17.08 17.15 17.41 17.39 17.23 17.09 16.80 16.28
Health Care and Social Assistance 149.52 151.84 163.85 174.25 184.45 195.53 205.71 215.51
Arts, Entertainment, and Recreation 49.02 48.87 48.52 48.09 47.71 47.41 46.88 46.10
Accommodation and Food Services 281.93 281.46 281.45 279.93 278.46 277.51 275.21 271.58
Other Services (except public administration) 76.57 76.93 79.07 80.37 81.40 82.52 83.10 83.01
Government 136.87 137.64 140.87 142.11 142.51 142.61 141.26 138.72
State and local 107.91 108.78 112.24 113.47 113.73 113.54 112.02 109.39
Federal civilian 12.74 12.68 12.57 12.79 13.09 13.46 13.78 14.07
Federal military 16.23 16.19 16.05 15.86 15.70 15.61 15.46 15.27
Farm 0.43 0.43 0.45 0.47 0.48 0.50 0.52 0.53
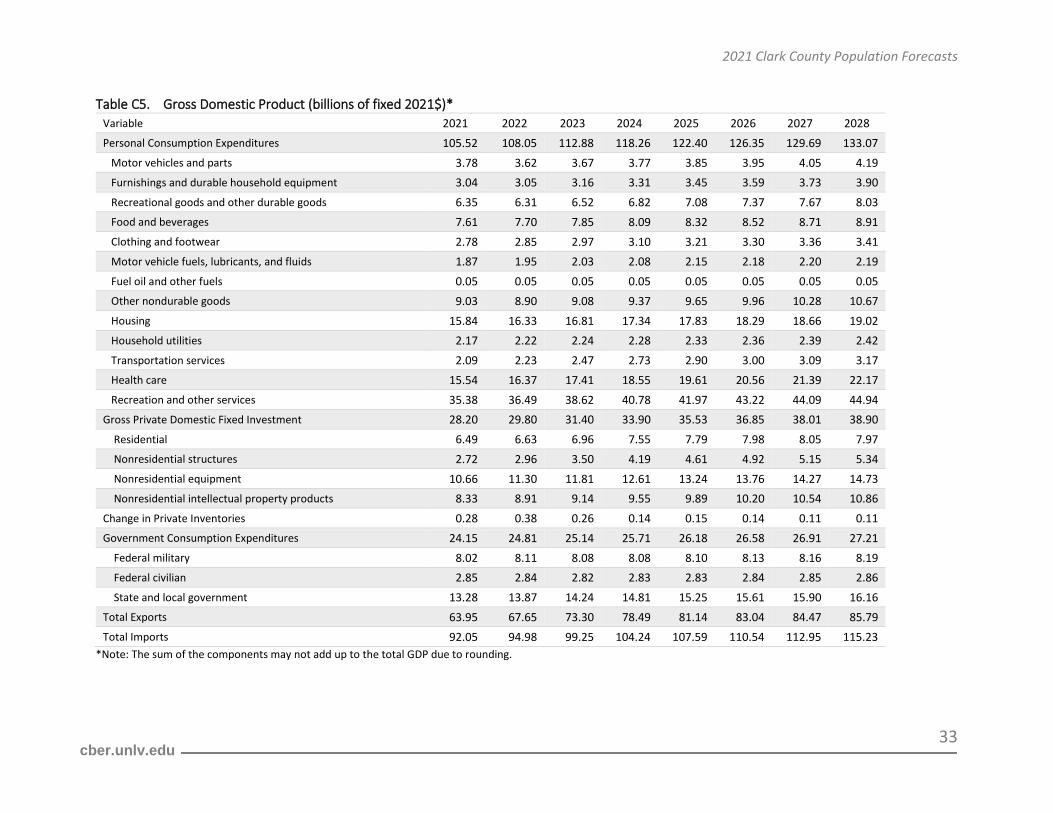
2021 Clark County Population Forecasts
33 cber.unlv.edu
Table C5. Gross Domestic Product (billions of fixed 2021$)* Variable 2021 2022 2023 2024 2025 2026 2027 2028
Personal Consumption Expenditures 105.52 108.05 112.88 118.26 122.40 126.35 129.69 133.07
Motor vehicles and parts 3.78 3.62 3.67 3.77 3.85 3.95 4.05 4.19
Furnishings and durable household equipment 3.04 3.05 3.16 3.31 3.45 3.59 3.73 3.90
Recreational goods and other durable goods 6.35 6.31 6.52 6.82 7.08 7.37 7.67 8.03
Food and beverages 7.61 7.70 7.85 8.09 8.32 8.52 8.71 8.91
Clothing and footwear 2.78 2.85 2.97 3.10 3.21 3.30 3.36 3.41
Motor vehicle fuels, lubricants, and fluids 1.87 1.95 2.03 2.08 2.15 2.18 2.20 2.19
Fuel oil and other fuels 0.05 0.05 0.05 0.05 0.05 0.05 0.05 0.05
Other nondurable goods 9.03 8.90 9.08 9.37 9.65 9.96 10.28 10.67
Housing 15.84 16.33 16.81 17.34 17.83 18.29 18.66 19.02
Household utilities 2.17 2.22 2.24 2.28 2.33 2.36 2.39 2.42
Transportation services 2.09 2.23 2.47 2.73 2.90 3.00 3.09 3.17
Health care 15.54 16.37 17.41 18.55 19.61 20.56 21.39 22.17
Recreation and other services 35.38 36.49 38.62 40.78 41.97 43.22 44.09 44.94
Gross Private Domestic Fixed Investment 28.20 29.80 31.40 33.90 35.53 36.85 38.01 38.90
Residential 6.49 6.63 6.96 7.55 7.79 7.98 8.05 7.97
Nonresidential structures 2.72 2.96 3.50 4.19 4.61 4.92 5.15 5.34
Nonresidential equipment 10.66 11.30 11.81 12.61 13.24 13.76 14.27 14.73
Nonresidential intellectual property products 8.33 8.91 9.14 9.55 9.89 10.20 10.54 10.86
Change in Private Inventories 0.28 0.38 0.26 0.14 0.15 0.14 0.11 0.11
Government Consumption Expenditures 24.15 24.81 25.14 25.71 26.18 26.58 26.91 27.21
Federal military 8.02 8.11 8.08 8.08 8.10 8.13 8.16 8.19
Federal civilian 2.85 2.84 2.82 2.83 2.83 2.84 2.85 2.86
State and local government 13.28 13.87 14.24 14.81 15.25 15.61 15.90 16.16
Total Exports 63.95 67.65 73.30 78.49 81.14 83.04 84.47 85.79
Total Imports 92.05 94.98 99.25 104.24 107.59 110.54 112.95 115.23
*Note: The sum of the components may not add up to the total GDP due to rounding.

2021 Clark County Population Forecasts
34 cber.unlv.edu
Table C5. Gross Domestic Product (billions of fixed 2021$) (continued)* Variable 2029 2030 2035 2040 2045 2050 2055 2060
Personal Consumption Expenditures 136.04 139.33 157.04 175.62 194.94 215.79 237.56 260.14
Motor vehicles and parts 4.34 4.51 5.46 6.52 7.70 9.03 10.53 12.14
Furnishings and durable household equipment 4.07 4.26 5.32 6.53 7.91 9.45 11.18 13.05
Recreational goods and other durable goods 8.40 8.82 11.24 14.07 17.36 21.27 25.68 30.60
Food and beverages 9.12 9.33 10.42 11.51 12.58 13.65 14.73 15.77
Clothing and footwear 3.45 3.49 3.67 3.82 3.90 4.15 4.27 4.32
Motor vehicle fuels, lubricants, and fluids 2.18 2.15 2.06 1.97 1.90 1.82 1.72 1.65
Fuel oil and other fuels 0.05 0.05 0.06 0.06 0.07 0.07 0.07 0.07
Other nondurable goods 11.10 11.57 14.18 17.19 20.57 24.42 28.67 33.35
Housing 19.32 19.65 21.29 22.82 24.25 25.58 26.85 27.99
Household utilities 2.44 2.48 2.67 2.84 2.99 3.12 3.25 3.35
Transportation services 3.22 3.28 3.60 3.89 4.17 4.44 4.71 4.95
Health care 22.84 23.54 27.28 31.21 35.26 39.51 43.83 48.40
Recreation and other services 45.50 46.20 49.79 53.20 56.30 59.28 62.09 64.49
Gross Private Domestic Fixed Investment 39.58 40.19 43.44 47.10 51.02 55.21 59.65 64.28
Residential 7.76 7.56 6.81 6.34 6.07 5.98 5.99 6.08
Nonresidential structures 5.47 5.58 6.10 6.60 7.12 7.69 8.29 8.92
Nonresidential equipment 15.17 15.56 17.52 19.57 21.66 23.76 25.92 28.13
Nonresidential intellectual property products 11.18 11.48 13.01 14.58 16.17 17.79 19.45 21.15
Change in Private Inventories 0.11 0.12 0.14 0.15 0.16 0.16 0.15 0.14
Government Consumption Expenditures 27.47 27.69 28.71 29.64 30.45 31.19 31.82 32.40
Federal military 8.22 8.24 8.36 8.50 8.67 8.86 9.06 9.29
Federal civilian 2.87 2.88 2.92 2.97 3.03 3.10 3.17 3.25
State and local government 16.37 16.57 17.44 18.16 18.74 19.23 19.59 19.86
Total Exports 87.00 88.25 95.83 105.07 115.45 126.98 139.81 154.15
Total Imports 117.25 119.40 132.06 148.03 165.55 184.91 205.66 227.91
*Note: The sum of the components may not add up to the total GDP due to rounding.

2021 Clark County Population Forecasts
35 cber.unlv.edu
Table C6. Income (billions of fixed 2021$)
Variable 2021 2022 2023 2024 2025 2026 2027 2028
Total earnings by place of work 76.97 78.35 83.13 88.23 91.04 93.71 95.90 97.92
Total wage and salary disbursements 56.83 58.37 62.11 66.08 68.25 70.28 71.88 73.33
Supplements to wages and salaries 12.84 13.21 13.94 14.72 15.23 15.74 16.24 16.71
Employer contributions for employee pension and insurance funds 8.65 8.90 9.39 9.91 10.26 10.60 10.93 11.25
Employer contributions for government social insurance 4.18 4.32 4.55 4.81 4.98 5.14 5.31 5.46
Proprietors' income with inventory valuation and capital consumption adjustments
7.30 6.77 7.07 7.43 7.56 7.68 7.78 7.88
Less: Contributions for government social insurance 8.62 8.88 9.70 10.24 10.50 10.81 11.04 11.25
Employee and self-employed contributions for government social insurance
4.44 4.57 5.14 5.43 5.52 5.66 5.73 5.80
Employer contributions for government social insurance 4.18 4.32 4.55 4.81 4.98 5.14 5.31 5.46
Plus: Adjustment for residence -0.50 -0.51 -0.58 -0.68 -0.71 -0.72 -0.72 -0.72
Gross in 1.39 1.43 1.46 1.49 1.53 1.56 1.59 1.62
Gross out 1.89 1.93 2.04 2.17 2.23 2.28 2.32 2.35
Equals: Net earnings by place of residence 67.85 68.97 72.85 77.32 79.84 82.19 84.14 85.94
Plus: Rental, personal interest, and personal dividend income 28.08 30.05 30.81 31.43 32.31 33.65 35.17 36.96
Plus: Personal current transfer receipts 30.35 24.36 23.95 24.25 25.66 26.70 27.76 29.64
Equals: Personal income 126.27 123.38 127.60 133.00 137.80 142.54 147.07 152.54
Less: Personal current taxes 12.31 13.26 13.68 14.14 14.56 16.02 17.21 17.51
Equals: Disposable personal income 113.97 110.12 113.92 118.85 123.25 126.52 129.86 135.04

2021 Clark County Population Forecasts
36 cber.unlv.edu
Table C6. Income (billions of fixed 2021$) (continued)
Variable 2029 2030 2035 2040 2045 2050 2055 2060
Total earnings by place of work 99.64 101.45 110.07 118.31 127.06 136.60 146.97 158.12
Total wage and salary disbursements 74.53 75.76 81.63 87.20 93.25 100.03 107.64 116.08
Supplements to wages and salaries 17.17 17.66 19.88 21.91 23.89 25.85 27.77 29.60
Employer contributions for employee pension and insurance funds 11.56 11.89 13.38 14.72 16.00 17.25 18.43 19.52
Employer contributions for government social insurance 5.61 5.77 6.50 7.19 7.88 8.60 9.34 10.08
Proprietors' income with inventory valuation and capital consumption adjustments
7.94 8.03 8.56 9.21 9.93 10.72 11.56 12.44
Less: Contributions for government social insurance 11.45 11.66 12.64 13.57 14.56 15.65 16.87 18.20
Employee and self-employed contributions for government social insurance
5.84 5.89 6.14 6.38 6.67 7.05 7.53 8.12
Employer contributions for government social insurance 5.61 5.77 6.50 7.19 7.88 8.60 9.34 10.08
Plus: Adjustment for residence -0.71 -0.71 -0.70 -0.72 -0.76 -0.81 -0.85 -0.89
Gross in 1.65 1.68 1.83 1.97 2.12 2.29 2.48 2.69
Gross out 2.37 2.39 2.52 2.69 2.88 3.10 3.33 3.58
Equals: Net earnings by place of residence 87.48 89.09 96.74 104.03 111.74 120.14 129.25 139.03
Plus: Rental, personal interest, and personal dividend income 38.81 40.90 49.24 57.16 64.85 72.06 78.31 82.94
Plus: Personal current transfer receipts 29.61 31.49 38.21 45.77 54.65 65.15 77.55 92.03
Equals: Personal income 155.90 161.48 184.20 206.96 231.24 257.36 285.11 314.00
Less: Personal current taxes 17.86 18.24 20.52 22.95 25.52 28.27 31.16 34.14
Equals: Disposable personal income 138.04 143.25 163.68 184.01 205.72 229.09 253.95 279.86

2021 Clark County Population Forecasts
37 cber.unlv.edu
Table C7. Population and Labor Force (in thousands) Variable 2021 2022 2023 2024 2025 2026 2027 2028
Total population 2417.09 2470.26 2529.28 2586.78 2640.11 2690.68 2738.05 2781.84
By race and ethnicity
White 997.46 1011.47 1027.64 1042.70 1055.75 1067.35 1077.33 1085.58
Black 282.39 288.75 295.63 302.36 308.64 314.61 320.22 325.44
Other 357.90 366.71 376.34 385.75 394.50 402.80 410.60 417.84
Hispanic 779.35 803.33 829.67 855.96 881.22 905.92 929.90 952.99
By age
Ages 0-14 455.18 459.20 466.31 474.43 481.78 488.00 494.53 499.78
Ages 15-24 290.20 299.76 314.82 328.71 337.73 343.63 347.71 350.95
Ages 25-64 1277.11 1294.55 1314.67 1333.77 1353.25 1374.86 1395.18 1414.37
Ages 65 & older 394.60 416.75 433.49 449.87 467.35 484.18 500.63 516.75
Labor force 1143.80 1161.68 1191.36 1225.34 1254.00 1280.86 1304.26 1324.64
Labor force participation rate 0.60 0.59 0.59 0.59 0.60 0.60 0.60 0.59
Participation rates by gender
Male (16 & older) 0.67 0.66 0.66 0.66 0.66 0.66 0.66 0.66
Female (16 & older) 0.53 0.53 0.53 0.53 0.53 0.54 0.54 0.54
Variable 2029 2030 2035 2040 2045 2050 2055 2060
Total population 2821.73 2859.19 3017.56 3137.98 3228.37 3295.50 3345.44 3383.45
By race and ethnicity
White 1092.01 1097.21 1108.88 1103.25 1086.24 1063.01 1037.16 1011.06
Black 330.23 334.75 354.29 369.84 381.95 391.12 397.93 403.29
Other 424.48 430.75 457.88 479.93 498.30 513.56 526.24 536.63
Hispanic 975.02 996.48 1096.50 1184.96 1261.89 1327.81 1384.12 1432.47
By age
Ages 0-14 504.69 508.56 525.58 533.52 534.14 529.32 521.56 514.00
Ages 15-24 352.73 354.52 356.84 363.24 370.37 372.81 371.74 366.96
Ages 25-64 1431.33 1447.02 1517.07 1565.79 1600.50 1615.91 1615.29 1607.81
Ages 65 & older 532.99 549.09 618.07 675.43 723.36 777.45 836.85 894.68
Labor force 1338.51 1350.03 1399.04 1436.58 1467.69 1493.85 1511.38 1521.84
Labor force participation rate 0.59 0.59 0.57 0.56 0.56 0.55 0.55 0.54
Participation rates by gender
Male (16 & older) 0.65 0.65 0.64 0.63 0.63 0.62 0.61 0.61
Female (16 & older) 0.53 0.53 0.51 0.50 0.49 0.49 0.48 0.48

2021 Clark County Population Forecasts
38 cber.unlv.edu
Table D8. Demographics (in thousands)
Variable 2021 2022 2023 2024 2025 2026 2027 2028
Starting population 2376.68 2417.09 2470.26 2529.28 2586.78 2640.11 2690.68 2738.05
Births 29.09 29.27 29.90 30.43 31.07 31.62 32.11 32.53
Deaths 19.93 20.64 21.35 21.96 22.61 23.29 23.98 24.69
Natural growth 9.16 8.63 8.55 8.47 8.45 8.33 8.13 7.84
Population before migrants 2385.84 2425.71 2478.81 2537.75 2595.23 2648.45 2698.81 2745.89
Total migrants 31.24 44.55 50.48 49.02 44.89 42.23 39.24 35.96
Economic migrants 21.77 35.19 41.29 39.54 35.14 32.33 29.20 25.82
International migrants 3.55 3.54 3.53 3.52 3.51 3.50 3.50 3.50
Retired migrants 5.68 5.83 5.99 6.15 6.31 6.46 6.58 6.69
Special pops migrants 0.25 -0.01 -0.34 -0.19 -0.08 -0.06 -0.04 -0.06
Total population 2417.09 2470.26 2529.28 2586.78 2640.11 2690.68 2738.05 2781.84
Variable 2029 2030 2035 2040 2045 2050 2055 2060
Starting population 2781.84 2821.73 2989.16 3116.52 3212.36 3283.73 3336.43 3376.99
Births 32.87 33.17 34.22 34.48 34.19 33.86 33.61 33.26
Deaths 25.42 26.16 29.92 33.37 36.11 38.17 39.73 41.13
Natural growth 7.45 7.01 4.30 1.11 -1.93 -4.31 -6.12 -7.86
Population before migrants 2789.29 2828.74 2993.45 3117.63 3210.43 3279.42 3330.31 3369.13
Total migrants 32.44 30.44 24.10 20.35 17.94 16.08 15.13 14.32
Economic migrants 22.18 20.12 13.61 9.83 7.31 5.12 3.72 2.38
International migrants 3.49 3.49 3.47 3.44 3.41 3.38 3.35 3.33
Retired migrants 6.80 6.88 7.06 7.12 7.25 7.61 8.11 8.66
Special pops migrants -0.04 -0.05 -0.03 -0.05 -0.04 -0.03 -0.05 -0.05
Total population 2821.73 2859.19 3017.56 3137.98 3228.37 3295.50 3345.44 3383.45