2021 1st Quarter Final - risk.byu.edu
42
BYU Risk Management and Safety Department 2021 1st Quarter Report
Transcript of 2021 1st Quarter Final - risk.byu.edu

BYU Risk Management and Safety Department 2021 1st Quarter Report

TABLE OF CONTENTS
Page No. Compliance Committee Support
Committee Involvement 3
Emergency Management 4 Conferences and Training Events Programs In Progress COVID-19 Other Activities
Environmental, Health, and Safety Academic Safety 5 Environmental Management 9 Industrial Hygiene 15 Occupational Safety 18
Fire and Life Safety 31 Fire Marshal & Additional Activities Fire Safety Inspections and Reviews Life Safety Systems Hot Work Permits/Inspections Special Events
Information Technology 33 Overview Quarter 4 Highlights Projects
Insurance Services, Risk Management & Risk Assessment 37 Insurance Services Risk Management/Child Protection Program Incidents & Claims Reporting Risk Assessment & Analyst Services
2

COMPLIANCE COMMITTEE SUPPORT
The Department of Risk Management and Safety in addition to Emergency Management personnel provide support to the following committees as chairpersons, members, responsible officials, and/or resources:
• Academic Safety, Health, and Environmental Committee
• Campus Safety, Health, and Environmental Committee
• Child Protection Compliance Committee
• Dining Services Safety Committee
• Executive Risk Management Compliance Committee
• Institutional Animal Care and Use Committee
• Institutional Biosafety Committee
• Institutional Review Board Committee
• Laser and Radiation Safety Committee
• Physical Facilities Safety Committee
• The Local Emergency Planning Committee
• The University Disability Standards Compliance Committee
• University Clery Committee
• University Continuity Steering Committee
• University Security and Alarms Committee
• Utah Emergency Management Association Board
• Vehicle Accident Review Committee
3

EMERGENCY MANAGEMENT
The purpose of Emergency Management is to provide timely, adequate, and effective preparedness, response, and recovery to any potential or actual, natural or manmade incident, emergency, or disaster that may affect Brigham Young University operations.
Conferences, Trainings, and Meetings • ECC activated to support several potential situations on campus • Virtual Emergency Preparedness Week – campus wide classes • Governor Situational Briefings • Monthly Incident Management Team meetings • Representation during meetings/calls with the Utah County Emergency Manager and EMS across
Utah County • VOAD meetings
Programs in Progress • Emergency Response Guide • Stop the Bleed • Emergency Building Coordinators Program • Emergency Caches • Cougar Ready Program • Training and Exercise Plan
COVID-19 • Participated in several Policy Group, Incident Command, Incident Management Team, and
Emergency Management meetings to discuss policies and proceedings in response to Fall and Winter Semesters. Discussions included topics such as BYU media and announcements, online classes, and COVID-19 testing on campus.
• Approx. 2245 cases were reported that required follow-up from a case manager (this number includes positive cases, negative cases, individuals who were awaiting test results and individuals with questions).
• Approx. 1123 contact investigations were reported that required follow-up from a case manager (this number includes reported individuals that had close contact with a COVID positive case, individuals that did not have close contact with a COVID positive case, and individuals with questions).
• Sent out thank you masks and cards to contact tracers as well as other campus partners involved in the COVID-19 response on campus.
• Staff members managed the random testing for COVID-19 on campus.
Other Activities • Tamie Harding was selected as the new Emergency Manager, replacing Ryan Rasmussen • Andrew Christensen was hired as the new Deputy Emergency Manager • Assisted with coordination of the use of the former Provo High School as a COVID-19 Vaccination
site • Registration of 10 Zoll AEDs • “Campus Contacts” page added to Emergency Management homepage • Emergency Management Instagram account was created
4

ENVIRONMENTAL, HEALTH, & SAFETY DEPARTMENT The EH&S department is comprised of several groups that oversee the following areas: Academic Safety (including Lab Safety), Environmental Management (including Inventory, Environmental Compliance, and Hazardous
Materials and Waste), Industrial Hygiene, and Occupational Safety (including Safety Programs Management and Safety Training).
ACADEMIC SAFETY
During the first quarter of 2021, the Academic Safety group completed the following activities:
Environmental Lab • Student management during Qtr 1:
o 3 students graduated or left o Interviewed, hired and trained 2 new students
• Lab activities: o Completed 267 lab inspections o Completed 312 safety equipment inspections o Completed 7 inspections of unknowns
• Services requested submitted • Purchased lab supplies for HAZCAT kit and FTIR • Composed a letter of recommendation for a prior student employee’s application to medical
school
Biological Safety • Reviewed 5 Material Transfer Agreements • Assisted Dr. Bikman to setup research in McDonald building • Advised Chem Grad student, Nathan Summers, on graduate project. Provided summary of
regulatory guidelines for research with recombinant DNA project.
BSL3 Activities • Trained service technician from Heninger, Inc. to enter BSL3 labs to perform annual biosafety
certification • Weekly review of entry logs (13-weeks) • Updated SOPs and plans with name of new disinfectant being used • Followed up on 11 lab personnel to ensure they had received a COVID-19 vaccination.
Vaccinations are required by CDC labs for personnel working with SARS-CoV-2 • Medical surveillance for 3 individuals seeking access to BSL3 labs • Wrote SOP for use of lab coats in place of disposable gowns due to lack of supply of disposable
gowns. • Escorted technicians to calibrate room pressure sensors
o BTC Services in January o Western States Calibration in March
5

FSAP • Final report issued, responses to their requests for explanation and comments related to CDC’s
October 2020 inspection • Reviewed new edition of Biosafety, Biomedical and Microbiological Laboratories (BMBL, rev 6) • Began updates for 3 plans with new information from BMBL update
Bloodborne Pathogens • Trained 35 individuals • Completed 17 trainings • Attended multiple meetings to discuss and devise a plan for treating employees with BBP
exposures when SHC is unavailable or unable to assist
IACUC • Completed 31 protocol reviews • Attended 3 meetings • Met with IACUC administrator and contractor on revisions to IACUC protocol form hosted in an
online program called IMEDRIS • Prepared policy on disposal of Genetically Modified Animals used in research at BYU.
o Reviewed regulations o Spoke with Materials Management on how waste is disposed of by our vendors and better
mean of PIs to identify GMO waste for collection • Assisted with resolution of 5 issues dealing with animal housing and research activities • Wrote an SOP for dealing with and reporting animal bites • Measured concentrations of Waste Anesthetic gases to ensure lab animal workers did not exceed
the maximum exposure levels • Attended 6 webinar trainings from NIH, ABSA and OLAW
IBC • Completed 2 protocol reviews • Attended 2 meetings • Signed off on 1 letter • Completed 2 BSL2 lab inspections • Reviewed IBC Charter and made comments. Met with IBC administrator to review final
document prior to submission to NIH • Composed an exposure control plan and Laboratory Biosafety Plan for an IBC protocol submitted
by Dr. Steffensen
Radiation & Laser Safety • Completed triannual sealed source leak checks • Completed 1st quarter radiation dosimetry monitoring • Assisted Electric Shop in removing radioactive tritium EXIT signs from old Provo High School • Trained three lab researchers in Radiation Safety
Ergonomics • Completed ergonomic assessments for 4 individuals • Participated in Zoom presentation for BYU Wellness
6

• Interacted with supplier, Contour Design, over ergonomic equipment and strategies o Attended 2 webinars presented by Contour Design for office ergonomics
• Reviewed White Paper written for BYU’s Ergonomic Program.
Other: • Provided information to Brian Harris regarding the HEPA filter system on the LSB • PWS presentation on BBP and Disease to be aware of during field research • Followed up with Mike Pettersson to ensure changes requested to our lab hazard signs were
done • Used Halo Fogger to decon a walk-in cooler in the LSB
o Extensive mold growth was noted throughout the room o Spent several hours preparing room for fog by covering light and electrical fixtures with
plastic o Removed plastic and tape the next day following 12 hour exposure time recommended by
manufacturer
Q1 Additional Highlights: • The EH&S group assisted Dr. Tom Smith in teaching a variety of safety principles to students
enrolled in PWS 113. • Dave Smith and Steve McLean trained campus Compliance Coordinators about using effective
presentation techniques.
7

Academic Safety Metrics
No. of Inspections/Tests 2021 Q1
2021 Q2
2021 Q3
2021 Q4
2021 TOTALS
2020 TOTALS
General Academic Labs 267 - - - 267 25 Safety Equipment Inspections 91 - - - 91 45 Eyewash/Safety Showers 312 - - - 312 121 Unknowns Tested 7 - - - 7 31 Radiation Labs Inspected 12 - - - 12 49 Radiation/Lab Calibrations Tested 5 - - - 5 14 Sealed Source/Leak Checks 40 - - - 40 60 Other Radiation Sources Checked 15 - - - 15 131 Animal Care/Use Areas 0 - - - 0 0 Animal Care Protocols Reviewed 31 - - - 31 89 Animal Care SOPs Reviewed 2 - - - 2 11 Ergonomic Assessments (Academic and Industrial) 4 - - - 4 31 Ergonomic Assessments (Group Presentation) 1 - - - 1 -IBC Protocols Reviewed 2 - - - 2 32 IBC Lab Inspections 3 - - - 3 0 BSL3 CDC Plans/SOPs Reviewed 5 - - - 5 37 BSL3 CDC Plans/SOPs Updates 3 - - - 3 4 BSL3 CDC Meetings/Inspections 0 - - - 0 6 BSL3 Exercise Scenarios Created 0 - - - 0 3 BSL3 Exercise Plans/Summaries Created/Updated 0 - - - 0 4 Blood Borne Pathogen Trainings (Individuals) 35 - - - 35 140 Blood Borne Pathogen Program Reviewed 0 - - - 0 -
8

ENVIRONMENTAL MANAGEMENT
During the first quarter of 2021, Environmental Management completed the following:
Environmental Management Achievements • At the end of 2020, BYU completed testing many of the student population before they left to
return home for the holidays. The Random Testing continued into 2021. The Chemicals Management staff offered their support with the random testing by providing and monitoring the bio-waste bins. Several measures were taken, and trainings provided to help economize the materials disposed into the bins. We appreciate the opportunity to provide support to other activities and departments on campus.
Environmental Compliance • Provo City collected random samples from the effluence of the Dairy Processing facility at the
CSC in January 2021 for laboratory analysis. The results showed a biological oxygen demand (BOD) of 13,700 mg/L, which far exceeds our limit of 750 mg/L. The Dairy Processing facility was making Teriyaki Sauce that day and a valve was not securely closed and leaked. Approximately 10 gallons of Teriyaki Sauce was flushed down the drain with the cleaning and disinfectant mixture. BYU Dairy reports their analytical results to Provo City on a quarterly basis, which allowed collecting additional samples to bring the average below 750 mg/L to avoid a violation. Steps are now in place to ensure that all valves are closed prior to processing any product. No violation occurred. The Greenhouse Gas (GHG) report for 2020 indicated a significant reduction in greenhouse gases from 2019. The primary reason for this reduction can be traced to the Central Heating Plant using the two large boilers during most of 2020, and only using the combustion turbine a few months during the year. The 2020 GHG Report for BYU is 52,209 metric tons of CO2e. Please see the graph below. It is anticipated that BYU will see a corresponding increase of CO2e emissions over the next four years as the combustion turbine is operated more routinely.
BYU Metric Tons of CO2e Year Metric tons 2010 53,512 2011 53,300 2012 49,893 2013 51,646 2014 50,164 2015 50,852 2016 53,052 2017 38,433 2018 43,290 2019 77,273 2020 52,209
9

• The following annual reports have been submitted: o Tier II (Right-to-Know) Report was submitted. This report documents all above ground
storage tanks and their volume, contents, and location. This information is submitted to the State and to the Local Emergency Planning Committee (LEPC). This information is crucial to all local HAZMATs that may be called to respond to a chemical spill/leak. The local HAZMATs have access to this information, and it can assist them in knowing how to safely respond.
o Sulfur Dioxide (SO2) Report was submitted to the Utah Division of Air Quality (UDAQ). The SO2 report includes all major equipment on campus that burn natural gas or diesel fuel, such as generators, boilers, combustion turbine, etc. Sulfur Dioxide (SO2) can react with other compounds in the atmosphere to form fine particles that reduce visibility also known as “regional haze”.
o As described above the Greenhouse Gas Report was submitted to the EPA. This reporting process required updating BYU’s Direct Responsible person from Brian Evans, who retired, to include Steve Hafen. EPA requires very detailed information about the Direct Responsible person, in order to receive EPA’s approval. BYU’s Approval Order (air quality permit) allows the campus to generate 118,738.00 tons per years of Carbon Dioxide equivalent (CO2e). BYU is far below this limit and should stay far below this level for many years to come, even if the turbine is in operation 100% of the time.
• With the new UMPA agreement in place for operating the combustion turbine nearly year-round, there is not much need for the operation of the two large boilers any longer. The Approval Order (air quality permit) was in the process of modifying the permit to increase the operating times for the two large boilers; however, this need has vanished for the present time. The permit must still be updated to show other equipment changes/modifications. The two large laundry boiler burners will be changed, lowering the MMBTU rating from 12.6 to 8.0. The Crabtree emergency generator will be removed, and the Crabtree building will be tied into the Central Heating Plant emergency generator. The new Music Hall will have a new generator and the emergency generator at the Chemicals Management Building will be replaced. These changes require the permit to be upgraded. Trinity Consultants is working to modify this new permit.
Hazardous Materials and Waste The Hazardous Waste Technicians collect, categorize, and consolidate many different types of hazardous waste from across campus. The technicians package and prepare the collected waste for shipment according to DOT requirements. They are carefully trained to execute these tasks in a manner that is safe for them and for others on campus.
• Hazardous Waste Technicians retrieved 1,446 items. These items included acids, bases, flammable liquids, solid hazardous items, RAD, and bio-hazardous waste among other items, (e.g., lab packs, mercury, etc.).
• Thirty-one 55-gallon drums of waste including absorbent debris contaminated with acids, bases, cadaver preserving fluid, mercury debris, universal waste mercury containing devices, waste flammable solvents, and solid hazardous waste were consolidated and shipped.
• 36 labpacks were shipped out for disposal as small waste. • 1,728 lbs. of four-foot and eight-foot tubes of fluorescent lights were shipped out for disposal. • 23,135 lbs. of waste were shipped out for disposal. This included acids, bases, alkaline batteries,
cadaver preserving fluid, labpacks, mercury debris, universal waste mercury containing devices, waste flammable solvents, solid hazardous waste, and bio-hazardous waste.
10

Spill Prevention—Control and Countermeasures (SPCC) • Supported the development of a value-added program to assure compliance to the BYU SPCC
plan. o Sustained a monthly inspection criteria/spreadsheet from Q1 of 2021. The following assets (> 250, each) fall under the BYU SPCC plan for the monthly
inspection criteria. These assets have been and are inspected monthly which has continued since Q2 of 2019 (i.e., April, May, and June): • 145 electrical transformers • 56 hydraulic elevators • 41 emergency generators • 6 drum storage sites • 4 used cooking oil storage sites
Received a proposal from Kleinfelder Engineering Consultants to do an annual BYU SPCC Plan review and update, as necessary. • The Kleinfelder proposal is under review and will be finalized in Q2 of 2021.
The Mobile Inspection app, an electronic inspection application to facilitate the SPCC related asset inspection practices, continues to be used with success. • Integration of barcodes on campus assets which are associated with the SPCC Plan, is
being evaluated. It is anticipated that barcode usage for SPCC inspection practices will be integrated into either the Mobile Inspection app or the InspectNTrack (INT) app in Q2 2021.
• Participated in coordination meetings with the RM IT Group (Mike Pettersson) to assure each inspection template is submitted by each RM group who will be using this app.
• Worked closely with RM IT and facilitated contact with the staff at Mobile Inspection to give them updates on our status and our progress.
• Implemented a weekly project/hour reporting spreadsheet for each student employee to report on work status
• Coordinated with RM staff to assure that my team has access to proper personal protective (PPE) equipment for protection from possible exposure to COVID 19 including N-95 face masks and protective gloves.
• Continue to hold weekly team meetings to coordinate work objectives and strategies. • Counseled student employees regarding BYU work hour policies and work commitments during
Spring and Summer Semesters (2021), as needed.
ITEMS RECYCLED
Item Type Weight in
pounds Q1
Weight in pounds
Q2
Weight in pounds
Q3
Weight in pounds
Q4 2021
TOTALS
Ballast 0 - - - 0 Lead Acid Batteries 0 - - - 0
TOTALS 0 - - - 0
11

HAZARDOUS WASTE SHIPPED OUT FOR DISPOSAL
Waste Stream
Weight in
Pounds Q1
Weight in
Pounds Q2
Weight in
Pounds Q3
Weight in
Pounds Q4
2021 TOTALS
Acids (liquid) 1,766 - - - 1,766 Bases (liquid) 893 - - - 893 Bio-hazardous waste 11,066 - - - 11,066 Cadaver preserving fluid 172 - - - 172 Debris (absorbent & plant/vegetation) contaminated with non-PCB oil 184 - - - 184 Fish specimens preservation fluid 244 - - - 244 Industrial grease and debris 202 - - - 202 Labpack 90 - - - 90 Lithium batteries (damaged) 185 - - - 185 Mercury debris (5-gallons) 2 - - - 2 Solid hazardous waste (cubic yard box) 1,217 - - - 1,217 Universal waste mercury containing devices 0 - - - 0 Waste flammable solvents 6,114 - - - 6,114 TOTAL 22,135 - - - 22,135
OTHER SMALL WASTE ITEMS SHIPPED OUT FOR DISPOSAL
Waste Stream
No. of drums/
items shipped
Q1
No. of drums/
items shipped
Q2
No. of drums/
items shipped
Q3
No. of drums/
items shipped
Q4 2021
TOTALS Damaged Lithium Batteries 21 - - - 21 Lab Pack (no. of items) 15 - - - 15 Total 36 - - - 36
FLUORESCENT LIGHTBULBS SHIPPED OUT FOR DISPOSAL
Type of light bulbs Weight in
pounds Q1
Weight in pounds
Q2
Weight in pounds
Q3
Weight in pounds
Q4 2021
TOTALS Four- and eight-foot tubes 1,728 - - - 1,728 TOTALS 1,728 - - - 1,728
12

55-GALLON DRUMS CONSOLIDATED
Waste Stream
No. of drums
shipped Q1
No. of drums
shipped Q2
No. of drums
shipped Q3
No. of drums
shipped Q4
2021 TOTALS
Acids (liquid) 6 - - - 6 Bases (liquid) 2 - - - 2 Cadaver preserving fluid 1 - - - 1 Debris (absorbent & plant/vegetation) c/w non-PCB oil 1 - -
-1
Fish specimens preservation fluid 1 - - - 1 Industrial grease and debris 1 - - - 1 Mercury debris (5-gallons) 1 - - - 1 Solid hazardous waste (cubic yard box) 3 - - - 3 Waste Flammable Solvents 15 - - - 15 TOTAL 31 - - - 31
WASTE PICKUP FROM CAMPUS LABORATORIES
Waste Stream
No. of items
picked up Q1
No. of items
picked up Q2
No. of items
picked up Q3
No. of items
picked up Q4
2021 TOTALS
Acids (liquid) 103 - - - 103 Bases (liquid) 49 - - - 49 Flammable liquid 363 - - - 363 Cadaver Fluid 5 - - - 5 Solid hazardous items 350 - - - 350 Bio-hazardous waste 480 - - - 480 Other items (Lab- pack items, mercury) 30 - - - 30 RAD 56 - - - 56 Debris c/w with beryllium fluoride oil 10 - - - 10 TOTAL 1,446 - - - 1,446
13

INDUSTRIAL HYGIENE
Industrial Hygiene focuses on the anticipation, recognition, evaluation, and control of chemical and physical hazards in the workplace.
Industrial Hygiene manages the following: Noise Sampling Confined Spaces Respirator Program Sensor Calibration Ventilation System Evaluation Indoor Air Quality Asbestos Ergonomics Programs Lab equipment for Industrial Hygiene Department
The following tables provide the metrics for the first quarter of 2021:
Industrial Hygiene Metrics
Respiratory Program Q1 Q2 Q3 Q4 2021 TOTALS
Voluntary Fit-tests Performed 2 - - - 2 Mandatory Fit-tests Performed 2 - - - 2 New Mandatory Respiratory Users 2 - - - 2 EBA’s (Emergency Breathing Apparatus) Checked 4 - - - 4 Total Masks Distributed – all kinds (break down below) 3,304 - - - 3,304 -Cloth Face Coverings (CFC) Distributed 11 - - - 11 -N95’s Distributed (non-COVID related) 423 - - - 423 -KN95’s Distributed (COVID related) 2,870 - - - 2,870 Total Mask Inventory – all kinds (break down below) 44,254 - - - 44,254 - N95 (including V-flex) on hand 7,313 - - - 7,313 -KN95 on hand 2,511 - - - 2,511 -Surgical Mask on hand 9,150 - - - 9,150 =Double layered CFC on hand 25,280 - - - 25,280 Voluntary Fit-tests Performed 2 - - - 2
14

Industrial Hygiene Metrics
Sensors Calibrated & Ventilation Equipment Tested Q1 Q2 Q3 Q4 2021 TOTALS
Sensor Calibrations Tested Total 141 - - - 141 O2 Sensor Calibrations 5 - - - 5 Mercury Meter Regeneration 3 - - - 3 Combustible Gas Sensor Calibrations 40 - - - 40 Carbon Monoxide Sensor Calibrations 76 - - - 76 Ammonia Sensor Calibrations 17 - - - 17 Ventilation Systems Tested Total 282 - - - 282 Fume Hoods Tested 91 - - - 91 Snorkel Hoods Tested 123 - - - 123 Fixed Local Exhausts Tested 40 - - - 40 Spray Booths Tested 8 - - - 8 Vented Flammable Storage Tested 6 - - - 6 Other Ventilated Systems Tested 14 - - - 14
Industrial Hygiene Metrics
Miscellaneous Q1 Q2 Q3 Q4 2021 TOTALS
Confined Spaces Labeled 0 - - - 0 Departments Tested for Hearing Conservation 4 - - - 4 Departments Reached out to for Annual Audiograms 6 - - - 6 Industrial Hygiene Lab Equipment Calibrated 8 - - - 8 Industrial Hygiene Lab Equipment Purchased 0 - - - 0 Industrial Hygiene Lab Equipment Repurposed 0 - - - 0 Times our Lab Equipment has been Borrowed 7 - - - 7
15

IH Projects
• Assist with and keep records for the firm’s 5-year renewal for BYU regarding the RRP licensing • Assist in creating a Lock-Out-Tag-Out operation procedure for 11 different machines in the UPB • Investigated in a mold inquiry in the LSB cold-room storage in the MMBIO department. Recruited
the help of Don Hunt in the removal, which he oversaw. • Added to the rotating schedule of the Gas Sensors Technician the calibration of oxygen sensors in
Dr. Burt’s Chemistry lab. Note: Dr. Burt’s specific project is helium recovery in the MRI area. • Aided Bryant Brown in locating a gas leak in room 336 of the CB. • Created 4 instructional videos on how to calibrate 1) Carbon Monoxide sensor 2) Combustible
Gas sensor 3) Oxygen sensor and 4) a Mercury Meter • Assisting in creating “What Would Cosmo Do?” flyers for programs within Industrial Hygiene. • Investigated various locations for asphyxiant hazards, identifying one location where gas sensors
are needed and are currently being installed • Assisted in 2 ergonomic assessments in Dining Services • Donated 2,370 KN-95 masks on campus for COVID-19 random testing. The remaining 500
donated KN-95’s went to the Carpentry department. • Assisted the Engineering Building by obtaining noise levels for pre and post installation of noise
reducing sheetrock to assist in the efficiency of the product • Created 15 “How to” videos of the Industrial Hygiene Lab equipment
Asbestos Projects
The following buildings/departments were tested or otherwise sampled: PH Seminary Building ISB SFH
Tunnels within the Purple line TMCB JFSB Tunnels within the Black line UPB SNLB
Tunnels under WSC WSC JKB BRWB BRMB ELLB
Other Sampling Includes:
• Silica sampling in the LSB lab • Assisted Bryant Brown in Nickel and Chromium sampling of a 3D metal printer
16

OCCUPATIONAL SAFETY
Occupational Safety manages the following: Accident Investigation OSHA Accident Reporting and Recording DOT and BYU CMV Programs Safety Training CPR and First Aid Classes VARC
Industrial Metrics 2021 Q1
2021 Q2
2021 Q3
2021 Q4
2021 TOTALS
2020 TOTALS
2019 TOTALS
RM Online Trainings Completed 5,435 - - - 5,435 * 17,086 CPR and First Aid Classes Taught 12 - - - 12 29 19 CPR and First Aid Certifications 56 - - - 56 134 319 New Online Safety Trainings Created 24 - - - 24 16 14 Existing Online Safety Trainings Modified 23 - - - 23 27 11 Special Graphic Design Projects 2 - - - 2 20 15 Box Truck Practical Exams Conducted 5 - - - 5 2 30 Corrective Actions Assigned 184 - - - 184 726 1,231 Corrective Actions Completed 184 - - - 184 709 1,213 OSHA Work Incidents Investigated 2 - - - 2 14 11 Other Work Incidents Investigated 90 - - - 90 177 89 DOT Driver Files Managed 74 - - - 74 * 249 New DOT Driver Files Created 37 - - - 37 * 26 VARC Cases Managed 20 - - - 20 149 225
*Information is currently unavailable due to change in systems and personnel
Quarter 1 Special Projects
1. BYU Online Training The Safety Team continued to spend a considerable amount of time during quarter 1 assisting with the transition from Ytrain to the Training LMS Absorb. After being integrated into absorb, many trainings were not running correctly, and the team needed to reconfigure them.
17

2. “What Would Cosmo Do?” The Safety Team continued to work on the “What Would Cosmo Do?” flyers. Additional completed flyers include: Asbestos, Electrical Safety, Laser Safety, Respiratory Protection, Indoor Air Quality, and Hazard Communication.
3. COVID-19 Members of the Safety Team continued to work on various COVID-19 projects including the WILK Covid-19 testing team.
4. Safety Supervisor Training A campus-wide safety training was approved, and the Safety Team has been working on the launch of the training. This includes reconfiguring the website, creating additional safety trainings, and creating a new safety training matrix.
5. LOTO Safety Audits Physical Facilities has invited the EHS director to conduct LOTO audits in their area.
6. LOTO Machine Specific Procedures The Safety Team has been assisting various departments in creating machine specific LOTO procedures. Particularly for the Physical Facilities, Grounds, and Dining Services departments.
7. Academic Lab Safety Training At the request of the Academic Campus Safety Committee and in collaboration with the Academic Safety Manager, the Safety Team created a general academic lab safety training. This training consists of 22 modules. The goal is to have all students who work in a lab on campus complete this general safety training to help mitigate accidents and incidents in labs across campus.
8. OSHA and BLS reports The required OSHA and BLS reports were completed, posted, and filed for 2020 per government requirements.
9. CDL Clearinghouse Queries Per the new DOT regulations, BYU has started to conduct Clearinghouse Queries for any new BYU CDL driver.
18

OSHA Reportable and Recordable Injuries
BYU employed approximately 18, 077 personnel (full and part-time, including part-time students) who worked an average of 5,197,119 labor hours from January 1-March 31, 2021. From the 97 reported workers’ compensation injuries in Q1 of 2021, 2 were OSHA reportable and 36 were OSHA recordable (including the 2 reportable injuries).
An injury becomes reportable when it meets OSHA qualifications for severe injuries. It must be reported within 8 hours and have an official BYU investigation (which may be sent to OSHA upon request). An injury is recordable when medical treatment extends beyond OSHA’s definition of first aid. All reportable injuries as also recordable. These injuries are included on BYU’s official OSHA logs. The following chart compares BYU’s OSHA injury rate from 2017-2021.
Injury Metrics 2021 TOTALS
2020 TOTALS
2019 TOTALS
2018 TOTALS
2017 TOTALS
Workers’ Comp Injury 71 260 465 449 398
Reportable Count 2 14 11 0 2
Recordable Count 36 127 202 199 177 Lost Time Cases 7 37 39 35 19
Total Days Away 74 572 539 457 281 Restricted Days Cases 7 51 87 81 63
Total Restricted Days 275 2,568 2,929 3,095 2,019
Total Case Incident Rate 1.38 1.19 1.80 1.79 1.6 Lost Time Incident Rate .26 .34 .35 .31 .17
Lost Workday Rate 2.84 5.38 4.81 4.11 2.54 Severity Rate 2.05 4.50 2.67 2.30 1.59
Days Away/Restricted .53 .82 1.13 1.04 .74
Lost Time Incident Rate – the number of lost time cases per 100 full-time employees in any given time frame. Lost Workday Rate – the number of lost workdays per 100 full-time employees in any given time frame. Severity Rate - the number of lost days experienced as compared to the number of incidents experienced. DART Rate (days away/restricted) - the number of recordable incidents per 100 full time employees that resulted in lost or restricted days.
19

48 43
51
35
52 44
63
40
51 56
52 43
30 34
41
22
36
QTR 1 QTR 2 QTR 3 QTR 4 2017 2018 2019 2020 2021
Quarterly Recordable Injuries 2017-2021
Quarterly Recordable Injuries
Quarter Q1 Q2 Q3 Q4 TOTALS 2017 48 43 51 35 177 2018 52 44 63 40 199 2019 51 56 52 43 202 2020 30 34 41 22 127 2021 36 - - - 36
TOTALS 217 177 207 140 741
20

1.60
0.17
2.54
1.59
0.74
1.79
0.31
4.11
2.30
1.04
1.80
0.35
4.81
2.67
1.131.19
0.34
5.38
4.50
0.82
1.38
0.26
2.84
2.05
0.53
TOTAL CASE INCIDENT RATE (TCIR)
LOST TIME CASE RATE (LTC)
LOST WORK DAY RATE (LWD)
SEVERITY RATE (SR) DAYS AWAY/RESTRICTED OR
JOB TRANSFER RATE (DART)
2017-2021 Safety Rate Comparison (Lower is Better)
2017 2018 2019 2020 2021
2017-2021 Safety Rate Comparison (Lower is Better)
Year Total Case Incident
Rate (TCIR)
Lost Time Case Rate
(LTC)
Lost Work Day Rate
(LWD)
Severity Rate (SR)
Days Away/Restricted or
Job Transfer Rate (DART)
2017 1.60 .17 2.54 1.59 .74 2018 1.79 .31 4.11 2.30 1.04 2019 1.80 .35 4.81 2.67 1.13 2020 1.19 .34 5.38 4.50 .82 2021 1.38 .26 2.84 2.05 .53
21
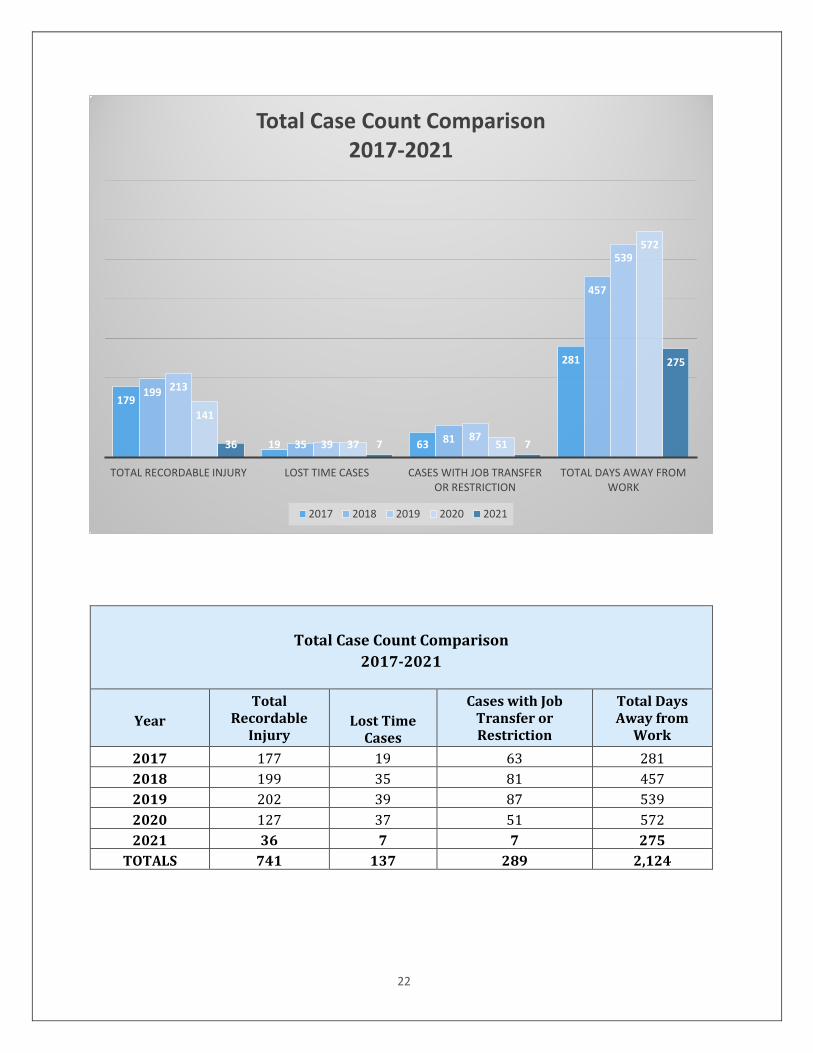
Total Case Count Comparison 2017-2021
179
19 63
281
199
35 81
457
213
39 87
539
141
37 51
572
36 7 7
275
TOTAL RECORDABLE INJURY LOST TIME CASES CASES WITH JOB TRANSFER TOTAL DAYS AWAY FROM OR RESTRICTION WORK
2017 2018 2019 2020 2021
Total Case Count Comparison 2017-2021
Year Total
Recordable Injury
Lost Time Cases
Cases with Job Transfer or Restriction
Total Days Away from
Work 2017 177 19 63 281 2018 199 35 81 457 2019 202 39 87 539 2020 127 37 51 572 2021 36 7 7 275
TOTALS 741 137 289 2,124
22

r
2021 OSHA Reportable Injuries
Department Date of Injury
Injury Description
Action Taken
OSHA Citation
Dining Services 2/26/2021 Fractured Finger Internal
Investigation No
Physical Facilities 3/17/2021 Partial Fingertip
Amputation OSHA
Investigation Pending
Currently, BYU has three OSHA citations that are within the 3-year period.
April 24, 2019 Machine Guarding Citation 1 Item 1 Type: Serious UAC R614-1-5.C.7 Employee bypassed a safety guard.
May 26, 2020 Lockout Tagout Citation 1 Item 1a Type: Serious 29 CRF 1910.147(c)(5)(i) Employer did not provide lock out equipment.
Citation 1 Item 1b Type: Serious 29 CFR 1910.147(e)(2)(i) During repairs, machine was not locked or tagged out.
Citation 2 Item 1 Type: Other-than-Serious 29 CFR 1910.147(c)(7)(i) Employer did not provide training.
As all of BYU shares the same EIN number, if any department at BYU receives another citation for the same provision within 3 years, BYU will not be eligible to receive a reduction agreement and the violation could be considered a serious repeat or willful violation.
Utah OSH Notification:
• UOSH contacted Risk Management and Safety with an official complaint notification on January 13, 2021. UOSH received an anonymous call that an employee in the BYU Store was not wearing a face cloth covering. Risk Management and Safety posted the compliant notification for the required three days and shared the mask regulations that BYU has in place with UOSH and the BYU Store management. No further action was taken.
• UOSH contacted Risk Management and Safety on March 10, 2021. They received an anonymous call that individuals in the BYU Creamery were not wearing face cloth coverings. At this time, UOSH did not have jurisdiction and asked us to work directly with Dining Services. Upon investigation, it was concluded that Dining Services was compliant with the BYU mask regulations including posting signs for customers.
23

2021 OSHA WC Recordable Injuries by Department/Unit-Campus Wide
Type of Injury 2021
Q1 2021
Q2 2021
Q3 2021
Q4 2021
Totals
Recordable Injuries 36 - - - 36 Days Away Cases 7 - - - 7 Days Away 97 - - - 97 Restricted Days Cases 7 - - - 7 Restricted Days* 275 - - - 275 Other Recordable** 22 - - - 22
Campus Department/Unit 2021
Q1 2021
Q2 2021
Q3 2021
Q4 2021
Totals
Athletics 1 - - - 1 BYU Broadcasting 1 - - - 1 BYU Store 3 - - - 3 College of Fine Arts 1 - - - 1 College of Life Sciences 1 - - - 1 Dean’s Office of Undergrad Studies 1 - - - 1 Dining Services 7 - - - 7 Physical Facilities 18 - - - 18 Physical and Math Sciences 1 - - - 1 Print and Mail Services 2 - - - 2 TOTALS 36 - - - 36
OSHA WC Recordable Injuries by Two Highest Departments
PHYSICAL FACILITIES
Type of Injury 2021
Q1 2021
Q2 2021
Q3 2021
Q4 2021
Totals
Recordable Injuries 18 - - - 18 Days Away Cases 1 - - - 1 Days Away 1 - - - 1 Restricted Days Cases 5 - - - 5 Restricted Days* 93 - - - 93 Other Recordable** 12 - - - 12
24

OSHA WC Recordable Injuries for Specific Areas within Physical Facilities
Area 2021
Q1 2021
Q2 2021
Q3 2021
Q4 2021
Totals
Building Care 5 - - - 5 Carpenter Shop 3 - - - 3 Grounds 5 - - - 5 Mechanical Shop 2 - - - 2 Paint Shop 2 - - - 2 Upholstery Shop 1 - - - 1 TOTALS 18 - - - 18
DINING SERVICES
Type of Injury 2021
Q1 2021
Q2 2021
Q3 2021
Q4 2021
Totals
Recordable Injuries 7 - - - 7 Days Away Cases 3 - - - 3 Days Away 34 - - - 34 Restricted Days Cases 1 - - - 1 Restricted Days* 101 - - - 101 Other Recordable** 3 - - - 3
OSHA WC Recordable Injuries for Specific Areas within Dining Services
Occupation 2021
Q1 2021
Q2 2021
Q3 2021
Q4 2021
Totals
Cannon Commons 1 - - - 1 Central Stores 1 - - - 1 MTC Dining 1 - - - 1 Retail Dining 4 - - - 4 TOTALS 7 - - - 7
*Restricted Days. This number also includes the restricted days in the Days Away Cases.
**Other Recordable. Incidents may fall under the other recordable group when the employee received care beyond OSHA’s definition of First Aid and did not miss any days from work nor have any work restrictions. Examples include receiving a prescription, getting stitches, and physical therapy.
25

OSHA WC Recordable Injuries by Causes, Body Part Injured, and Injury Type Q1 2021
Top 5 Recordable Injury Causes Cause Number of Recordable
Injuries Percentage of Injuries
Contact With 13 30.56 Struck By 8 22.22
Slip and Fall 5 13.89 Caught In, Under, or Between 3 8.33
Bending 2 5.55 Other 5 13.89 Total 36 100%
Top 5 Body Parts Injured in a Recordable Injury Body Part Number of Recordable
Injuries Percentage of Injuries
Finger/Thumb 11 30.56 Head 8 22.22
Leg (Knee, Foot) 5 13.89 Arm (Shoulder, Wrist, Hand) 4 11.11
Eye 3 8.33 Other 5 13.89 Total 36 100%
Top 5 Recordable Injury Types
Injury Types Number of Recordable Injuries
Percentage of Injuries
Laceration 8 22.22 Strain 7 19.44
Head Injury 6 16.67 Puncture 3 8.33
Burn 3 8.33 Other 9 25 Total 36 100%
26

Corrective Actions
184 Corrective Actions were assigned to help prevent future injuries and to address safety concerns from the incidents reported. Supervisors select the appropriate corrective actions and in general have two weeks to complete them. During the 1st quarter, 184 were completed. An additional 14 corrective actions from previous quarters were also closed. From the 184 corrective actions, the following Types of Corrective Actions were established.
Types of Corrective Actions 2021 Q1
2021 Q2
2021 Q3
2021 Q4
2021 TOTALS
Human Factor 65 - - - 65 Management Systems 65 - - - 65 Environmental Systems 26 - - - 26 Tools/Equipment 17 - - - 17 Other 11 - - - 11
In addition to the Types of Corrective Actions established, several other contributing factors were identified. In quarter 1, the most common contributing factor from the Human Factor group was Lack of Awareness on the part of the employee who was injured. The most common Management Systems corrective action chosen was Minimal Contribution.
0
50
100
150
200
250
300
18 15
101
189
0
77 38
27
178
2028 29
104
221
3
71
31 36
220
3031 30
112
258
7
98
55 29
225
2415 13
65
138
2
50 26 22
123
153 6 14 37
1 15 5 8 29
4
COU
NT
CORRECTIVE ACTIONS
2017 2018 2019 2020 2021
27

Vehicle Accident Review Board Decisions
Contributing Factors
Factor 2017 2018 2019 2020 2021 TOTALS Complacency 18 28 31 15 3 95 Did Not Follow Procedures 15 29 30 13 6 93 Haste/Rush or Hurried 101 104 112 65 14 396 Lack of Awareness 189 221 258 138 37 843 Unfit for Duty 0 3 7 2 1 13 Hazard Recognition 77 71 98 50 15 311 Improper/Inadequate Training 38 31 55 26 5 155 Inadequate Procedures 27 36 29 22 8 122 N/A Minimal Contribution 178 220 225 123 29 775 Oversight/Supervision 20 30 24 15 4 93
VARC (Vehicle Accident Review Committee) Cases
The number of reported incidents to Risk Management. (Incidents are not necessarily reported in quarter order and often contain incidents from previous quarters.) The VARC meets monthly to determine whether the incidents were preventable or non-preventable and assign consequences accordingly. In most cases where an individual has caused a preventable accident, a $200 fee is assessed to the department and the individual must complete a defensive driving class.
Vehicle Accident Review Committee Decisions
2021 Q1
2021 Q2
2021 Q3
2021 Q4
2021 TOTALS
2020 TOTALS
2019 TOTALS
2018 TOTALS
Incidents 21 - - - 21 120 225 203 Preventable 14 - - - 14 83 136 99 Non-Preventable 5 - - - 5 33 59 32 Not Applicable 2 - - - 2 5 30 71 Cause=Backing 6 - - - 6 43 46 21
Department of Transportation Summary Statistics
Official DOT statistics for BYU. This includes stops and accidents which may incur penalties of violations and/or citations. For the majority, these statistics apply to CDL drivers, but may also include a Non-CDL CMV driver.
BYU has approximately 53 CDL drivers and over 300 Non-CDL CMV drivers.
28

Department of Transportation Statistics
Statistics 2021 Q1
2021 Q2
2021 Q3
2021 Q4
2021 TOTALS
2020 TOTALS
2019 TOTALS
2018 TOTALS
2017 TOTALS
DOT Stops 0 - - - 0 0 0 5 3 Violations 0 - - - 0 0 0 3 2 OOS 0 - - - 0 0 0 0 0 Citations to BYU 0 - - - 0 0 0 0 0 Citations to Driver 0 - - - 0 0 0 0 0 DOT Crashes 0 - - - 0 0 0 0 0 DOT Reportable 0 - - - 0 0 0 0 0 DOT Audit 0 - - - 0 0 0 0 0
Department of Transportation Current Scores as of March 31, 2021
Unsafe Driving 0% Hours of Service (HOS) Compliance <3 insp. w/violations Driver Fitness <5 driver inspections Vehicle Maintenance <5 vehicle inspections Controlled Substances and Alcohol 0% Crash Indicator 0% ISS Inspection Score 65 ISS Recommendation Optional
29

FIRE AND LIFE SAFETY
The Fire and Life Safety area supervises and manages all aspects of fire and life safety on campus while complying with all applicable fire and building safety laws.
Items of Interest
• We finalized the testing and put together a plan to help with meeting the fire code regarding the emergency radio use in new and existing buildings. For the next ten years we will work towards bringing all the buildings on campus up to code.
• BYU and Provo City have been working together on how we can safely use BYU West (old Provo High School) during the construction phase of the new Harris Fine Arts Center. As always, we have a great working relationship with Provo City, and it looks like this work will move along without any issues.
• We have been working with FM Global and the Cogen plant on designing and installing a fire protection system that will help better protect the turbines. FM Global is a strong partner in our safety desires here on campus.
• We are right in the middle of designing and reviewing the plans for the new Harris Fine Arts Building. We are knee deep in the construction of the New Music building as well. It is exciting to see the work on campus move forward and with great cooperation of all involved.
• Special events continue to keep us busy with providing many hours of fire watch and covering other safety concerns.
• Cleanup and reorganization of the emergency management / fire extinguisher shop has been completed. Also, we have been repairing older equipment and bringing our fire extinguisher repair shop up to a more efficient running machine. As always, this work is done in a team focused effort; our student employees are amazing.
Life Safety Systems A physical inspection of equipment and systems designed to help protect building occupants during fires and other emergencies.
Descriptions 2021 Q1
2021 Q2
2021 Q3
2021 Q4
2021 TOTALS
Fire Extinguishers Inspected 1,258 - - - 1,258 Fire Department Connection Inspections 133 - - - 133 Fire Sprinkler Control Valve Inspections 795 - - - 795
• In addition to inspecting all these items, our students are responsible for maintaining and performing service and tests on all the extinguishers on campus.
30

Special Events
Risk Management personnel, under the direction of the Fire Marshall, serve at Special Events on campus to provide fire and life safety support and direction. These events range from Stadium of Fire to Athletic and Dance events. Due to COVID-19, some special events were cancelled in 2021.
Special Events 2021 Q1
2021 Q2
2021 Q3
2021 Q4
2021 TOTAL
S
2020 TOTALS
Events Covered 60 - - - 60 99 Event Shifts 65 - - - 65 150 Labor Hours 317.75 - - - 317.75 636.5
Hot Work Permits/Inspections
A hot work permit is required before beginning any temporary operation involving open flames or producing heat and/or sparks. There are locations on campus that have been designated as a hot work location and must be inspected monthly.
Descriptions 2021 Q1
2021 Q2
2021 Q3
2021 Q4
2021 TOTALS
2020 TOTALS
Temporary hot work permits issued 6 - - - 6 73 Permanent site inspections 48 - - - 48 162
Fire Safety Inspections and Reviews
An inspection or review performed to identify, assess, and mitigate potential fire and life safety hazards in buildings and on campus.
Descriptions 2021 Q1
2021 Q2
2021 Q3
2021 Q4
2021 TOTALS
2020 TOTALS
Whole Building Fire Safety Inspections 12 - - - 12 80 Fire Safety & Fire Extinguisher Training Classes 1 - - - 1 7 Plan Reviews 10 - - - 10 17 Spot Inspections 32 - - - 32 57 Student Housing Fire Drills 37 - - - 37 37
31

INFORMATION TECHNOLOGY
The Information Technology area provides focused attention to the IT needs of the Office of the General Counsel, Department of Risk Management and Safety, and the Integrity and Compliance Office. Our efforts allow those we support to focus on the jobs they were hired to do rather than general IT related tasks. We accomplish this with highly responsive, high quality help-desk service and a willingness to help in any way possible. We also support department objectives by developing high quality applications, websites, and services that are well organized, properly maintained, and highly functional.
Minor (Child) Protection Website and Application Most of the pages on the new Minor Protection website were created with content coming from Lisa Mortensen. We also created a word definition feature where certain words are marked with a styled underline. When a user hovers their mouse over the word, a definition pops up.
For the application, we completed the code and unit tests for automatically determining if a person is authorized for an event. We met with several end users who tested and gave a lot of very helpful feedback. From their feedback, we changed the form from a single page entry into a wizard with four sections. We also met with OIT several times discussing APIs for a couple of automation purposes. First is to help reduce data entry for groups that host a high number of events with an even higher number of staff. Second is to look-up employment and background check information. Scores of other changes were also completed.
Risk Website The Risk Tip content was re-created from the previous site including updated pictures. The FAQ pages were styled harmoniously. Photos were found for each safety program. We posted and attached many What Would Cosmo Do? trainings to their respective safety programs. Risk and Fire Safety content was improved. We began working with the safety group on training pages.
Litigation Site – Financials The site was put into production mid-January. We created matter and firm reports showing the invoice and costs for each matter or firm. We created an email approval process where the attorney responsible for an invoice receives an approval email. The litigation manager also receives an email notifying him about invoices ready for his approval. With these and a several other enhancements, this phase of the project ended.
The next project phase is migrating the litigation site from AWS into Mendix alongside th e financials. We planned the migration, created the entities, and began work on the main case page. We anticipate completing this phase by end of May.
Audit Request Manager We converted several text fields into lookup fields that search non-student employees from the University APIs. Some field alignment issues were fixed. We also began work on an email approval process with data stewards and custodians.
32

Server Upgrades The final Linux servers were upgraded to the latest OS.
METRICS
Help Desk Productivity - Service Tickets
54
46 45
83
19.98
41 39 38
93
43.82
52 48 46
88
50.55 46 48
33
72 70.2
# OPENED # CLOSED # OPENED AND CLOSED PERCENT OPENED AND AVG DAYS OPEN IN SAME PERIOD CLOSED SAME PERIOD
2020 Q2 2020 Q3 2020 Q4 2021 Q1
These numbers represent issues that are not resolved within the same day and need to be communicated to other team members. The lower Q2-4 numbers reflect the workflow disruption from COVID-19 and a change in the nature of the requests we received. Even though similar levels of issues were resolved, more were solved same-day and hence not tracked.
Help Desk Productivity – Service Tickets
Descriptions # Opened # Closed # Opened and Closed in the Same Period
Percent Opened and Closed in the Same Period
Average Days Open
2020 Q2 54 46 45 83 19.98 2020 Q3 41 39 38 93 43.82 2020 Q4 52 48 46 88 50.55 2021 Q1 46 48 33 72 70.2
33

CSR Lead Time – Histogram
Days From Initial
Notice to Resolution
Number of
Resolved Items
0-7 14 7-14 9
14-21 3 21-28 0 28-35 2 35-42 1
Lead time is how quickly issues are resolved from the time they are entered into the system.
Development - Productivity
108 18
413
82.6
229
15.3
618
41.2
224
7.2
607
186
10.2
401
204
9.7
379
20.9 23.6 21.1
ITEMS AVG ITEM VELOCITY STORY POINTS AVG STORY VELOCITY
2020 Q1 2020 Q2 2020 Q3 2020 Q4 2021 Q1
Items and Story Points are completed work summed across all sprints. The average velocity is by sprint.
34

Development - Productivity
Statistics Measured:
Items Average Item Velocity
Story Points Average Story Velocity
2020 Q1 108 18 413 82.6 2020 Q2 229 15.3 618 41.2 2020 Q3 224 7.2 607 20.9 2020 Q4 186 10.2 401 23.6 2021 Q1 204 9.7 379 21.1
35

INSURANCE SERVICES, RISK MANAGEMENT & RISK ASSESSMENT
Insurance Services The Insurance Services Office analyzes and administers the insurance and bonding needs of the three BYU campuses and Ensign College separately from and in addition to the property and casualty (liability) insurance policies and self-insure and risk retention programs provided to the universities and college by the Church Risk Management Division.
Additionally, in conjunction with the university’s recently revised Legal Documents Policy, the Insurance Services Office reviews all contracts and agreements of the University to ensure that the insurance, indemnity (hold harmless, duty to defend, indemnification, etc.), and legal liability language and provisions comply with the risk and insurance appetite and position of the University.
Certificate of Insurance Processes – Year-over-Year Comparison
• The Insurance Services Office manages the insurance verification process for the University, which includes providing proof of insurance coverage (Certificates of Insurance) on behalf of the University.
• The Insurance Services Office also verifies the insurance position of third-party companies working with the University including contractors and architect partners, caterers, concessionaires, livery businesses, and other miscellaneous vendors and contractors.
Certificates of Insurance 2021
Q1 2021
Q2 2021
Q3 2021
Q4 2021
TOTALS 2020
TOTALS 2019
TOTALS Issued by BYU 21 - - - 21 113 224 Received/Reviewed by BYU 200 - - - 200 76 -
Contracts Reviewed for BYU – Year-over-Year Comparison
2021 Q1
2021 Q2
2021 Q3
2021 Q4
2021 TOTALS
2020 TOTALS
2019 TOTALS
115 - - - 115 459** 658 **Due to the COVID-19 pandemic, these numbers declined significantly due to the cancellation of many events and activities.
Insurance Related Notwithstanding ongoing COVID-19 related issues or concerns, the Office of Insurance Services in the Risk Management Department completed the following insurance-related tasks this past quarter: • Successfully negotiated renewal terms for the 2021-2022 Cyber-security/Cyber-liability (BYU
specific), Fine Arts and Special Collections, Crime, Media Errors & Omissions, Internship and Experiential Learning, Athletic Trainers, and other casualty and professional liability insurance policies for BYU and for select risks and exposures at the BYU-Idaho, BYU-Hawaii, and Ensign College campuses.
• Continued working closely with BYU-Hawaii on several specific insurance projects. • Engaged with BYU Broadcasting on two specific insurance-related projects.
36

• Coordinated the insurance renewal application process for the Business Travel Accident insurance policy.
Other Activities • Additionally, the office coordinated and led an ad hoc committee for the purposes of reviewing
risk and insurance related exposures and concerns associated with a new automated Independent Contractor Approval process.
• The office also participated in multiple ad hoc sub-groups or sub-committees for the express purpose of revising several key template agreements and university policy.
• Additionally, the office participated in multiple scheduled sessions of the URMIA, 2021 Virtual Spring Conference.
• Financial Assistant Kathy McFarland completed the Employment Law class in the Human Resources Professional Certificate Program through the University of Utah.
37
Risk Management
Risk Management is an important business practice, which helps identify, evaluate, analyze, monitor, manage and mitigate the risks and potential risks present in the University’s business environment. This includes risks related to BYU physical property, personnel, students, visitors, departments, and volunteers.
Minor Protection Program
The Minor Protection Program was assigned to the Risk Management and Safety Department in mid-second quarter of 2020. The following activities were completed during the first quarter of 2021.
Minor Protection Policy
The Minor Protection Policy draft was presented and reviewed by the Faculty Advisory Council and policy owners. The draft underwent revisions based on feedback from the Faculty Advisory Council, policy owners, and information received while seeking a data share agreement with the Church Educational System for Ecclesiastical Clearances. These revisions include: • The definition of the Minor Protection Registration System was adjusted to better reflect its
purpose. • Risk Management is clearly given the responsibility of authorizing adults to interact with minors. • The Ecclesiastical Clearance requirement was removed from the policy. • Removal of language associated with Childcare Services on campus
All revisions were reviewed by BYU’s Office of the General Council and Risk Management. The revisions were found appropriate for the purpose and scope of the Minor Protection Policy. The draft is ready for review by the Office of Integrity and Compliance.
Minor Protection Registration System
• Sprint meetings with Risk Management IT were held every two weeks throughout the first quarter. Each meeting provided great progress on the development of the Minor Protection Registration System. The development of the system included testing of the system by users outside of Risk Management. Three members of the Child Protection Compliance Committee agreed to test the system. Valuable feedback was provided and adjustments were made to the system.
• Integration of the Minor Protection Registration System with registrations systems used by Continuing Education, Sports Camps and Human Resources commenced with initial and follow up meetings with BYU OIT. Background work for Data Share Agreements and API developments continued through the quarter. A denied Data Share Agreement request with Church Education System Endorsements resulted in the removal of Ecclesiastical Clearances as a requirement for Authorized Adults.
38

Incidents and Claims Reporting
Through BYU’s incident reporting website and SharePoint, Risk Management’s Incident Services receives reports of general incidents, general injuries, property loss, auto losses, general liability incidents and workers compensation claims. Upon receipt, the incidents are submitted as claims to Church’s Risk Management Department (CRMD) through their Global Incident Reporting system. The property loss claims, workers compensation claims, select general liability claims and auto loss claims are adjusted by Sedgwick Claims Management Services, Inc., a contracted third-party claims administration corporation.
During the first quarter of 2021, the Risk Analyst and Incident Assistants reviewed and processed the following incidents per Riskonnect and Sharepoint:
INCIDENTS AND CLAIMS 2020 – 2021
Type of Incident
2021 Q1
2021 Q2
2021 Q3
2021 Q4
2021 TOTALS
2020 Q1
2020 Q2
2020 Q3
2020 Q4
2020 TOTALS
Auto Prop Dmg 16 - - - 16 42 21 26 27 116 Auto Liability 4 - - - 4 11 4 8 17 40 EFY 0 - - - 0 0 0 0 0 0 FSY 0 - - - 0 0 0 0 0 0 General Incident 12* - - - 12* 4* 1* 6* 3* 14* General Injuries 56* - - - 56* 167* 4* 39* 34* 244* General Liability 4 - - - 4 2 4 8 2 16 Property-Loss 8 - - - 8 12 12 20 8 52 Workers Comp 71 - - - 71 76 67 70 45 258 Totals 171 - - - 171 314 113 177 136 740
(*Per Sharepoint) (Property-Loss includes PC/PD claims)
Workers’ Compensation Incidents & Claims
In the first quarter of 2021, BYU Risk Management’s incident office received 71 workers compensation incidents/claims. This is a .07% decrease from the 76 incident/claims reported in the first quarter of 2020. The average number of incident/claims in the first quarter for the last five years is 98.
The second quarter of 2019 remains the highest number of claims reported (141) in a single quarter for the last five years.
The following workers compensation claims/incident numbers were obtained from Riskonnect.
39

Workers Compensation Incidents/Claims 2017 - 2021
YEAR Q1 Q2 Q3 Q4 TOTALS
2017 99 83 126 90 398
2018 131 100 136 82 449
2019 115 141 113 96 465
2020 76 68 71 45 260
2021 71 - - - 71
WORKERS COMPENSATION CLAIMS & INCIDENTS 2017 - 2021
99 131 115
76 7183 100 141
68 126 136 113
7190 82 96 45
398 449 465
260
71
2017 2018 2019 2020 2021
Q1 Q2 Q3 Q4 Totals
Risk Assessment & Analysis Services
Risk Assessment and analysis is a review of policies and practices, contractual risk transfer, facility inspections, risk surveys, staff interviews, gathering and interpreting statistical findings, and providing recommendations.
Event Review and Approval (off and on campus) BYU departments or organizations may submit online event approval requests through risk.byu.edu. Risk Management staff review and assess the event requests and grant contingency approval. A component of that approval includes vetting non-BYU vendors to ensure that they are in good standing and possess appropriate financial resources to honor their indemnification obligations.
Event ROL waivers were created for all BYU affiliated departments, organizations, and groups. “Assumption of Risk” language was added to the waivers for all SWELL classes.
40

Type of Request 2021
Q1 2021
Q2 2021
Q3 2021
Q4 2021
TOTALS 2020
TOTALS
Volunteer Waivers 5 - - - 5 13 Liability Release Waivers 24 - - - 24 82 Sponsorship Applications 0 - - - 0 7 Travel Exceptions 15 - - - 15 294 Travel Exception Denials 0 - - - 0 0 Unmanned Aircraft System (UAS)
7 - - - 7 31
Due to the impact of COVID-19 and the restrictions of on-campus events and activities, during the first quarter of 2021, Risk Management Event staff processed the following:
Action Processed 2021 Q1
2021 Q2
2021 Q3
2021 Q4
2021 TOTALS
2020 TOTALS
Events Requested 116 - - - 116 293 Events Held 98 - - - 98 266 Events Approved/Cancelled *(COVID-19) 0 - - - 0 11
Concussion Protocol
Prior to first quarter of 2021, the concussion protocol was managed by the Safety Management Department. This responsibility has been transferred to the Risk Management Incident office.
The following paragraphs are excerpts taken from BYU’s Concussion and Head Injury Policy (Policy.BYU.edu).
“Brigham Young University recognizes the seriousness of concussions and head injuries and takes seriously its obligation to address concussions and head injuries suffered by individuals participating in university-sponsored sports and other activities. In Utah, the Protection of Athletes with Head Injuries Act requires “amateur sports organizations,” which may include the university, to adopt and enforce a concussion and head injury policy.
This policy requires all campus departments to take steps to prevent and address concussions and head injuries in sports and other university activities. This policy shall be made available to all students; parents of minors participating in sports-related university programs; and university faculty members, employees, representatives, and volunteers.
After being suspected of sustaining a concussion or a traumatic head injury, a student or child may not return to any sporting event until the student or child is evaluated by a qualified health care provider and provides the university with a written statement from the qualified health care provider. The written statement must affirm that (1) the provider has, within three years before the
41

date on which the written statement is made, successfully completed a continuing education course in the evaluation and management of a concussion, and (2) the student or child is cleared to resume participation in the sporting event.”
Upon receipt of notification by the Risk Incident office of an incident confirming a head injury that could have resulted in a concussion, the individual is added to a concussion tracking list. The Risk Incident office sends a notification email to the individual with copies to all relative parties at BYU (e.g., Athletics, Residence Life, Intramurals, Extramurals, Student Wellness, etc.).
Information along with appropriate forms are provided to the individual to assist with obtaining clearance to resume participation in sporting events and activities from a qualified health provider. Once the Incident office receives confirmation of clearance from the health provider, the concussion tracking list is updated accordingly, and notice is sent out to advise the relative parties and the individual.
CONCUSSION PROTOCOL
Action Processed 2021
Q1 2021
Q2 2021
Q3 2021
Q4 2021
TOTALS 2020
TOTALS
Head Injury Notifications Sent 16 - - - 16 83 Head Injuries Cleared 33 - - - 33 33 Reminder Notifications Sent 99 - - - 99 -
42