2020FY Results Presentation
23
2020FY Results Presentation 18 March 2021
Transcript of 2020FY Results Presentation

2020FY Results Presentation
18 March 2021

22020FY Results Presentation
Disclaimer
FORWARD LOOKING STATEMENTS
This presentation contains forward-looking statements regarding future events and the future results of Rai Way that are
based on current expectations, estimates, forecasts, and projections about the industries in which Rai Way operates, as well
as the beliefs and assumptions of Rai Way’s management. In particular, certain statements with regard to management
objectives, trends in results, margins, costs, rate of return and competition tend to be forward-looking in nature. Words such
as “expects”, “anticipates”, “targets”, “goals”, “projects”, “intends”, “plans”, “believes”, “seeks” and “estimates”, variations
of such words and similar expressions, are intended to identify such forward-looking statements. These forward-looking
statements are only predictions and are subject to risks, uncertainties, and assumptions that are difficult to predict because
they relate to events and depend on circumstances that will occur in the future. Therefore, Rai Way’s actual results may
differ materially and adversely from those expressed or implied in any forward-looking statements. They are neither
statements of historical fact nor guarantees of future performance. Rai Way therefore cautions against relying on any of
these forward-looking statements. Factors that might cause or contribute to such differences include, but are not limited to,
economic conditions globally, the impact of competition, political, economic and regulatory developments in Italy. Any
forward-looking statements made by or on behalf of Rai Way speak only as of the date they are made. Rai Way undertakes
no obligation to update any forward-looking statements to reflect any changes in Rai Way’s expectations with regard
thereto or any changes in events, conditions or circumstances on which any such statement is based.

32020FY Results Presentation
Rai Way participants
● Aldo Mancino, Chief Executive Officer
● Adalberto Pellegrino, Chief Financial Officer
● Giancarlo Benucci, Chief Corporate Development Officer

42020FY Results Presentation1) Leases impact estimated as sum of leasing right of use depreciation (excl. dismantling) + financial charges on leasing contracts
2) Recurring FCFE = Adj. EBITDA – Leases – Net Financial Charges – P&L Taxes – Recurring Maintenance Capex
Adj. EBITDA margin (2019-20 pre and after leases1)
RECURRING FCFE1,2NET INCOME
33,6
38,941,8
56,359,7
63,4 64,0
2014 20162015 20192017 20202018
2014 2015 2016 2017 2018 2019 2020
60,6%
53,4%50,7% 51,5% 51,7%
54,3% 55,0%
59,3%
56,2%
+550bps
63,467,9 69,7
77,574,6
77,5
88,9
202020162014 20182015 2017 2019
Adj. EBITDA (2019-20 pre and after leases1)
105,1109,3 111,3
115,5118,3
2019
121,8
20152014 20172016 2018
126,2
2020
131,2136,1
Sequential growth since IPO
Pre leases
After leasesPre leases
After leases
Mln Eur; %

52020FY Results Presentation
1) Dividend yield based on market closing price on 17/03/2021 (4,73 €/share)
● 2020FY results above expectations, also helped by temporary cost reduction from pandemic safety and recovery measures:
o Adjusted EBITDA up +3,7% with profitability at 60,6% (+130 bps)
o Development capex ramping up driven by refarming
o Highest recurring cash generation ever at ca. 90m
● 23,85 €/cent dividend proposed to the AGM, equal to 100% pay-out and 5,0% dividend yield(1)
RESU
LTS
● 2020-23 Industrial Plan approved
● Refarming activities for RAI proceeding to meet process deadlines; Rai Way awarded with local frequencies in
Lombardy and Piedmont
● Solid ex-MNOs third party performance, with mid-single-digit volumes growth supported by FWA
OP
ER
ATI
NG
● New € 170m financing fully covering funding needs related to the Industrial Plan 2020-23
● € 20m buyback program completed
FIN
AN
CIA
L
● Approval of first Sustainability Plan
ESG
● 2021 guidance reflects step-up in RAI contract in 2H, driving further recurring EBITDA improvement
● Commitment to Industrial Plan execution fully confirmed, ongoing set-up of new initiatives
OU
TLO
OK
Key messages on 2020

62020FY Results Presentation1) Sources: EY report, October 2020
Role of traditional TV confirmed
● Increased video consumption fuelled by the pandemic impacted all platforms, confirming the resilience and social role oftraditional TV
● New platforms not replacing but complementing DTT in viewers’ consumption habits, with traditional TV supported by liveevents & contents addressing large concurrent audience (typical of broadcasters)
10,0 10,19,9
11,0
9
10
11
12
2017 2018 2019 2020
Linear TV (DTT) audience in Italy OTT platforms users in Italy
9,4
13,4
2019 2020
OTT subscribers watching traditional TV(1)
Auditel, Target: Individuals aged 4+ - Time: 02:00-02:00
19,2
26,9
20202019
Subscribers SVODAVG monthly unique
users BVOD
RAI analysis based on Ampere Analysis Markets and Audiweb dataMln avg day Mln
~90%

72020FY Results Presentation
Update on refarming
8
37
60
45
2019 20212020 2022
● So far, RAI awarded 2 MUX through “conversion” andadditional capacity equivalent to 0,5 MUX
● Awarding of residual capacity (4 slots of 0,5 MUX)expected within 3Q2021
● National MUX coverage extension
o Ca. 400 new sites activated as of December 2020 and500+ as of today (out of 600 in the final configuration)
● New macro regionalized UHF “DVB T2” MUX & National MUX upgrade to DVB-T2
o Permitting & procurement
o Installation of antennas & active equipment started
ca. € 45m
spent so far
Main activitiesRefarming Capex evolution
€ 150m
Total capex for RAI refarming project (based on 3 MUX)

82020FY Results Presentation1) Maintenance capex excluding component related to IFRS-16 leasing
2) Cash conversion = (Adj. EBITDA - Leases – Maintenance Capex) / (Adj. EBITDA – Leases). Leases estimated as sum of leasing right of use depreciation (excl. dismantling) + financial charges on leasing contracts
2020FY Financial highlights
Core Revenues Adjusted EBITDA Net Income
Capex (1) Net debt (Net Cash) Cash conversion(2)
59,4%
16,2
Adjusted EBITDA margin
4,1
221,4 224,5
2019FY 2020FY
+1,4%
17,2
48,318,1
12,3
Development
& M&A
2019FY 2020FY
Maintenance
35,3
60,6
2019FY
85,1%
2020FY
90,3%
131,2 136,1
59,3%
2020FY
60,6%
2019FY
+3,7%
63,4 64,0
2019FY 2020FY
+1,0%
9,5
46,1
2019FY 2020FY
Net Debt / 1-y rolling Adjusted EBITDA
0,07x0,34x
Mln Eur; % % YoY growth
Maintenance on core revenues ratio
8,2% 5,5%

92020FY Results Presentation
Core RevenuesMln Eur; % % YoY growth
● Negligible benefit from CPI on fixed contract
● Contribution from New Services rose by 3,8m in 2020 (excl. one-off & una tantum
components) supported by refarming-related projects and DAB, despite more
gradual MUX coverage extension
- New services
Third-Parties
+1,7%
-0,1%
10,9
33,2 33,2
180,4
7,8
2019FY
180,4
2020FY
221,4 224,5+1,4%
● Excluding one-off items, recurring third-party revenues only marginally down
(-0,9%) vs 2019 driven by:
o Mid-single-digit growth of non-MNOs, supported by FWA
o More balanced third-party customers portfolio (non-MNOs now
representing more than 40% of total third-party revenues)
2,7
4,45,5
6,9
10,7
2020FY2018FY2016FY 2017FY 2019FY
New services recurring contribution (excl. one-offs and una tantum components)
Mln Eur
2,2
2,5
2,8
2,5
1Q
2Q
3Q
3,24Q
3,3m from
MUX
coverage
extension

102020FY Results Presentation
Opex (excluding non-recurring)
Mln Eur; % % YoY growth
45,8 43,5
45,345,5
2019FY
88,9
2020FY
Personnel costs
Other Operating
costs
91,1-2,4%
-5,1%
0,4%
● Also excluding capitalization and non-core items, underlying
personnel cost broadly stable vs. 2019 with reduction driven by
Covid-related measures offset by other temporary factors
● Other Opex performance largely driven by temporary reduction due to
pandemic and related measures (main impacts on Energy, Maintenance
and Travel)
● On a recurring basis, costs related to implementation of new services offset
by lower energy price and efficiencies on connectivity capacity rental
Stable opex underlying performance when excluding non-core
and temporary impacts (mainly from pandemic measures)

112020FY Results Presentation1) Including provisions
P&L
Eur Mln, % 4Q 2019 4Q 2020 % YoY 2019FY 2020FY % YoY
Core Revenues 55,7 56,4 1,4% 221,4 224,5 1,4%
Other Revenues & income 0,9 0,5 0,9 0,5
Adj. EBITDA 30,6 31,5 2,9% 131,2 136,1 3,7%
% margin 55,0% 55,9% 59,3% 60,6%
Non recurring costs 0,0 0,1 -0,1 -1,0
EBITDA 30,6 31,6 3,4% 131,1 135,1 3,1%
% margin 55,0% 56,0% 59,2% 60,2%
D&A(1) -10,9 -12,9 18,2% -41,0 -45,7 11,5%
Operating Profit (EBIT) 19,7 18,7 -4,9% 90,1 89,4 -0,8%
Net financial income (expenses) -0,2 -0,4 80,8% -1,3 -1,1 -12,1%
Profit before Income taxes 19,4 18,3 -5,9% 88,8 88,3 -0,6%
Income Taxes -5,8 -5,1 -11,1% -25,5 -24,3 -4,6%
% tax rate 29,6% 28,0% 28,7% 27,5%
Net Income 13,7 13,2 -3,7% 63,4 64,0 1,0%
● 2020 Net Income up by 1,0% at € 64,0m as
a result of:
o Higher Adjusted EBITDA, with profitability
exceeding 60%
o € 1,0m one-off costs in 2020 related to
voluntary layoff incentive
o Higher D&A following rising investment
activity and 2019 figure positively
impacted by € 1,5m release of
provisions
o Tax rate at 27,5% mainly benefitting
from a one-off Covid-related tax relief

122020FY Results Presentation
1) Excluding component related to IFRS-16 leasing
2) P&L taxes
3) P&L financial charges excluding interests on employee benefit liability and interests on leasing contracts
4) Including impact of renewal of leasing contracts and interests on leasing contracts
Net Debt bridgeMln Eur Net Debt/ 1y rolling Adj. EBITDA
9,5
46,1
Net Debt 2020YE
60,6
Net Debt2019YE
(135,1)
EBITDA
20,0
Capex(1)
24,3
Taxes(2)
0,5
Financial charges(3)
(5,8)
Δ NWC
8,8
Funds &Other(4)
Buyback
63,3
Dividend payment
0,07x
0,34x
IFRS-16 Debt
Gross Debt
Cash&Eq
35,4m
15,4m
-4,7m
Including € 48,3m
development capex, of
which ca. € 4m in small M&A

132020FY Results Presentation
2020 Recurring cash generation and dividend proposal
Eur/cent
● Dividend proposal of 23,85 €cent/share (pay-out ratio of 100%
of Net Income), with a dividend yield(3) of 5,0%
● Including the proposed dividend for 2020, approx. € 357m
distributed to Shareholders since listing
DIVIDEND PER SHARE
12,34
14,3215,37
20,26
21,9623,29 23,85
2020420172014 2015 20182016 2019(2)
Dividend proposal
Developm. Capex &
M&A
Buyback
20
48,3
Dividend proposal
64
1) Recurring FCFE = Adj. EBITDA – Leases – Net Financial Charges – P&L Taxes – Recurring Maintenance Capex. Leases estimated as sum of leasing right of use depreciation (excl. dismantling) + financial charges on leasing contracts
2) P&L financial charges excluding interests on employee benefit liability and interests on leasing contracts 3) Dividend yield based on market closing price on 17/03/2021 (4,73 €/share)4) Dividend proposal
TaxesAdj. EBITDA– Leases1
(25)
Financial charges2
(12)
Maint. Capex
Recurring FCFE1
89
(1)
126
Mln Eur

142020FY Results Presentation
2023 Sustainability Plan reinforces the commitment towards ESG+I
14
ENVIRONMENT SOCIAL GOVERNANCE INNOVATION
Maingoals and activities
● Reduce energy
consumption and greenhouse gas emissions
● Promote a climate-friendly culture among stakeholders
● Improve management systems to reduce environmental impacts
Targets
● 100% renewable electricity
● 99% waste recovery2
● € 100+ investments in more efficient equipment
● Carbon Neutrality by 2025(1)
1) Based on scope 1+2 CO2 emission
2) With respect to total waste generated excluding septic sludge (non-recoverable).
● Enhance diversity and ensure inclusion and work-life
balance
● Expand the accessibility to digital services and increase social and cultural initiatives for the community
● Ensure high standards in terms of health and safety at work
● Electromagnetic emissions compliance and reduction of landscape impact
● Ensure the respect of Privacy and Data Security
● Adhere to external standardsrelated to ethics and anti corruption (es. UN Global Compact)
● Ensure diversity of mgnt and control bodies
● Integrate ESG principles throughout the supply chain
● Strengthen the sustainability governance frameworks
● Enable the technological and digital evolution of
the company and its stakeholders
● Invest in research and development for innovative uses of infrastructure
● Strengthening skills for digital innovation
● 35% women in mgnt roles
● agile working scheme up to 45% of employees
● DTT coverage improvement for 1000+ Italian municipalities
● 80% of registered suppliersto be engaged on ESG issues
● 20% ESG goals within the soon to come LTI plan
● About € 200 mto be invested in technological evolution projects and in digital transformation
2020 achievements
● 100% green electricity
● 99,1% waste recovery
● -36% CO2 emissions
● 45% employees working from home during Covid-19 pandemic
● Responsibilities of the BoD’sRisk Control Committee extended to ESG issues
● € 40+ m development capex spent (eg.refarming)
152020FY Results Presentation
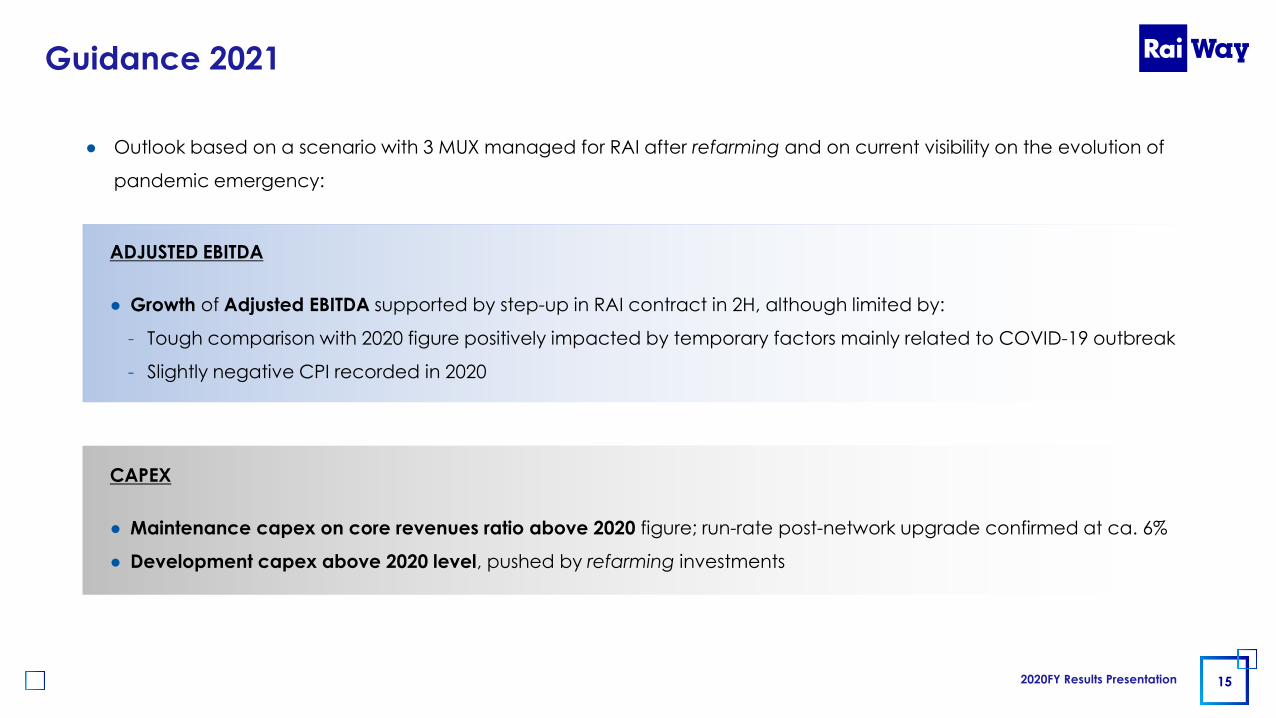
Guidance 2021
ADJUSTED EBITDA
● Growth of Adjusted EBITDA supported by step-up in RAI contract in 2H, although limited by:
- Tough comparison with 2020 figure positively impacted by temporary factors mainly related to COVID-19 outbreak
- Slightly negative CPI recorded in 2020
CAPEX
● Maintenance capex on core revenues ratio above 2020 figure; run-rate post-network upgrade confirmed at ca. 6%
● Development capex above 2020 level, pushed by refarming investments
● Outlook based on a scenario with 3 MUX managed for RAI after refarming and on current visibility on the evolution of
pandemic emergency:

162020FY Results Presentation1) Assuming similar CPI total contribution
2) Yields based on market closing price on 17/03/2021 (4,73 €/share)
Unchanged ambitions
Contractualized revenues provide high visibility and cash
generation
Resiliency of business model proven also during pandemic
emergency
In a potential inflationary environment,
direct benefit from CPI-linked contracts (1% CPI → ca. 2m EBITDA)
Limited impact in case of rising interest
rates (top-line not directly linked to
economic cycle, limited debt)
Industrial Plan financial target confirmed(1), with higher organic growth approaching driven by
refarming and digital transformation
Intact commitment to Industrial Plan execution and capital allocation to
enhance long-term growth and shareholders’ return (new services
and asset expansion)
At current perimeter, recurring FCFE yield @ ~8% on 2023
Industrial Plan target(2)

172020FY Results Presentation
Q&A session

182020FY Results Presentation
Contacts
- Investor Relations
+39 06 331 73973
+39 06 331 74815

192020FY Results Presentation
Appendix

202020FY Results Presentation1) Including long-term financial items and the rights of use for leasing introduced from 2019 with the application of IFRS 16
2) Net funds include employee termination indemnities, provision for risks and deferred taxes
Balance sheetMln Eur
46,1
210,9
251,4
Net Fixed Assets(1) NetWorking Capital
(26,6)(13,8)
Net Funds(2) Net Invested Capital
Net Debt
164,8
Equity Book Value
Including rights of use for leasing
under IFRS-16 (€ 32,5m)

212020FY Results Presentation
Detailed summary of Income Statement
(€m; %) 4Q19 4Q20 FY19 FY20
Core revenues 55,7 56,4 221,4 224,5
Other revenues and income 0,9 0,5 0,9 0,5
Purchase of consumables (0,4) (0,4) (1,2) (0,9)
Cost of serv ices (12,1) (11,2) (42,2) (39,7)
Personnel costs (12,6) (12,8) (45,3) (46,5)
Other costs (0,9) (1,0) (2,6) (2,9)
Opex (25,9) (25,3) (91,3) (89,9)
Depreciation, amortization and write-downs (10,8) (12,6) (42,4) (45,4)
Prov isions (0,1) (0,3) 1,5 (0,3)
Operating profit (EBIT) 19,7 18,7 90,1 89,4
Net financial income (expenses) (0,2) (0,4) (1,3) (1,1)
Profit before income taxes 19,4 18,3 88,8 88,3
Income taxes (5,8) (5,1) (25,5) (24,3)
Net Income 13,7 13,2 63,4 64,0
EBITDA 30,6 31,6 131,1 135,1
EBITDA margin 55,0% 56,0% 59,2% 60,2%
Non recurring costs (0,0) 0,1 (0,1) (1,0)
Adjusted EBITDA 30,6 31,5 131,2 136,1
Adjusted EBITDA margin 55,0% 55,9% 59,3% 60,6%

222020FY Results Presentation
Summary of Balance Sheet
(€m) 2019FY 2020FY
Non current assets
Tangible assets 177,6 200,9
Rights of use for leasing 36,2 32,5
Intangible assets 14,3 15,9
Financial assets, holdings and other non-current assets 1,3 2,1
Deferred tax assets 2,7 2,8
Total non-current assets 232,1 254,2
Current assets
Inventories 0,9 0,9
Trade receivables 74,8 62,6
Other current receivables and assets 5,0 4,2
Current financial assets 0,3 0,7
Cash and cash equivalents 30,2 4,1
Current tax receivables 0,1 0,1
Total current assets 111,2 72,4
TOTAL ASSETS 343,3 326,6
(€m) 2019FY 2020FY
Shareholders' Equity
Share capital 70,2 70,2
Legal reserves 14,0 14,0
Other reserves 37,1 37,1
Retained earnings 62,9 63,5
Treasury shares - (20,0)
Total shareholders' equity 184,2 164,8
Non-current liabilities
Non-current financial liabilities 0,3 15,1
Non-current leasing liabilities 26,3 23,9
Employee benefits 14,4 13,2
Provisions for risks and charges 15,9 16,3
Total non-current liabilities 56,9 68,5
Current liabilities
Trade payables 54,3 45,5
Other debt and current liabilities 34,1 36,0
Current financial liabilities 0,2 0,3
Current leasing liabilities 13,3 11,5
Current tax payables 0,4 0,0
Total current liabilities 102,3 93,3
TOTAL SHAREHOLDERS' EQUITY AND LIABILITIES 343,3 326,6

232020FY Results Presentation
Summary of Cash Flow Statement(€m) 4Q2019 4Q2020 FY2019 FY2020
Profit before income taxes 19,4 18,3 88,8 88,3
Depreciation, amortization and write-downs 10,8 12,6 42,4 45,4
Prov isions and (releases of) personnel and other funds 1,5 2,0 2,4 5,1
Net financial (income)/expenses 0,2 0,4 1,0 0,9
Other non-cash items (0,7) 0,2 (0,7) 0,3
Net operating CF before change in WC 31,2 33,6 134,0 140,0
Change in inventories 0,0 0,0 0,0 0,0
Change in trade receivables 5,5 7,3 (3,6) 12,5
Change in trade payables 8,4 7,4 8,7 (8,7)
Change in other assets 2,3 0,8 0,8 0,8
Change in other liabilities (3,8) (6,1) (0,4) 2,0
Use of funds (0,9) (0,1) (1,2) (2,6)
Payment of employee benefits (0,8) (1,9) (3,2) (3,5)
Change in tax receivables and payables (0,0) (0,3) 0,2 (0,3)
Taxes paid (2,4) (2,3) (24,6) (24,0)
Net cash flow generated by operating activities 39,6 38,4 110,7 116,0
Investment in tangible assets (20,3) (24,2) (32,3) (55,7)
Disposals of tangible assets 0,9 - 0,9 -
Investment in intangible assets (2,3) (1,7) (3,0) (4,3)
Change in other non-current assets (0,0) (0,0) 0,1 0,1
Change in holdings - (0,5) - (0,5)
Change in non-current financial assets - (0,4) - (0,4)
Business combination - (0,5) - (0,5)
Net cash flow generated by investment activities (21,7) (27,2) (34,4) (61,3)
(Decrease)/increase in medium/long-term loans (0,1) 14,9 (0,2) 14,8
(Decrease)/increase in current financial liabilities (0,1) (20,6) (0,8) 0,1
(Decrease)/increase in IFRS 16 financial liabilities (1,1) (4,5) (2,3) (11,2)
Change in current financial assets (0,1) (0,2) (0,2) (0,4)
Net Interest paid (0,1) (0,3) (0,2) (0,8)
Buyback - (12,3) - (20,0)
Div idends paid - - (59,7) (63,3)
Net cash flow generated by financing activities (1,4) (23,0) (63,4) (80,8)
Change in cash and cash equivalent 16,4 (11,8) 13,0 (26,1)
Cash and cash equivalent (beginning of period) 13,8 15,9 17,2 30,2
Cash and cash equivalent (end of period) 30,2 4,1 30,2 4,1