Measuring social media: Benchmarking an individual Twitter timeline.

2020 Social Media Benchmarking
for Financial Services

2
It’s a question every financial marketer has on their minds:
How does my institution stack up? Are we beating the competition?
Social media and digital marketing are no longer novelties, but rather a (if not THE) core strategy for financial institutions of all sizes. For all of the transparency social media offers a brand, the sheer volume of data makes it challenging for marketers to know how they compare.
Denim Social is built to help regulated financial indus-tries be more effective on
social media. Our expertise, products and the conversations we have with financial marketers (like you!) give us unique insights to answer that all-im-portant question:
How are we doing on social media?
Here’s the great news: we analyzed the data so that you don’t have to. We worked with a first-class research team from Washington University in St. Louis to analyze more than 150,000 social media posts across financial services. That’s right, more than 150,000 posts.
Keep reading to find out how more than 400 financial institutions across asset
classes, geographies, and more used social media in 2020 to effectively
support their business objec-tives. We’ve also outlined key trends to inform your social media future.
Still want more?
If you’re still curious how your institution stacks up, let’s talk. The Denim Social team can complete a custom analysis on your financial institution’s social media and see how you compare to our benchmark data set.

3
So why does this matter to your financial institution?
At Denim Social, we believe benchmarking is an effective way to move beyond vanity metrics and towards offering tangible and actionable business insights. It’s our hope that you can use this report to gauge your social media performance and use data to create strategies that are relevant, actionable, realistic and, most importantly, drive your business results.
Unless you’re benchmarking your per-formance against your peers and com-petitors, you won’t have a standard point from which to gauge results. You need context to measure your success and identify areas for improvement. We want to help your institution move past likes, shares and followers. We want to help you unlock the true power of social media.
The 2020 Social Benchmarking for Fi-nancial Institutions report looked broadly at a institution’s social media activity and measured the following:
• Adoption • Presence
• Engagement • Content
And, from there, Denim Social bench-marked each financial institution against all others in the report, against its peers based on asset class, and against com-petitors in its region. This gave us two sets of data to work with when comparing institutions: raw numbers and percentiles.
About Our DataOur team of researchers from The Washington University in St. Louis Olin School of Business collected and ana-lyzed more than 150,000 social media posts to create this report.
Data was sourced from public social network profiles on Facebook, Twitter, Instagram and LinkedIn from 401 finan-cial institutions from January 1, 2020 through November 30, 2020. The FDIC was used to verify institution informa-tion. We primarily examined banks (268 institutions), but our data also looked at financial services and insurance organi-zations.
In more specific terms, adoption exam-ined if institutions had active profiles on each of the four major social media networks. Presence was a measure of page followers, likes and post frequency.Engagement focused on reactions, com-ments, and shares. Content was the most robust category, analyzing format (commonly used post media like photos, links and video) and topic.
After sufficient data was gathered and aggregated, it was broken out into sub-categories for the asset class and regional comparisons. Denim Social has segmented institutions by assets into three categories: Sub $500M AUM, $500M AUM - $1.5B AUM, and $1.5B + AUM.
The report also segmented banks by geography into four regions - Northeast, South, Midwest, and West. An overall comparison was conducted as well.
Methodology

4
If you’re reading this report, you likely see the value of social media, but before we dig into our benchmark data, let’s remember:
The Social Media Environment
WANT BRANDS TO USE SOCIAL MEDIA to facilitate a sense ofcommunity and offer social support during the pandemic2
in the U.S. get their news from social media according to Pew Research Center4
1/2+
BRANCH TRAFFICis predicted to be down1
OF ADULTS
BY 2022
84% 86%OF BABY BOOMERSuse social media on adaily basis3, which is only 3% less than Generation Z
-36%
1 https://thefinancialbrand.com/66228/bank-credit-union-branch-traffic/2 https://www.edelman.com/research/covid-19-brand-trust-report3 https://themanifest.com/social-media/how-different-generations-use-social-media4 https://www.journalism.org/2021/01/12/news-use-across-social-media-platforms-in-2020/

5
Adoption by AssetTo start, let’s get the lay of the land. Institutions of all asset classes are engaged on Facebook with adop-tion rates between 80-85%. LinkedIn gained ground at around 75% adoption rates, though smaller institutions were lagging. Twitter and Instagram still had not been adopted by the majority of institutions surveyed.
Adoption by IndustryLooking across industries, Facebook and LinkedIn led in platform adoption, though financial services was significantly behind on LinkedIn.
Key Findings: Adoption
There is opportunity for smaller institutions to increase their social media presence on LinkedIn. More on page 11.
> 1.5B
Banking
> 500M-1.5B
Financial Services
< 500M
Insurance Other
ADOPTION
ADOPTION
ADOPTION
ADOPTION
ADOPTION
ADOPTION
ADOPTION
ADOPTION

6
Follower by AssetLooking at baseline presence measures, it’s no surprise that bigger asset class institutions had significantly larger follow-ings. Interestingly, smaller asset class institutions boasted larger followings than medium-sized institutions.
Frequency by IndustryEvery community manager wonders how often they should be posting. Across the board financial services post-ed the most frequently and banking posted less frequently. Here’s what we found across channels and industries.
Key Findings: Presence
Social media shouldn’t just be territory of big finance players. Smaller asset class institutions and industries like insurance can benefit fromincreased social media presence.
> 1.5B
Banking
180K
220K
18
20
22
FacebookFollower
Avg. FacebookFrequency
TwitterFollower
Avg. TwitterFrequency
Avg. InstagramFrequency
InstagramFollower
LinkedInFollower
Avg. LinkedInFrequency
160K
200K
16
140K
14
120K
12
100K
10
80K
8
60K
6
40K
4
20K
2
0K
0
> 500M-1.5B
Financial Services
< 500M
Insurance
Other
Mon
thly
Pos
t Fre
quen
cy

7
There are two ways to measure engage-ment, absolute engagement and relative engagement. Absolute engagement measures the raw numbers themselves. Relative engagement compares engage-ment numbers to the financial institution’s number of follower networks to which the content is shared. Our benchmarking focused on relative engagement because
Engagement
Wondering who to prioritize channels? Check out what channels are driving the most engagement for insitutitions in your region.
this provided better insight into which institutions were best connecting with their followers instead of just a volume of people.
Engagement varied vastly by geography. West coasters dominated in LinkedIn reactions, demonstrating a much high-er user involvement with the platform. LinkedIn platform adoption was less varied regionally, meaning west coast financial institutions have an outsized engagement opportunity on the platform.
Engagement Ratio of Facebook & LinkedIn by Region
Facebook Reactions
Comments
Shares

8
From an industry perspective, banks outperformed and drove higher engagement rates on Facebook and especially, LinkedIn. If we look at asset class, the smaller, the better the engagement rate. This means there is significant opportunity for small banks to meaningfully engage audiences on Facebook and Linkedin.
Small can be mighty! Smaller asset class institutions have a greater engagement opportunity than their larger counterparts, especially on LinkedIn.
Avg. FB Engage Reaction
Avg. FB Engage Share
Avg. LI EngageReact
Avg. LI Engage Comment
Avg. LIEngageShare
Avg. FB EngageComment
1% 1%0% 0%
Engagement Ratio of Facebook & LinkedIn by Industry & Asset
Banking Financial Services
Insurance Other> 1.5B > 500M-1.5B < 500M
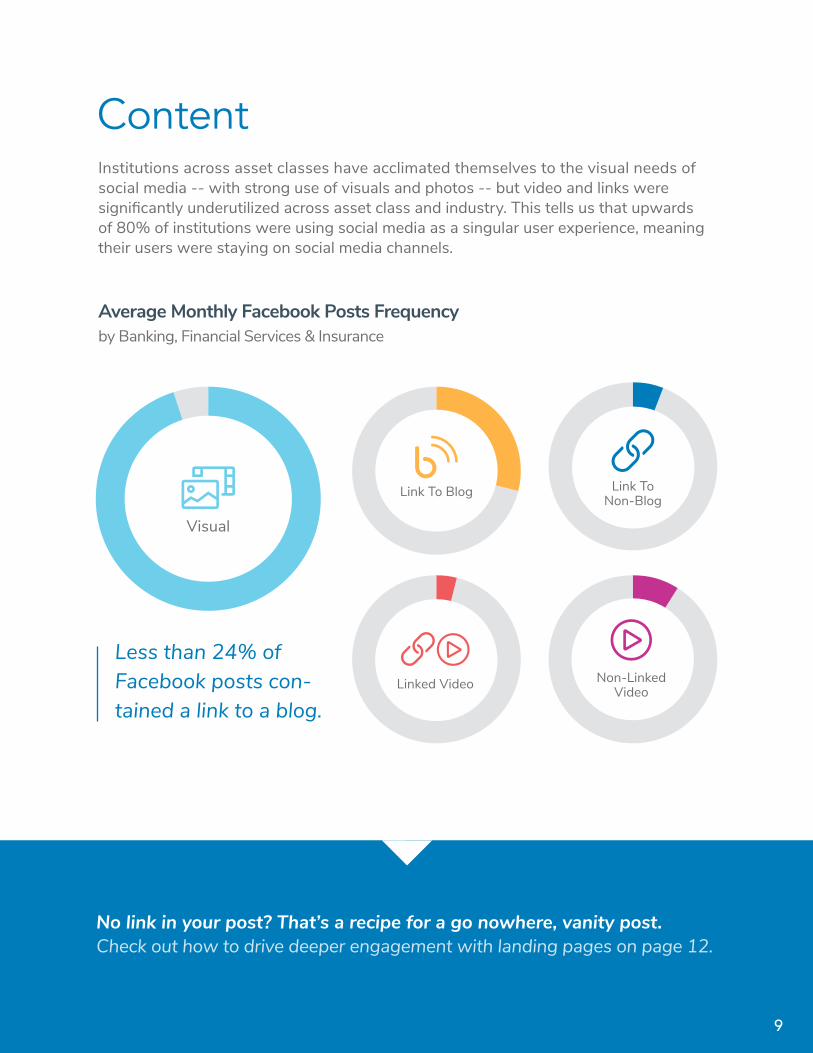
Institutions across asset classes have acclimated themselves to the visual needs of social media -- with strong use of visuals and photos -- but video and links were significantly underutilized across asset class and industry. This tells us that upwards of 80% of institutions were using social media as a singular user experience, meaning their users were staying on social media channels.
Content
Average Monthly Facebook Posts Frequency by Banking, Financial Services & Insurance
No link in your post? That’s a recipe for a go nowhere, vanity post. Check out how to drive deeper engagement with landing pages on page 12.
9
Less than 24% of Facebook posts con-tained a link to a blog.
Visual
Non-Linked Video
Link To Blog Link To Non-Blog
Linked Video
Perc
enta
ge
Ban
king
Ban
king
Ban
king
Ban
king
Fina
ncia
lSe
rvic
es
Fina
ncia
lSe
rvic
es
Fina
ncia
lSe
rvic
es
Fina
ncia
lSe
rvic
es
Insu
race
Insu
race
Insu
race
Insu
race
Oth
er
Oth
er
Oth
er
Oth
er
Instagram LinkedIn Twitter1.2
1.1
1.0
0.9
0.8
0.7
0.6
0.5
0.4
0.3
0.2
0.1
0
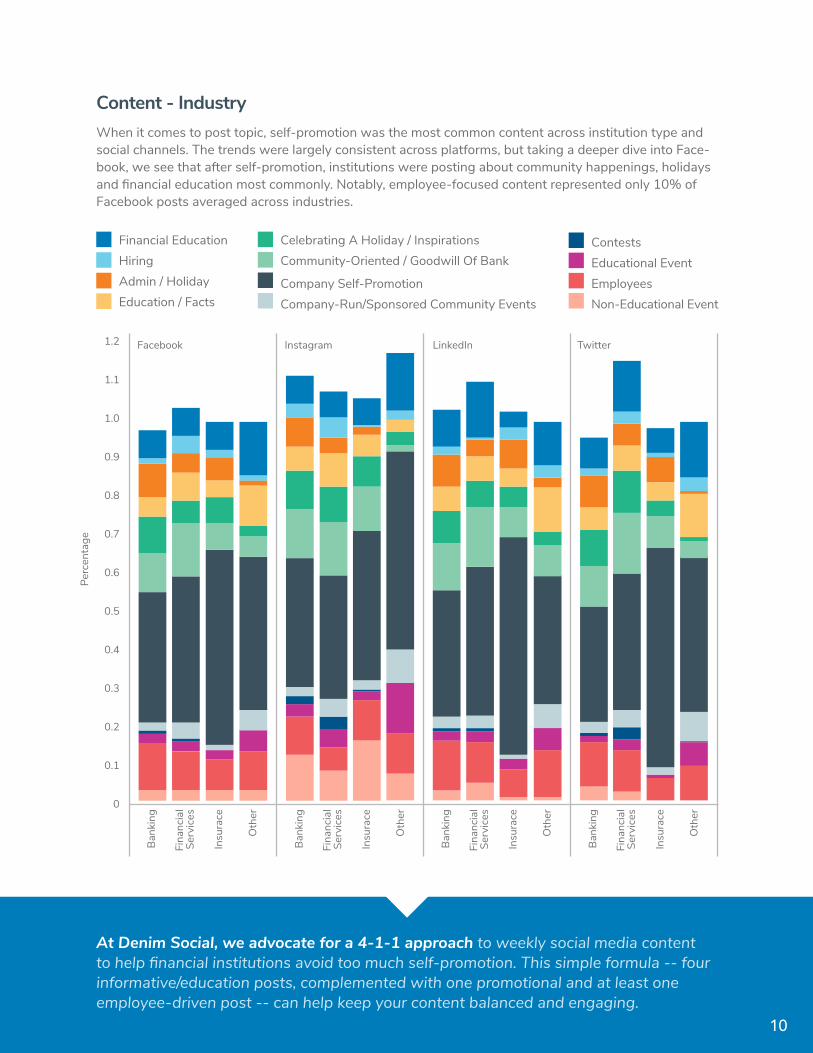
At Denim Social, we advocate for a 4-1-1 approach to weekly social media content to help financial institutions avoid too much self-promotion. This simple formula -- four informative/education posts, complemented with one promotional and at least one employee-driven post -- can help keep your content balanced and engaging.
Financial Education
Company Self-Promotion
Hiring
Company-Run/Sponsored Community Events
Admin / Holiday
Contests
Education / Facts
Educational Event
Celebrating A Holiday / Inspirations
Employees
Community-Oriented / Goodwill Of Bank
Non-Educational Event
Content - IndustryWhen it comes to post topic, self-promotion was the most common content across institution type and social channels. The trends were largely consistent across platforms, but taking a deeper dive into Face-book, we see that after self-promotion, institutions were posting about community happenings, holidays and financial education most commonly. Notably, employee-focused content represented only 10% of Facebook posts averaged across industries.
10

We hope you have a better sense of your institution’s social media perfor-mance after checking out the benchmark data. If you’re wondering where to go from here, we at Denim Social have three key recommendations to help take your social media strategy to the next level.
Institutions with smaller asset classes were less likely to have adopted LinkedIn than their larger competitors -- only 63% have adopted -- and they post less fre-quently. But this is a significant missed opportunity because our research showed engagement rates to be higher across the board for smaller institutions. LinkedIn is a chance for small institutions to out-perform large institutions in social media.
A brand page on LinkedIn is a great place to start for a financial institution, but the greatest potential is in activating employees. Research from the platform shows that employees have 10x the following on LinkedIn compared to their employer, which means they can drive sig-nificant reach. Employee posts to LinkedIn also create 2x the engagement. It’s called social selling and it works.
Recommendations
Smaller Institutions Need to Prioritize LinkedIn
> 1.5B
> 500M-1.5B
< 500M
ADOPTION
AVG. POSTS PER MONTH
Avg. LI EngageReact
Avg. LI Engage Comment
Avg. LI EngageShare
> 1.5B
> 500M-1.5B
< 500M
Enga
gem
ent
Rat
io
1%
0%
11
1
You may associate Instagram with life-style brands, but there is a significant opportunity for financial marketers on the platform. While only an average of 29% had adopted the platform across industries, we saw that adopters post-ed higher engagement rates than other platforms. For example, banking and financial services drove more than 6% engagement compared to less than 1% on Facebook.
As your institution strategizes how to reach younger clients, consider that about half of Instagram U.S. users are between the ages of 25 and 44. Ins-tagram is a natural channel to engage these consumers as they make import-ant financial moves like opening new accounts, applying for mortgages, buy-ing their first life insurance policies and planning for retirement. Creating a brand page on Instagram is a great place to start, but the real value is in paid Insta-gram advertising.
Don’t Neglect Instagram
12
2
Great Bank
Capture them with a visual and convert with one easy click.
If your team is new to Instagram, check out our Guide to Building Stronger Customer Relationships on Instagram.

Our team was surprised to see that 20% or less of the institutions studied were using links in their social media content. Linking is integral to creating a contin-uous user journey. It’s how marketers guide interested users to educational content or their owned digital properties. Think about it this way:
Without links, financial institutions are building dead end journeys.
Extend the Social Experience
13
3 Social media can serve as a front door and a link to a landing page can take your user on a highly-personalized dig-ital road to conversion. Marketers need to lead the next step and build a “post-click” experience with landing pages. The Denim Social platform helps marketers easily build and scale highly professional landing pages in minutes with our code-free landing page wireframe.
Learn more here
Joe Smith, Advisor
Download

So, are you still wondering how you compare? Denim Social can help! We can offer your institution a custom report that compares your brand’s social media against our 2020 benchmark data-set. Yep, that’s right. We’ll gather the data for you and report out on the findings.
Want your custom report?
Connect and convert on social media. Whether your team is outperforming benchmarks or has a shortfall, there’s always opportunity to improve and expand your social media strategy. Social media can help your team drive deeper engagement and convert customers. With the right tools from Denim Social, your team can make the most of social and stay in compliance too.
Our easy-to-use platform can help your team cultivate the entire social media marketing experience with publishing, advertising, and landing pages in one place.
We’re trusted by more than 250 institu-tions in banking, insurance, mortgage and wealth management and are the only social media management tool endorsed by the American Bankers Association.
Learn more at www.DenimSocial.com
Denim Social scales conversion optimized campaigns across all social media channels with built-in compliance, publishing tools and more.
14
Sign Up Here