2020 Second -Quarter Results July 21, 2020
56
Delivering a Smoke-Free Future 2020 Second-Quarter Results July 21, 2020
Transcript of 2020 Second -Quarter Results July 21, 2020

Delivering a Smoke-Free Future
2020 Second-Quarter Results
July 21, 2020

Introduction
• A glossary of key terms and definitions, including the definition for reduced-risk products, or "RRPs," additional heated tobacco unit market data, as well as adjustments, other calculations and reconciliations to the most directly comparable U.S. GAAP measures are at the end of today’s webcast slides, which are posted on our website
• Unless otherwise stated, all references to IQOS are to our IQOS heat-not-burn products
• Our estimates for total industry and market share for the quarter are subject to limitations on the availability and accuracy of industry data in certain geographies during pandemic-related restrictions
• Comparisons presented on a "like-for-like" basis reflect pro forma 2019 results, which have been adjusted for the deconsolidation of our Canadian subsidiary, Rothmans, Benson & Hedges, Inc. (RBH), effective March 22, 2019
2

Forward-Looking and Cautionary Statements
• This presentation and related discussion contain projections of future results and other forward-looking statements. Achievement offuture results is subject to risks, uncertainties and inaccurate assumptions. In the event that risks or uncertainties materialize, orunderlying assumptions prove inaccurate, actual results could vary materially from those contained in such forward-looking statements.Pursuant to the “safe harbor” provisions of the Private Securities Litigation Reform Act of 1995, PMI is identifying important factors that,individually or in the aggregate, could cause actual results and outcomes to differ materially from those contained in any forward-lookingstatements made by PMI
• PMI's business risks include: excise tax increases and discriminatory tax structures; increasing marketing and regulatory restrictions thatcould reduce our competitiveness, eliminate our ability to communicate with adult consumers, or ban certain of our products; healthconcerns relating to the use of tobacco and other nicotine-containing products and exposure to environmental tobacco smoke; litigationrelated to tobacco use; intense competition; the effects of global and individual country economic, regulatory and political developments,natural disasters and conflicts; changes in adult smoker behavior; lost revenues as a result of counterfeiting, contraband and cross-borderpurchases; governmental investigations; unfavorable currency exchange rates and currency devaluations, and limitations on the ability torepatriate funds; adverse changes in applicable corporate tax laws; adverse changes in the cost and quality of tobacco and otheragricultural products and raw materials; and the integrity of its information systems and effectiveness of its data privacy policies. PMI'sfuture profitability may also be adversely affected should it be unsuccessful in its attempts to produce and commercialize reduced-riskproducts or if regulation or taxation do not differentiate between such products and cigarettes; if it is unable to successfully introduce newproducts, promote brand equity, enter new markets or improve its margins through increased prices and productivity gains; if it is unableto expand its brand portfolio internally or through acquisitions and the development of strategic business relationships; or if it is unable toattract and retain the best global talent. Future results are also subject to the lower predictability of our reduced-risk product category'sperformance
• PMI is further subject to other risks detailed from time to time in its publicly filed documents, including the Form 10-Q for the quarterended March 31, 2020. PMI cautions that the foregoing list of important factors is not a complete discussion of all potential risks anduncertainties. PMI does not undertake to update any forward-looking statement that it may make from time to time, except in the normalcourse of its public disclosure obligations
3

Forward-Looking and Cautionary Statements (COVID-19)
• The COVID-19 pandemic has created significant societal and economic disruption, and resulted in closures of stores, factories and offices,and restrictions on manufacturing, distribution and travel, all of which will adversely impact our business, results of operations, cash flowsand financial position during the continuation of the pandemic
• Our business continuity plans and other safeguards in place may not be effective to mitigate the impact of the pandemic. Currently,significant risks include our diminished ability to convert adult smokers to our RRPs, significant volume declines in our duty-free businessand certain other key markets, disruptions or delays in our manufacturing and supply chain, increased currency volatility, and delays incertain cost saving, transformation and restructuring initiatives. Our business could also be adversely impacted if key personnel or asignificant number of employees or business partners become unavailable due to the COVID-19 outbreak. The significant adverse impactof COVID-19 on the economic or political conditions in markets in which we operate could result in changes to the preferences of our adultconsumers and lower demand for our products, particularly for our mid-price or premium-price brands. Continuation of the pandemiccould disrupt our access to the credit markets or increase our borrowing costs. Governments may temporarily be unable to focus on thedevelopment of science-based regulatory frameworks for the development and commercialization of RRPs or on the enforcement orimplementation of regulations that are significant to our business. In addition, messaging about the potential negative impacts of the use ofour products on COVID-19 risks may lead to increasingly restrictive regulatory measures on the sale and use of our products, negativelyimpact demand for our products, the willingness of adult consumers to switch to our RRPs and our efforts to advocate for the developmentof science-based regulatory frameworks for the development and commercialization of RRPs
• The impact of these risks also depends on factors beyond our knowledge or control, including the duration and severity of the outbreak, itsrecurrence in our key markets, actions taken to contain its spread and to mitigate its public health effects, and the ultimate economicconsequences thereof
4

Supporting Our Employees and Communities Through the COVID Pandemic
• Our main focus remains the health and wellbeing of our employees, their families and the communities in which we operate
• Implemented policies and measures to protect, support and reassure employees
• Outstanding strength and spirit shown by all our people
Hand Sanitizer Production at the Philip MorrisR&D Cube in Neuchâtel, Switzerland 5

Source: PMI Financials or estimates, IQOS user panels and PMI Market Research
Robust Performance in Unprecedented Circumstances
• Very strong performance from IQOS, with an estimated 15.4 million users, and 24% growth in HTU volume vs. Q2, 2019:
⎼ RRPs now account for 24% of total net revenues
• Industry volume recovery started in June and the beginning of July as confinements gradually ease, with improving visibility on our combustible business:
⎼ Notably in the EU Region
⎼ Main enduring headwinds: Duty Free and Indonesia dynamics
⎼ Post-COVID economic uncertainty remains
• Strong OI margins in Q2 and H1, 2020, driven by increasing mix of RRPs in our business and growing IQOS profitability:
⎼ Digital efficiencies and operating leverage driving RRP profitability
⎼ Productivity savings in RRPs and combustibles
⎼ Cost efficiencies and elimination or postponement of certain lower priority projects
⎼ Notable margin growth in our current main RRP Regions (EU, EE and EA&A)
6

Historic Milestone:U.S. FDA Authorizes Marketing of IQOS as a Modified RiskTobacco Product
7
• First electronic nicotine product authorized as a Modified Risk Tobacco Product (MRTP) with reduced exposure message
• Demonstrates that IQOS is a fundamentally different tobacco product, and a better choice for adults who would otherwise continue smoking
• Decision validates PMI’s science-based approach, the U.S. approach to harm reduction for adult smokers, and the tobacco and nicotine risk continuum
• FDA found that the exposure modification order for IQOS would be appropriate to promote the public health and is expected to benefit the health of the population as a whole
• FDA’s comprehensive post-market controls and monitoring provide an important example for implementing science-based regulations that promote public health while minimizing undesirable outcomes

June 30, 2020
PMI Reports 2019 ESG
Performance in Its First
IntegratedReport
INTEGRATED REPORT 2019
DELIVERING A SMOKE-FREE FUTURE
Progress toward a world without cigarettes
Source: https://www.pmi.com/integrated-report-20198

(a) As a percentage of PY combustible tobacco net revenuesNote: Comparisons presented on a "like-for-like" basis reflect pro forma 2019 results, which have been adjusted for the deconsolidation of our Canadian subsidiary, Rothmans, Benson & Hedges, Inc. (RBH), effective March 22, 2019. For reconciliations to the most directly comparable U.S. GAAP measures for the impact attributable to RBH, refer to slide 51Source: PMI Financials or estimates 9
Net Revenues(ex-currency, like-for-like)
Adjusted Diluted EPS(ex-currency, like-for-like)
Adjusted OI Margin(ex-currency, like-for-like)
Combustible Tobacco Pricing(a)
(like-for-like)
H1, 2020: Strong Currency-Neutral Performance(Variance vs. PY)
(0.5)%
+230bps
5.4%
8.0%

Reported Diluted EPS
10
Net Revenues(ex-currency)
Adjusted Diluted EPS
Q2, 2020: Better Than Expected in Challenging Quarter(Variance vs. PY)
Around the high end of (8)% to (12)%
Toward upper end of$1.00 to $1.10
Guidance (June 11)
(9.5)%
(6) cents
$1.29$1.25
Actuals
(7) cents
Source: PMI Financials or estimates
Adjusted OI Margin(ex-currency)
Flat
(7.5)%ex-currency
Currency Impact(at then prevailing exchange rates)

Source: PMI Financials or estimates (status on July 21, 2020)
Outlook: Uncertain Environment, Gradual Improvement
11
Operating Environment
Business Dynamics
• Uncertainty remains in terms of:
- Volatility and risk of virus resurgence- Economic fallout
• Relative stability in some geographies, notably the EU Region
• Continued low visibility in some other areas such as Indonesia, Latin America, Duty Free
• ‘Normality’ in consumption occasions will take time to recover, but underlying industry volumes are sequentially improving
• We do not assume widespread increases in down-trading; concentrated in certain markets with an existing trend due to higher price gaps
• Some delays in planned pricing due to pandemic-related restrictions
• Continued growth in IQOS users and HTU sales

(a) Excluding China and the U.S.(b) Operating cash flow is defined as net cash provided by operating activities. Subject to year-end working capital requirements and currency movements Source: PMI Financials or estimates
FY, 2020: Expect Growth in Underlying Adjusted EPS
• Expect low-to-mid single digit adjusted diluted EPS growth, on a currency-neutral like-for-like basis:
⎼ Forecast of 2% to 5% currency-neutral like-for-like growth reflects a range of $4.92 to $5.07, including estimated 31 cents currency headwind, at prevailing exchange rates
• Assumes:
⎼ An estimated total market volume decline of approximately 7% to 9%(a)
⎼ PMI shipment volume decline of approximately 8% to 10%, on a like-for-like basis, notably due to Duty Free and Indonesia
⎼ Low single digit net revenue growth excluding Duty Free and Indonesia; low-single digit decline overall; all on a currency-neutral like-for-like basis
⎼ Operating income margin expansion of more than 150bps, on a currency-neutral like-for-like basis
⎼ An effective tax rate in a range of 22% to 23%
⎼ Operating cash flow of at least $9.0 billion(b)
⎼ Capital expenditures of approximately $0.7 billion
⎼ Non-recurrence of national lockdowns in key international markets
⎼ No share repurchases
12

Source: PMI Financials or estimates
H2, 2020: Gradual Underlying Improvement
13
Q3
• Sequential underlying improvement in net revenues and adjusted EPS
• Performance impacted by:
⎼ Reversal of certain H1 effects⎼ Phasing of certain S,G&A investments ⎼ Timing of 2020 pricing in certain markets
• Adjusted EPS broadly in line with Q2
Q4• Expect growth in adjusted EPS, further sequential improvement in net revenues:
⎼ Assume further underlying recovery in many markets⎼ Stepped-up cost efficiencies to have greater impact
EPS Growth Expected to Skew to Q4

14
183.8 151.4
15.1
18.7
198.9
170.1
Q2, 2019 Q2, 2020
Total PMI Shipment Volume(billion units)
Source: PMI Financials or estimates
HTUs
Cigarettes
Total
Change vs. PY
24.3 %
(17.6)%
(14.5)%

Note: Excluding China and the U.S.Source: PMI Financials or estimates
January February March April May June
Total
Sequential Volume Recovery (billion units)
15
Total PMI IMS Volume
51.748.3
51.748.8 46.1
5.5 5.5
6.35.8 5.8
6.4
Cigarettes
HTUs
63.9
57.5
57.253.8
58.054.6
51.9
5.0
7.045.0
60.050.0
65.0
2020

HTUs Now Comprise Over 10% of Our Total Volume(as a % of PMI Total Shipment Volume)
16Source: PMI Financials or estimates
—%0.9%
4.5%5.3%
7.8%
10.3%
2015 2016 2017 2018 2019 H1, 20207.4 59.7
PMI HTU Shipment Volume (billion units)41.436.20.4 35.4

Increasing Weight of RRPs Driven by Strong Growth(as a % of PMI Total Net Revenues)
17Source: PMI Financials or estimates
—% 0.2%2.7%
12.7%13.8%
18.7%
22.9%
2014 2015 2016 2017 2018 2019 H1, 2020$0.7 $3.2
RRP Net Revenues ($ in billions)$4.1$3.6$0.1 $5.6
24.1%in Q2, 2020

PMI Total International Market Share
18
HTUs+0.9pp
(a)
(0.4)pp
(0.6)pp
28.1%28.0%
Q2, 2019 Q2, 2020
• Higher share in majority of EU markets, Japan and Russia
• Lower share in Indonesia
• Negative market mix impact of Duty Free
• IQOS cannibalization offset by impacts elsewhere
• Over-indexing of Marlboro to social consumption
(a) HTUs include a (0.1)pp impact of Duty Free HTUsNote: Excluding China and the U.S. Current view (reflecting the deconsolidation of RBH, PMI’s total market share has been restated for previous periods). Sales volume of PMI cigarettes and HTUs as a percentage of the total industry sales volume for cigarettes and HTUsSource: PMI Financials or estimates
OtherincludingDuty FreeCigarettes
Indonesia

19
Indonesia: 2020 Headwinds Exacerbated by COVID
19Source: PMI Financials or estimates
20% 20% 21% 22% 25%
Q2 Q3 Q4 Q1 Q2
% Change inIndustry Volume vs. PY
(ex-inventory movements)
Industry Volume Share by Tax Tier
2019 2020
Tier 1
Below Tier 1
50%
0%
80% 78%79%80% 75%
4.6% (6.8)%0.3%(1.9)% (22.1)%

Indonesia: Addressing the Challenges
20
• Ongoing initiatives to leverage our strong brand portfolio
• The growth of the super-low segment will have a significant impact on government excise revenues this year
• We concur with the public policy experts and economists that urge the government to create more predictability and a level playing field, by:
⎼ Reforming the multi-tier excise tax structure
⎼ Enforcing the minimum retail selling price without exception across Indonesia
• Market environment remains challenging, but with signs of gradual improvement
Source: PMI Financials or estimates

Q2 Q3 Q4 Q1 Q2 Q3 Q4 Q1 Q2
Over 15 Million IQOS Users
Estimated users who are in various stages of conversion to IQOS(a)
Total IQOS Users(a)
(in millions)
67% 72%73%71%71%70%70%69%67%
21
3.0
Estimated users who have stopped smoking and switched to IQOS(a)
15.414.6
13.6
12.311.3
10.49.6
8.88.3
2018 2019 2020
HOME IS WHERE
THE SMOKE ISN'T
IQOS has no second handsmoke and produces no fire
or ash, and leaves significantlyless staining on your curtains
and furniture.
TOGETHER. FORWARD.
Discover more at IQOS.com
This product is not risk free and is addictive. For adult use only.(a) See Glossary for definitionSource: PMI Financials or estimates, IQOS user panels and PMI Market Research

Third-Largest Tobacco ‘Brand’ in IQOS Markets
22
(a) Reflects 56 markets where IQOS is available in key cities or nationwide at July 2, 2020. Excludes the U.S. Note: Reflects sales volume as a percentage of the total industry sales volume for cigarettes and HTUsSource: PMI Financials or estimates
#3
11.3%
6.3%
4.1%
Marlboro(cigarettes)
Winston L&MPMI HTUs Rothmans
Share in IQOS Markets (Q2, 2020)(a)
PMI HTUs
#3
EU Region: Record IQOS User Growth in Q2, 2020
(a) See Glossary for definitionSource: PMI Financials or estimates, IQOS user panels and PMI Market Research
+0.5million
(vs. Q1, 2020)
2.6
4.3
Q2 Q3 Q4 Q1 Q2
Total IQOS Users(a)
(in millions, approx.)
20202019
23

Q2, 2019 Q2, 2020
(a) Excluding the estimated impact of consumer pantry loading Source: PMI Financials or estimates
Sequential Performance(vs. Q1, 2020)
Adjusted SoM: +0.3pp(a)
Adjusted IMS Volume: +5%(a)
24
EU Region: Continued HEETS Share Growth
2.4%+1.5pp
4.1% AdjustedSoM(a)
3.9%2.4%

Q2, 2019 Q2, 2020
Russia: Continued HEETS Share Growth
2.9%
+3.0pp
5.9%
Source: PMI Financials or estimates 25
Sequential Performance(vs. Q1, 2020)
SoM: (0.6)ppIMS Volume: +11.9%

Q2, 2019 Q2, 2020
Japan: Continued PMI HTU Share Growth
26(a) Excluding the impact of estimated trade inventory movements, and including the cigarillo category Source: PMI Financials or estimates
20.0%18.5%
AdjustedTotal Tobacco SoM(a)
16.5%
Sequential Performance(vs. Q1, 2020)
Adjusted Total Tobacco SoM: +0.7pp(a)
Adjusted IMS Volume: +4.9%(a)
+3.4pp
16.6%
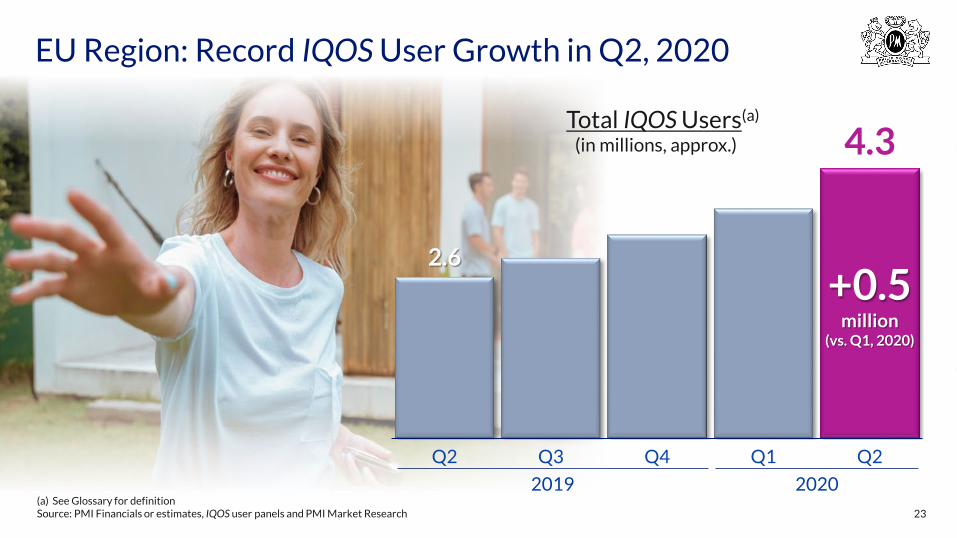
27
Market Launches
2019 (8)
2015 (7)2016 (13)2017 (18)
57Markets
Worldwide(a)
Geographic Expansion of IQOS Continues
2018 (6)
2020 (5)
(a) Status at July 2, 2020 Note: Reflects markets where IQOS is available in key cities or nationwide. Reflects date of initial geographic expansion beyond pilot launch city. The number of markets includes International Duty Free. While IQOS is currently available for sale in Mexico, the country recently banned the importation of e-cigarettes and devices that heat tobacco. Effective March 27, 2020, South Africa banned all tobacco sales (including HEETS) due to the pandemic

• Growing weight and profitability of RRPs
28
Strong Growth Prospects
• Industry volume recovery has started
• Remain confident in our mid-term growth prospects; when COVID-related headwinds abate, expect to resume growth consistent with targeted 2019-2021 CAGRs
• Strong cost and margin focus while continuing to invest in RRPs
• Strong balance sheet and unwavering commitment to the dividend
Note: 2019-2021 targets first communicated at PMI Investor Day, on September 27, 2018Source: PMI Financials or estimates (status on July 21, 2020)
• Historic milestone of Modified Risk Tobacco Product authorization for IQOS

Delivering a Smoke-Free Future
2020 Second-Quarter Results
Questions & Answers
iOS Download Android DownloadHave you downloaded the PMI Investor Relations App yet?
The free IR App is available to download at the Apple App Store for iOS devices and at Google Play for Android mobile devices
Or go to: www.pmi.com/irapp

Delivering a Smoke-Free Future
2020 Second-Quarter Results
July 21, 2020

31
Glossary of Key Terms and Definitions, Appendix, and
Reconciliation of Non-GAAP Measures

Glossary: General Terms • "PMI" refers to Philip Morris International Inc. and its subsidiaries
• Until March 28, 2008, PMI was a wholly owned subsidiary of Altria Group, Inc. ("Altria"). Since that time the company has been independent and is listed on the New York Stock Exchange (ticker symbol "PM")
• "RBH" refers to PMI’s Canadian subsidiary, Rothmans, Benson & Hedges Inc.
• The Companies’ Creditors Arrangement Act (CCAA) is a Canadian federal law that permits a Canadian business to restructure its affairs while carrying on its business in the ordinary course
• Trademarks are italicized
• Comparisons are made to the same prior-year period unless otherwise stated
• Unless otherwise stated, references to total industry, total market, PMI shipment volume and PMI market share performance reflect cigarettes and heated tobacco units
• References to total international market, defined as worldwide cigarette and heated tobacco unit volume excluding the U.S., total industry, total market and market shares are PMI estimates for tax-paid products based on the latest available data from a number of internal and external sources and may, in defined instances, exclude the People's Republic of China and/or PMI's duty free business. In addition, to reflect the deconsolidation of PMI's Canadian subsidiary, Rothmans, Benson & Hedges, Inc. (RBH), effective March 22, 2019, PMI's total market share has been restated for previous periods
• Estimates for second-quarter 2020 and six months year-to-date 2020 total industry volume and market share in certain geographies reflect limitations on the availability and accuracy of industry data during pandemic-related restrictions
• "OTP" is defined as "other tobacco products," primarily roll-your-own and make-your-own cigarettes, pipe tobacco, cigars and cigarillos, and does not include reduced-risk products
• "Combustible products" is the term PMI uses to refer to cigarettes and OTP, combined
• In-market sales, or "IMS," is defined as sales to the retail channel, depending on the market and distribution model
• "Total shipment volume" is defined as the combined total of cigarette shipment volume and heated tobacco unit shipment volume32

Glossary: General Terms (cont.)• "EU" is defined as the European Union Region
• "EE" is defined as the Eastern Europe Region
• "ME&A" is defined as the Middle East & Africa Region and includes PMI's duty free business
• "S&SA" is defined as the South & Southeast Asia Region
• "EA&A" is defined as the East Asia & Australia Region
• "LA&C" is defined as the Latin America & Canada Region
• Following the deconsolidation of PMI's Canadian subsidiary, Rothmans, Benson & Hedges, Inc. (RBH), PMI will continue to report the volume of brands sold by RBH for which other PMI subsidiaries are the trademark owner. These include HEETS, Next, Philip Morris and Rooftop
• From time to time, PMI’s shipment volumes are subject to the impact of distributor inventory movements, and estimated total industry/market volumes are subject to the impact of inventory movements in various trade channels that include estimated trade inventory movements of PMI’s competitors arising from market-specific factors that significantly distort reported volume disclosures. Such factors may include changes to the manufacturing supply chain, shipment methods, consumer demand, timing of excise tax increases or other influences that may affect the timing of sales to customers. In such instances, in addition to reviewing PMI shipment volumes and certain estimated total industry/market volumes on a reported basis, management reviews these measures on an adjusted basis that excludes the impact of distributor and/or estimated trade inventory movements. Management also believes that disclosing PMI shipment volumes and estimated total industry/market volumes in such circumstances on a basis that excludes the impact of distributor and/or estimated trade inventory movements, such as on an IMS basis, improves the comparability of performance and trends for these measures over different reporting periods
• "Illicit trade" refers to domestic non-tax paid products
• "RSP" stands for retail selling price
• "SoM" stands for share of market
• "ESG" stands for environmental, social, and governance
33

Glossary: Financial Terms • Net revenues related to combustible products refer to the operating revenues generated from the sale of these products, including shipping
and handling charges billed to customers, net of sales and promotion incentives, and excise taxes. PMI recognizes revenue when control is transferred to the customer, typically either upon shipment or delivery of goods
• Net revenues related to RRPs represent the sale of heated tobacco units, IQOS devices and related accessories, and other nicotine-containing products, primarily e-vapor products, including shipping and handling charges billed to customers, net of sales and promotion incentives, and excise taxes. PMI recognizes revenue when control is transferred to the customer, typically either upon shipment or delivery of goods
• " S,G&A" stands for selling, general & administrative
• "Adjusted Operating Income (OI) Margin" is calculated as adjusted OI, divided by net revenues
• "Adjusted EBITDA" is defined as earnings before interest, taxes, depreciation, amortization and equity (income)/loss in unconsolidated subsidiaries, excluding asset impairment and exit costs, and unusual items
• "Net debt" is defined as total debt, less cash and cash equivalents
• Management reviews net revenues, OI, OI margins, operating cash flow and earnings per share, or "EPS," on an adjusted basis, which may exclude the impact of currency and other items such as acquisitions, asset impairment and exit costs, tax items and other special items. For example, PMI’s adjusted diluted EPS and other impacted results reflect the loss on deconsolidation of RBH and the Canadian tobacco litigation-related expense, recorded in the first quarter of 2019, asset impairment and exit costs associated with plant closures in Pakistan and Colombia, recorded in the first and second quarters of 2019, respectively, and asset impairment and exit costs associated with organizational design optimization, recorded in the second quarter of 2020. PMI believes that the adjusted measures, including pro forma measures, will provide useful insight into underlying business trends and results, and will provide a more meaningful performance comparison for the period during which RBH remains under CCAA protection. For PMI's 2018 pro forma adjusted diluted EPS by quarter and year-to-date, see Schedule 3 in PMI's first-quarter 2019 earnings release
• "Fair value adjustment for equity security investments" reflects the adjustment resulting from share price movements in passive investments for publicly traded entities that are not controlled or influenced by PMI. Under U.S. GAAP, such adjustments are required, since January 1, 2018, to be reflected directly in the income statement
34

Glossary: Reduced-Risk Products• "Reduced-risk products," or "RRPs," is the term PMI uses to refer to products that present, are likely to present, or have the potential to
present less risk of harm to smokers who switch to these products versus continuing smoking. PMI has a range of RRPs in various stages of development, scientific assessment and commercialization. PMI RRPs are smoke-free products that produce an aerosol that contains far lower quantities of harmful and potentially harmful constituents than found in cigarette smoke
• "Aerosol" refers to a gaseous suspension of fine solid particles and/or liquid droplets
• "Combustion" is the process of burning a substance in oxygen, producing heat and often light
• "Smoke" is a visible suspension of solid particles, liquid droplets and gases in air, emitted when a material burns
• "Heated tobacco units," or "HTUs," is the term PMI uses to refer to heated tobacco consumables, which for PMI include the company's HEETS, HEETS Creations, HEETS Marlboro and HEETS FROM MARLBORO, defined collectively as HEETS, as well as Marlboro HeatSticks and Parliament HeatSticks
• The IQOS heat-not-burn device is a precisely controlled heating device into which a specially designed and proprietary tobacco unit is inserted and heated to generate an aerosol
• HTU "offtake volume" represents the estimated retail offtake of HTUs based on a selection of sales channels that vary by market, but notably include retail points of sale and e-commerce platforms
• HTU "offtake share" represents the estimated retail offtake volume of HTUs divided by the sum of estimated total offtake volume for cigarettes and HTUs
• Market share for HTUs is defined as the total sales volume for HTUs as a percentage of the total estimated sales volume for cigarettes and HTUs
• "Total IQOS users" is defined as the estimated number of Legal Age (minimum 18 years) IQOS users that used PMI HTUs for at least 5% of their daily tobacco consumption over the past seven days
• "Converted IQOS Users" is defined as the estimated number of Legal Age (minimum 18 years) IQOS users that used PMI HTUs for over 95% of their daily tobacco consumption over the past seven days
35

Glossary: Reduced-Risk Products (cont.)• "Predominant IQOS Users" is defined as the estimated number of Legal Age (minimum 18 years) IQOS users that used PMI HTUs units for
between 70% and 95% of their daily tobacco consumption over the past seven days
• "Situational IQOS Users" is defined as the estimated number of Legal Age (minimum 18 years) IQOS users that used PMI HTUs for between 5% and less than 70% of their daily tobacco consumption over the past seven days
• "Abandoned IQOS Users" is defined as the estimated number of Legal Age (minimum 18 years) IQOS users that used PMI HTUs for less than 5% of their daily tobacco consumption over the past seven days
• The estimated number of people who have "stopped smoking and switched to IQOS" is defined as: for markets where IQOS is the only heat-not-burn product, daily individual consumption of PMI HTUs represents the totality of their daily tobacco consumption in the past seven days; for markets where IQOS is one among other heat-not-burn products, daily individual consumption of HTUs represents the totality of their daily tobacco consumption in the past seven days, of which at least 70% are PMI HTUs
• "FDA" stands for the U.S. Food & Drug Administration
• "MRTP" stands for Modified Risk Tobacco Product, the term used by the U.S. FDA to refer to RRPs
• "MRTP application" stands for Modified Risk Tobacco Product application under section 911 of the FD&C Act
• "PMTA" stands for Premarket Tobacco Application under section 910 of the FD&C Act
36

Glossary: IQOS in the United States• On April 30, 2019, the U.S. Food and Drug Administration (FDA) announced that the marketing of a version of IQOS, PMI's heat-not-burn
product, together with its heated tobacco units (the term PMI uses to refer to heated tobacco consumables), is appropriate for the protection of public health and authorized it for sale in the U.S. The FDA’s decision follows its comprehensive assessment of PMI’s premarket tobacco product applications (PMTAs) submitted to the Agency in 2017. In the third quarter of 2019, PMI brought a version of its IQOS Platform 1 device and three variants of its heated tobacco units to the U.S. through its license with Altria Group, Inc., whosesubsidiary, Philip Morris USA Inc., is responsible for marketing the product and complying with the provisions set forth in the FDA's marketing order. On March 30, 2020, PMI submitted a supplemental PMTA for the IQOS 3 tobacco heating device with the U.S. Food and Drug Administration
• On July 7, 2020, the FDA authorized the marketing of a version of IQOS, together with its heated tobacco units, as a modified risk tobacco product (MRTP). In doing so, the agency found that an IQOS exposure modification order is appropriate to promote the public health. The decision follows a review of the extensive scientific evidence package PMI submitted to the FDA in December 2016 to support its MRTP authorization applications
• Shipment volume of heated tobacco units to the U.S. is included in the heated tobacco unit shipment volume of the Latin America & Canada segment. Revenues from shipments of Platform 1 devices, heated tobacco units and accessories to Altria Group, Inc. for sale under license in the U.S. are included in Net Revenues of the Latin America & Canada segment
37

(a) Net reported diluted EPS attributable to RBH from January 1, 2019 through March 21, 2019(b) Pro formaSource: PMI Financials or estimates
2020: EPS Guidance ($/share)
38
Full-Year
≥2020 Forecast 2019
AdjustedGrowth
Reported Diluted EPS $4.84 to $4.99 $4.61
- Tax items (0.04)
- Asset impairment and exit costs 0.04 0.23
- Canadian tobacco litigation-related expense 0.09
- Loss on deconsolidation of RBH 0.12
- Russia excise and VAT audit charge 0.20
- Fair value adjustment for equity security investments 0.04 (0.02)
Adjusted Diluted EPS $4.92 to $5.07 $5.19
- Net earnings attributable to RBH (0.06)
Adjusted Diluted EPS $4.92 to $5.07 $5.13
- Currency 0.31
Adjusted Diluted EPS, excluding currency $5.23 to $5.38 $5.13 2% to 5%
(b)
(b)
(a)

Japan
Philippines
Turkey
Germany
Russia
(a) Excluding the impact of estimated trade inventory movements, and including the cigarillo category (b) Excluding the impact of estimated trade inventory movements Source: PMI Financials or estimates (status on July 21, 2020)
Select Key Market Highlights for Q2, 2020
39
• Industry total market: -25%, with recent recovery in PMI shipments helped by competitor out-of-stocks
• PMI SoM: -1.1pp to 69.5% • Marlboro SoM: +3.1pp to all-time high of 41.7%
• Industry total tobacco market(a): -7%, driven by combustible products • Industry RRP volume(b): +4%, driven by PMI HTUs• Industry cigarillo SoM: growth to >7% of industry, expect closing of tax gap in October to
moderate category evolution• PMI total tobacco SoM(a): +0.3pp
• Industry total market: -7%, following substantial prior year price increases• PMI SoM: stable
• Industry total market: +6%• Total PMI shipments: +7%• Total PMI SoM: +0.4pp to 38.9%, driven by HEETS (+0.9pp to 2.0%)
• Industry total market: -4%• Total PMI shipments: +1%• Total PMI SoM: +2.8pp to 32.4%, driven by HTUs and stable share within combustibles

EU Region: HEETS SoM Performance in Select Markets
Note: Select markets where HEETS share is ≥ 1%Source: PMI Financials or estimates 40
Q2, 2020Growthvs. PY Q2, 2020
Growthvs. PY Q2, 2020
Growthvs. PY
Croatia 4.6% +1.2pp Italy 7.7% +3.1pp Romania 2.8% +0.6pp
CzechRepublic 9.6 +3.9 Latvia 10.5 +5.9 Slovak
Republic 8.7 +1.5
Germany 2.0 +0.9 Lithuania 19.0 +6.9 Slovenia 4.6 +1.6
Greece 11.3 +3.2 Poland 4.4 +2.4 Switzerland 4.0 +1.4
Hungary 8.8 +7.8 Portugal 8.2 +2.4 United Kingdom 1.2 +1.0

Q2 Q3 Q4 Q1 Q2
(a) Excluding the impact of estimated trade inventory movements Source: PMI Financials or estimates
Korea: Sequential Share Performance
41
2019
7.3%
7.0% 6.3% 6.4% 6.4%
HEETS SoM6.7% Adjusted(a)
2020
6.2% 6.3% 6.6% 6.6%

HTU Offtake Shares in Key Cities
42
(a) Japan total market includes the cigarillo category Note: Kuala L. is Kuala LumpurSource: PMI Financials or estimates
17.8% 15.6%6.7%
15.3%8.5% 10.5%
2.9% 2.1%9.5%
Athens Bratislava Bucharest Kiev Kuala L. Lisbon London Madrid Milan
14.4%5.7%
15.2% 13.7% 9.8%
23.1%29.6%
11.4%4.9%
Moscow Munich Prague Rome Seoul Tokyo Vilnius Warsaw Zurich
+5.1pp +4.1pp +2.1pp +3.0pp +2.2pp +3.6pp
+5.2pp +5.5pp (0.3)pp +2.7pp +9.4pp +2.2pp
PMI (Q2, 2020)
+5.0pp
+0.9pp
Change vs. PY
(a)
+2.5pp — pp
+2.4pp +3.0pp

PHILIP MORRIS INTERNATIONAL INC. and SubsidiariesReconciliation of Non-GAAP Measures
43
Reconciliation of Reported Diluted EPS to Reported Diluted EPS, excluding Currency,and Reconciliation of Reported Diluted EPS to Adjusted Diluted EPS, excluding Currency
(Unaudited)
Quarters Ended June 30,
2020 2019 % Change
Reported Diluted EPS $ 1.25 $ 1.49 (16.1)%
Less: Currency (0.06)
Reported Diluted EPS, excluding Currency $ 1.31 $ 1.49 (12.1)%
Quarters Ended June 30, Year Ended
2020 2019 % Change 2019
Reported Diluted EPS $ 1.25 $ 1.49 (16.1)% $ 4.61
Asset impairment and exit costs 0.04 0.01 0.23
Canadian tobacco litigation-related expense - - 0.09
Loss on deconsolidation of RBH - - 0.12
Russia excise and VAT audit charge - - 0.20
Fair value adjustment for equity security investments - - (0.02)
Tax items - (0.04) (0.04)
Adjusted Diluted EPS $ 1.29 $ 1.46 (11.6)% $ 5.19
Less: Currency (0.06)
Adjusted Diluted EPS, excluding Currency $ 1.35 $ 1.46 (7.5)%

PHILIP MORRIS INTERNATIONAL INC. and SubsidiariesReconciliation of Non-GAAP Measures
Net Revenues by Product Category and Adjustments of Net Revenues for the Impact of Currency and Acquisitions($ in millions) / (Unaudited)
44
NetRevenues
Currency
NetRevenuesexcluding Currency
Acquisitions
NetRevenues excluding
Currency & Acquisitions
Quarters EndedJune 30,
NetRevenues
TotalExcluding Currency
Excluding Currency &
Acquisitions
2020 Reduced-Risk Products 2019 % Change
$ 530 $ (25) $ 555 $ - $ 555 European Union $ 428 23.9% 29.7% 29.7%
261 (33) 293 - 293 Eastern Europe 182 42.9% 60.8% 60.8%
8 - 8 - 8 Middle East & Africa 86 (90.6)% (90.7)% (90.7)%
- - - - - South & Southeast Asia - - - -
802 3 799 - 799 East Asia & Australia 765 4.9% 4.5% 4.5%
5 (1) 6 - 6 Latin America & Canada 5 7.9% 24.4% 24.4%
$ 1,606 $ (55) $ 1,661 $ - $ 1,661 Total RRPs $ 1,466 9.5% 13.3% 13.3%
2020 PMI 2019 % Change
$ 2,475 $ (100) $ 2,575 $ - $ 2,575 European Union $ 2,577 (4.0)% (0.1)% (0.1)%
783 (85) 868 - 868 Eastern Europe 822 (4.7)% 5.6% 5.6%
704 (16) 720 - 720 Middle East & Africa 1,004 (29.9)% (28.3)% (28.3)%
889 (46) 935 - 935 South & Southeast Asia 1,248 (28.8)% (25.1)% (25.1)%
1,432 (12) 1,444 - 1,444 East Asia & Australia 1,521 (5.9)% (5.1)% (5.1)%
368 (58) 426 - 426 Latin America & Canada 527 (30.2)% (19.2)% (19.2)%
$ 6,651 $ (317) $ 6,968 $ - $ 6,968 Total PMI $ 7,699 (13.6)% (9.5)% (9.5)%
(a) Net Revenues include revenues from shipments of the IQOS heated tobacco device, heated tobacco units and accessories to Altria Group, Inc., commencing in the third quarter of 2019, for sale under license in the United StatesNote: Sum of Regions might not foot to Total PMI due to roundings. "-" indicates amounts between -$0.5 million and +$0.5 million
(a)

PHILIP MORRIS INTERNATIONAL INC. and SubsidiariesReconciliation of Non-GAAP Measures
Reconciliation of Operating Income to Adjusted Operating Income, excluding Currency and Acquisitions($ in millions) / (Unaudited)
Operating Income
Asset Impairment & Exit Costs
Adjusted Operating
IncomeCurrency
Adjusted Operating
Income excluding Currency
Acqui-sitions
Adjusted Operating
Income excluding Currency& Acqui-
sitions
Operating Income
Asset Impairment& Exit Costs
Adjusted Operating
IncomeTotal
Excluding Currency
Excluding Currency& Acqui-
sitions
2020 2019
$ 1,178 $ (27) $ 1,205 $ (65) $ 1,270 $ - $ 1,270 European Union $ 1,195 $ - $ 1,195 0.8% 6.3% 6.3%
266 (7) 273 (11) 284 - 284 Eastern Europe 256 - 256 6.6% 10.9% 10.9%
237 (9) 246 5 241 - 241 Middle East & Africa 441 - 441 (44.2)% (45.4)% (45.4)%
289 (11) 300 (16) 316 - 316 South & Southeast Asia 492 - 492 (39.0)% (35.8)% (35.8)%
669 (13) 682 (11) 693 - 693 East Asia & Australia 642 - 642 6.2% 7.9% 7.9%
92 (4) 96 (6) 102 - 102 Latin America & Canada 161 (23) 184 (47.8)% (44.6)% (44.6)%
$ 2,731 $ (71) $ 2,802 $ (104) $ 2,906 $ - $ 2,906 Total PMI $ 3,187 $ (23) $ 3,210 (12.7)% (9.5)% (9.5)%
% ChangeQuarters Ended
June 30,
45

PHILIP MORRIS INTERNATIONAL INC. and SubsidiariesReconciliation of Non-GAAP Measures
Reconciliation of Adjusted Operating Income Margin, excluding Currency and Acquisitions($ in millions) / (Unaudited)
46(a) For the calculation of Adjusted Operating Income and Adjusted Operating Income excluding currency and acquisitions refer to previous slide(b) For the calculation of Net Revenues excluding currency and acquisitions refer to slide 44
Adjusted Operating
Income(a)
Net Revenues
Adjusted Operating
IncomeMargin
Adjusted Operating
Incomeexcluding Currency
(a)
Net Revenues excluding Currency
(b)
Adjusted Operating
Income Margin
excluding Currency
Adjusted Operating
Income excluding Currency & Acqui-
sitions (a)
Net Revenues excluding Currency & Acqui-
sitions (b)
Adjusted Operating
Income Margin
excluding Currency & Acqui-
sitions
Adjusted Operating
Income(a)
NetRevenues
Adjusted Operating
IncomeMargin
Adjusted Operating
IncomeMargin
Adjusted Operating
Income Margin
excluding Currency
Adjusted Operating
Income Margin
excluding Currency & Acqui-
sitions
$ 1,205 $ 2,475 48.7% $ 1,270 $ 2,575 49.3% $ 1,270 $ 2,575 49.3% European Union $ 1,195 $ 2,577 46.4% 2.3 2.9 2.9
273 783 34.9% 284 868 32.7% 284 868 32.7% Eastern Europe 256 822 31.1% 3.8 1.6 1.6
246 704 34.9% 241 720 33.5% 241 720 33.5% Middle East & Africa 441 1,004 43.9% (9.0) (10.4) (10.4)
300 889 33.7% 316 935 33.8% 316 935 33.8% South & Southeast Asia 492 1,248 39.4% (5.7) (5.6) (5.6)
682 1,432 47.6% 693 1,444 48.0% 693 1,444 48.0% East Asia & Australia 642 1,521 42.2% 5.4 5.8 5.8
96 368 26.1% 102 426 23.9% 102 426 23.9% Latin America & Canada 184 527 34.9% (8.8) (11.0) (11.0)
$ 2,802 $ 6,651 42.1% $ 2,906 $ 6,968 41.7% $ 2,906 $ 6,968 41.7% Total PMI $ 3,210 $ 7,699 41.7% 0.4 - -
Quarters EndedJune 30,
2020 2019 % Points Change
PHILIP MORRIS INTERNATIONAL INC. and SubsidiariesReconciliation of Non-GAAP Measures
47
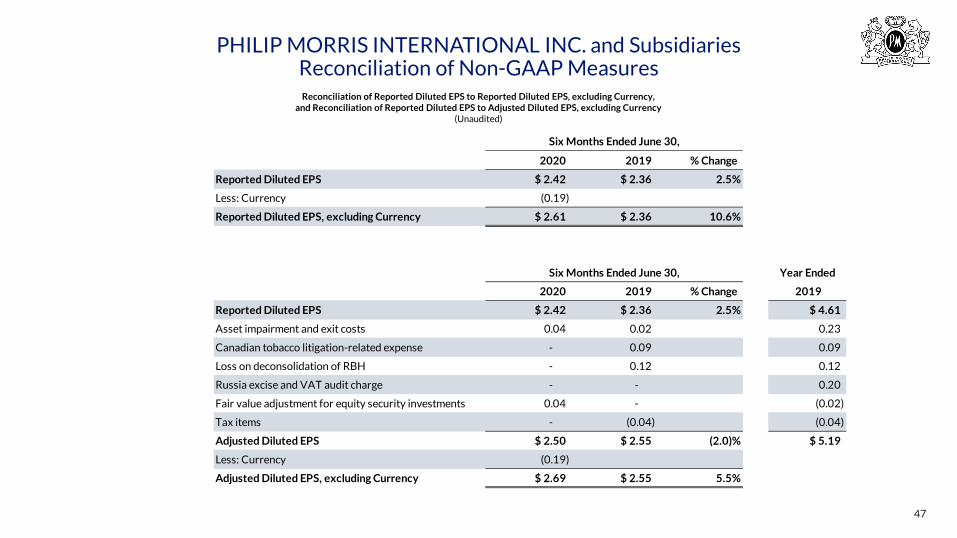
Reconciliation of Reported Diluted EPS to Reported Diluted EPS, excluding Currency,and Reconciliation of Reported Diluted EPS to Adjusted Diluted EPS, excluding Currency
(Unaudited)
Six Months Ended June 30,
2020 2019 % Change
Reported Diluted EPS $ 2.42 $ 2.36 2.5%
Less: Currency (0.19)
Reported Diluted EPS, excluding Currency $ 2.61 $ 2.36 10.6%
Six Months Ended June 30, Year Ended
2020 2019 % Change 2019
Reported Diluted EPS $ 2.42 $ 2.36 2.5% $ 4.61
Asset impairment and exit costs 0.04 0.02 0.23
Canadian tobacco litigation-related expense - 0.09 0.09
Loss on deconsolidation of RBH - 0.12 0.12
Russia excise and VAT audit charge - - 0.20
Fair value adjustment for equity security investments 0.04 - (0.02)
Tax items - (0.04) (0.04)
Adjusted Diluted EPS $ 2.50 $ 2.55 (2.0)% $ 5.19
Less: Currency (0.19)
Adjusted Diluted EPS, excluding Currency $ 2.69 $ 2.55 5.5%

PHILIP MORRIS INTERNATIONAL INC. and SubsidiariesReconciliation of Non-GAAP Measures
Net Revenues by Product Category and Adjustments of Net Revenues for the Impact of Currency and Acquisitions($ in millions) / (Unaudited)
48
NetRevenues
Currency
NetRevenuesexcluding Currency
Acquisitions
NetRevenues excluding
Currency & Acquisitions
Six Months EndedJune 30,
NetRevenues
TotalExcluding Currency
Excluding Currency &
Acquisitions
2020 Reduced-Risk Products 2019 % Change
$ 1,155 $ (42) $ 1,197 $ - $ 1,197 European Union $ 775 49.0% 54.4% 54.4%
526 (23) 549 - 549 Eastern Europe 291 81.0% 88.9% 88.9%
52 - 51 - 51 Middle East & Africa 185 (72.0)% (72.2)% (72.2)%
- - - - - South & Southeast Asia - - - -
1,415 1 1,414 - 1,414 East Asia & Australia 1,448 (2.3)% (2.3)% (2.3)%
13 (1) 14 - 14 Latin America & Canada 11 24.4% 33.5% 33.5%
$ 3,161 $ (64) $ 3,225 $ - $ 3,225 Total RRPs $ 2,709 16.7% 19.1% 19.1%
2020 PMI 2019 % Change
$ 5,010 $ (170) $ 5,180 $ - $ 5,180 European Union $ 4,736 5.8% 9.4% 9.4%
1,571 (79) 1,650 - 1,650 Eastern Europe 1,401 12.1% 17.8% 17.8%
1,580 (18) 1,598 - 1,598 Middle East & Africa 1,931 (18.2)% (17.2)% (17.2)%
2,140 (27) 2,167 - 2,167 South & Southeast Asia 2,361 (9.4)% (8.2)% (8.2)%
2,687 (21) 2,708 - 2,708 East Asia & Australia 2,842 (5.5)% (4.7)% (4.7)%
816 (76) 892 - 892 Latin America & Canada 1,179 (30.8)% (24.3)% (24.3)%
$ 13,804 $ (391) $ 14,195 $ - $ 14,195 Total PMI $ 14,450 (4.5)% (1.8)% (1.8)%
(a) Net Revenues include revenues from shipments of the IQOS heated tobacco device, heated tobacco units and accessories to Altria Group, Inc., commencing in the third quarter of 2019, for sale under license in the United StatesNote: Sum of Regions might not foot to Total PMI due to roundings. "-" indicates amounts between -$0.5 million and +$0.5 million
(a)

PHILIP MORRIS INTERNATIONAL INC. and SubsidiariesReconciliation of Non-GAAP Measures
Reconciliation of Operating Income to Adjusted Operating Income, excluding Currency and Acquisitions($ in millions) / (Unaudited)
Operating Income
Asset Impairment & Exit Costs
Adjusted Operating
IncomeCurrency
Adjusted Operating
Income excluding Currency
Acqui-sitions
Adjusted Operating
Income excluding Currency& Acqui-
sitions
Operating Income
Asset Impairment& Exit Costs and Others
Adjusted Operating
IncomeTotal
Excluding Currency
Excluding Currency& Acqui-
sitions
2020 2019
$ 2,336 $ (27) $ 2,363 $ (130) $ 2,493 $ - $ 2,493 European Union $ 2,091 $ - $ 2,091 13.0% 19.2% 19.2%
365 (7) 372 (103) 475 - 475 Eastern Europe 385 - 385 (3.4)% 23.4% 23.4%
558 (9) 567 (14) 581 - 581 Middle East & Africa 785 - 785 (27.8)% (26.0)% (26.0)%
888 (11) 899 3 896 - 896 South & Southeast Asia 932 (20) 952 (5.6)% (5.9)% (5.9)%
1,155 (13) 1,168 (15) 1,183 - 1,183 East Asia & Australia 1,069 - 1,069 9.3% 10.7% 10.7%
218 (4) 222 (41) 263 - 263 Latin America & Canada (25) (456) 431 (48.5)% (39.0)% (39.0)%
$ 5,520 $ (71) $ 5,591 $ (300) $ 5,891 $ - $ 5,891 Total PMI $ 5,237 $ (476) $ 5,713 (2.1)% 3.1% 3.1%
% ChangeSix Months Ended
June 30,
49(a) Represents asset impairment and exit costs(b) Includes asset impairment and exit costs ($23 million), the Canadian tobacco litigation-related expense ($194 million) and the loss on deconsolidation of RBH ($239 million)
(a)
(b)

PHILIP MORRIS INTERNATIONAL INC. and SubsidiariesReconciliation of Non-GAAP Measures
Reconciliation of Adjusted Operating Income Margin, excluding Currency and Acquisitions($ in millions) / (Unaudited)
50(a) For the calculation of Adjusted Operating Income and Adjusted Operating Income excluding currency and acquisitions refer to previous slide(b) For the calculation of Net Revenues excluding currency and acquisitions refer to slide 48
Adjusted Operating
Income(a)
Net Revenues
Adjusted Operating
IncomeMargin
Adjusted Operating
Incomeexcluding Currency
(a)
Net Revenues excluding Currency
(b)
Adjusted Operating
Income Margin
excluding Currency
Adjusted Operating
Income excluding Currency & Acqui-
sitions (a)
Net Revenues excluding Currency & Acqui-
sitions (b)
Adjusted Operating
Income Margin
excluding Currency & Acqui-
sitions
Adjusted Operating
Income(a)
NetRevenues
Adjusted Operating
IncomeMargin
Adjusted Operating
IncomeMargin
Adjusted Operating
Income Margin
excluding Currency
Adjusted Operating
Income Margin
excluding Currency & Acqui-
sitions
$ 2,363 $ 5,010 47.2% $ 2,493 $ 5,180 48.1% $ 2,493 $ 5,180 48.1% European Union $ 2,091 $ 4,736 44.2% 3.0 3.9 3.9
372 1,571 23.7% 475 1,650 28.8% 475 1,650 28.8% Eastern Europe 385 1,401 27.5% (3.8) 1.3 1.3
567 1,580 35.9% 581 1,598 36.4% 581 1,598 36.4% Middle East & Africa 785 1,931 40.7% (4.8) (4.3) (4.3)
899 2,140 42.0% 896 2,167 41.3% 896 2,167 41.3% South & Southeast Asia 952 2,361 40.3% 1.7 1.0 1.0
1,168 2,687 43.5% 1,183 2,708 43.7% 1,183 2,708 43.7% East Asia & Australia 1,069 2,842 37.6% 5.9 6.1 6.1
222 816 27.2% 263 892 29.5% 263 892 29.5% Latin America & Canada 431 1,179 36.6% (9.4) (7.1) (7.1)
$ 5,591 $ 13,804 40.5% $ 5,891 $ 14,195 41.5% $ 5,891 $ 14,195 41.5% Total PMI $ 5,713 $ 14,450 39.5% 1.0 2.0 2.0
Six Months EndedJune 30,
2020 2019 % Points Change

PHILIP MORRIS INTERNATIONAL INC. and SubsidiariesReconciliation of Non-GAAP Measures
51
Adjustments for the Impact of RBH, excluding Currency($ in millions, except per share data) / (Unaudited)
(a) Represents the impact attributable to RBH from January 1, 2019 through March 21, 2019(b) Pro forma(c) For the calculation of Adjusted Operating Income refer to slide 49(d) For the calculation refer to slide 47Note: Financials attributable to RBH include Duty Free sales in Canada
% Change
Net Revenues $ 13,804 $ 14,450 (4.5)%
Net Revenues attributable to RBH (181) (a)
Net Revenues $ 13,804 $ 14,269 (b) (3.3)%
Less: Currency (392)
Net Revenues, excluding Currency $ 14,196 $ 14,269 (b) (0.5)%
Adjusted Operating Income (c) $ 5,591 $ 5,713 (2.1)%
Operating Income attributable to RBH (126) (a)
Adjusted Operating Income $ 5,591 $ 5,587 (b) 0.1%
Less: Currency (299)
Adjusted Operating Income, excluding Currency $ 5,890 $ 5,587 (b) 5.4%
Adjusted OI Margin 40.5% 39.5% 1.0
Adjusted OI Margin attributable to RBH (0.3) (a)
Adjusted OI Margin 40.5% 39.2% (b) 1.3
Less: Currency (1.0)
Adjusted OI Margin, excluding Currency 41.5% 39.2% (b) 2.3
Adjusted Diluted EPS (d) $ 2.50 $ 2.55 (2.0)%
Net earnings attributable to RBH (0.06) (a)
Adjusted Diluted EPS $ 2.50 $ 2.49 (b) 0.4%
Less: Currency (0.19)
Adjusted Diluted EPS, excluding Currency $ 2.69 $ 2.49 (b) 8.0%
Six Months Ended June 30,
2020 2019
PHILIP MORRIS INTERNATIONAL INC. and SubsidiariesReconciliation of Non-GAAP Measures
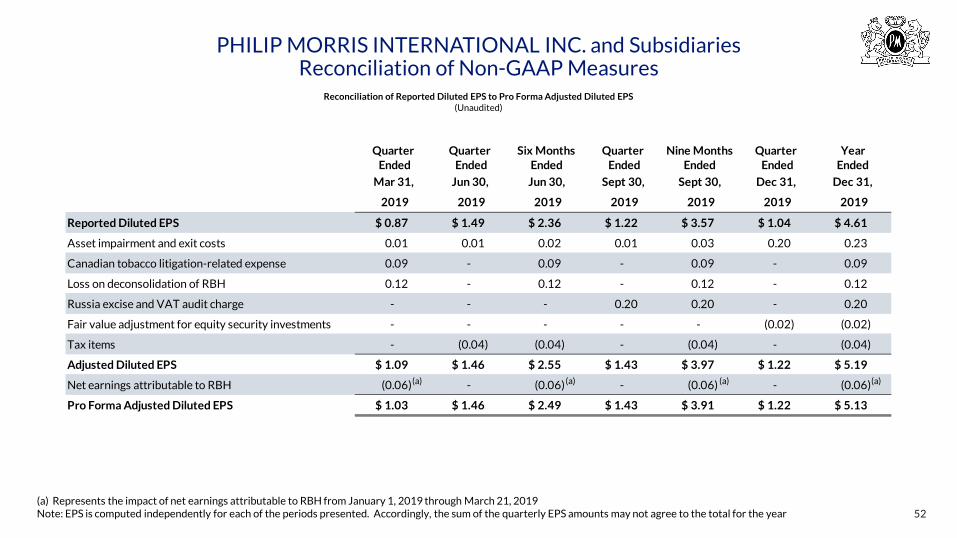
Reconciliation of Reported Diluted EPS to Pro Forma Adjusted Diluted EPS(Unaudited)
(a) Represents the impact of net earnings attributable to RBH from January 1, 2019 through March 21, 2019Note: EPS is computed independently for each of the periods presented. Accordingly, the sum of the quarterly EPS amounts may not agree to the total for the year
Reported Diluted EPS $ 0.87 $ 1.49 $ 2.36 $ 1.22 $ 3.57 $ 1.04 $ 4.61
Asset impairment and exit costs 0.01 0.01 0.02 0.01 0.03 0.20 0.23
Canadian tobacco litigation-related expense 0.09 - 0.09 - 0.09 - 0.09
Loss on deconsolidation of RBH 0.12 - 0.12 - 0.12 - 0.12
Russia excise and VAT audit charge - - - 0.20 0.20 - 0.20
Fair value adjustment for equity security investments - - - - - (0.02) (0.02)
Tax items - (0.04) (0.04) - (0.04) - (0.04)
Adjusted Diluted EPS $ 1.09 $ 1.46 $ 2.55 $ 1.43 $ 3.97 $ 1.22 $ 5.19
Net earnings attributable to RBH (0.06) - (0.06) - (0.06) - (0.06)
Pro Forma Adjusted Diluted EPS $ 1.03 $ 1.46 $ 2.49 $ 1.43 $ 3.91 $ 1.22 $ 5.13
Quarter Ended
Dec 31,
2019
Year Ended
Dec 31,
2019
Nine Months Ended
Sept 30,
2019 2019
Quarter Ended
Mar 31,
Quarter Ended
Jun 30,
2019
Six Months Ended
Jun 30,
2019
Quarter Ended
Sept 30,
2019
(a) (a) (a) (a)
52

PHILIP MORRIS INTERNATIONAL INC. and SubsidiariesReconciliation of Non-GAAP Measures
Net Revenues by Product Category and Adjustments of Net Revenues for the Impact of Currency and Acquisitions($ in millions) / (Unaudited)
53
NetRevenues
Currency
NetRevenuesexcluding Currency
Acquisitions
NetRevenues excluding
Currency & Acquisitions
Years EndedDecember 31,
NetRevenues
TotalExcluding Currency
Excluding Currency &
Acquisitions
2019 Reduced-Risk Products 2018 % Change
$ 1,724 $ (98) $ 1,822 $ - $ 1,822 European Union $ 865 99.2% +100% +100%
844 (19) 864 - 864 Eastern Europe 324 +100% +100% +100%
321 (1) 322 - 322 Middle East & Africa 382 (15.8)% (15.7)% (15.7)%
- - - - - South & Southeast Asia - - - -
2,671 13 2,658 - 2,658 East Asia & Australia 2,506 6.6% 6.0% 6.0%
27 (1) 28 - 28 Latin America & Canada 19 41.9% 49.9% 49.9%
$ 5,587 $ (106) $ 5,693 $ - $ 5,693 Total RRPs $ 4,096 36.4% 39.0% 39.0%
2019 PMI 2018 % Change
$ 9,817 $ (563) $ 10,380 $ - $ 10,380 European Union $ 9,298 5.6% 11.6% 11.6%
3,282 (108) 3,390 - 3,390 Eastern Europe 2,921 12.4% 16.1% 16.1%
4,042 (162) 4,204 - 4,204 Middle East & Africa 4,114 (1.8)% 2.2% 2.2%
5,094 (10) 5,104 - 5,104 South & Southeast Asia 4,656 9.4% 9.6% 9.6%
5,364 (26) 5,390 - 5,390 East Asia & Australia 5,580 (3.9)% (3.4)% (3.4)%
2,206 (68) 2,274 - 2,274 Latin America & Canada 3,056 (27.8)% (25.6)% (25.6)%
$ 29,805 $ (937) $ 30,742 $ - $ 30,742 Total PMI $ 29,625 0.6% 3.8% 3.8%
(a)
(a) Net Revenues include revenues from shipments of the IQOS heated tobacco device, heated tobacco units and accessories to Altria Group, Inc., commencing in the third quarter of 2019, for sale under license in the United StatesNote: Sum of Regions might not foot to Total PMI due to roundings. "-" indicates amounts between -$0.5 million and +$0.5 million

PHILIP MORRIS INTERNATIONAL INC. and SubsidiariesReconciliation of Non-GAAP Measures
Net Revenues by Product Category and Adjustments of Net Revenues for the Impact of Currency and Acquisitions($ in millions) / (Unaudited)
54Note: Sum of Regions might not foot to Total PMI due to roundings. "-" indicates amounts between -$0.5 million and +$0.5 million
NetRevenues
Currency
NetRevenuesexcluding Currency
Acquisitions
NetRevenues excluding
Currency & Acquisitions
Years EndedDecember 31,
NetRevenues
TotalExcluding Currency
Excluding Currency &
Acquisitions
2017 Reduced-Risk Products 2016 % Change
$ 269 $ 5 $ 264 $ - $ 264 European Union $ 57 +100% +100% +100%
55 3 52 - 52 Eastern Europe 6 +100% +100% +100%
94 (3) 98 - 98 Middle East & Africa 4 +100% +100% +100%
- - - - - South & Southeast Asia - - - -
3,218 (94) 3,312 - 3,312 East Asia & Australia 666 +100% +100% +100%
4 - 4 - 4 Latin America & Canada 1 +100% +100% +100%
$ 3,640 $ (89) $ 3,729 $ - $ 3,729 Total RRPs $ 733 +100% +100% +100%
2017 PMI 2016 % Change
$ 8,318 $ 45 $ 8,273 $ - $ 8,273 European Union $ 8,162 1.9% 1.4% 1.4%
2,711 229 2,482 - 2,482 Eastern Europe 2,484 9.1% (0.1)% (0.1)%
3,988 (520) 4,508 - 4,508 Middle East & Africa 4,516 (11.7)% (0.2)% (0.2)%
4,417 (63) 4,480 - 4,480 South & Southeast Asia 4,396 0.5% 1.9% 1.9%
6,373 (74) 6,447 - 6,447 East Asia & Australia 4,285 48.7% 50.5% 50.5%
2,941 (54) 2,995 - 2,995 Latin America & Canada 2,842 3.5% 5.4% 5.4%
$ 28,748 $ (437) $ 29,185 $ - $ 29,185 Total PMI $ 26,685 7.7% 9.4% 9.4%

PHILIP MORRIS INTERNATIONAL INC. and SubsidiariesReconciliation of Non-GAAP Measures
Net Revenues by Product Category and Adjustments of Net Revenues for the Impact of Currency and Acquisitions($ in millions) / (Unaudited)
55Note: Sum of Regions might not foot to Total PMI due to roundings. "-" indicates amounts between -$0.5 million and +$0.5 million
NetRevenues
Currency
NetRevenuesexcluding Currency
Acquisitions
NetRevenues excluding
Currency & Acquisitions
Years EndedDecember 31,
NetRevenues
TotalExcluding Currency
Excluding Currency &
Acquisitions
2016 Reduced-Risk Products 2015 % Change
$ 57 $ (2) $ 60 $ - $ 60 European Union $ 29 96.4% +100% +100%
6 - 6 - 6 Eastern Europe - - - -
4 1 3 - 3 Middle East & Africa - - - -
- - - - - South & Southeast Asia - - - -
666 70 597 - 597 East Asia & Australia 35 +100% +100% +100%
1 - 1 - 1 Latin America & Canada - - - -
$ 733 $ 67 $ 666 $ - $ 666 Total RRPs $ 64 +100% +100% +100%
2016 PMI 2015 % Change
$ 8,162 $ (147) $ 8,309 $ - $ 8,309 European Union $ 8,068 1.2% 3.0% 3.0%
2,484 (340) 2,824 - 2,824 Eastern Europe 2,735 (9.2)% 3.3% 3.3%
4,516 (260) 4,776 - 4,776 Middle East & Africa 4,629 (2.4)% 3.2% 3.2%
4,396 (71) 4,467 - 4,467 South & Southeast Asia 4,288 2.5% 4.2% 4.2%
4,285 63 4,222 - 4,222 East Asia & Australia 3,915 9.5% 7.8% 7.8%
2,842 (525) 3,367 - 3,367 Latin America & Canada 3,159 (10.0)% 6.6% 6.6%
$ 26,685 $ (1,280) $ 27,965 $ - $ 27,965 Total PMI $ 26,794 (0.4)% 4.4% 4.4%

Delivering a Smoke-Free Future
2020 Second-Quarter Results
July 21, 2020