Fourth Quarter 2017 Earnings - Xerox Newsroom
30
Fourth Quarter 2017 Earnings Jeff Jacobson, CEO Bill Osbourn, CFO January 31, 2018 http://www.xerox.com/investor
Transcript of Fourth Quarter 2017 Earnings - Xerox Newsroom

Fourth Quarter 2017 Earnings
Jeff Jacobson, CEOBill Osbourn, CFO
January 31, 2018http://www.xerox.com/investor

This presentation, and other written or oral statements made from time to time by management, contain “forward-looking statements” as defined in the Private Securities Litigation Reform Act of 1995. The words “anticipate”, “believe”, “estimate”, “expect”, “intend”, “will”, “should” and similar expressions, as they relate to us, are intended to identify forward-looking statements. These statements reflect management’s current beliefs, assumptions and expectations and are subject to a number of factors that may cause actual results to differ materially. Such factors include but are not limited to: our ability to address our business challenges in order to reverse revenue declines, reduce costs and increase productivity so that we can invest in and grow our business; changes in economic and political conditions, trade protection measures, licensing requirements and tax laws in the United States and in the foreign countries in which we do business; changes in foreign currency exchange rates; our ability to successfully develop new products, technologies and service offerings and to protect our intellectual property rights; the risk that multi-year contracts with governmental entities could be terminated prior to the end of the contract term and that civil or criminal penalties and administrative sanctions could be imposed on us if we fail to comply with the terms of such contracts and applicable law; the risk that partners, subcontractors and software vendors will not perform in a timely, quality manner; actions of competitors and our ability to promptly and effectively react to changing technologies and customer expectations; our ability to obtain adequate pricing for our products and services and to maintain and improve cost efficiency of operations, including savings from restructuring actions; the risk that individually identifiable information of customers, clients and employees could be inadvertently disclosed or disclosed as a result of a breach of our security systems; reliance on third parties, including subcontractors, for manufacturing of products and provision of services; our ability to manage changes in the printing environment and expand equipment placements; interest rates, cost of borrowing and access to credit markets; funding requirements associated with our employee pension and retiree health benefit plans; the risk that our operations and products may not comply with applicable worldwide regulatory requirements, particularly environmental regulations and directives and anti-corruption laws; the outcome of litigation and regulatory proceedings to which we may be a party; the risk that we do not realize all of the expected strategic and financial benefits from the separation and spin-off of our Business Process Outsourcing business; the effects on our business resulting from actions of activist shareholders; and other factors that are set forth in the “Risk Factors” section, the “Legal Proceedings” section, the “Management’s Discussion and Analysis of Financial Condition and Results of Operations” section and other sections of our Quarterly Reports on Form 10-Q for the quarters ended March 31, 2017, June 30, 2017 and September 30, 2017 and our 2016 Annual Report on Form 10-K, as well as our Current Reports on Form 8-K filed with the SEC. Furthermore, the actual results of the transactions with FUJIFILM Holdings Corporation (“Fujifilm”) could vary materially as a result of a number of factors, including, but not limited to: (i) the risk that the transactions may not be completed in a timely manner or at all, which may adversely affect Xerox’s business and the price of Xerox’s common stock, (ii) the failure to satisfy the conditions to the consummation of the transactions, including the receipt of certain approvals from Xerox’s shareholders and certain governmental and regulatory approvals, (iii) the parties may be unable to achieve expected synergies and operating efficiencies in the transactions within the expected time frames or at all, (iv) the transactions may not result in the accretion to Xerox’s earnings or other benefits, (v) the occurrence of any event, change or other circumstance that could give rise to the termination of the transaction agreements, (vi) the effect of the announcement or pendency of the transactions on Xerox’s and/or Fujifilm business relationships, operating results, and business generally, risks related to the proposed transactions disrupting Xerox’s current plans and operations and potential difficulties in Xerox’s employee retention as a result of the transactions, (vii) risks related to diverting management's attention from Xerox’s ongoing business operations, (viii) the outcome of any legal proceedings that may be instituted against Xerox, its officers or directors related to the transaction agreements or the transactions and (ix) the possibility that competing offers or acquisition proposals for Xerox will be made. Xerox assumes no obligation to update any forward-looking statements as a result of new information or future events or developments, except as required by law.
Cautionary Statement Regarding Forward-Looking Statements
2

Fuji Xerox Co., Ltd. (“Fuji Xerox”) is a joint venture between Xerox Corporation and Fujifilm in which Xerox holds a noncontrolling 25% equity interest and Fujifilm holds the remaining equity interest. In April 2017, Fujifilm formed an independent investigation committee (“IIC”) to primarily conduct a review of the appropriateness of the accounting practices at Fuji Xerox’s New Zealand subsidiary and at other subsidiaries. The IIC completed its review during the second quarter 2017 and identified aggregate adjustments to Fuji Xerox’s financial statements of approximately JPY 40 billion (approximately $360 million) primarily related to misstatements at Fuji Xerox’s New Zealand and Australian subsidiaries. We determined that our share of the total adjustments identified as part of the investigation was approximately $90 million and impacted our fiscal years 2009 through 2017. We concluded that we should revise our previously issued annual and interim consolidated financial statements for 2014, 2015 and 2016 and the first quarter of 2017 the next time they are filed. Our review of this matter has been completed. However, Fujifilm and Fuji Xerox continue to review Fujifilm’s oversight and governance of Fuji Xerox as well as Fuji Xerox’s oversight and governance over its businesses in light of the findings of the IIC. At this time, we can provide no assurances relative to the outcome of any potential governmental investigations or any consequences thereof that may happen as a result of this matter.
Cautionary Statement Regarding Forward-Looking Statements
3

Revenue
$2.7B, up 0.5% or down 2.0% CC1
Equipment up 4.3% or 1.5% CC1
Post Sale down 0.7% or 3.1% CC1
Profitability
Adj1 operating margin: 14.4%, up 20 bps
GAAP Loss2,3: $(0.78), down $1.48 due
to U.S. Tax Act related charge of $400M
Adj1 EPS: $1.04, up 4 cents
Cash
Operating cash flow2: $(28)M reflects
A/R sales programs elimination
Adj1,4 operating cash flow: $322M
Ending Cash: $1.3B
Fourth-Quarter Overview
Strong fourth quarter; positions us well entering 2018
• Adjusted1 EPS and net income expand year-over-year
• Equipment turns to growth with increasing demand for new products; strategic growth areas up 5% CC1
• Achieved operating margin gains while supporting future revenue initiatives
• Continued strong adjusted1 operating cash flow, at higher end of guidance range
(1) Constant Currency (CC) and other adjusted measures: see Non-GAAP Financial Measures. (2) GAAP Loss per share and Operating
Cash Flow are from Continuing Operations. (3) Includes estimated non-cash charge associated with the enactment of the U.S. Tax Act in
December 2017. (4) Adjusted for previously announced $350M impact of certain accounts receivable (A/R) sales programs elimination.
Note: all numerical comparisons shown above are on a year-over-year basis.4
5
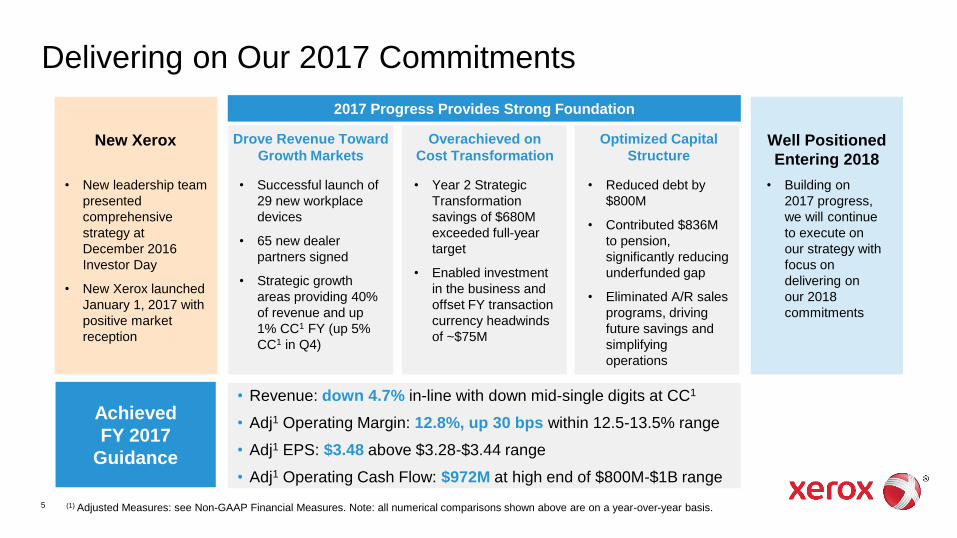
Delivering on Our 2017 Commitments
New Xerox
Xerox + Fuji Xerox
Combination• Year 2 Strategic
Transformation
savings of $680M
exceeded full-year
target
• Enabled investment
in the business and
offset FY transaction
currency headwinds
of ~$75M
Overachieved on
Cost Transformation
Drove Revenue Toward
Growth Markets
• Reduced debt by
$800M
• Contributed $836M
to pension,
significantly reducing
underfunded gap
• Eliminated A/R sales
programs, driving
future savings and
simplifying
operations
Optimized Capital
Structure
Xerox
Fuji Xerox
• Successful launch of
29 new workplace
devices
• 65 new dealer
partners signed
• Strategic growth
areas providing 40%
of revenue and up
1% CC1 FY (up 5%
CC1 in Q4)
• New leadership team
presented
comprehensive
strategy at
December 2016
Investor Day
• New Xerox launched
January 1, 2017 with
positive market
reception
Well Positioned
Entering 2018
2017 Progress Provides Strong Foundation
• Building on
2017 progress,
we will continue
to execute on
our strategy with
focus on
delivering on
our 2018
commitments
• Revenue: down 4.7% in-line with down mid-single digits at CC1
• Adj1 Operating Margin: 12.8%, up 30 bps within 12.5-13.5% range
• Adj1 EPS: $3.48 above $3.28-$3.44 range
• Adj1 Operating Cash Flow: $972M at high end of $800M-$1B range
Achieved
FY 2017
Guidance
(1) Adjusted Measures: see Non-GAAP Financial Measures. Note: all numerical comparisons shown above are on a year-over-year basis.

Financial Performance(in millions, except per share data)
P&L Measures Q4 2017 B/(W) YOY
Revenue $ 2,747 $ 13
Operating Income – Adjusted1 395 7
Equity Income 25 (2)
Other Expenses, net – Adjusted1 29 28
Net Income2 (196) (381)
Net Income – Adjusted1 274 10
GAAP Loss2 (0.78) (1.48)
EPS – Adjusted1 1.04 0.04
(1) Adjusted Measures: see Non-GAAP Financial Measures. (2) Net Income and GAAP Loss per share from continuing operations include
estimated non-cash charge of $400M associated with the enactment of U.S. Tax Act in December 2017.
P&L Ratios (Adjusted1) Q4 2017 B/(W) YOY
Gross Margin 40.4% 0.1 pts
RD&E % 3.9% 0.1 pts
SAG % 23.2% (0.1) pts
Operating Income Margin 14.4% 0.2 pts
Tax Rate 26.2% (5.1) pts
6

0.0%
4.0%
8.0%
12.0%
16.0%
4Q16 1Q17 2Q17 3Q17 4Q17(8.0)%
(6.0)%
(4.0)%
(2.0)%
0.0%
4Q16 1Q17 2Q17 3Q17 4Q17
-
0.20
0.40
0.60
0.80
1.00
1.20
4Q16 1Q17 2Q17 3Q17 4Q17
Performance Trends
(1) Constant Currency (CC) and other adjusted measures: see Non-GAAP Financial Measures. (2) GAAP EPS (Loss) from continuing
operations. (3) Q4 2017 GAAP Loss per share includes estimated non-cash charge of $400M associated with the enactment of U.S. Tax Act
in December 2017.
Revenue (CC1) Adjusted1 Operating Margin Adjusted1 EPS
$
YOY change at CC1
(5.0%) (4.3%) (6.4)% (5.9)% (2.0)%
Translation Currency
(2.2) pts (1.9) pts (1.7) pts 0.9 pts 2.5 pts
Adjusted1 Operating Margin
14.2% 11.2% 13.3% 12.2% 14.4%
Transaction Currency
(0.7) pts (1.1) pts (1.0) pts (0.6) pts (0.3) pts
Adj1 $1.00 $0.67 $0.87 $0.89 $1.04
GAAP2 $0.70 $0.16 $0.63 $0.67 $(0.78)3
Total Currency
$(0.06) $(0.08) $(0.09) $(0.04) $0.02
7
14.2%
(5.0)%
$1.00
(2.0)%
14.4% $1.04

YOY Change
Q4 2017 AC CC3
Total Revenue $ 2,747 0.5% (2.0)%
North America 1,601 (1.6)% (2.1)%
International 1,001 4.8% (1.2)%
Other1 145 (4.6)% (4.6)%
Equipment Revenue $ 682 4.3% 1.5%
Entry 100 5.3% 4.1%
Mid-range 410 2.2% (0.2)%
High-end 161 7.3% 3.9%
Other 11 N/M N/M
Managed Document Services2 $ 913 3.4% 0.8%
Revenue Performance(in millions)
58%
36%
6%
Total Revenue by Geographic Sales Channel
North America
International
Other
15%
60%
23%
2%Equipment Sales Revenue
Entry
Mid-range
High-end
Other
Managed Document Services2: 33% of Total Revenue
8
(1) Other total revenue includes OEM business, sales to Fuji Xerox and licensing. (2) Managed Document Services (MDS) includes Managed
Print Services (MPS) (including Global Imaging Systems MPS), Centralized Print Services (CPS) and Workflow Automation and excludes
Communication and Marketing Solutions (CMS). (3) Constant Currency (CC): see Non-GAAP Financial Measures.
1

Key Performance Metrics
Strategic Growth Areas Installs Strategic Transformation
Q4 2017
(% change YOY) Color B&W
Entry A4 MFPs2 32% 34%
Mid-Range2 14% 1%
High-End2 (5)% (10)%
% Change CC1
Q4 2017 YOY TTM
Enterprise MDS $1.0B 20% 1%
A4 MFPs
MPS & Workflow Automation
Production Color
1% 40%
2017 FY Results
YOY revenue
change at CC1
Gross Savings3Actuals/
Estimated
Initial
Target4
2016 FY $550M $500M
2017 FY $680M $600M
2018 FY guidance $475M $400M
Cumulative thru 2018 $1.7B $1.5B+
FY ‘17 Restructuring $220M $225M
(1) Constant Currency (CC): see Non-GAAP Financial Measures. (2) Entry installations exclude OEM sales; Mid-range and High-end color
installations exclude Fuji Xerox digital front-end sales. (3) Gross savings are the year-over-year savings, assuming similar operating levels. (4) Initial Strategic Transformation gross savings target provided at our December 2016 Investor Day.
Signings
30%
17%20%
20%
13%Delivery
Cost of Production
Sales & Contracting
G&A
Supply Chain &Procurement
Sources of Productivity
2 pts
% of Revenue
in Strategic
Growth Areas
Mix shift YOY
9
Note: signings do not include GIS or Xerox
Partner Print Services results
Offering Focus Areas

Cash Flow
Operating cash flow from continuing operations at high-end of guidance range
Working Capital1 a use driven by elimination of A/R sales programs
CAPEX2 of $35M in Q4, $105M FY
Financing cash flow reflects $475M senior note payment in Q4
(in millions) Q4 2017 FY 2017
Pre-tax Income from Continuing Ops $ 226 $ 570
Non-cash add-backs3 174 767
Restructuring payments (55) (224)
Pension Contributions (119) (836)
Working Capital, net1 (219) (427)
Change in Finance Assets4 (37) 231
Other5 2 41
Cash from Operations - Continuing Ops $ (28) $ 122
Adj. Cash from Operations – Continuing Ops6 $ 322 $ 972
Cash from Investing - Continuing Ops $ 85 $ (31)
Cash from Financing $ (555) $ (985)
Ending Cash and Cash Equivalents $1,293 $1,293
Memo:
Free Cash Flow6 $ (63) $ 17
Adj. Free Cash Flow6 $ 287 $ 867
(1) Working Capital, net includes accounts receivable, collections of deferred proceeds from sales of receivables, accounts payable and accrued compensation and inventory.(2) CAPEX including Internal Use Software. (3) Non-Cash Add-backs include depreciation & amortization excluding equipment on operating lease, provisions, stock-based
compensation, defined benefit pension expense, restructuring charges and gain on sales of businesses and assets. (4) Includes equipment on operating leases and its related
depreciation, finance receivables and collections on beneficial interest from sales of finance receivables. (5) Includes other current and long-term assets and liabilities, derivative
assets and liabilities, other operating, net, distributions from net income of unconsolidated affiliates and taxes. (6) Adj. Cash from Operations and Free Cash Flow: see Non-
GAAP Financial Measures.
10
FY 2017 Actuals Guidance
GAAP $122M $(50) - $150M
Adjusted* $972M $800M - $1B
*Adjusted to exclude incremental, voluntary pension
contribution to the U.S. plan of $500M and $350M impact
of accounts receivable (A/R) sales programs elimination

Capital Structure
Continued progress optimizing capital structure post separation
Core debt reflects declines sequentially
• $475M used in October to re-finance a portion of our May 2018 Senior Notes
In 2017, made significant progress on pensions, net unfunded pension liabilities decreased $812M to $1.35B
Core debt level managed to maintain investment grade financial profile
As of December 31, 2017
(in billions) Fin. Assets Debt Cash
Financing $ 4.2 $ 3.7
Core - 1.8
Total Xerox $ 4.2 $ 5.5 $ 1.3
Customer Financing and Debt
• Customer value proposition includes leasing of
Xerox equipment
• Maintain 7:1 debt to equity leverage ratio on
these finance assets
11

12
2018 Full-Year Guidance
Cash Flow from
Continuing Ops 2017 Actuals 2018
Operating Cash Flow$122M
$972M Adjusted$900M - $1.1B
Free Cash Flow1 $17M
$867M Adjusted$750M - $950M
(1) Constant Currency (CC) and other adjusted measures: see Non-GAAP Financial Measures. (2) EPS from Continuing Operations. (3) 2018
Adjusted EPS to GAAP EPS differences include non-service retirement related costs, restructuring and related costs, amortization of intangibles,
as well as other discretely identified adjustments. (4) Year-over-year CAPEX increase driven by incremental transformative IT. (5) Remaining
6.35% Senior Notes due May 2018.
P&L 2017 Actuals 2018
Revenue CC1 (4.7)% (2)% - (4)%
Adj. Operating Margin1 12.8% 13% - 14%
Adj. Tax Rate1 25.0% 24% - 27%
GAAP EPS2 $0.70 $2.30 - $2.50
Adj. EPS1,3 $3.48 $3.50 - $3.70
Capital Allocation 2017 Actuals 2018
Common Dividends $274M$1.00 per share;
~$260M
CAPEX4 $105M ~$150M
M&A $87M $150M - $200M
Debt Reduction5 $800M ~$265M

13
2017: Delivered on
Commitments
2018: Building on
Momentum
• Strong fourth-quarter and full-year
performance reflects successful execution of
strategy and Strategic Transformation
• Building on foundation for continued progress
in 2018
‒ Drive revenue improvement by accelerating
MPS, workflow and SMB
‒ Strategic Transformation continues to enable
margin expansion and investment
‒ Strengthened capital structure supports strong
cash flow

14
Appendix

Revenue Trend
(in millions) Q1 Q2 Q3 Q4 FY Q1 Q2 Q3 Q4 FY
Total Revenue $2,615 $2,793 $2,629 $2,734 $10,771 $2,454 $2,567 $2,497 $2,747 $10,265
% Change (6.8)% (4.6)% (5.6)% (7.2)% (6.1)% (6.2)% (8.1)% (5.0)% 0.5% (4.7)%
CC1 % Change (4.7)% (3.4)% (4.1)% (5.0)% (4.3)% (4.3)% (6.4)% (5.9)% (2.0)% (4.7)%
Post Sale2 $2,073 $2,143 $2,056 $2,080 $8,352 $1,952 $2,021 $1,976 $2,065 $8,014
% Change (5.7)% (4.2)% (3.9)% (5.5)% (4.8)% (5.8)% (5.7)% (3.9)% (0.7)% (4.0)%
CC1 % Change (3.3)% (2.9)% (2.2)% (3.2)% (2.9)% (3.9)% (3.9)% (4.8)% (3.1)% (3.9)%
Post Sale % Revenue
79% 77% 78% 76% 78% 80% 79% 79% 75% 78%
Equipment2 $542 $650 $573 $654 $2,419 $502 $546 $521 $682 $2,251
% Change (11.0)% (5.7)% (11.4)% (12.1)% (10.0)% (7.4)% (16.0)% (9.1)% 4.3% (6.9)%
CC1 % Change (9.7)% (4.9)% (10.4)% (10.1)% (8.7)% (5.7)% (14.6)% (10.0)% 1.5% (7.2)%
Memo:
OEM and CMS impact on Total Revenue
(0.3) pts (0.2) pts (0.6) pts (0.7) pts (0.4) pts (0.9) pts (0.6) pts (0.3) pts (0.7) pts (0.6) pts
(1) Constant currency: see Non-GAAP Financial Measures. (2) Equipment sales revenue in 2016 has been revised to reclassify certain GIS IT-
related equipment sales to Other sales, which are included in Post Sale revenue.
2016
15
2017

16
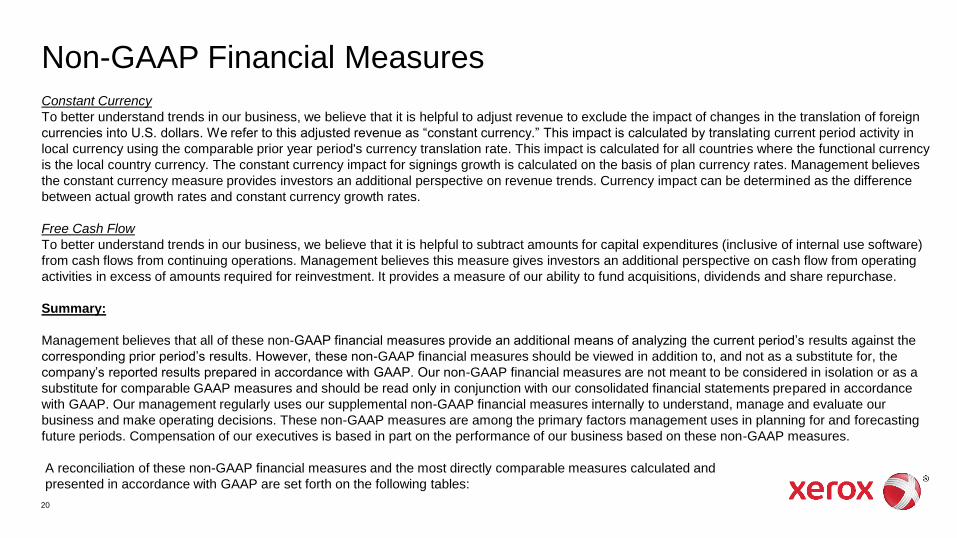
Non-GAAP Financial Measures

17
Non-GAAP Financial MeasuresWe have reported our financial results in accordance with generally accepted accounting principles (GAAP). In addition, we have discussed our
financial results using the non-GAAP measures described below. We believe these non-GAAP measures allow investors to better understand the
trends in our business and to better understand and compare our results. Accordingly, we believe it is necessary to adjust several reported amounts,
determined in accordance with GAAP, to exclude the effects of certain items as well as their related income tax effects.
A reconciliation of these non-GAAP financial measures to the most directly comparable financial measures calculated and presented in accordance
with GAAP are set forth below as well as on our website at www.xerox.com/investor.
These non-GAAP financial measures should be viewed in addition to, and not as a substitute for, the company’s reported results prepared in
accordance with GAAP.
Adjusted Earnings Measures
• Net income and Earnings per share (EPS)
• Effective tax rate
• Gross margin, RD&E and SAG (only adjusted for non-service retirement-related costs and transaction/proxy related costs)
The above measures were adjusted for the following items:
• Amortization of intangible assets: The amortization of intangible assets is driven by our acquisition activity which can vary in size, nature and timing
as compared to other companies within our industry and from period to period. The use of intangible assets contributed to our revenues earned
during the periods presented and will contribute to our future period revenues as well. Amortization of intangible assets will recur in future periods.

18
Non-GAAP Financial Measures
• Restructuring and related costs: Restructuring and related costs include restructuring and asset impairment charges as well as costs associated
with our Strategic Transformation program beyond those normally included in restructuring and asset impairment charges. Restructuring consists of
costs primarily related to severance and benefits paid to employees pursuant to formal restructuring and workforce reduction plans. Asset
impairment includes costs incurred for those assets sold, abandoned or made obsolete as a result of our restructuring actions, exiting from a
business or other strategic business changes. Additional costs for our Strategic Transformation program are primarily related to the implementation
of strategic actions and initiatives and include third-party professional service costs as well as one-time incremental costs. All of these costs can
vary significantly in terms of amount and frequency based on the nature of the actions as well as the changing needs of the business. Accordingly,
due to that significant variability, we will exclude these charges since we do not believe they provide meaningful insight into our current or past
operating performance nor do we believe they are reflective of our expected future operating expenses as such charges are expected to yield future
benefits and savings with respect to our operational performance.
• Non-service retirement-related costs: Our defined benefit pension and retiree health costs include several elements impacted by changes in plan
assets and obligations that are primarily driven by changes in the debt and equity markets as well as those that are predominantly legacy in nature
and related to employees who are no longer providing current service to the company (e.g. retirees and ex-employees). These elements include (i)
interest cost, (ii) expected return on plan assets, (iii) amortized actuarial gains/losses and (iv) the impacts of any plan settlements/curtailments.
Accordingly, we consider these elements of our periodic retirement plan costs to be outside the operational performance of the business or legacy
costs and not necessarily indicative of current or future cash flow requirements. Adjusted earnings will continue to include the elements of our
retirement costs related to current employee service (service cost and amortization of prior service cost) as well as the cost of our defined
contribution plans.

19
Non-GAAP Financial Measures
• Other discrete, unusual or infrequent items: In addition, we also excluded the following items given their discrete, unusual or infrequent nature and
their impact on our results for the period:
• Losses on early extinguishment of debt in the first and fourth quarter of 2017
• A benefit from the remeasurement of a tax matter in the first quarter of 2017 that related to a previously adjusted item
• Costs incurred in the fourth quarter of 2017 related to the recently announced transaction with Fujifilm as well as to our expected proxy
contest. These costs are primarily for third-party investment banking, legal, accounting, consulting and other similar services.
• An estimated non-cash charge in the fourth quarter 2017 reflecting the impact associated with the enactment of the Tax Cuts and Jobs Act
(the "Tax Act") in December 2017. See our Fourth Quarter 2017 Earnings Release on Form 8-K filed with the Securities and Exchange
Commission.
We believe the exclusion of these items allows investors to better understand and analyze the results for the period as compared to prior periods and
expected future trends in our business.
Adjusted Operating Income/Margin
We also calculate and utilize adjusted operating income and margin measures by adjusting our reported pre-tax income and margin amounts. In
addition to the costs and expenses noted as adjustments for our Adjusted Earnings measures, adjusted operating income and margin also exclude
Other expenses, net. Other expenses, net is primarily comprised of non-financing interest expense and also includes certain other non-operating
costs and expenses. We exclude these amounts in order to evaluate our current and past operating performance and to better understand the
expected future trends in our business. Adjusted Operating income and margin also include Equity in net income of unconsolidated affiliates. Equity
in net income of unconsolidated affiliates primarily reflects our 25% share of Fuji Xerox net income. We include this amount in our measure of
operating income and margin as Fuji Xerox is our primary intermediary to the Asia/Pacific market for distribution of Xerox branded products and
services.
20
Non-GAAP Financial MeasuresConstant Currency
To better understand trends in our business, we believe that it is helpful to adjust revenue to exclude the impact of changes in the translation of foreign
currencies into U.S. dollars. We refer to this adjusted revenue as “constant currency.” This impact is calculated by translating current period activity in
local currency using the comparable prior year period's currency translation rate. This impact is calculated for all countries where the functional currency
is the local country currency. The constant currency impact for signings growth is calculated on the basis of plan currency rates. Management believes
the constant currency measure provides investors an additional perspective on revenue trends. Currency impact can be determined as the difference
between actual growth rates and constant currency growth rates.
Free Cash Flow
To better understand trends in our business, we believe that it is helpful to subtract amounts for capital expenditures (inclusive of internal use software)
from cash flows from continuing operations. Management believes this measure gives investors an additional perspective on cash flow from operating
activities in excess of amounts required for reinvestment. It provides a measure of our ability to fund acquisitions, dividends and share repurchase.
Summary:
Management believes that all of these non-GAAP financial measures provide an additional means of analyzing the current period’s results against the
corresponding prior period’s results. However, these non-GAAP financial measures should be viewed in addition to, and not as a substitute for, the
company’s reported results prepared in accordance with GAAP. Our non-GAAP financial measures are not meant to be considered in isolation or as a
substitute for comparable GAAP measures and should be read only in conjunction with our consolidated financial statements prepared in accordance
with GAAP. Our management regularly uses our supplemental non-GAAP financial measures internally to understand, manage and evaluate our
business and make operating decisions. These non-GAAP measures are among the primary factors management uses in planning for and forecasting
future periods. Compensation of our executives is based in part on the performance of our business based on these non-GAAP measures.
A reconciliation of these non-GAAP financial measures and the most directly comparable measures calculated and
presented in accordance with GAAP are set forth on the following tables:

21
Net Income and EPS reconciliation
(in millions, except per share amounts)
Net (Loss)
Income
Diluted
EPS
Net
Income
Diluted
EPS
Net
Income
Diluted
EPS
Net
Income
Diluted
EPS
As Reported (1)
$ (196) $ (0.78) $ 185 $ 0.70 $ 192 $ 0.70 $ 622 $ 2.33
Restructuring and related costs 24 92 220 264
Amortization of intangible assets 12 14 53 58
Non-service retirement-related costs 62 19 198 131
Loss on extinguishment of debt 7 - 20 -
Transaction and proxy related fees 9 - 9 -
Income tax on adjustments (2)
(45) (46) (171) (151)
US Tax Act 400 - 400 -
Remeasurement of unrecognized tax positions - - (16) -
Restructuring and other charges - Fuji Xerox (3)
1 - 10 3
Adjusted 274$ $ 1.04 264$ $ 1.00 915$ $ 3.48 927$ $ 3.53
Dividends on preferred stock used in adjusted EPS calculation (4)
$ - $ - $ - $ 24
Weighted average shares for adjusted EPS (4)
264 264 263 256
Fully diluted shares at end of period (5)
264
(1) Net (Loss) Income and EPS from continuing operations attributable to Xerox.
(3) Other charges in 2017 represent audit and other fees associated with the independent investigation of Fuji Xerox's accounting practices.(4) For those periods that exclude the preferred stock dividend the average shares for the calculations of diluted EPS include 7 million shares associated with our Series A or Series B
convertible preferred stock.
(5) Represents common shares outstanding at December 31, 2017 as well as shares associated with our Series B convertible preferred stock plus dilutive potential common shares as
used for the calculation of diluted earnings per share for the fourth quarter 2017.
Three Months Ended
December 31, 2017
Three Months Ended
December 31, 2016
Year Ended
December 31, 2017
Year Ended
December 31, 2016
(2) Refer to Effective Tax Rate reconciliation.

22
Effective Tax Rate reconciliation
(in millions)
Pre-Tax
Income
Income Tax
Expense
Effective
Tax Rate
Pre-Tax
Income
Income Tax
Expense
Effective
Tax Rate
Pre-Tax
Income
Income Tax
Expense
Effective
Tax Rate
Pre-Tax
Income
Income Tax
Expense
Effective
Tax Rate
Reported (1)
$ 226 $ 444 196.5% $ 179 $ 18 10.1% $ 570 $ 481 84.4% $ 568 $ 62 10.9%
Non-GAAP Adjustments (2)
114 45 125 46 500 171 453 151
US Tax Act - (400) - - - (400) - -
Remeasurement of unrecognized
tax positions - - - - - 16 - -
Adjusted (3)
$ 340 $ 89 26.2% $ 304 $ 64 21.1% $ 1,070 $ 268 25.0% $ 1,021 $ 213 20.9%
__________
(1) Pre-Tax Income and Income Tax Expense from continuing operations.
(2) Refer to Net Income and EPS reconciliations for details.
Three Months Ended
December 31, 2017
Three Months Ended
December 31, 2016
Year Ended
December 31, 2017
Year Ended
December 31, 2016
(3) The tax impact on the Adjusted Pre‐Tax Income from continuing operations is calculated under the same accounting principles applied to the As Reported Pre-Tax Income under ASC 740, which employs an
annual effective tax rate method to the results.

23
Key Financial Ratios – Q4
(1) Revenue and costs from continuing operations.
(2) 2017 includes adjustments for non-service retirement-related costs and transaction/proxy-related costs. 2016 includes
adjustments for non-service retirement-related costs.
(in millions)
Total Revenues $ 2,747 $ - $ 2,747 $ 2,734 $ - $ 2,734
Total Gross Profit 1,088 23 1,111 1,094 7 1,101
Post Sale Revenue 2,065 - 2,065 2,080 - 2,080
Post Sale Gross Profit 901 23 924 889 7 896
RD&E 114 (8) 106 113 (4) 109
SAG 676 (40) 636 639 (8) 631
Total Gross Margin 39.6 % 40.4 % 40.0 % 40.3 %
Post Sale Gross Margin 43.6 % 44.7 % 42.7 % 43.1 %
RD&E as a % of Revenue 4.1 % 3.9 % 4.1 % 4.0 %
SAG as a % of Revenue 24.6 % 23.2 % 23.4 % 23.1 %
December 31, 2017 December 31, 2016
Three Months Ended Three Months Ended
As Reported (1)
Adjustments (2) Adjusted As Reported
(1)Adjustments
(2) Adjusted

24
Key Financial Ratios – FY
(1) Revenue and costs from continuing operations.
(2) 2017 includes adjustments for non-service retirement-related costs and transaction/proxy-related costs. 2016 includes
adjustments for non-service retirement-related costs.
(in millions)
Total Revenues $ 10,265 $ - $ 10,265 $ 10,771 $ - $ 10,771
Total Gross Profit 4,061 75 4,136 4,261 49 4,310
Post Sale Revenue 8,014 - 8,014 8,352 - 8,352
Post Sale Gross Profit 3,414 75 3,489 3,513 49 3,562
RD&E 446 (25) 421 476 (25) 451
SAG 2,631 (107) 2,524 2,695 (57) 2,638
Total Gross Margin 39.6 % 40.3 % 39.6 % 40.0 %
Post Sale Gross Margin 42.6 % 43.5 % 42.1 % 42.6 %
RD&E as a % of Revenue 4.3 % 4.1 % 4.4 % 4.2 %
SAG as a % of Revenue 25.6 % 24.6 % 25.0 % 24.5 %
Year Ended
December 31, 2017 December 31, 2016
Year Ended
AdjustedAs Reported (1)
Adjustments (2) Adjusted As Reported
(1)Adjustments
(2)

25
Operating Income/Margin reconciliation – Q4
(1) Pre-Tax Income and revenue from continuing operations.
(2) Other charges in 2017 represent audit and other fees associated with the independent investigation of Fuji Xerox’s
accounting practices.
(in millions) Profit Revenue Margin Profit Revenue Margin
Reported (1)
226$ 2,747$ 8.2% 179$ 2,734$ 6.5%
Adjustments:
Restructuring and related costs 24 92
Amortization of intangible assets 12 14
Non-service retirement-related costs 62 19
Transaction and proxy related fees 9 -
Equity in net income of unconsolidated affiliates 25 27
Restructuring and other charges - Fuji Xerox (2)
1 -
Other expenses, net 36 57
Adjusted 395$ 2,747$ 14.4% 388$ 2,734$ 14.2%
Three Months Ended December 31, 2017 Three Months Ended December 31, 2016

26
Operating Income/Margin reconciliation – FY
(1) Pre-Tax Income and revenue from continuing operations.
(2) Other charges in 2017 represent audit and other fees associated with the independent investigation of Fuji Xerox’s
accounting practices.
(in millions) Profit Revenue Margin Profit Revenue Margin
Reported (1)
570$ 10,265$ 5.6% 568$ 10,771$ 5.3%
Adjustments:
Restructuring and related costs 220 264
Amortization of intangible assets 53 58
Non-service retirement-related costs 198 131
Transaction and proxy related fees 9 -
Equity in net income of unconsolidated affiliates 115 127
Restructuring and other charges - Fuji Xerox (2)
10 3
Other expenses, net 141 200
Adjusted 1,316$ 10,265$ 12.8% 1,351$ 10,771$ 12.5%
Year Ended December 31, 2017 Year Ended December 31, 2016

27
Other expenses, net
(in millions) December 31, 2017 December 31, 2016
Other expenses, net - Reported 36$ 57$
Adjustment:
Loss on early extinguishment of debt (7) -
Other expenses, net - Adjusted 29$ 57$
Three Months Ended

28
Operating Cash Flow / Free Cash Flow reconciliation
(1) Operating Cash Flow and Free Cash Flow from continuing operations.
(in millions) Q4 2017 Actual FY 2017 Actual FY 2018 Guidance
Operating Cash Flow (1)
(28)$ 122$ $ 900 - 1,100
Less: CAPEX (inclusive of Internal Use Software) (35) (105) (150)
Free Cash Flow (1)
(63)$ 17$ $ 750 - 950
(in millions) Q4 2017 Actual FY 2017 Actual FY 2017 Guidance
Operating Cash Flow (1)
(28)$ 122$ $ (50) - 150
Elimination of certain accounts receivables sales programs 350 350 350
Incremental, voluntary contributions to U.S. defined benefit pension plans - 500 500
Adjusted Operating Cash Flow (1)
322 972 $ 800 - 1,000
Less: CAPEX (inclusive of Internal Use Software) (35) (105)
Adjusted Free Cash Flow (1)
287$ 867$

29
EPS Guidance
Note: Adjusted EPS guidance excludes non-service retirement related costs, restructuring and related costs, amortization
of intangibles, as well as other discretely identified adjustments.
FY 2018
GAAP EPS from Continuing Operations $2.30 - $2.50
Non-GAAP Adjustments 1.20
Adjusted EPS from Continuing Operations $3.50 - $3.70

© 2018 Xerox Corporation. All rights reserved. Xerox® and Xerox and Design® are trademarks of Xerox Corporation in the United States and/or other countries.