2019 Symbiotics MIV Survey - Presentation€¦ · Social and Governance (ESG) practices and...
56
2019 SYMBIOTICS MIV SURVEY Market Data & Peer Group Analysis 13 th edition September 2019
Transcript of 2019 Symbiotics MIV Survey - Presentation€¦ · Social and Governance (ESG) practices and...
2019 SYMBIOTICS MIV SURVEYMarket Data & Peer Group Analysis
13th editionSeptember 2019
2019 Symbiotics MIV Survey
Page 2
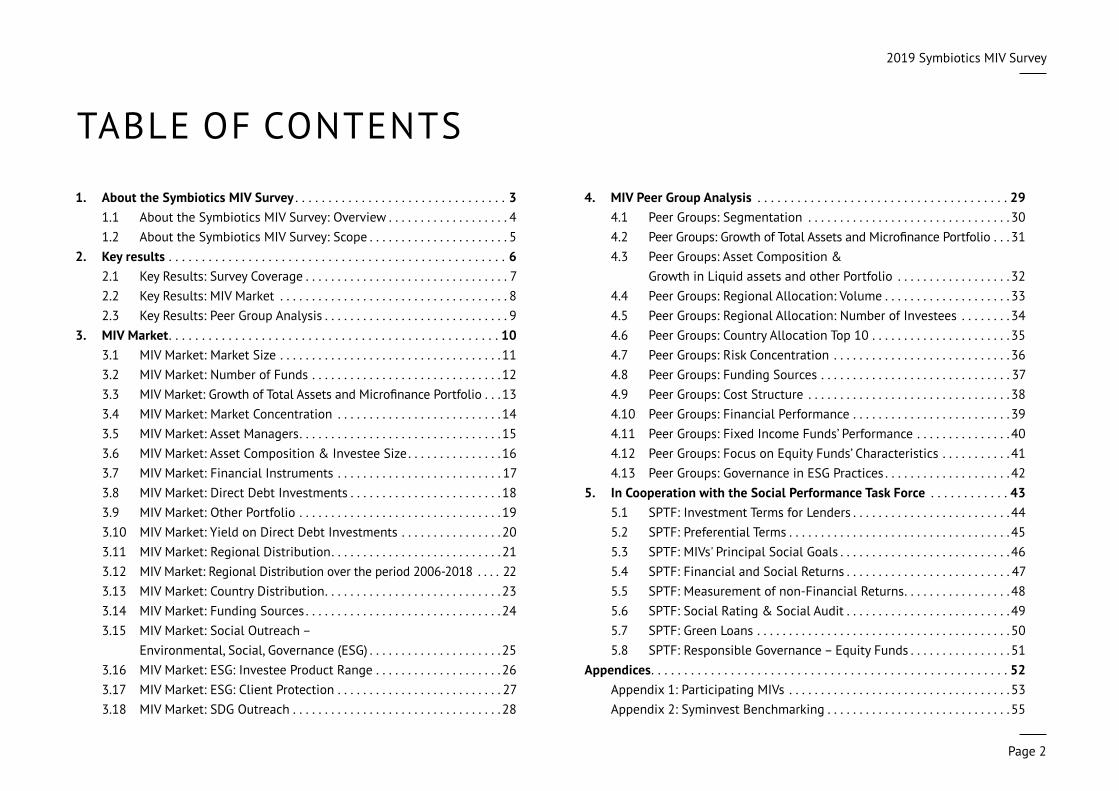
TABLE OF CONTENTS
1. About the Symbiotics MIV Survey . . . . . . . . . . . . . . . . . . . . . . . . . . . . . . . . 31 .1 About the Symbiotics MIV Survey: Overview . . . . . . . . . . . . . . . . . . . 41 .2 About the Symbiotics MIV Survey: Scope . . . . . . . . . . . . . . . . . . . . . . 5
2. Key results . . . . . . . . . . . . . . . . . . . . . . . . . . . . . . . . . . . . . . . . . . . . . . . . . . . 62 .1 Key Results: Survey Coverage . . . . . . . . . . . . . . . . . . . . . . . . . . . . . . . . 72 .2 Key Results: MIV Market . . . . . . . . . . . . . . . . . . . . . . . . . . . . . . . . . . . . 82 .3 Key Results: Peer Group Analysis . . . . . . . . . . . . . . . . . . . . . . . . . . . . . 9
3. MIV Market . . . . . . . . . . . . . . . . . . . . . . . . . . . . . . . . . . . . . . . . . . . . . . . . . . 103 .1 MIV Market: Market Size . . . . . . . . . . . . . . . . . . . . . . . . . . . . . . . . . . . 113 .2 MIV Market: Number of Funds . . . . . . . . . . . . . . . . . . . . . . . . . . . . . . 123.3 MIVMarket:GrowthofTotalAssetsandMicrofinance Portfolio . . . 133 .4 MIV Market: Market Concentration . . . . . . . . . . . . . . . . . . . . . . . . . . 143 .5 MIV Market: Asset Managers . . . . . . . . . . . . . . . . . . . . . . . . . . . . . . . . 153 .6 MIV Market: Asset Composition & Investee Size . . . . . . . . . . . . . . . 163 .7 MIV Market: Financial Instruments . . . . . . . . . . . . . . . . . . . . . . . . . . 173 .8 MIV Market: Direct Debt Investments . . . . . . . . . . . . . . . . . . . . . . . . 183 .9 MIV Market: Other Portfolio . . . . . . . . . . . . . . . . . . . . . . . . . . . . . . . . 193 .10 MIV Market: Yield on Direct Debt Investments . . . . . . . . . . . . . . . . 203 .11 MIV Market: Regional Distribution . . . . . . . . . . . . . . . . . . . . . . . . . . . 213 .12 MIV Market: Regional Distribution over the period 2006-2018 . . . . 223 .13 MIV Market: Country Distribution . . . . . . . . . . . . . . . . . . . . . . . . . . . . 233 .14 MIV Market: Funding Sources . . . . . . . . . . . . . . . . . . . . . . . . . . . . . . . 243 .15 MIV Market: Social Outreach –
Environmental, Social, Governance (ESG) . . . . . . . . . . . . . . . . . . . . . 253 .16 MIV Market: ESG: Investee Product Range . . . . . . . . . . . . . . . . . . . . 263 .17 MIV Market: ESG: Client Protection . . . . . . . . . . . . . . . . . . . . . . . . . . 273 .18 MIV Market: SDG Outreach . . . . . . . . . . . . . . . . . . . . . . . . . . . . . . . . . 28
4. MIV Peer Group Analysis . . . . . . . . . . . . . . . . . . . . . . . . . . . . . . . . . . . . . . 294 .1 Peer Groups: Segmentation . . . . . . . . . . . . . . . . . . . . . . . . . . . . . . . . 304.2 PeerGroups:GrowthofTotalAssetsandMicrofinance Portfolio . . . 314 .3 Peer Groups: Asset Composition &
Growth in Liquid assets and other Portfolio . . . . . . . . . . . . . . . . . . 324 .4 Peer Groups: Regional Allocation: Volume . . . . . . . . . . . . . . . . . . . . 334.5 PeerGroups:RegionalAllocation:Number of Investees . . . . . . . . 344 .6 Peer Groups: Country Allocation Top 10 . . . . . . . . . . . . . . . . . . . . . . 354 .7 Peer Groups: Risk Concentration . . . . . . . . . . . . . . . . . . . . . . . . . . . . 364 .8 Peer Groups: Funding Sources . . . . . . . . . . . . . . . . . . . . . . . . . . . . . . 374 .9 Peer Groups: Cost Structure . . . . . . . . . . . . . . . . . . . . . . . . . . . . . . . . 384 .10 Peer Groups: Financial Performance . . . . . . . . . . . . . . . . . . . . . . . . . 394 .11 Peer Groups: Fixed Income Funds’ Performance . . . . . . . . . . . . . . . 404 .12 Peer Groups: Focus on Equity Funds’ Characteristics . . . . . . . . . . . 414 .13 Peer Groups: Governance in ESG Practices . . . . . . . . . . . . . . . . . . . . 42
5. InCooperationwiththeSocial Performance TaskForce . . . . . . . . . . . . 435 .1 SPTF: Investment Terms for Lenders . . . . . . . . . . . . . . . . . . . . . . . . . 445 .2 SPTF: Preferential Terms . . . . . . . . . . . . . . . . . . . . . . . . . . . . . . . . . . . 455 .3 SPTF: MIVs' Principal Social Goals . . . . . . . . . . . . . . . . . . . . . . . . . . . 465.4 SPTF:FinancialandSocial Returns . . . . . . . . . . . . . . . . . . . . . . . . . . 475 .5 SPTF: Measurement of non-Financial Returns . . . . . . . . . . . . . . . . . 485 .6 SPTF: Social Rating & Social Audit . . . . . . . . . . . . . . . . . . . . . . . . . . 495 .7 SPTF: Green Loans . . . . . . . . . . . . . . . . . . . . . . . . . . . . . . . . . . . . . . . . 505 .8 SPTF: Responsible Governance – Equity Funds . . . . . . . . . . . . . . . . 51
Appendices . . . . . . . . . . . . . . . . . . . . . . . . . . . . . . . . . . . . . . . . . . . . . . . . . . . . . . 52Appendix 1: Participating MIVs . . . . . . . . . . . . . . . . . . . . . . . . . . . . . . . . . . . 53Appendix 2: Syminvest Benchmarking . . . . . . . . . . . . . . . . . . . . . . . . . . . . . 55

1 .ABOUT THE SYMBIOTICS MIV SURVEY

2019 Symbiotics MIV Survey
Page 4
1 .1 ABOUT THE SYMBIOTICS MIV SURVEY OVERVIEW
ABOUT THE SURVEY
The 2019 Symbiotics MIV Survey, produced on an annual basis, aims to provide
comprehensivemarkettrendsandpeergroupanalysisonmicrofinanceoff-
shoreinvestments.Itsprimaryfunctionistoallowmicrofinanceinvestorsand
fund managers to benchmark themselves and improve their knowledge of the
industry . It also allows academia researchers and companies to have access to
uniquehistoricalinformationaboutmicrofinancefunds.
TheSurvey,inits13thedition,isbasedonDecember2018financialandsocial
performanceindicatorsreportedbythelargemajorityofactivemicrofinance
investment vehicles (MIVs) . Participating MIVs report their data based on the
CGAP MIV Disclosure Guidelines (2010) and the MicrofinanceInvestment
Vehicles Disclosure Guidelines: Additional Indicators (2015) developed by
Symbioticsincollaborationwithothermicrofinanceassetmanagers.
The survey offers two levels of analysis and benchmarking:
1 . Key market trends of all MIVs that have participated in this year’s survey .
2 . Peer group analysis based on MIVs’ strategy (Fixed Income Funds; Mixed
Funds; Equity Funds) .
It focuses on two dimensions:
1 . Financialperformance,withanemphasisongrowth,risk,return,efficiency
and funding patterns .
2 . Social performance, with an emphasis on commitment to Environmental,
Social and Governance (ESG) practices and reporting .
Aligned with the industry's continuous efforts to bring increased transparency
on the social performance front, Symbiotics has collected and reported for the
fourth consecutive year on a number of ESG indicators developed by the Social
Performance Task Force (SPTF) . The SPTF is a global membership organization
that works to advance social performance management across the industry .
2019 Symbiotics MIV Survey
Page 5
1 .2 ABOUT THE SYMBIOTICS MIV SURVEY SCOPE
SAMPLE CHARACTERISTICS
The survey sample compiles data from the following types of vehicles:
§ Independent investment entities, open to multiple investors, with more than
50%oftheirnon-cashassetsinvestedinmicrofinance(MIVs).Theyareeither
self-managedormanagedbyaninvestmentmanagementfirm.
§ Microfinanceinvestmentfundsthatarenotopentomultipleinvestors.These
areclassifiedas“OtherMicrofinanceInvestmentIntermediaries(MIIs)”asper
the CGAP MIV Disclosure Guidelines .
Thesurveysampledoesnotincludemicrofinancefundsoffunds,peer-to-peer
microlenders or holding companies .
THE BENCHMARK AND PEER GROUPS
The 2019 Symbiotics MIV Survey offers a benchmark comprised of 87 MIVs .
These87MIVsareclassifiedintothefollowingpeergroupsaccordingtotheir
financialinstruments:
§ FixedIncomeFunds: Investment funds and vehicles of which the core
activity,definedasmorethan85%oftheirtotalnon-cashassets,istoinvest
in debt instruments .
§ MixedFunds: Investment funds and vehicles that invest in both debt and
equity with more than 15% and less than 65% of their total non-cash assets
invested in equity investments .
§ EquityFunds: Investment funds and vehicles of which the core activity,
definedasmorethan65%oftheirtotalnon-cashassets,istoinvestin
equity instruments .
Theabovepeer-groupclassificationismadeinaccordancewiththeCGAP MIV
Disclosure Guidelinesandcouldresultinadifferentclassificationcomparedto
the MIV’s mission statement .

2 .KEY RESULTS

2019 Symbiotics MIV Survey
Page 7
2 .1 KEY RESULTS SURVEY COVERAGE
§ Sample: The 13th edition of the MIV Survey has maintained a high
participationrateinanexpandingmarket:outofthe121MIVsidentified,
87 fundsparticipatedandwereincludedinthefinalbenchmark.
§ Size:These 87 MIVs had USD 15 .3 billion of total assets under management
as of December 31st, 2018 .
§ Marketshare&Growth: They represent 91% of the total estimated MIV asset
base (USD 16 .9 billion) which has grown by 6 .1% in 2018 .
§ Peergroups: Out of the participating MIVs (87): 52 are Fixed Income Funds,
16 are Mixed Funds and 19 are Equity Funds .
ASSETS UNDER MANAGEMENT OF MIVs (USD billion)
MARKET SHARE OF MIVs PARTICIPATING IN THE SURVEY (in %)
0 2 4 6 8 10 12 14 16 18
Estimation of the MIV Universe
MIV Survey Size
16.9
15.3
0% 20% 40% 60% 80% 100%
91

2019 Symbiotics MIV Survey
Page 8
2 .2 KEY RESULTS MIV MARKET
§ Growth: In 2018, MIVs witnessed a slight growth in total assets (+2 .2%) and
microfinanceportfolio(+3.1%).Annualgrowthfiguresweresmallerthanin
2017(18.1%fortotalassets;18.3%formicrofinanceportfolio).
§ Domicile: The 87 MIVs from the benchmark were managed by 43 different
asset managers located in 19 countries . Switzerland remained the prime
locationofmicrofinanceassetmanagementwitha41%marketshare.
§ Regionaltrends: MIV investments continued to grow in Latin America & the
Caribbean,whichremainedthelargestregionintermsofdirectmicrofinance
portfolio,whileinvestmentsinSouthAsiaandEastAsia&Pacificstagnated
in 2018 .
§ Fundingsources: Compared to 2017, private institutional investors increased
their contribution in MIVs by 3%, retail & high net worth investors by 2%
while public sector funders decreased their share by 2% .
§ Assetstructure: MIVs continued to increase their allocation to other impact
themesthanmicrofinance,from11%oftotalassetsin2017to12%atthe
end of 2018 . This increase parallels the decrease of the liquid assets (from
11% to 9%) .
§ SustainableDevelopmentGoals: Among the 40 respondents mapping their
social goals against the Sustainable Development Goals, goal 5 (gender
equality), goal 1 (No Poverty) and goal 8 (Decent Work & Economic Growth)
were the most frequently cited .
AVERAGE VOLUME OF REGIONAL EXPOSURE (USD million)
0
10
20
30
40
50
SSAMENASAEAPLACEECA
Growth(2017-2018) 6% 7% -4%-1% 25% 8%
2018 AverageInvestment Size 3.7 3.0 4.63.2 0.7 1.6
20182017
11.6 12.4
4.2 5.3
23.8 22.820.4 20.2
36.4 38.0
47.8 50.4
MIV MARKET SDG OUTREACH
0
10
20
30
40
410815
36 20243435
No Poverty1
Decent Work and Economic Growth8
Quality Education4
Reduced Inequalities10
Gender Equality5
2019 Symbiotics MIV Survey
Page 9
2 .3 KEY RESULTS PEER GROUP ANALYSIS
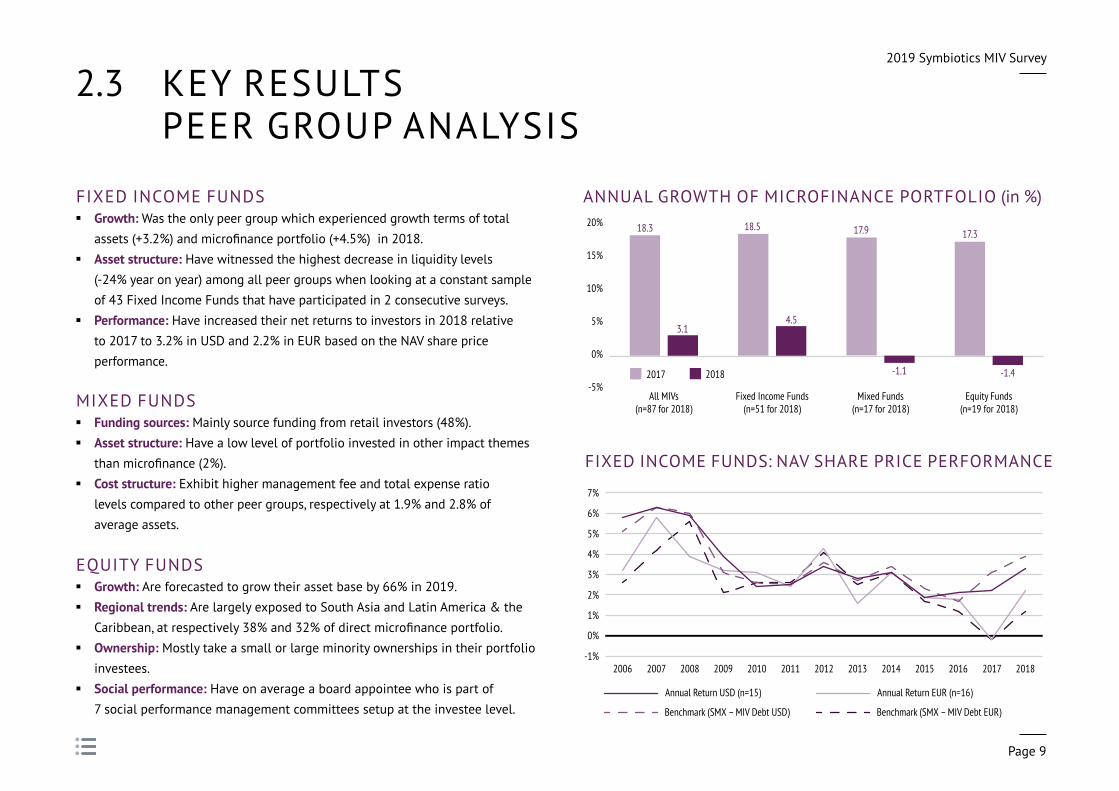
FIXED INCOME FUNDS § Growth: Was the only peer group which experienced growth terms of total assets(+3.2%)andmicrofinanceportfolio(+4.5%)in2018.
§ Assetstructure: Have witnessed the highest decrease in liquidity levels (-24% yearonyear)amongallpeergroupswhenlookingataconstantsampleof 43 Fixed Income Funds that have participated in 2 consecutive surveys .
§ Performance: Have increased their net returns to investors in 2018 relative to 2017 to 3 .2% in USD and 2 .2% in EUR based on the NAV share price performance .
MIXED FUNDS § Fundingsources: Mainly source funding from retail investors (48%) . § Assetstructure: Have a low level of portfolio invested in other impact themes thanmicrofinance(2%).
§ Coststructure: Exhibit higher management fee and total expense ratio levels comparedtootherpeergroups,respectivelyat1.9%and2.8%ofaverage assets .
EQUITY FUNDS § Growth: Are forecasted to grow their asset base by 66% in 2019 . § Regionaltrends: Are largely exposed to South Asia and Latin America & the Caribbean,atrespectively38%and32%ofdirectmicrofinanceportfolio.
§ Ownership: Mostly take a small or large minority ownerships in their portfolio investees .
§ Socialperformance: Have on average a board appointee who is part of 7 socialperformancemanagementcommitteessetupattheinvesteelevel.
FIXED INCOME FUNDS: NAV SHARE PRICE PERFORMANCE
ANNUAL GROWTH OF MICROFINANCE PORTFOLIO (in %)
-5%
0%
5%
10%
15%
20%
Equity Funds(n=19 for 2018)
Mixed Funds(n=17 for 2018)
Fixed Income Funds(n=51 for 2018)
All MIVs(n=87 for 2018)
18.3 18.5
20182017
3.14.5
17.9
-1.1
17.3
-1.4
-1%
0%
1%
2%
3%
4%
5%
6%
7%
2018201720162015201420132012201120102009200820072006
Benchmark (SMX – MIV Debt USD)
Annual Return USD (n=15)
Benchmark (SMX – MIV Debt EUR)
Annual Return EUR (n=16)

3 .MIV MARKET
2019 Symbiotics MIV Survey
Page 11
3 .1 MIV MARKET MARKET SIZE
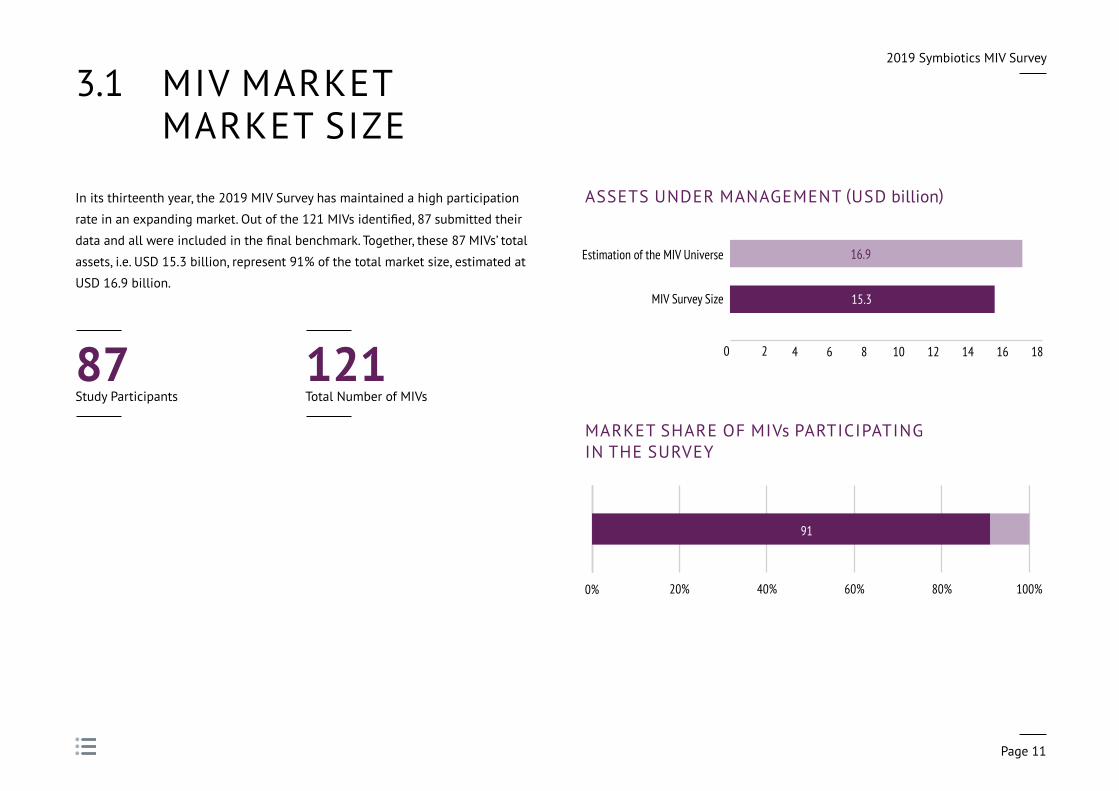
In its thirteenth year, the 2019 MIV Survey has maintained a high participation
rateinanexpandingmarket.Outofthe121MIVsidentified,87submittedtheir
dataandallwereincludedinthefinalbenchmark.Together,these87MIVs’total
assets, i .e . USD 15 .3 billion, represent 91% of the total market size, estimated at
USD 16 .9 billion .
87Study Participants
121Total Number of MIVs
ASSETS UNDER MANAGEMENT (USD billion)
MARKET SHARE OF MIVs PARTICIPATING IN THE SURVEY
0 2 4 6 8 10 12 14 16 18
Estimation of the MIV Universe
MIV Survey Size
16.9
15.3
0% 20% 40% 60% 80% 100%
91
2019 Symbiotics MIV Survey
Page 12
3 .2 MIV MARKET NUMBER OF FUNDS
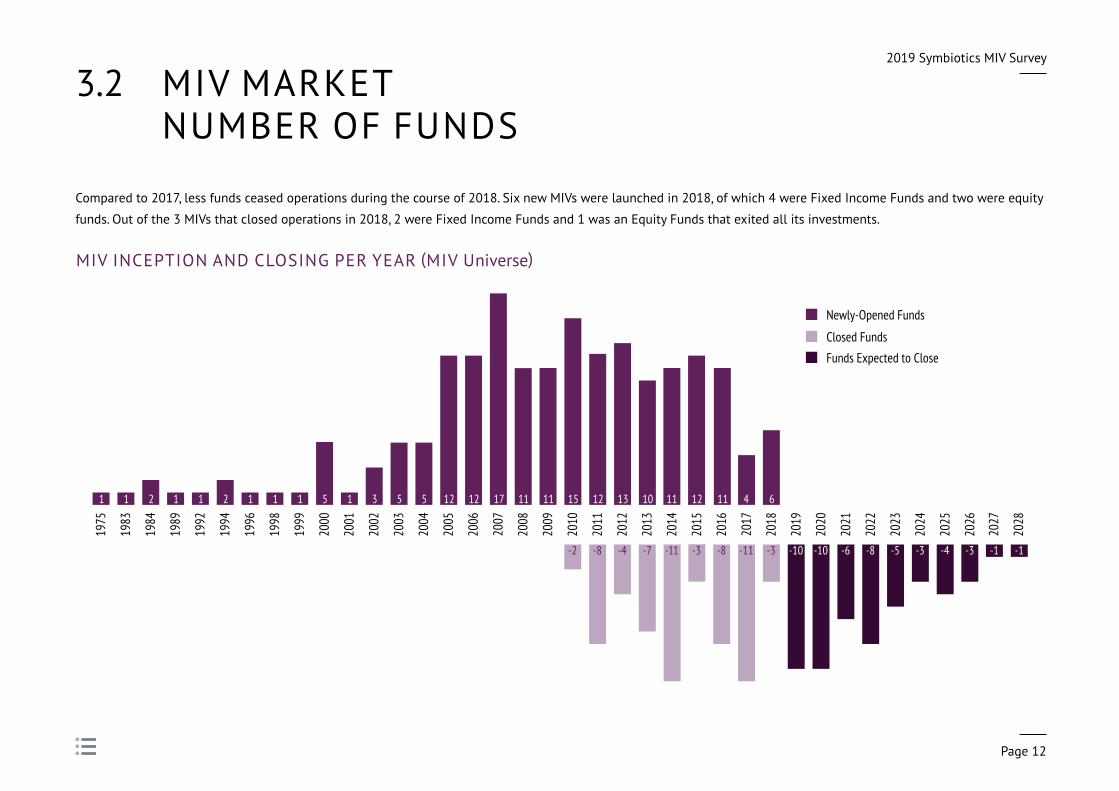
Compared to 2017, less funds ceased operations during the course of 2018 . Six new MIVs were launched in 2018, of which 4 were Fixed Income Funds and two were equity
funds . Out of the 3 MIVs that closed operations in 2018, 2 were Fixed Income Funds and 1 was an Equity Funds that exited all its investments .
MIV INCEPTION AND CLOSING PER YEAR (MIV Universe)
1975
1983
1984
1989
1992
1994
1996
1998
1999
2000
2001
2002
2003
2004
2005
2006
2007
2008
2009
2010
2011
2012
2013
2014
2015
2016
2017
2018
2019
2020
2021
2022
2023
2024
2025
2026
2027
Funds Expected to Close
Closed Funds
Newly-Opened Funds
1 1 2 1 1 2 4 61 1 1 5 1 3 5 5 12 12 17 11 11 15
-10-8 -11 -3 -10 -6 -8 -5 -3 -4 -3 -1
2028
-1
12 13 10 11 12
-3-2 -8 -4 -7 -11
11

2019 Symbiotics MIV Survey
Page 13
3 .3 MIV MARKET GROWTH OF TOTAL ASSETS AND
MICROFINANCE PORTFOLIO
Following a strong growth of 18 .1% in 2017, the
asset managers forecasted a lower growth of 12%
for 2018 . The actual 2018 growth was even lower
at 2 .2% when considering end of year exchange
rates and 4 .6% when applying a constant exchange
rate over the period 2017-2018 . In 2019, MIVs
that are expected to remain active are estimated
to resume growth, at a rate of 9 .5% . Since 2006,
the MIV market size has increased seven-fold,
representing a compounded annual growth rate of
18%fortotalassetsand20%forthemicrofinance
portfolio . When analyzing the growth trajectory
of a constant sample of 11 MIVs that have
participated in all thirteen surveys, growth on an
annual basis was 16% for total assets and 19% for
themicrofinanceportfolio.
1 . The effective growth rate for 2014 is different from the online benchmarking tool due to manual readjustment of the data of two outliers .
2 . Until the year 2016, forecasted growth rates included those MIVs that were expected to cease operations in a given year, for which the growth was forecasted to be 0% . Hence, the forecasted growth was generally understated . For 2018, the forecast is adjusted to only consider those MIVs that are expected to remain active .
HISTORICAL GROWTH IN TOTAL ASSETS AND MICROFINANCE PORTFOLIO – CONSTANT SAMPLE (USD million)
0
2,000
4,000
6,000
8,000
2018201720162015201420132012201120102009200820072006
Microfinance Portfolio (CAGR: 19%)Total assets (CAGR:16%)
MIV TOTAL ASSET GROWTH (in %)
0%
5%
10%
15%
20%
25%
30%
20192018(n=72)
2017(n=75)
2016(n=79)
2015(n=78)
201420132012201120102009
4.9
10.0
19.4 19.3
14.0
20.7
16.014.1
5.56.4
2.6 2.2
18.1
14.512.2
9.510.5
Forecasted Growth Rate2Effective Growth Rate
9.8
16.9
25.3
29.0

2019 Symbiotics MIV Survey
Page 14
3 .4 MIV MARKET MARKET CONCENTRATION
Marketconcentrationslightlyincreasedin2018withthefivelargestMIVsrepresenting40%ofthetotalsamplesizeintermsofassets.Concentrationwithregardstothe
microfinanceportfoliohasalsoslightlyincreasedforthetop5andthetop10.
TotalAssets(USDm) %Annual Change in
Asset Concentration3
MicrofinancePortfolio(USDm)
%Annual Change in MFP Concentration
Benchmark MIVs 15,303 100 .0% 2 .2% 11,752 100% 3 .1%
Top 5 6,132 40% 2% 4,692 40% 2%
Top 10 8,710 57% 1% 6,826 58% 1%
Top 20 11,089 72% 0% 8,721 74% 0%
Top 50 14,308 93% 1% 11,112 95% 1%
3 . Annual growth calculation is based on MIV accounting currencies translated into USD using the respective end of year FX rates . Annual Growth is calculated on the basis of a constant sample of 72 MIVs .
2019 Symbiotics MIV Survey
Page 15
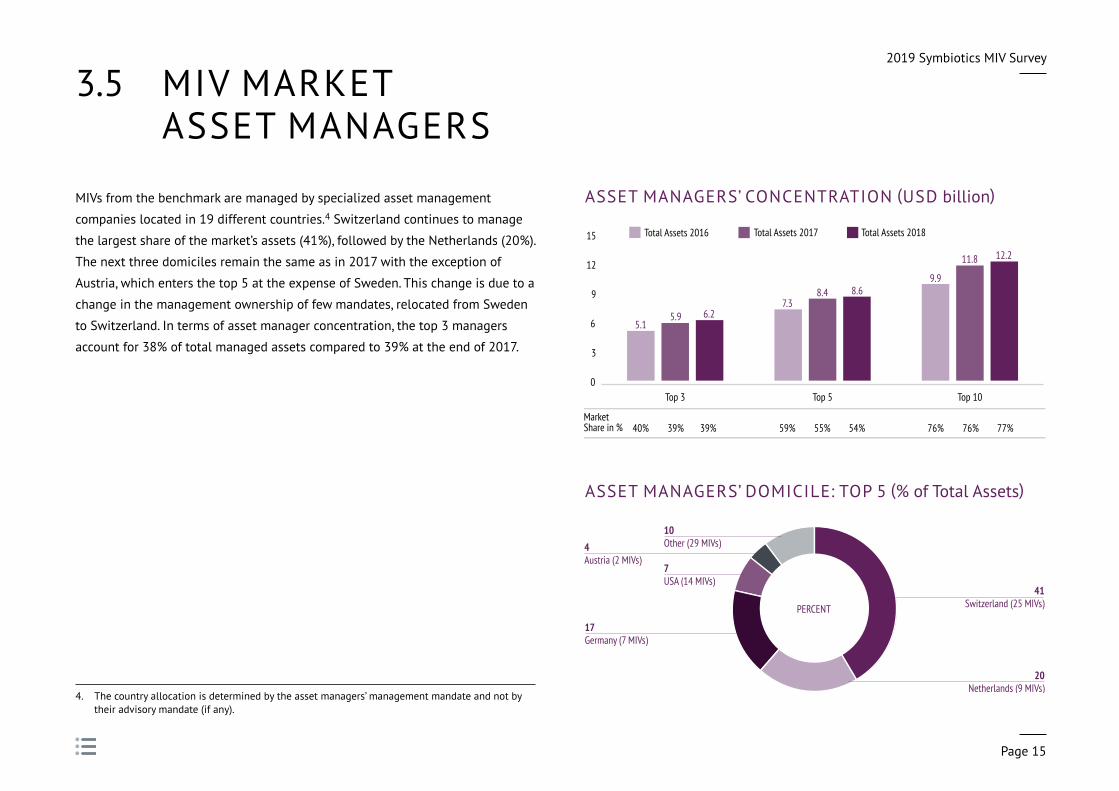
3 .5 MIV MARKET ASSET MANAGERS
MIVs from the benchmark are managed by specialized asset management
companies located in 19 different countries .4 Switzerland continues to manage
the largest share of the market’s assets (41%), followed by the Netherlands (20%) .
The next three domiciles remain the same as in 2017 with the exception of
Austria, which enters the top 5 at the expense of Sweden . This change is due to a
change in the management ownership of few mandates, relocated from Sweden
to Switzerland . In terms of asset manager concentration, the top 3 managers
account for 38% of total managed assets compared to 39% at the end of 2017 .
ASSET MANAGERS’ DOMICILE: TOP 5 (% of Total Assets)
4 . The country allocation is determined by the asset managers’ management mandate and not by their advisory mandate (if any) .
ASSET MANAGERS’ CONCENTRATION (USD billion)
PERCENT
10Other (29 MIVs)
41Switzerland (25 MIVs)
20Netherlands (9 MIVs)
17Germany (7 MIVs)
7USA (14 MIVs)
4Austria (2 MIVs)
0
3
6
9
12
15
Top 10Top 5Top 3
5.16.2
9.9
12.2
7.35.9
11.8
8.4 8.6
MarketShare in % 40% 39% 39% 59% 55% 54% 76% 76% 77%
Total Assets 2017 Total Assets 2018Total Assets 2016

2019 Symbiotics MIV Survey
Page 16
3 .6 MIV MARKET ASSET COMPOSITION & INVESTEE SIZE
At the end of 2018, MIVs’ asset composition
remainsdominatedbythemicrofinanceportfolio,
still representing more than three-fourth of total
assets . Liquid assets continue to decrease for the
third year in a row, from 13% in 2016 to 11% in
2017 and 9% in 2018 . Another recurring trend is
the expansion of the Other Portfolio (including
investments in Agriculture, Housing, Energy,
SMEs, and other activities) which reached 12%
in 2018.Lookingatinvesteesize,theshareof
themicrofinanceportfoliodirectedtowardslarge
institutions (those having over USD 100 million
in total assets) keeps growing, from 58% in 2017
to 66% in 2018 . On the opposite side, investments
into smaller investees (those having less than
USD 10 million in total assets) continue to decline,
representing3%ofthebenchmark’smicrofinance
portfolio .
MIV ASSET COMPOSITION (% of Total Assets)
% of Microfinance Portfolio invested in investees with total assets of over USD 100 million
% of Microfinance Portfolio invested in investees with total assets between USD 10 million and USD 100 million
% of Microfinance Portfolio invested in investees with total assets under USD 10 million
66
31
3
PERCENT
BREAKDOWN OF MIVs' MICROFINANCE PORTFOLIO ACCORDING TO INVESTEESIZE(n=76) (in %)
0%
20%
40%
60%
80%
100%
2018(n=87)
201720162015201420132012201120102009200820072006
Microfinance PortfolioLiquid Assets
Other Portfolio (Agriculture, Housing, Energy, SMEs, and Other Market Instruments)
Other Assets
Other Portfolio and Other Assets
233444
1426
17
3
8076757573707762 70 78
789810109
1213 7
121313141316 13
2
76
9
13
2
77
129
3
76
1111
2019 Symbiotics MIV Survey
Page 17
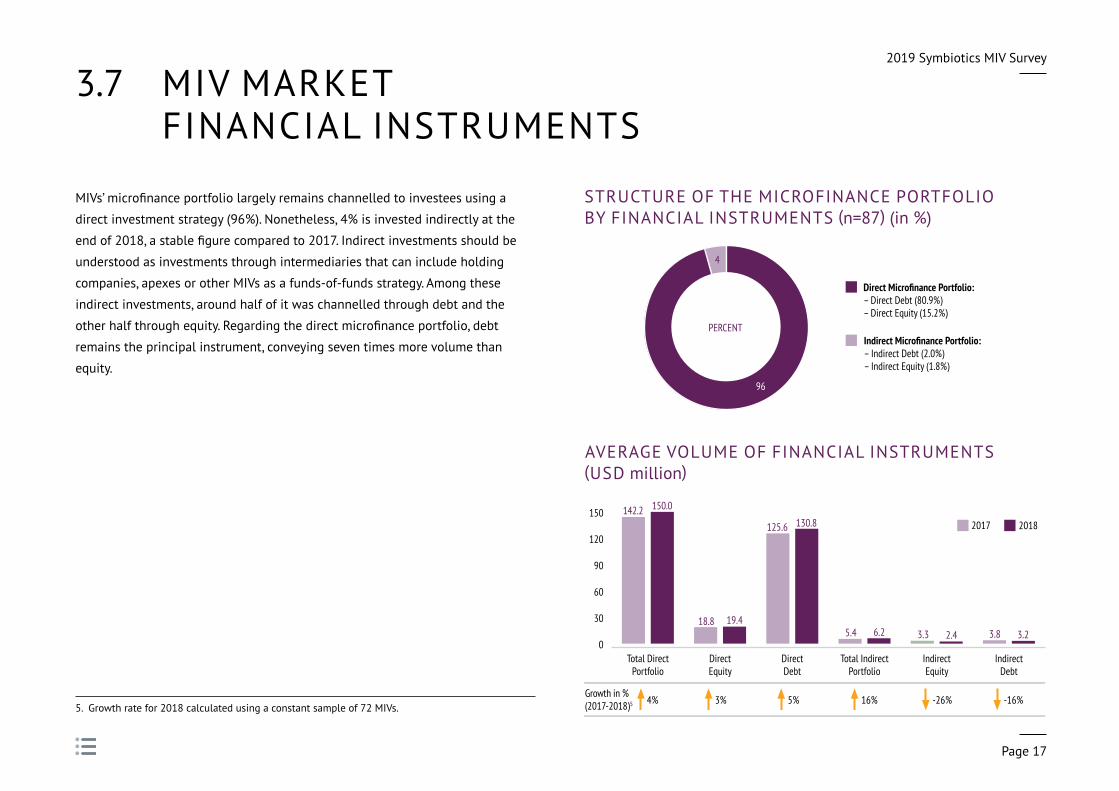
3 .7 MIV MARKET FINANCIAL INSTRUMENTS
MIVs’microfinanceportfoliolargelyremainschannelledtoinvesteesusinga
direct investment strategy (96%) . Nonetheless, 4% is invested indirectly at the
endof2018,astablefigurecomparedto2017.Indirectinvestmentsshouldbe
understood as investments through intermediaries that can include holding
companies, apexes or other MIVs as a funds-of-funds strategy . Among these
indirect investments, around half of it was channelled through debt and the
otherhalfthroughequity.Regardingthedirectmicrofinanceportfolio,debt
remains the principal instrument, conveying seven times more volume than
equity .
5 . Growth rate for 2018 calculated using a constant sample of 72 MIVs .
STRUCTURE OF THE MICROFINANCE PORTFOLIO BY FINANCIALINSTRUMENTS(n=87) (in %)
96
4
PERCENTIndirect Microfinance Portfolio:– Indirect Debt (2.0%)– Indirect Equity (1.8%)
Direct Microfinance Portfolio:– Direct Debt (80.9%)– Direct Equity (15.2%)
AVERAGE VOLUME OF FINANCIAL INSTRUMENTS (USD million)
0
30
60
90
120
150
IndirectDebt
IndirectEquity
Total IndirectPortfolio
DirectDebt
DirectEquity
Total DirectPortfolio
3.8 3.2
Growth in %(2017-2018)5 4% 3% 16%5%
3.3 2.45.4 6.2
125.6 130.8142.2 150.0
18.8 19.4
-26% -16%
20182017

2019 Symbiotics MIV Survey
Page 18
3 .8 MIV MARKET DIRECT DEBT INVESTMENTS
The characteristics of direct debt investments remained relatively stable from
2017 to 2018 . Debt investment size outstanding per investee has gone up to
USD 2 .8 million (vs . USD 2 .7 million in 2017) with a slightly lower remaining
maturity at just below 22 months . The portion of direct debt investments in local
currency continued to increase to 43 .5%, of which 29% is unhedged (vs . 32 .7%
in 2017) . In 2018, asset managers raised their provisions on their direct debt
microfinanceportfolio,withtheLoanLossProvisionratiogrowingfrom2.8%
in 2017 to 3 .7% in 2018 . Write-offs remained stable however, at 0 .2% of the
outstanding portfolio .
MIV DIRECT DEBT INVESTMENT CHARACTERISTICS – MOVING SAMPLE
2017 2018
Average Debt Investment Size (n=85) 2 .7 million 2 .8 million
Average Number of Investees (n=86) 36 .3 39 .0
Average Remaining Maturity (n=65) 23 .1 months 21 .9 months
Share of Local Currency (n=67) 34 .1% 43 .5%
Unhedged Portion on Direct Debt MFP (n=54) 11 .6% 11 .7%
Unhedged portion on LC portfolio (n=54) 32 .7% 29 .0%
Outstanding Loan Loss Provisions (n=66) 2 .8% 3 .7%
Loans Written-off (n=58) 0 .3% 0 .2%
2019 Symbiotics MIV Survey
Page 19
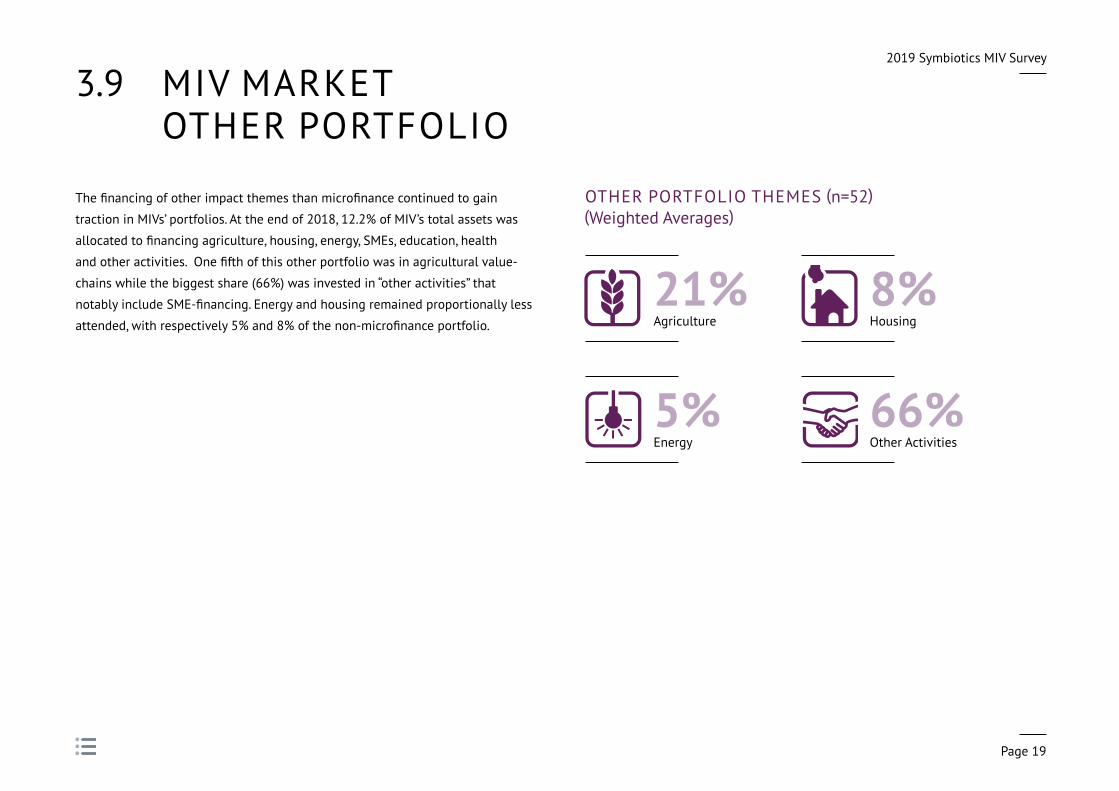
3 .9 MIV MARKET OTHER PORTFOLIO
Thefinancingofotherimpactthemesthanmicrofinancecontinuedtogain
traction in MIVs’ portfolios . At the end of 2018, 12 .2% of MIV’s total assets was
allocatedtofinancingagriculture,housing,energy,SMEs,education,health
andotheractivities.Onefifthofthisotherportfoliowasinagriculturalvalue-
chainswhilethebiggestshare(66%)wasinvestedin“otheractivities”that
notablyincludeSME-financing.Energyandhousingremainedproportionallyless
attended,withrespectively5%and8%ofthenon-microfinanceportfolio.
OTHER PORTFOLIO THEMES (n=52) (Weighted Averages)
Agriculture Housing Other ActivitiesEnergy
19% 11% 9% 61%
5%Energy
Agriculture Housing Other ActivitiesEnergy
19% 11% 9% 61%
21%Agriculture
Agriculture Housing Other ActivitiesEnergy
19% 11% 9% 61%
66%Other Activities
Agriculture Housing Other ActivitiesEnergy
19% 11% 9% 61%
8%Housing
2019 Symbiotics MIV Survey
Page 20
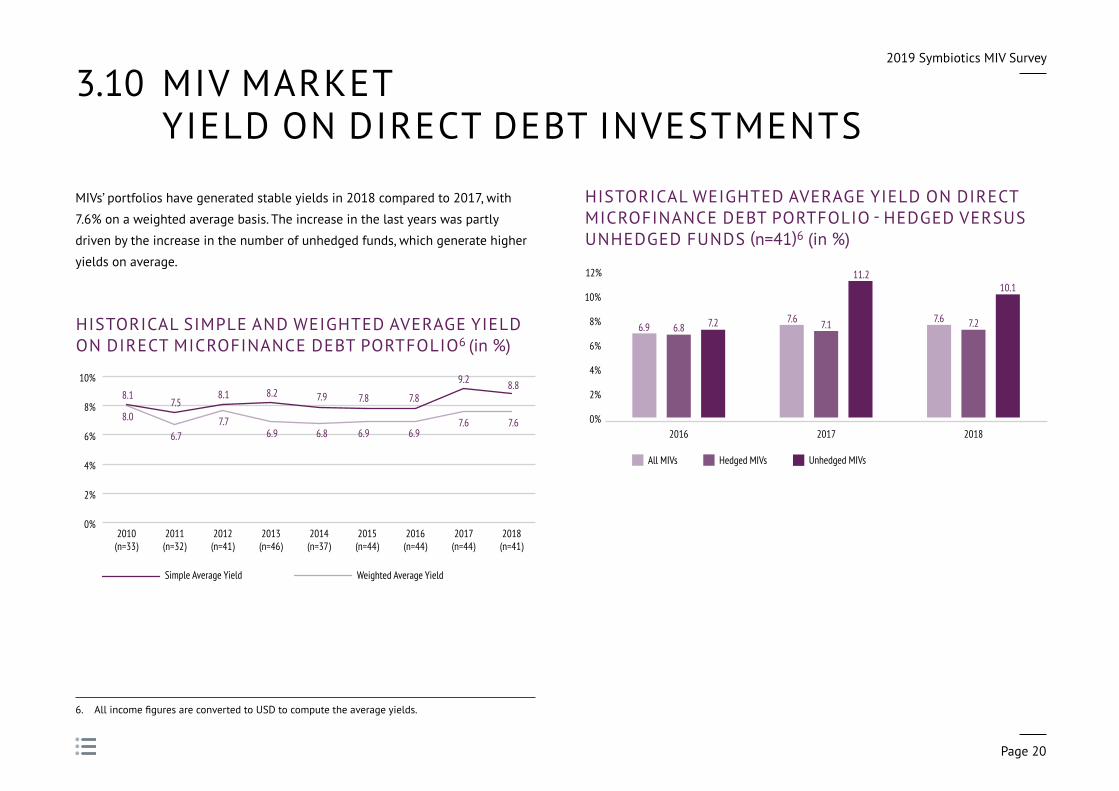
3 .10 MIV MARKET YIELD ON DIRECT DEBT INVESTMENTS
MIVs’ portfolios have generated stable yields in 2018 compared to 2017, with
7 .6% on a weighted average basis . The increase in the last years was partly
driven by the increase in the number of unhedged funds, which generate higher
yields on average .
6. AllincomefiguresareconvertedtoUSDtocomputetheaverageyields.
HISTORICAL SIMPLE AND WEIGHTED AVERAGE YIELD ON DIRECT MICROFINANCE DEBT PORTFOLIO6 (in %)
HISTORICAL WEIGHTED AVERAGE YIELD ON DIRECT MICROFINANCE DEBT PORTFOLIO - HEDGED VERSUS UNHEDGED FUNDS (n=41)6 (in %)
0%
2%
4%
6%
8%
10%
2018(n=41)
2017(n=44)
2016(n=44)
2015(n=44)
2014(n=37)
2013(n=46)
2012(n=41)
2011(n=32)
2010(n=33)
Simple Average Yield Weighted Average Yield
8.1
8.07.5
6.7
8.1
7.7
8.2
6.9
7.9
6.8
7.8
6.9
7.8
6.9
9.2
7.6
8.8
7.6 0%
2%
4%
6%
8%
10%
12%
201820172016
6.8 7.2 7.2
10.1
7.16.97.67.6
11.2
Unhedged MIVsHedged MIVsAll MIVs
2019 Symbiotics MIV Survey
Page 21
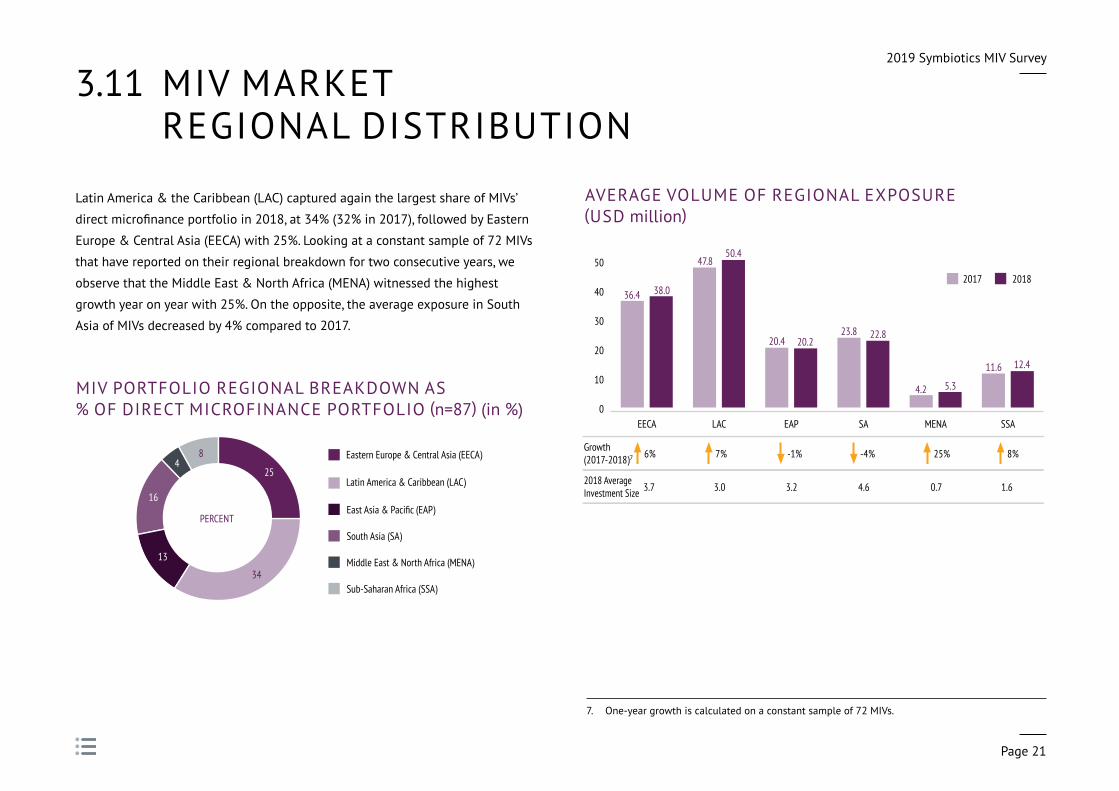
3 .11 MIV MARKET REGIONAL DISTRIBUTION
Latin America & the Caribbean (LAC) captured again the largest share of MIVs’
directmicrofinanceportfolioin2018,at34%(32%in2017),followedbyEastern
Europe&CentralAsia(EECA)with25%.Lookingataconstantsampleof72 MIVs
that have reported on their regional breakdown for two consecutive years, we
observe that the Middle East & North Africa (MENA) witnessed the highest
growth year on year with 25% . On the opposite, the average exposure in South
Asia of MIVs decreased by 4% compared to 2017 .
7 . One-year growth is calculated on a constant sample of 72 MIVs .
MIV PORTFOLIO REGIONAL BREAKDOWN AS % OF DIRECTMICROFINANCEPORTFOLIO(n=87) (in %)
AVERAGE VOLUME OF REGIONAL EXPOSURE (USD million)
25
34
16
48
13
PERCENTEast Asia & Pacific (EAP)
Eastern Europe & Central Asia (EECA)
Latin America & Caribbean (LAC)
Middle East & North Africa (MENA)
South Asia (SA)
Sub-Saharan Africa (SSA)
0
10
20
30
40
50
SSAMENASAEAPLACEECA
Growth(2017-2018)7 6% 7% -4%-1% 25% 8%
2018 AverageInvestment Size 3.7 3.0 4.63.2 0.7 1.6
20182017
11.6 12.4
4.2 5.3
23.8 22.820.4 20.2
36.4 38.0
47.850.4

2019 Symbiotics MIV Survey
Page 22
3 .12 MIV MARKET REGIONAL DISTRIBUTION OVER THE PERIOD 2006-2018
Investment trends have been quite different from one region to another since 2006 . LAC continued its steady growth, contrary to SA and EAP which slowed down in
2018.GrowthinSSArecovered,confirmingthat2017wastheonlynegativeepisodeintermsofgrowthinabsolutevalue.GrowthinEECAwasslightlynegative,although
principally explained by the non-participation in 2018 of two funds focused on this region . Finally, MENA continued to witness important variations in growth, mostly due
to its low volume .
EASTERN EUROPE & CENTRAL ASIA (USD million)CompoundedAnnualGrowthRate:16%
LATIN AMERICA & CARIBBEAN (USD million)CompoundedAnnualGrowthRate:19%
EAST ASIA & PACIFIC (USD million)CompoundedAnnualGrowthRate:27%
SOUTH ASIA (USD million)CompoundedAnnualGrowthRate:37%
MIDDLE EAST & NORTH AFRICA (USD million)CompoundedAnnualGrowthRate:52%
SUB-SAHARAN AFRICA (USD million)CompoundedAnnualGrowthRate:21%
0
700
1,400
2,100
2,800
3,500
20182016201420122010200820060
800
1,600
2,400
3,200
4,000
2018201620142012201020082006
0
80
160
240
320
400
2018201620142012201020082006
0
350
700
1,050
1,400
1,750
2018201620142012201020082006
0
400
800
1,200
1,600
2,000
20182016201420122010200820060
200
400
600
800
1,000
2018201620142012201020082006
2019 Symbiotics MIV Survey
Page 23
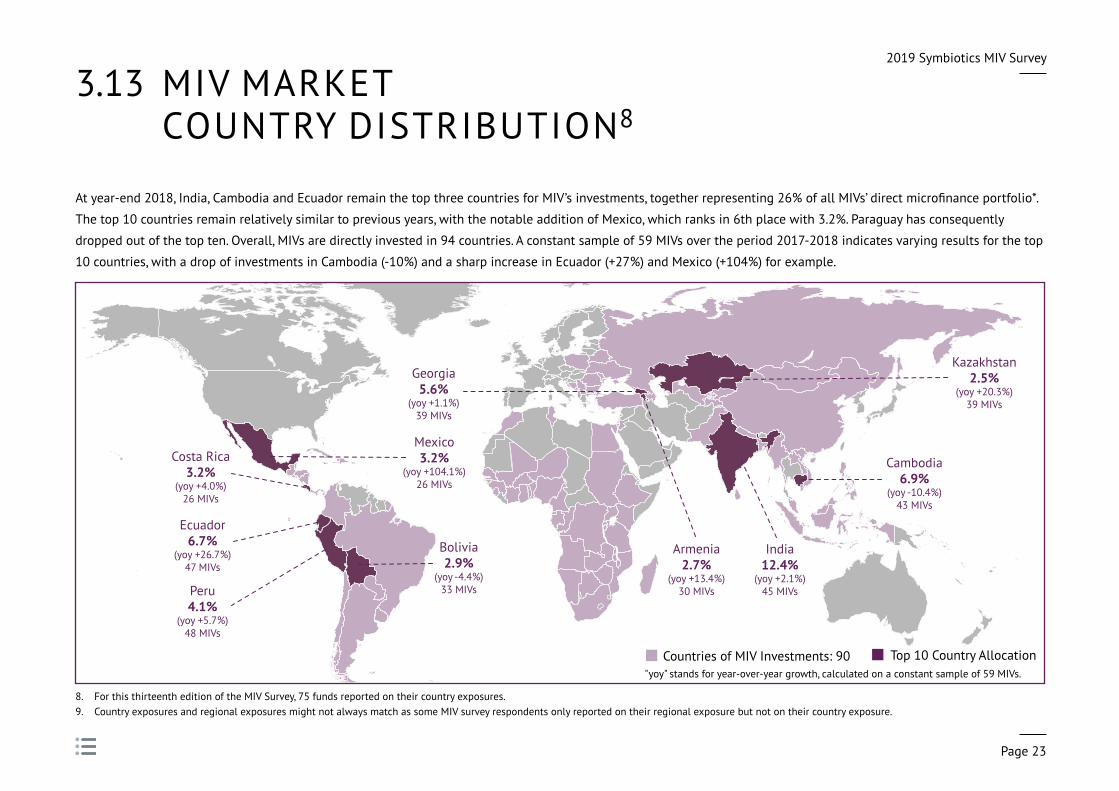
3 .13 MIV MARKET COUNTRY DISTRIBUTION8
Atyear-end2018,India,CambodiaandEcuadorremainthetopthreecountriesforMIV’sinvestments,togetherrepresenting26%ofallMIVs’directmicrofinanceportfolio*.
The top 10 countries remain relatively similar to previous years, with the notable addition of Mexico, which ranks in 6th place with 3 .2% . Paraguay has consequently
dropped out of the top ten . Overall, MIVs are directly invested in 94 countries . A constant sample of 59 MIVs over the period 2017-2018 indicates varying results for the top
10 countries, with a drop of investments in Cambodia (-10%) and a sharp increase in Ecuador (+27%) and Mexico (+104%) for example .
8 . For this thirteenth edition of the MIV Survey, 75 funds reported on their country exposures .9 . Country exposures and regional exposures might not always match as some MIV survey respondents only reported on their regional exposure but not on their country exposure .
Countries of MIV Investments: 90 Top 10 Country Allocation
Cambodia6.9%
(yoy -10 .4%)43 MIVs
Costa Rica3.2%
(yoy +4 .0%)26 MIVs
Bolivia2.9%
(yoy -4 .4%)33 MIVs
Mexico3.2%
(yoy +104 .1%)26 MIVs
India12.4%
(yoy +2 .1%)45 MIVs
Georgia5.6%
(yoy +1 .1%)39 MIVs
Peru4.1%
(yoy +5 .7%)48 MIVs
Ecuador6.7%
(yoy +26 .7%)47 MIVs
Armenia2.7%
(yoy +13 .4%)30 MIVs
Kazakhstan2.5%
(yoy +20 .3%)39 MIVs
"yoy" stands for year-over-year growth, calculated on a constant sample of 59 MIVs .
2019 Symbiotics MIV Survey
Page 24
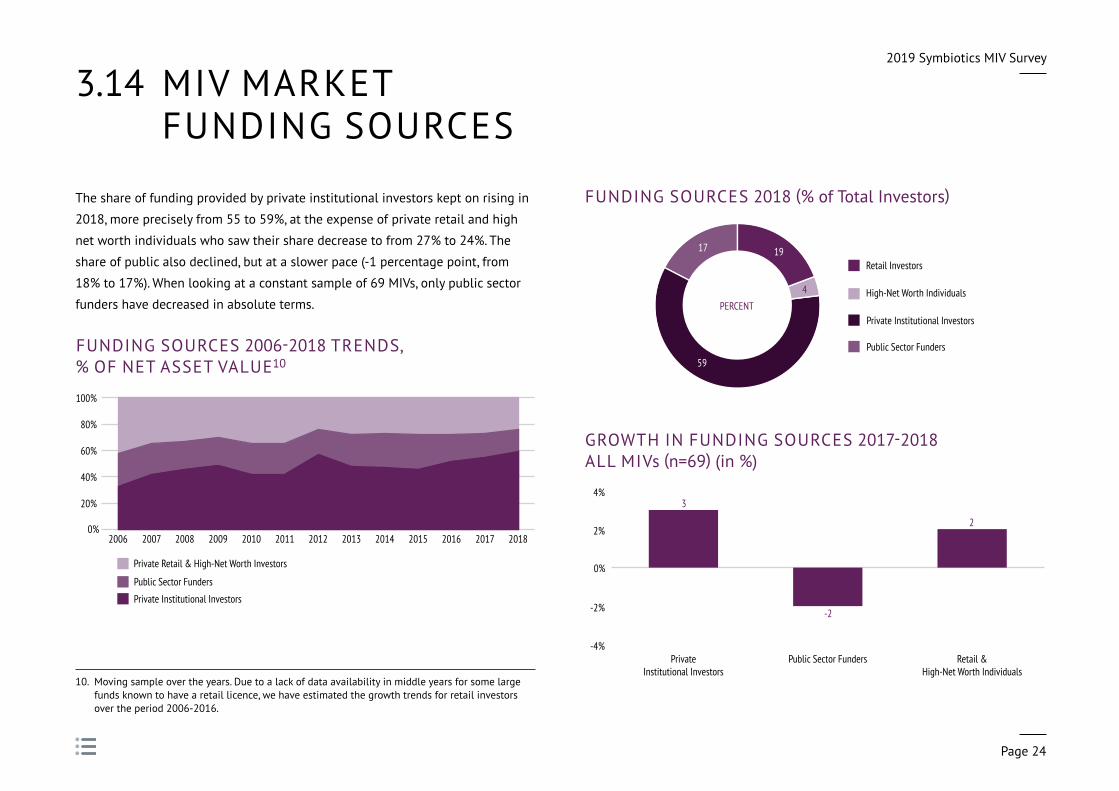
3 .14 MIV MARKET FUNDING SOURCES
The share of funding provided by private institutional investors kept on rising in
2018, more precisely from 55 to 59%, at the expense of private retail and high
net worth individuals who saw their share decrease to from 27% to 24% . The
share of public also declined, but at a slower pace (-1 percentage point, from
18% to 17%) . When looking at a constant sample of 69 MIVs, only public sector
funders have decreased in absolute terms .
FUNDING SOURCES 2006-2018 TRENDS, % OF NET ASSET VALUE10
10 . Moving sample over the years . Due to a lack of data availability in middle years for some large funds known to have a retail licence, we have estimated the growth trends for retail investors over the period 2006-2016 .
GROWTH IN FUNDING SOURCES 2017-2018 ALL MIVs (n=69) (in %)
-4%
-2%
0%
2%
4%
Retail &High-Net Worth Individuals
Public Sector FundersPrivateInstitutional Investors
3
-2
2
FUNDING SOURCES 2018 (% of Total Investors)
19
4
17
59
PERCENTPrivate Institutional Investors
Retail Investors
High-Net Worth Individuals
Public Sector Funders
0%
20%
40%
60%
80%
100%
2018201720162015201420132012201120102009200820072006
Private Institutional Investors
Public Sector Funders
Private Retail & High-Net Worth Investors
2019 Symbiotics MIV Survey
Page 25
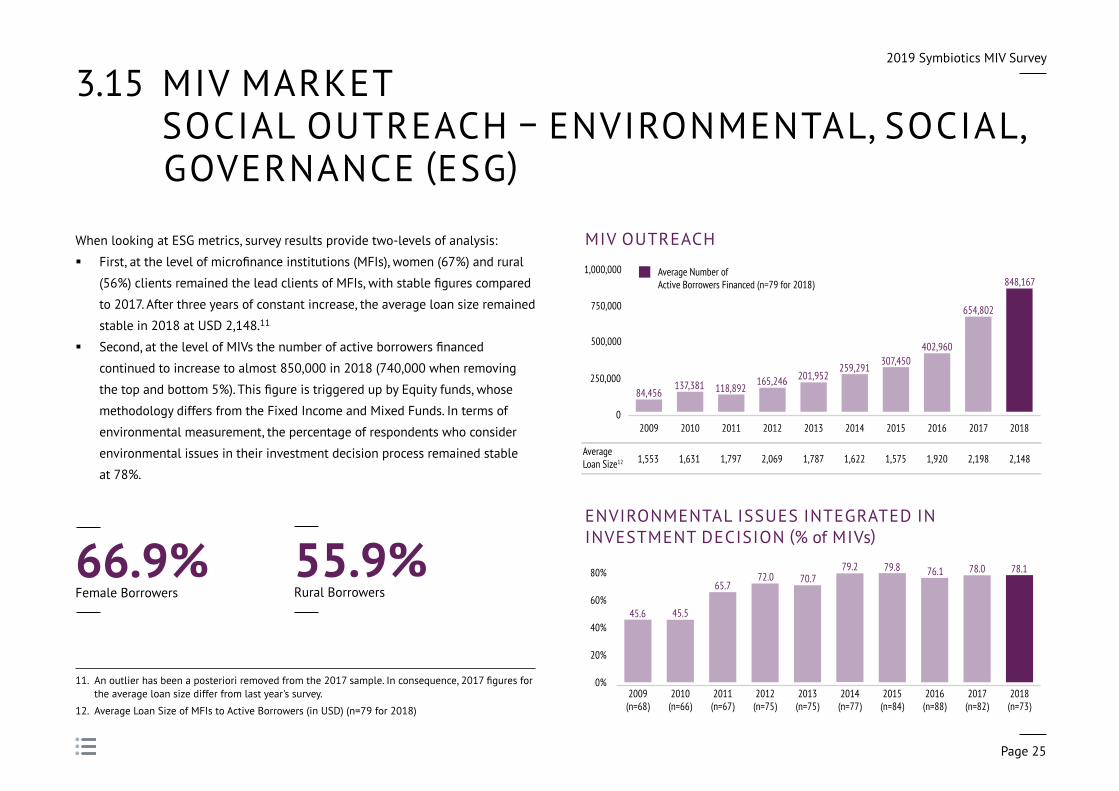
3 .15 MIV MARKET SOCIAL OUTREACH – ENVIRONMENTAL, SOCIAL,
GOVERNANCE (ESG)
When looking at ESG metrics, survey results provide two-levels of analysis:
§ First,atthelevelofmicrofinanceinstitutions(MFIs),women(67%)andrural
(56%)clientsremainedtheleadclientsofMFIs,withstablefigurescompared
to 2017 . After three years of constant increase, the average loan size remained
stable in 2018 at USD 2,148 .11
§ Second,atthelevelofMIVsthenumberofactiveborrowersfinanced
continued to increase to almost 850,000 in 2018 (740,000 when removing
thetopandbottom5%).ThisfigureistriggeredupbyEquityfunds,whose
methodology differs from the Fixed Income and Mixed Funds . In terms of
environmental measurement, the percentage of respondents who consider
environmental issues in their investment decision process remained stable
at 78%.
66.9%Female Borrowers
55.9%Rural Borrowers
MIV OUTREACH
ENVIRONMENTAL ISSUES INTEGRATED IN INVESTMENT DECISION (% of MIVs)
0
250,000
500,000
750,000
1,000,000
2018201720162015201420132012201120102009
AverageLoan Size12 1,631 2,0691,797
307,450402,960
654,802
848,167
201,952259,291
118,892165,246137,381
84,456
1,787 1,5751,622
Average Number of Active Borrowers Financed (n=79 for 2018)
1,553 1,920 2,1482,198
0%
20%
40%
60%
80%
2018(n=73)
2017(n=82)
2016(n=88)
2015(n=84)
2014(n=77)
2013(n=75)
2012(n=75)
2011(n=67)
2010(n=66)
2009(n=68)
79.8 76.1 78.0 78.170.7
79.2
65.772.0
45.545.6
11. Anoutlierhasbeenaposterioriremovedfromthe2017sample.Inconsequence,2017figuresforthe average loan size differ from last year's survey .
12 . Average Loan Size of MFIs to Active Borrowers (in USD) (n=79 for 2018)

2019 Symbiotics MIV Survey
Page 26
3 .16 MIV MARKET ESG: INVESTEE PRODUCT RANGE
After several years of increase, the share of active borrowers making voluntary
savings remained stable in 2018 at 78% . Furthermore, on a weighted average
basis,savingswasthemostobservedintermsofmicrofinanceinvestees’
“otherproductofferings”,thosethatexcludecreditproducts,followedbyother
financialservices(debitandcreditcards,moneytransfers,paymentsbycheck,
etc.),non-financialservices(enterpriseservices,adulteducation,healthservices,
agricultural extension and training, and women’s empowerment ), insurance and
mobile banking .
VOLUNTARY SAVERS AS A % OF ACTIVE BORROWERS
OTHER PRODUCT OFFERINGS (% ofDirectMicrofinanceInvestees)
0%
20%
40%
60%
80%
100%
2018 (n=46)2017 (n=50)
77.877.7
0% 10% 20% 30% 40% 50% 60% 70%
Mobile Banking Facilities (n=27)
Savings (n=52)
37.163.2
30.362.8
41.155.1
14.734.6
31.857.1
Insurance (n=39)
Other Financial Services (n=41)
Non-financial Services (n=43)
Simple Average Weighted Average
2019 Symbiotics MIV Survey
Page 27
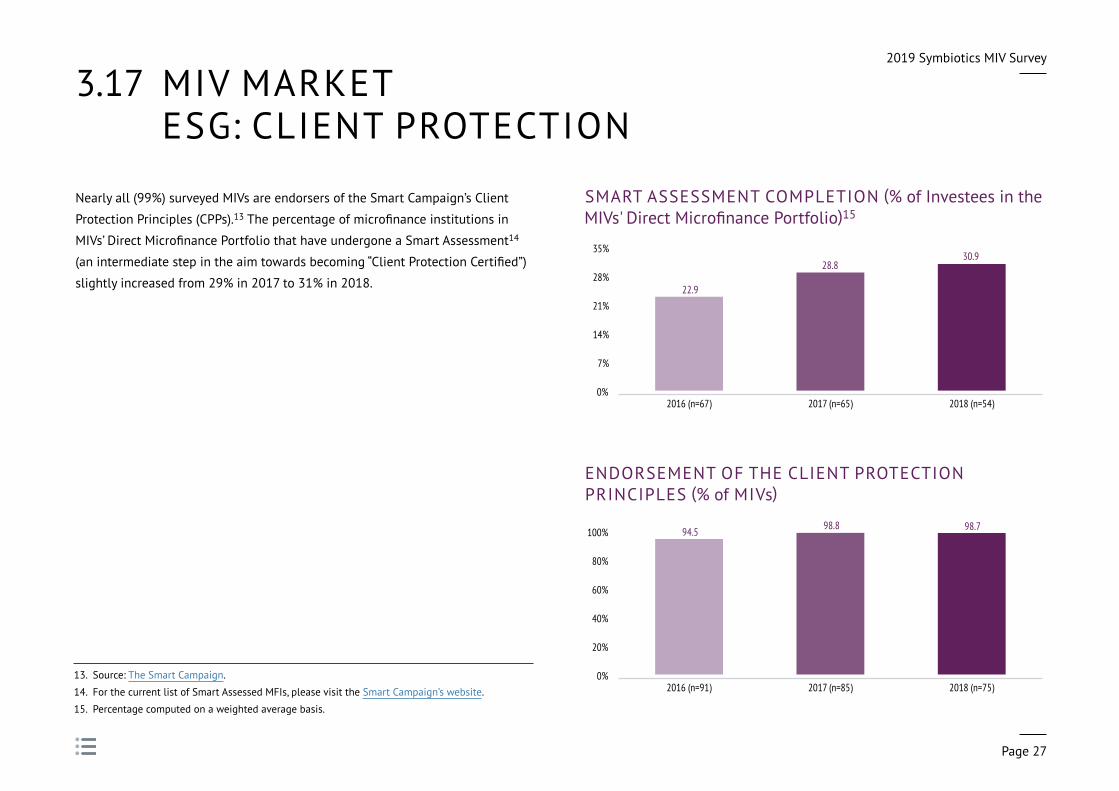
3 .17 MIV MARKET ESG: CLIENT PROTECTION
Nearly all (99%) surveyed MIVs are endorsers of the Smart Campaign’s Client
Protection Principles (CPPs) .13Thepercentageofmicrofinanceinstitutionsin
MIVs’DirectMicrofinancePortfoliothathaveundergoneaSmartAssessment14
(anintermediatestepintheaimtowardsbecoming“ClientProtectionCertified”)
slightly increased from 29% in 2017 to 31% in 2018 .
13 . Source: The Smart Campaign .
14 . For the current list of Smart Assessed MFIs, please visit the Smart Campaign’s website .
15 . Percentage computed on a weighted average basis .
SMART ASSESSMENT COMPLETION (% of Investees in the MIVs' Direct MicrofinancePortfolio)15
ENDORSEMENT OF THE CLIENT PROTECTION PRINCIPLES (% of MIVs)
0%
7%
14%
21%
28%
35%
2018 (n=54)2017 (n=65)2016 (n=67)
30.928.8
22.9
0%
20%
40%
60%
80%
100%
2018 (n=75)2017 (n=85)2016 (n=91)
98.8 98.794.5
2019 Symbiotics MIV Survey
Page 28
0
10
20
30
40
1716151413121110987654321
35 1722043
524113416736201219
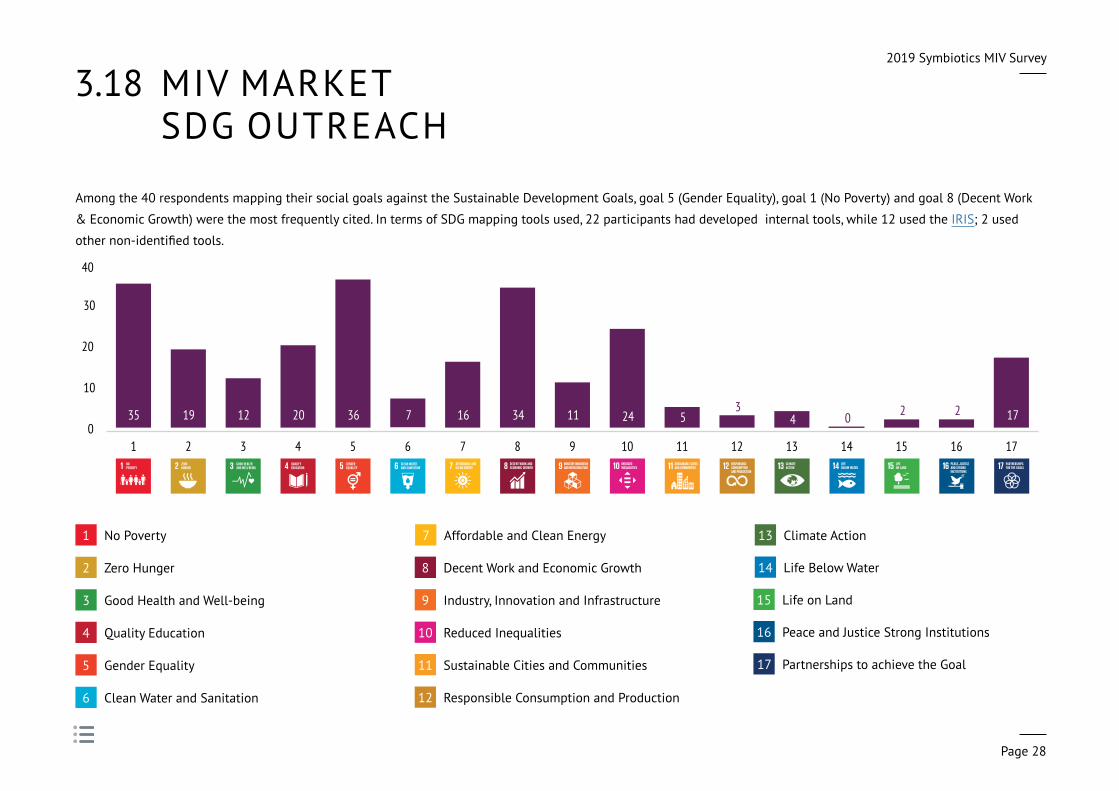
3 .18 MIV MARKET SDG OUTREACH
Among the 40 respondents mapping their social goals against the Sustainable Development Goals, goal 5 (Gender Equality), goal 1 (No Poverty) and goal 8 (Decent Work
& Economic Growth) were the most frequently cited . In terms of SDG mapping tools used, 22 participants had developed internal tools, while 12 used the IRIS; 2 used
othernon-identifiedtools.
No Poverty1 Affordable and Clean Energy7 Climate Action13
Zero Hunger2 DecentWorkandEconomic Growth8 Life Below Water14
Good Health and Well-being3 Industry, Innovation and Infrastructure9 Life on Land15
Quality Education4 Reduced Inequalities10 Peace and Justice Strong Institutions16
Gender Equality5 Sustainable Cities and Communities11 Partnershipstoachievethe Goal17
Clean Water and Sanitation6 Responsible Consumption and Production12
4 .MIV PEER GROUP ANALYSIS
2019 Symbiotics MIV Survey
Page 30
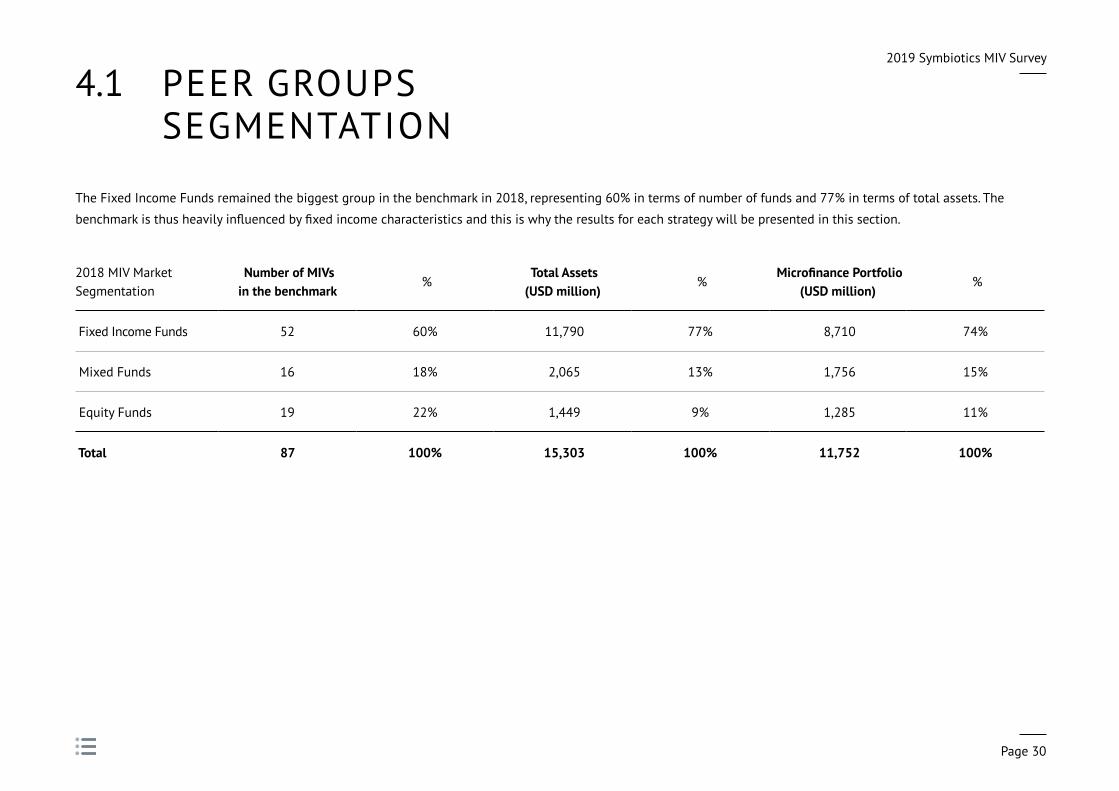
4 .1 PEER GROUPS SEGMENTATION
The Fixed Income Funds remained the biggest group in the benchmark in 2018, representing 60% in terms of number of funds and 77% in terms of total assets . The
benchmarkisthusheavilyinfluencedbyfixedincomecharacteristicsandthisiswhytheresultsforeachstrategywillbepresentedinthissection.
2018 MIV Market Segmentation
NumberofMIVsin the benchmark
% TotalAssets(USDmillion)
% MicrofinancePortfolio
(USDmillion) %
Fixed Income Funds 52 60% 11,790 77% 8,710 74%
Mixed Funds 16 18% 2,065 13% 1,756 15%
Equity Funds 19 22% 1,449 9% 1,285 11%
Total 87 100% 15,303 100% 11,752 100%

2019 Symbiotics MIV Survey
Page 31
4 .2 PEER GROUPS GROWTH OF TOTAL ASSETS AND
MICROFINANCE PORTFOLIO
MIVs recorded low growth in 2018, with Mixed and Equity Funds recording slightly negative growth (-0 .9% and -2 .5% respectively) while Fixed Income Funds’ growth
remainedslightlypositiveat3.2%.Intermsoftheforecastfor2019,EquityFundsareexpectedtoincreasequitesignificantlyintermsofvolume(65.9%),althoughthis
figureispulledupbyafewoutliers,whileFixedIncomeFundsandMixedFundsshouldexperienceamoreconservativegrowthintotalassetsofrespectively2%and9%.
ANNUAL GROWTH OF TOTAL ASSETS (in %) ANNUAL GROWTH OF MICROFINANCE PORTFOLIO (in %)
-15%
0%
15%
30%
45%
60%
75%
Equity Funds(n=19 for 2018)
Mixed Funds(n=17 for 2018)
Fixed Income Funds(n=51 for 2018)
All MIVs(n=87 for 2018)
18.1
2.29.5
2018 2019 – Forecast2017
18.7
3.2 2.3
16.9
-0.9
8.614.4
-2.5
65.9
-5%
0%
5%
10%
15%
20%
Equity Funds(n=19 for 2018)
Mixed Funds(n=17 for 2018)
Fixed Income Funds(n=51 for 2018)
All MIVs(n=87 for 2018)
18.3 18.5
20182017
3.14.5
17.9
-1.1
17.3
-1.4

2019 Symbiotics MIV Survey
Page 32
4 .3 PEER GROUPS ASSET COMPOSITION & GROWTH IN LIQUID
ASSETS AND OTHER PORTFOLIO
Liquidity continued to decrease for Fixed Income
Funds, remained stable for Mixed Funds and
increased for Equity Funds, although staying at
lowlevels.Themicrofinanceportfoliogrewforall
strategies . The other portfolio decreased for Equity
funds, whereas it continued to expand for Fixed
Income and Mixed Funds .
TOTAL ASSET COMPOSITION BY PEER GROUP (% of Total Assets)
GROWTH IN LIQUID ASSETS AND OTHER PORTFOLIO - CONSTANT SAMPLE
All MIVs(n=74)
Fixed Income Funds(n=44)
Mixed Funds(n=14)
Equity Funds(n=14)
Growth of Liquid Assets (2017-2018) -19% -24% 0% 50%
Growth of Other Portfolio (2017-2018) 21% 24% 37% -16%
0%
20%
40%
60%
80%
100%
Equity Funds(n=19)
Mixed Funds(n=16)
Fixed Income Funds(n=52)
All MIVs(n=87)
Microfinance Portfolio
Other Portfolio (Agriculture, Housing, Energy, SMEs and Other Market Instruments)
Liquid Assets
Other Assets
8976%857477%77
0.10.2321299 8
21512
3

2019 Symbiotics MIV Survey
Page 33
4 .4 PEER GROUPS REGIONAL ALLOCATION: VOLUME
Latin America & Caribbean (LAC) and Eastern Europe & Central Asia (EECA) remained the two main regions in terms of concentration and continued to increase in 2018 .
The important decrease of EECA for Mixed Funds is due to the non participation in 2018 of two funds focused on this particular region . Exposures in other regions
remained stable, except for the exposure of Equity funds in South Asia which decreased by 5 percentage points .
0%
20%
40%
60%
80%
100%
201820170%
20%
40%
60%
80%
100%
201820170%
20%
40%
60%
80%
100%
201820170%
20%
40%
60%
80%
100%
20182017
32
14
27
8
3
16
34
13
25
8
4
16
33
14
28
8
3
13
34
14
28
8
4
12
30
10
10
7
43
32
12
11
53
38
29
13
30
72
2
18
36
12
21
10
19
Eastern Europe &Central Asia (EECA)
East Asia & Pacific (EAP)
Latin America & Caribbean (LAC)
Middle East & North Africa (MENA)
South Asia (SA)
Sub-Saharan Africa (SSA)
ALL MIVs (n=87) FIXED INCOME FUNDS (n=52) MIXED FUNDS (n=16) EQUITY FUNDS (n=19)
0.3
(% of Direct Microfinance Portfolio)
Due to roundings, the sum of all regional exposures might not always be equal to 100%
2019 Symbiotics MIV Survey
Page 34
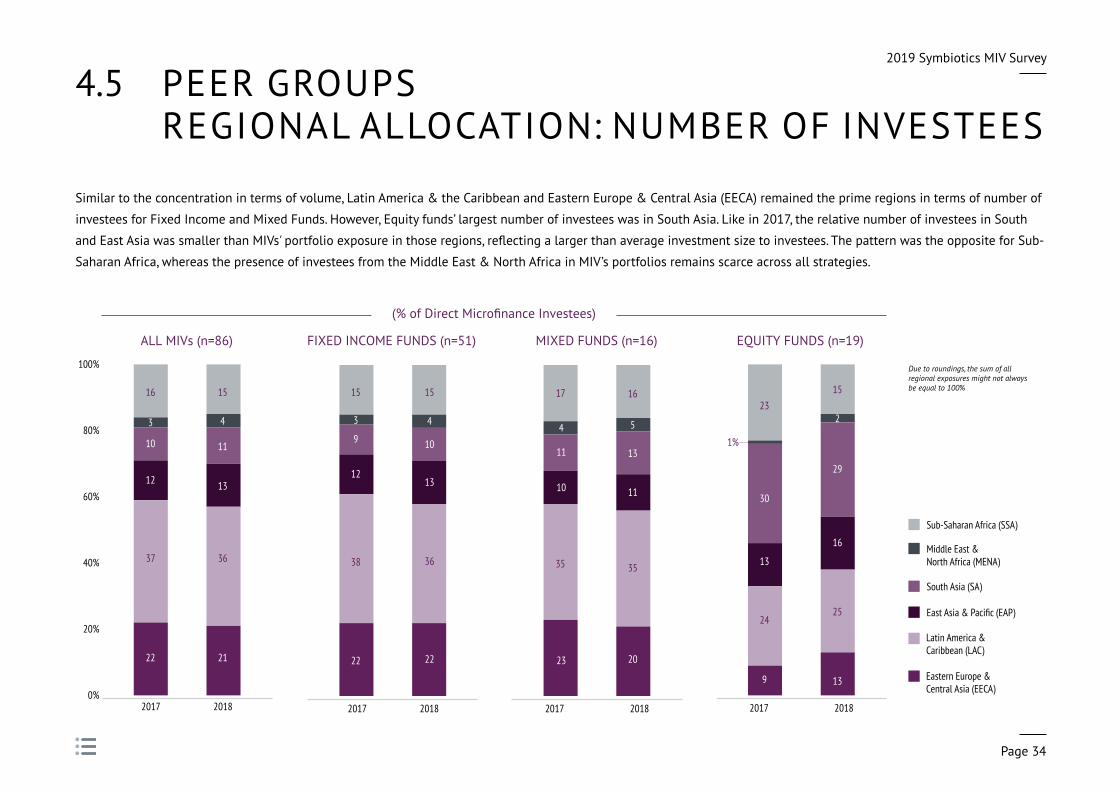
4 .5 PEER GROUPS REGIONALALLOCATION:NUMBER OF INVESTEES
Similar to the concentration in terms of volume, Latin America & the Caribbean and Eastern Europe & Central Asia (EECA) remained the prime regions in terms of number of
investees for Fixed Income and Mixed Funds . However, Equity funds’ largest number of investees was in South Asia . Like in 2017, the relative number of investees in South
andEastAsiawassmallerthanMIVs'portfolioexposureinthoseregions,reflectingalargerthanaverageinvestmentsizetoinvestees.ThepatternwastheoppositeforSub-
Saharan Africa, whereas the presence of investees from the Middle East & North Africa in MIV’s portfolios remains scarce across all strategies .
0%
20%
40%
60%
80%
100%
201820170%
20%
40%
60%
80%
100%
201820170%
20%
40%
60%
80%
100%
201820170%
20%
40%
60%
80%
100%
20182017
Due to roundings, the sum of all regional exposures might not always be equal to 100%
Eastern Europe &Central Asia (EECA)
East Asia & Pacific (EAP)
Latin America & Caribbean (LAC)
Middle East & North Africa (MENA)
South Asia (SA)
Sub-Saharan Africa (SSA)
ALL MIVs (n=86) FIXED INCOME FUNDS (n=51) MIXED FUNDS (n=16) EQUITY FUNDS (n=19)
(% of Direct Microfinance Investees)
37
12
22
16
3
10
36
13
21
15
4
11
38
12
22
15
3
9
36
13
22
15
4
10
24
13
9
23
30
25
16
13
15
2
29
35
10
23
17
4
11
35
11
20
16
5
131%
2019 Symbiotics MIV Survey
Page 35
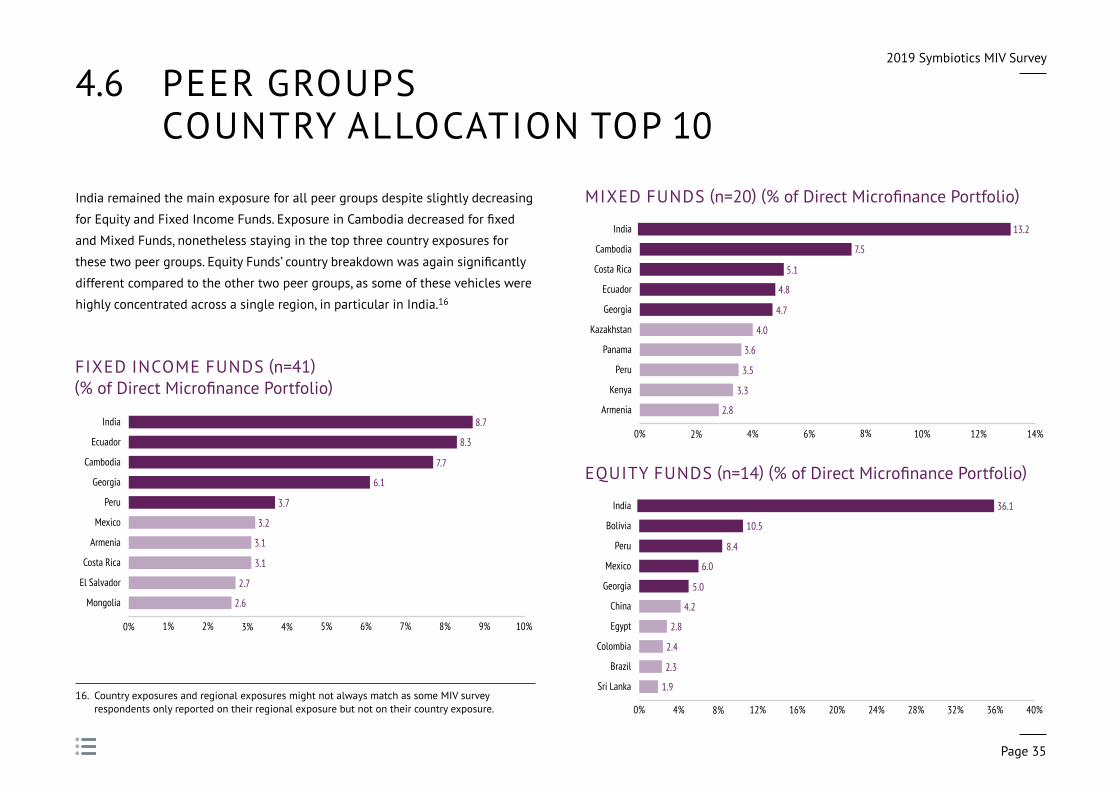
4 .6 PEER GROUPS COUNTRY ALLOCATION TOP 10
India remained the main exposure for all peer groups despite slightly decreasing
forEquityandFixedIncomeFunds.ExposureinCambodiadecreasedforfixed
and Mixed Funds, nonetheless staying in the top three country exposures for
thesetwopeergroups.EquityFunds’countrybreakdownwasagainsignificantly
different compared to the other two peer groups, as some of these vehicles were
highly concentrated across a single region, in particular in India .16
16 . Country exposures and regional exposures might not always match as some MIV survey respondents only reported on their regional exposure but not on their country exposure .
MIXED FUNDS (n=20) (% ofDirectMicrofinancePortfolio)
FIXED INCOME FUNDS (n=41) (% ofDirectMicrofinancePortfolio)
EQUITY FUNDS (n=14) (% ofDirectMicrofinancePortfolio)
0% 2% 4% 6% 8% 10% 12% 14%
Armenia
Kenya
Peru
Panama
Kazakhstan
Georgia
Ecuador
Costa Rica
Cambodia
India 13.2
7.5
5.1
4.8
4.7
4.0
3.6
3.5
3.3
2.8
0% 1% 2% 3% 4% 5% 6% 7% 8% 9% 10%
Mongolia
El Salvador
Costa Rica
Armenia
Mexico
Peru
Georgia
Cambodia
Ecuador
India 8.7
8.3
7.7
6.1
3.7
3.2
3.1
3.1
2.7
2.6
0% 4% 8% 12% 16% 20% 24% 28% 32% 36% 40%
Sri Lanka
Brazil
Colombia
Egypt
China
Georgia
Mexico
Peru
Bolivia
India 36.1
10.5
8.4
6.0
5.0
4.2
2.8
2.4
2.3
1.9
2019 Symbiotics MIV Survey
Page 36
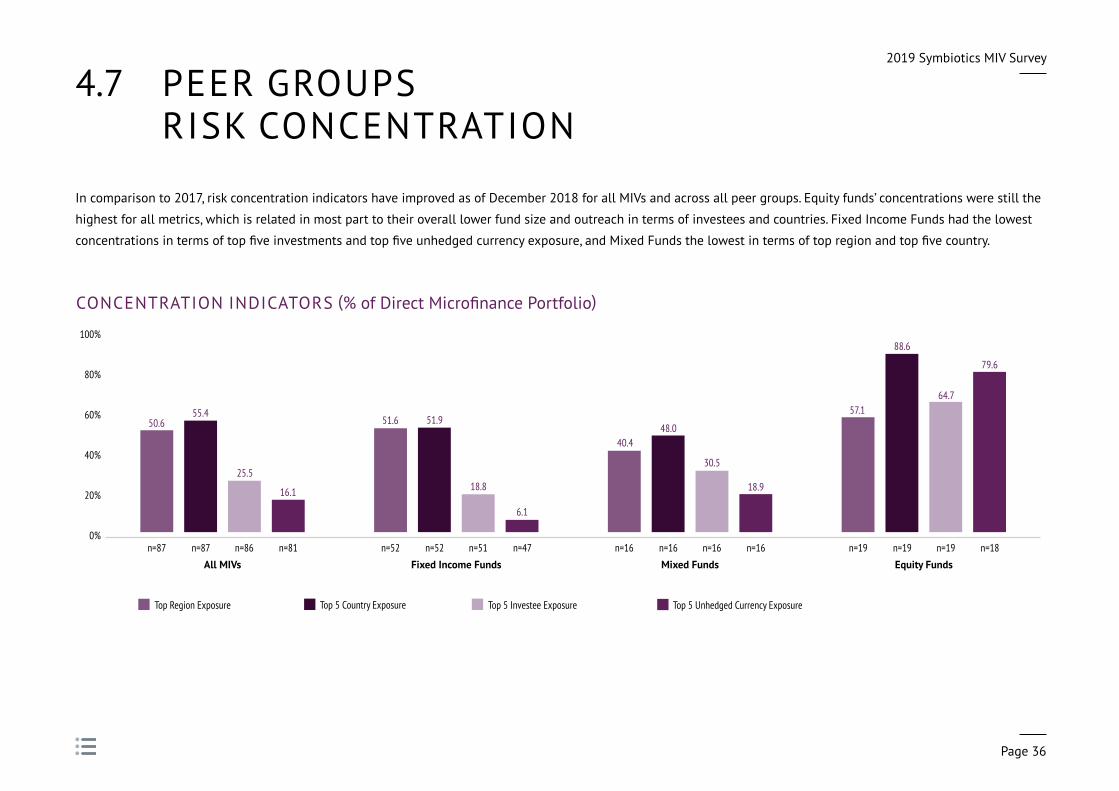
4 .7 PEER GROUPS RISK CONCENTRATION
In comparison to 2017, risk concentration indicators have improved as of December 2018 for all MIVs and across all peer groups . Equity funds’ concentrations were still the
highest for all metrics, which is related in most part to their overall lower fund size and outreach in terms of investees and countries . Fixed Income Funds had the lowest
concentrationsintermsoftopfiveinvestmentsandtopfiveunhedgedcurrencyexposure,andMixedFundsthelowestintermsoftopregionandtopfivecountry.
CONCENTRATION INDICATORS (% ofDirectMicrofinancePortfolio)
0%
20%
40%
60%
80%
100%
Equity FundsMixed FundsFixed Income FundsAll MIVs
Top 5 Country Exposure Top 5 Unhedged Currency ExposureTop Region Exposure Top 5 Investee Exposure
55.4
25.5
16.1
50.6 51.9
18.8
6.1
51.648.0
30.5
18.9
40.4
88.6
64.7
79.6
57.1
n=87 n=87 n=86 n=81 n=52 n=52 n=51 n=47 n=16 n=16 n=16 n=16 n=19 n=19 n=19 n=18

2019 Symbiotics MIV Survey
Page 37
4 .8 PEER GROUPS FUNDING SOURCES
Compared to the situation in 2017, the market
share of private institutional investors has
remained stable for Fixed Income Funds
(+1 percentagepoints),increasedsignificantlyfor
Mixed Funds (+13 percentage point) and declined
for Equity funds (-4 percentage points) . Retail
funders are the second highest source of funding
for MIVs . On a constant sample basis, these funders
have decreased their relative proportion for Fixed
Income and Mixed Funds between 2017 and 2018 .
19
4
17
59
PERCENT
18
3
19
61
PERCENT
48
7
44
PERCENT
2117
3
60
PERCENT
Retail Investors High-Net Worth Individuals Private Institutional Investors Public Sector Funders
ALL MIVs (n=83) FIXED INCOME FUNDS (n=50)
MIXED FUNDS (n=15) EQUITY FUNDS (n=18)
Due to rounding, the sum doesn't equal 100%
1

2019 Symbiotics MIV Survey
Page 38
4 .9 PEER GROUPS COST STRUCTURE
On average, MIVs from the benchmark witnessed a decrease in their Total
Expense Ratio (TER), from 2 .9% in 2017 to 2 .4% in 2018, driven by a drop in
managementfees,atrendthatisconfirmedwhenlookingataconstantsampleof
MIVs over the period . The largest decrease in TER was observed for Mixed Funds .
The management fees were still higher for Mixed and Equity Funds than for Fixed
Income Funds .
TOTAL EXPENSE RATIOS AND MANAGEMENT FEES (Constant Sample Analysis)
17.TheTERforEquityFundsmightbeunderstatedasthecomputationdoesnotincludecertainfeesspecificallyincurredbysuchvehicleslikecarriedinterest,forexample.
18. Changeinbasispointsbasedontheweightedaveragefigures.
ManagementFees Simple Average
Weighted average
Simple Average
Weighted average Change18
2017 2018
All MIVs (n=51) 1 .9% 1 .6% 1 .5% 1 .4% -26 bps
Fixed Income (n=27) 1 .4% 1 .4% 1 .2% 1 .2% -24 bps
Mixed (n=13) 2 .3% 2 .3% 1 .9% 1 .7% -55 bps
Equity (n=11) 2 .6% 2 .2% 1 .7% 1 .7% -46 bps
TER Simple Average
Weighted average
Simple Average
Weighted average Change18
2017 2018
All MIVs (n=57) 2 .6% 2 .4% 2 .4% 2 .1% -27 bps
Fixed Income (n=32) 2 .5% 2 .3% 2 .3% 2 .0% -23 bps
Mixed (n=14) 3 .2% 2 .7% 2 .8% 2 .2% -58 bps
Equity17 (n=11) 2 .2% 2 .2% 2 .0% 2 .0% -44 bps
TOTAL EXPENSE RATIOS AND MANAGEMENT FEES (% of Average Assets over 2 Years)
0%
1%
2%
3%
Equity Funds(TER n=11)
(Mgt Fees n=10)
Mixed Funds(TER n=14)
(Mgt Fees n=13)
Fixed-income Funds(TER n=34)
(Mgt Fees n=29)
All MIVs(TER n=59)
(Mgt Fees n=52)
Other Expenses Management Fees
1.71.9
1.21.5
TER: 2.1
TER: 2.8
TER: 2.2TER: 2.4
0.41.0
0.9
0.9

2019 Symbiotics MIV Survey
Page 39
4 .10 PEER GROUPS FINANCIAL PERFORMANCE
For unlevered vehicles, net returns increased in 2018 across all currencies (USD, EUR and CHF) for Fixed Income and Mixed Funds . Returns in USD for the former have been
the highest since 2012, amounting to 3 .3% and 3 .9% on a simple average and weighted average basis respectively . Returns in EUR were higher for Mixed Funds compared
totheirfixedincomecounterparts.
2018 FINANCIAL PERFORMANCE – UNLEVERAGED VEHICLES
2018 FINANCIAL PERFORMANCE – LEVERAGED VEHICLES
Simple Average Weighted Average Simple Average Weighted Average Simple Average Weighted Average
USD EUR CHF
Fixed Income Funds 3 .3% (15) 3 .9% (15) 2 .2% (16) 1 .6% (16) 1 .2% (8) 0 .9% (8)
Mixed Funds – – 3 .8% (5) 3 .5% (5) – –
Equity Funds 7 .6% (4) 7 .6% (4) – – – –
Simple Average Weighted Average
EUR
Equity Tranche (ROE) 1 .8% (3) 1 .7% (3)

2019 Symbiotics MIV Survey
Page 40
4 .11 PEER GROUPS FIXED INCOME FUNDS’ PERFORMANCE
For Fixed Income Funds, 2018 was a comparatively
better year than 2017 in terms of net returns . USD
and EUR share classes recorded +3 .3% and +2 .2%
respectively, bouncing back after three challenging
years . Returns in EUR performed better than the
industry benchmark for the rate of returns of
MicrofinanceFixedIncomeFunds,theSMX-MIV
Debt Index .19 However, this was not the case
for the USD for which the SMX-MIV Debt Index
returned 3 .9% in 2018 .
19 . The SMX - MIV Debt USD, EUR and CHF indexes are Symbiotics’ in-house indexes which track, on a monthly basis, the NAV of a selection of MIVs with a majority of assetsinvestedinfixedincomeinstruments.Thefundsare equally weighted . The index has been available on syminvest .com in USD, EUR and CHF since 2004 .
FIXED INCOME FUNDS: NAV SHARE PRICE PERFORMANCE
-1%
0%
1%
2%
3%
4%
5%
6%
7%
2018201720162015201420132012201120102009200820072006
Benchmark (SMX – MIV Debt USD)
Annual Return USD (n=15)
Benchmark (SMX – MIV Debt EUR)
Annual Return EUR (n=16)
2019 Symbiotics MIV Survey
Page 41
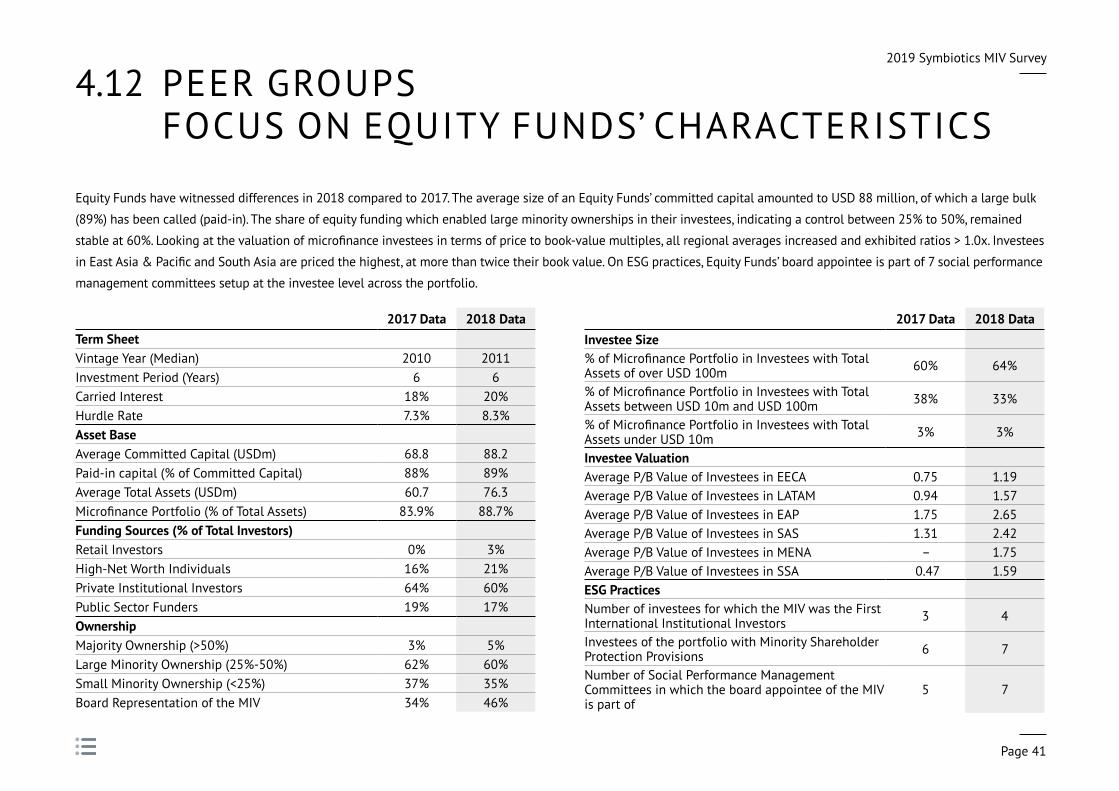
4 .12 PEER GROUPS FOCUS ON EQUITY FUNDS’ CHARACTERISTICS
Equity Funds have witnessed differences in 2018 compared to 2017 . The average size of an Equity Funds’ committed capital amounted to USD 88 million, of which a large bulk
(89%) has been called (paid-in) . The share of equity funding which enabled large minority ownerships in their investees, indicating a control between 25% to 50%, remained
stableat60%.Lookingatthevaluationofmicrofinanceinvesteesintermsofpricetobook-valuemultiples,allregionalaveragesincreasedandexhibitedratios>1.0x.Investees
inEastAsia&PacificandSouthAsiaarepricedthehighest,atmorethantwicetheirbookvalue.OnESGpractices,EquityFunds’boardappointeeispartof7socialperformance
management committees setup at the investee level across the portfolio .
2017 Data 2018 DataTermSheetVintage Year (Median) 2010 2011Investment Period (Years) 6 6Carried Interest 18% 20%Hurdle Rate 7 .3% 8 .3%Asset BaseAverage Committed Capital (USDm) 68 .8 88 .2 Paid-in capital (% of Committed Capital) 88% 89%Average Total Assets (USDm) 60 .7 76 .3 MicrofinancePortfolio(%ofTotalAssets) 83 .9% 88 .7%FundingSources(%ofTotalInvestors)Retail Investors 0% 3%High-Net Worth Individuals 16% 21%Private Institutional Investors 64% 60%Public Sector Funders 19% 17%OwnershipMajorityOwnership(>50%) 3% 5%Large Minority Ownership (25%-50%) 62% 60%Small Minority Ownership (<25%) 37% 35%Board Representation of the MIV 34% 46%
2017 Data 2018 DataInvestee Size%ofMicrofinancePortfolioinInvesteeswithTotalAssets of over USD 100m 60% 64%
%ofMicrofinancePortfolioinInvesteeswithTotalAssets between USD 10m and USD 100m 38% 33%
%ofMicrofinancePortfolioinInvesteeswithTotalAssets under USD 10m 3% 3%
Investee ValuationAverage P/B Value of Investees in EECA 0 .75 1 .19 Average P/B Value of Investees in LATAM 0 .94 1 .57 Average P/B Value of Investees in EAP 1 .75 2 .65 Average P/B Value of Investees in SAS 1 .31 2 .42 Average P/B Value of Investees in MENA – 1 .75 Average P/B Value of Investees in SSA 0 .47 1 .59 ESG PracticesNumber of investees for which the MIV was the First International Institutional Investors 3 4
Investees of the portfolio with Minority Shareholder Protection Provisions 6 7
Number of Social Performance Management Committees in which the board appointee of the MIV is part of
5 7

2019 Symbiotics MIV Survey
Page 42
4 .13 PEER GROUPS GOVERNANCE IN ESG PRACTICES
As of December 2018, the vast majority of MIVs (87%) required their investees
to have anti-corruption policies and/or whistle-blowing procedures . This portion
was slightly lower for Fixed Income Funds, at 82% . A high proportion of MIVs
(87%) produced a special report on ESG practices for their investors or included
ESG performance results in their annual report, a slight decrease compared to
the 92% surveyed as of December 2017 . In terms of technical assistance, an MIV
incurred on average USD 254,000 of technical assistance costs, down from USD
343,000 in 2017 .20 More than 40% of MIVs disclose to their investees the annual
equivalentcostofraisingdebtfundingasasinglepercentagefigure(annualized).
USD254kAverage Annual Technical Assistance Cost (n=14)
42.3%Annual Percentage Rate Disclosure (n=52)
REQUIREMENTS OF ANTI-CORRUPTION POLICIES (% of MIVs)
REPORTING OF ESG INFORMATION TO INVESTORS (% of MIVs)
0%
20%
40%
60%
80%
100%
Equity Funds(n=19)
Mixed Funds(n=14)
Fixed Income Funds(n=45)
All MIVs(n=78)
95%93%87%
82%
0%
20%
40%
60%
80%
100%
Equity Funds(n=19)
Mixed Funds(n=16)
Fixed Income Funds(n=47)
All MIVs(n=82)
84%87% 85%94%
20 . The sample of 14 MIVs usually include those vehicle that are already providing Technical Assistance . Those that do not incur any Technical Assistance costs have been removed from the sample.
5 .IN COOPERATION WITH THE SOCIAL PERFORMANCE TASKFORCETheSocialPerformanceTaskForce(SPTF)isanon-profitmembershiporganizationwithmorethan3,000membersfromallovertheworld.SPTFengagestodevelopand
promotestandardsandgoodpracticesforsocialperformancemanagement(SPM),inanefforttomakefinancialservicessaferandmorebeneficialforclients.Formore
information, please visit SPTF’s website .
Starting in 2015, the SPTF partnered with Symbiotics to add questions to the MIV Survey that look at how MIVs incorporate various aspects of social performance into their
activities . The questions cover policies, tools and initiatives related to the work of the SPTF and its Social Investor Working Group in the pursuit of ensuring responsible
investmentininclusivefinance.

2019 Symbiotics MIV Survey
Page 44
5 .1 SPTF INVESTMENT TERMS FOR LENDERS
The SPTF’s lenders’ guidelines for setting reasonable covenants in support of
responsiblemicrofinance(“reasonablecovenants”)isacommonsetofcovenants
and social undertakings developed by a group of public and private investors .21
Over 50 MIVs responded to this indicator and 24 reported that they were
aligned with the SPTF’s lenders’ guidelines, out of which 21 were Fixed Income
Funds . Nearly 20 MIVs reported that they are currently including some social
undertakings without being fully aligned with the guidelines . The remaining
10 are either not aligned with the guidelines, or do not know what the lenders’
guidelines are .
21 . For more information on Financial and Social covenants’ initiative, please visit SPTF's website .
ALIGNMENT WITH SPTF'S LENDERS' GUIDELINES (Number of MIVs)
0
10
20
30
40
50
60
Mixed Funds(n=12)
Fixed Income Funds(n=40)
All MIVs(n=53)
Aligned with the Lenders' Guidelines
Include social undertakings but not aligned with the Lenders' Guidelines
Not aligned
Do not know what the Lenders' Guidelines are
3
2
19
24
7
3
13
21
3
6
04
2019 Symbiotics MIV Survey
Page 45
5 .2 SPTF PREFERENTIAL TERMS
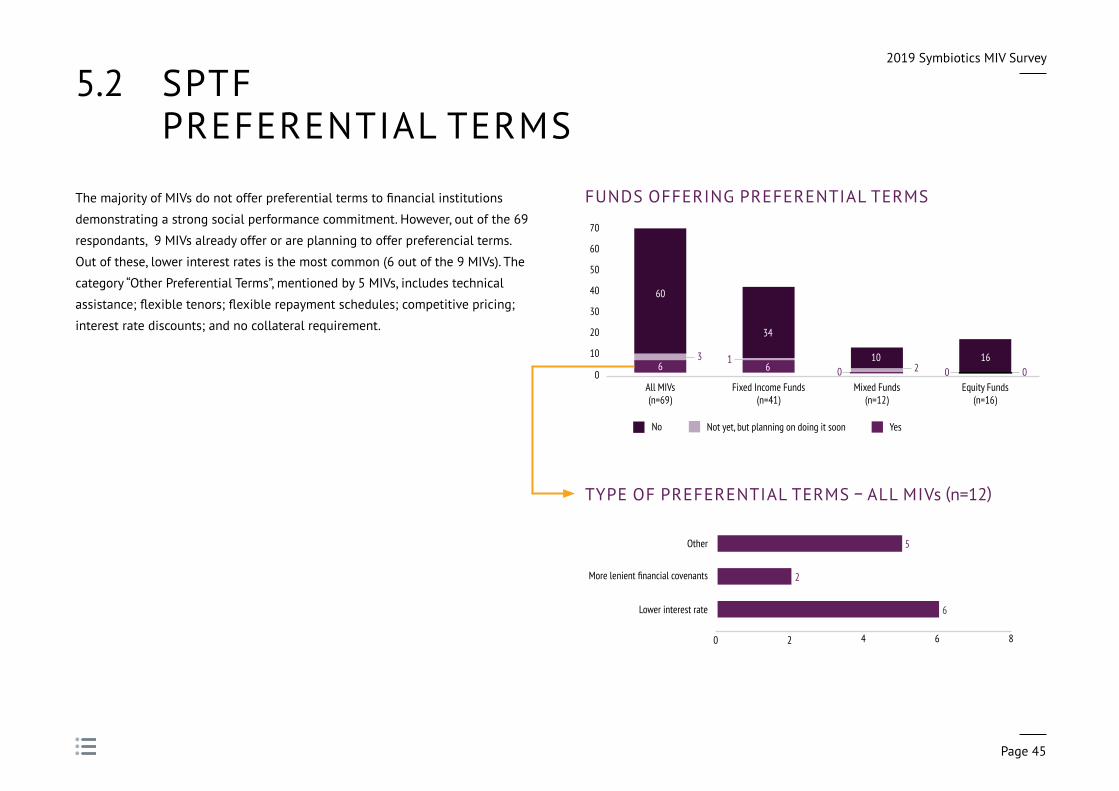
ThemajorityofMIVsdonotofferpreferentialtermstofinancialinstitutions
demonstrating a strong social performance commitment . However, out of the 69
respondants, 9 MIVs already offer or are planning to offer preferencial terms .
Out of these, lower interest rates is the most common (6 out of the 9 MIVs) . The
category“OtherPreferentialTerms”,mentionedby5MIVs,includestechnical
assistance;flexibletenors;flexiblerepaymentschedules;competitivepricing;
interest rate discounts; and no collateral requirement .
FUNDS OFFERING PREFERENTIAL TERMS
0
10
20
30
40
50
60
70
Equity Funds(n=16)
Mixed Funds(n=12)
Fixed Income Funds(n=41)
All MIVs(n=69)
YesNot yet, but planning on doing it soonNo
6
60
1 1632 06
34
100 0
TYPE OF PREFERENTIAL TERMS – ALL MIVs (n=12)
0 2 4 6 8
Lower interest rate
5
2
6
More lenient financial covenants
Other

2019 Symbiotics MIV Survey
Page 46
5 .3 SPTF MIVs' PRINCIPAL SOCIAL GOALS
A list of 10 social goals was submitted to the MIVs, which had to rank their top 3 priority goals . Below are the 8 most selected goals among MIVs, ranked using the Borda
Count Method .22 The order is the same compared to last year, except fot the «Gender equality and women’s empowerment» which ranked 4th with the same number of
points with «Growth of existing businesses» .
22. IntheBordaCountMethod,eachalternativegets1pointforeachlastplacereceived,2pointsforeachnext-to-lastpoint,etc.,allthewayuptoNpointsforeachfirstplacealternative(whereNisthenumberofalternatives).Thealternativewiththelargestpointtotalisrankedasfirst.
23 . "Other" as indicated by MIVs includes: rural development, access to clean, affordable and reliable energy solutions; and access to water and sanitation .
1stIncreased access tofinancialservices
6thOther23
2ndImprovinglivelihoods of clients
7thDevelopment ofstart-up enterprises
3rdEmploymentgeneration
8thChildren's schooling
4thGender equality and women’s empowerment
4thGrowth of existing businesses
2019 Symbiotics MIV Survey
Page 47
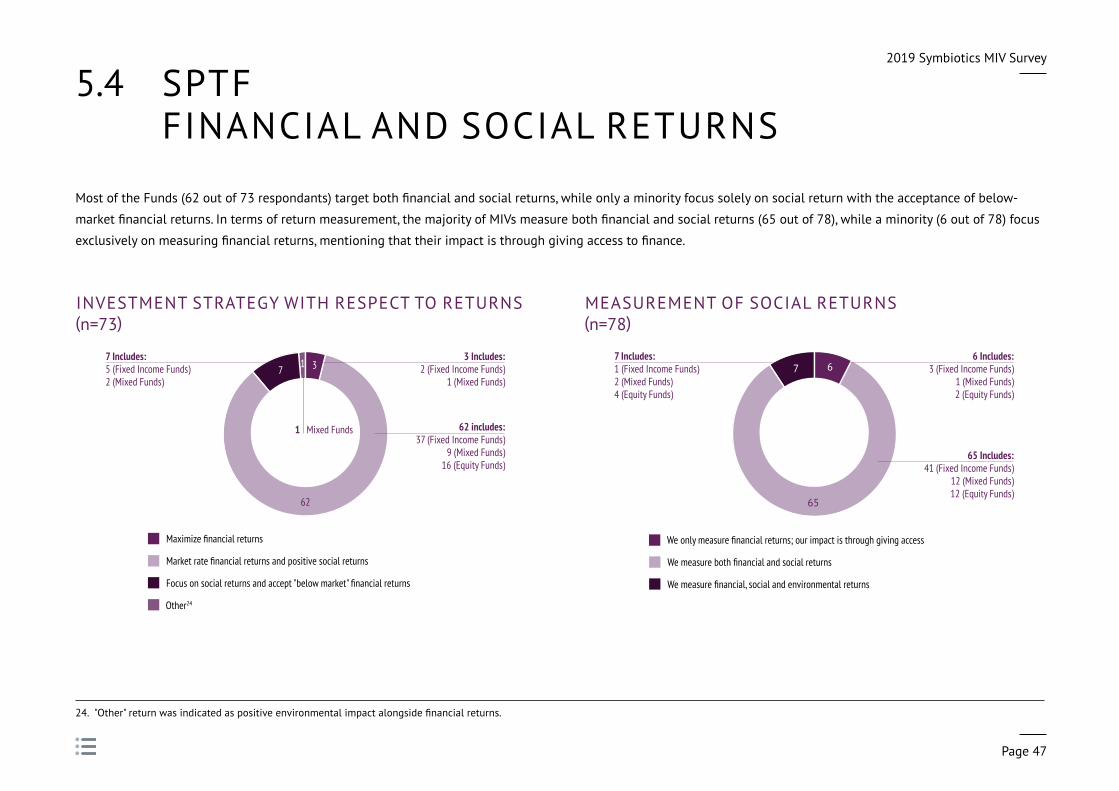
5 .4 SPTF FINANCIALANDSOCIAL RETURNS
MostoftheFunds(62outof73respondants)targetbothfinancialandsocialreturns,whileonlyaminorityfocussolelyonsocialreturnwiththeacceptanceofbelow-
marketfinancialreturns.Intermsofreturnmeasurement,themajorityofMIVsmeasurebothfinancialandsocialreturns(65outof78),whileaminority(6outof78)focus
exclusivelyonmeasuringfinancialreturns,mentioningthattheirimpactisthroughgivingaccesstofinance.
INVESTMENTSTRATEGYWITHRESPECTTO RETURNS(n=73)
MEASUREMENT OF SOCIAL RETURNS(n=78)
62
17 3
Other24
Focus on social returns and accept "below market" financial returns
Market rate financial returns and positive social returns
Maximize financial returns
62 includes:37 (Fixed Income Funds)
9 (Mixed Funds)16 (Equity Funds)
7 Includes:5 (Fixed Income Funds)2 (Mixed Funds)
1 Mixed Funds
3 Includes:2 (Fixed Income Funds)
1 (Mixed Funds)6
65
7
We measure financial, social and environmental returns
We measure both financial and social returns
We only measure financial returns; our impact is through giving access
7 Includes:1 (Fixed Income Funds)2 (Mixed Funds)4 (Equity Funds)
6 Includes:3 (Fixed Income Funds)
1 (Mixed Funds)2 (Equity Funds)
65 Includes:41 (Fixed Income Funds)
12 (Mixed Funds)12 (Equity Funds)
24. "Other"returnwasindicatedaspositiveenvironmentalimpactalongsidefinancialreturns.

2019 Symbiotics MIV Survey
Page 48
5 .5 SPTF MEASUREMENT OF NON-FINANCIAL RETURNS
Whenaskedtodescribetheirmeasurementofnon-financialreturns,50MIVs
reported on whether they assess the SPM of their investees through in-house
or external tools . Out of those 50 MIVs, 28 use only in-house tools, 7 use only
external tools, and 15 use a mix of both . In terms of data collection practices,
i .e . outreach vs . outcomes data collection on their investees, 55 MIVs provided
their input . Outreach indicators are collected and analyzed by 24 MIVs, outcomes
indicators by 8 funds and the rest (23 MIVs) do both collection practices .
ASSESSMENT TOOLS USED TO MEASURE INVESTEES’ SOCIAL PERFORMANCE
OUTREACH & OUTCOMES: DATA COLLECTION
0
10
20
30
40
50
Equity Funds(n=13)
Mixed Funds(n=21)
Fixed Income Funds(n=35)
All MIVs(n=69)
43
2227
13 127
4 2
We use tools developed by the industry to assess the social performance of our investees
We use in house developed tools to assess the social performance management of our investees
0
10
20
30
40
50
Equity Funds(n=13)
Mixed Funds(n=21)
Fixed Income Funds(n=35)
All MIVs(n=69)
47
3127
24
104
10
3
We collect and analyze outcomes data from our investees
We collect and analyze outreach indicators on our investees

2019 Symbiotics MIV Survey
Page 49
5 .6 SPTF SOCIAL RATING & SOCIAL AUDIT
MIVsbyandlargedointernalsocialratingsontheirmicrofinanceinvestees.
External social ratings are also used however, but on a much smaller scale, for
36% of portfolio investees on a weighted average basis .25 Of MIVs that have
reported on these indicators, 17 perform both internal and external social ratings
of their investees .
SOCIAL RATINGS AND/OR SOCIAL AUDIT (% ofMicrofinanceInvestees)
0%
20%
40%
60%
80%
100%
Equity FundsMixed FundsFixed Income FundsAll MIVs
76.2
35.9
71.0
44.0
63.4
32.3
94.8
4.1
External Social Rating (n=39 for "All MIVs" peer group)
Internal Social Rating (n=43 for "All MIVs" peer group)
25. Weightedaverage:sumofallmicrofinanceinvesteesthathaveasocialrating(internalorexternal)dividedbythesumofallmicrofinanceinvesteesfromtheportfolio.

2019 Symbiotics MIV Survey
Page 50
5 .7 SPTF GREEN LOANS
GreenLoansaredefinedasloanproductsspecificallydesignedtofinancethe
purchaseofenergyefficientorenvironmentallyfriendlyproducts,suchassolar
panels, home insulation, biodigesters, clean cookstoves, etc . Compared to 2017,
thepercentageofmicrofinanceinvesteesthatoffersuchgreenloansinMIV
portfolios slightly decreased, from a level of 25% in 2017 to 22% as of 2018 .26
Mixed Funds service the highest percentage of investees offering green loans
(29%), followed by Equity Funds (27%) and Fixed Income Funds (21%) .
% OF MICROFINANCE INVESTEES IN THE MIV DIRECT PORTFOLIO THAT OFFER GREEN LOANS (Weighted Average)
0%
10%
20%
30%
Equity Funds(n=13 for 2018)
Mixed Funds(n=6 for 2018)
Fixed Income Funds(n=15 for 2018)
All MIVs(n=34 for 2018)
24 2522
25 2521
26
22
29
15
28 27
201820172016
26 . Percentages are calculated on a weighted average, using the following computation: sum of all microfinanceinvesteesofferinggreenloansdividedbythesumofallmicrofinanceinvestees.
2019 Symbiotics MIV Survey
Page 51
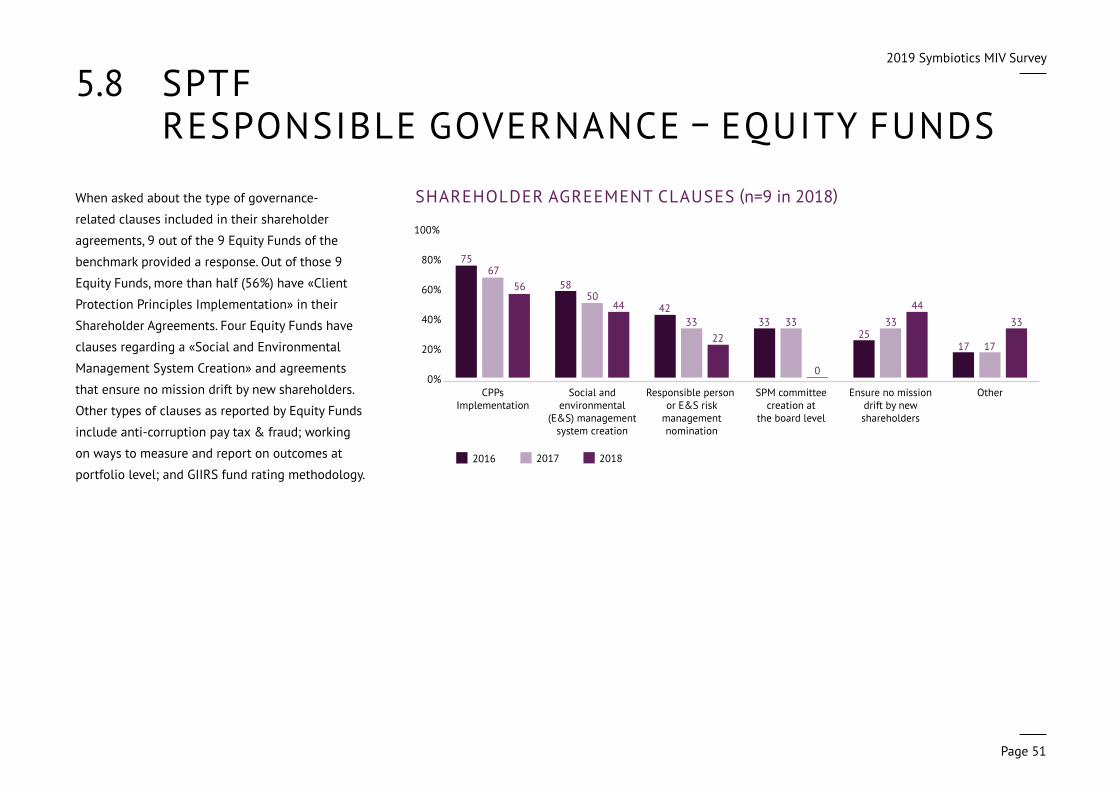
5 .8 SPTF RESPONSIBLE GOVERNANCE – EQUITY FUNDS
When asked about the type of governance-
related clauses included in their shareholder
agreements, 9 out of the 9 Equity Funds of the
benchmark provided a response . Out of those 9
Equity Funds, more than half (56%) have «Client
Protection Principles Implementation» in their
Shareholder Agreements . Four Equity Funds have
clauses regarding a «Social and Environmental
Management System Creation» and agreements
that ensure no mission drift by new shareholders .
Other types of clauses as reported by Equity Funds
include anti-corruption pay tax & fraud; working
on ways to measure and report on outcomes at
portfolio level; and GIIRS fund rating methodology .
SHAREHOLDER AGREEMENT CLAUSES (n=9 in 2018)
0%
20%
40%
60%
80%
100%
OtherEnsure no missiondrift by newshareholders
SPM committeecreation at
the board level
Responsible person or E&S risk
managementnomination
Social andenvironmental
(E&S) managementsystem creation
CPPsImplementation
7567
56 5850
44 4233
2233 33
0
2533
44
17 17
33
2017 20182016

APPENDICES
2019 Symbiotics MIV Survey
Page 53
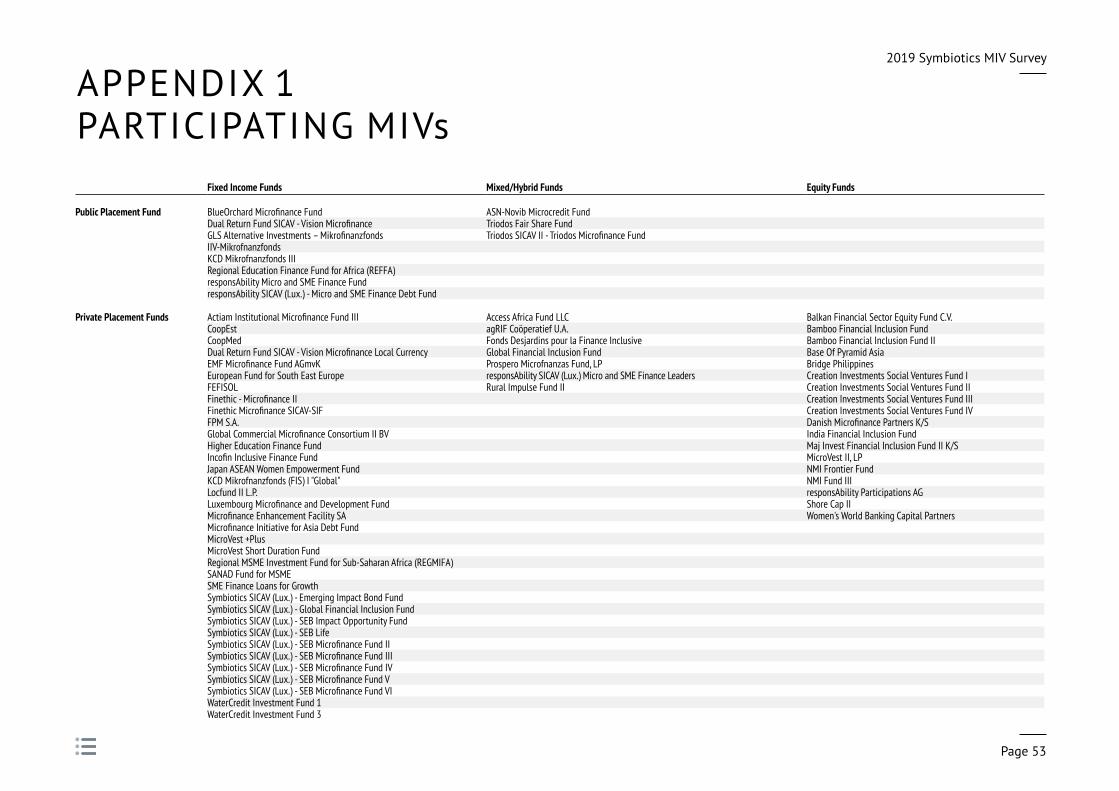
APPENDIX 1PARTICIPATING MIVs
Fixed Income Funds Mixed/Hybrid Funds Equity Funds
Public Placement Fund BlueOrchard Microfinance Fund ASN-Novib Microcredit FundDual Return Fund SICAV - Vision Microfinance Triodos Fair Share FundGLS Alternative Investments – Mikrofinanzfonds Triodos SICAV II - Triodos Microfinance FundIIV-Mikrofnanzfonds KCD Mikrofnanzfonds IIIRegional Education Finance Fund for Africa (REFFA)responsAbility Micro and SME Finance FundresponsAbility SICAV (Lux.) - Micro and SME Finance Debt Fund
Private Placement Funds Actiam Institutional Microfinance Fund III Access Africa Fund LLC Balkan Financial Sector Equity Fund C.V.CoopEst agRIF Coöperatief U.A. Bamboo Financial Inclusion FundCoopMed Fonds Desjardins pour la Finance Inclusive Bamboo Financial Inclusion Fund IIDual Return Fund SICAV - Vision Microfinance Local Currency Global Financial Inclusion Fund Base Of Pyramid AsiaEMF Microfinance Fund AGmvK Prospero Microfnanzas Fund, LP Bridge PhilippinesEuropean Fund for South East Europe responsAbility SICAV (Lux.) Micro and SME Finance Leaders Creation Investments Social Ventures Fund IFEFISOL Rural Impulse Fund II Creation Investments Social Ventures Fund IIFinethic - Microfinance II Creation Investments Social Ventures Fund IIIFinethic Microfinance SICAV-SIF Creation Investments Social Ventures Fund IVFPM S.A. Danish Microfinance Partners K/S Global Commercial Microfinance Consortium II BV India Financial Inclusion FundHigher Education Finance Fund Maj Invest Financial Inclusion Fund II K/SIncofin Inclusive Finance Fund MicroVest II, LPJapan ASEAN Women Empowerment Fund NMI Frontier FundKCD Mikrofnanzfonds (FIS) I "Global" NMI Fund IIILocfund II L.P. responsAbility Participations AGLuxembourg Microfinance and Development Fund Shore Cap IIMicrofinance Enhancement Facility SA Women's World Banking Capital PartnersMicrofinance Initiative for Asia Debt FundMicroVest +PlusMicroVest Short Duration FundRegional MSME Investment Fund for Sub-Saharan Africa (REGMIFA)SANAD Fund for MSMESME Finance Loans for GrowthSymbiotics SICAV (Lux.) - Emerging Impact Bond FundSymbiotics SICAV (Lux.) - Global Financial Inclusion FundSymbiotics SICAV (Lux.) - SEB Impact Opportunity Fund Symbiotics SICAV (Lux.) - SEB LifeSymbiotics SICAV (Lux.) - SEB Microfinance Fund IISymbiotics SICAV (Lux.) - SEB Microfinance Fund IIISymbiotics SICAV (Lux.) - SEB Microfinance Fund IVSymbiotics SICAV (Lux.) - SEB Microfinance Fund VSymbiotics SICAV (Lux.) - SEB Microfinance Fund VIWaterCredit Investment Fund 1WaterCredit Investment Fund 3
2019 Symbiotics MIV Survey
Page 54
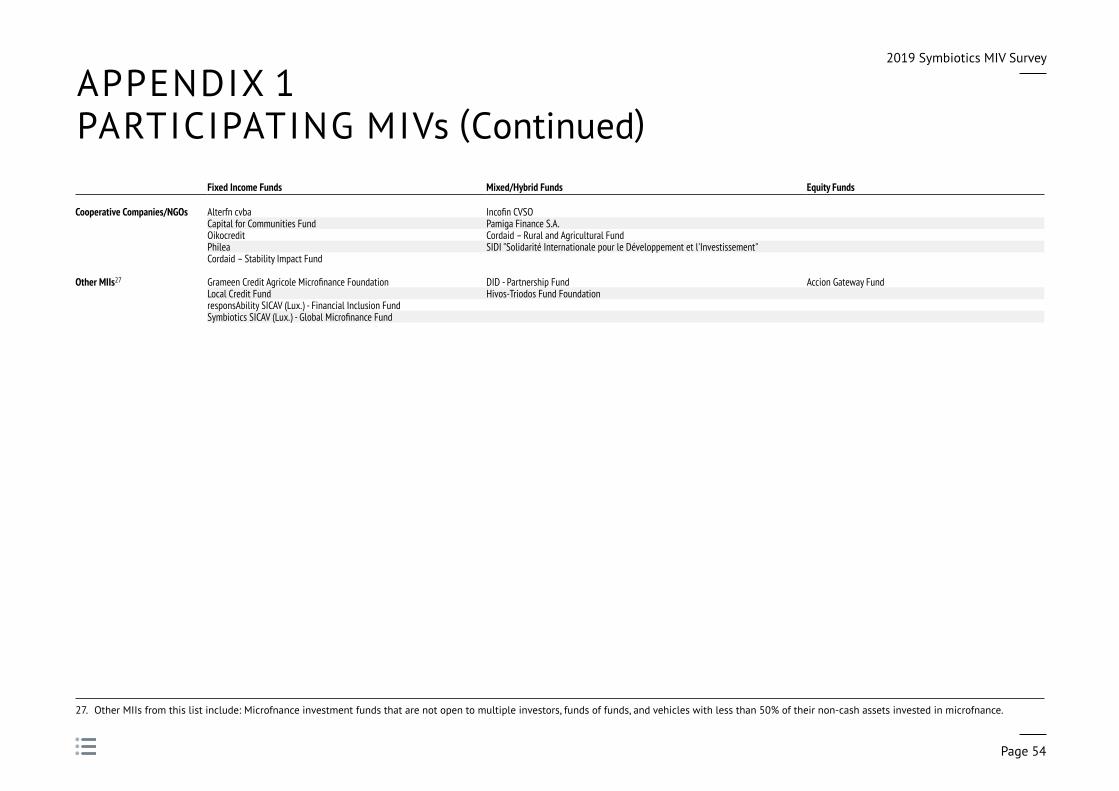
APPENDIX 1PARTICIPATING MIVs (Continued)
27 . Other MIIs from this list include: Microfnance investment funds that are not open to multiple investors, funds of funds, and vehicles with less than 50% of their non-cash assets invested in microfnance .
Fixed Income Funds Mixed/Hybrid Funds Equity Funds
Cooperative Companies/NGOs Alterfn cvba Incofin CVSOCapital for Communities Fund Pamiga Finance S.A.Oikocredit Cordaid – Rural and Agricultural FundPhilea SIDI "Solidarité Internationale pour le Développement et l'Investissement"Cordaid – Stability Impact Fund
Other MIIs27 Grameen Credit Agricole Microfinance Foundation DID - Partnership Fund Accion Gateway FundLocal Credit Fund Hivos-Triodos Fund Foundation responsAbility SICAV (Lux.) - Financial Inclusion Fund Symbiotics SICAV (Lux.) - Global Microfinance Fund
2019 Symbiotics MIV Survey
Page 55
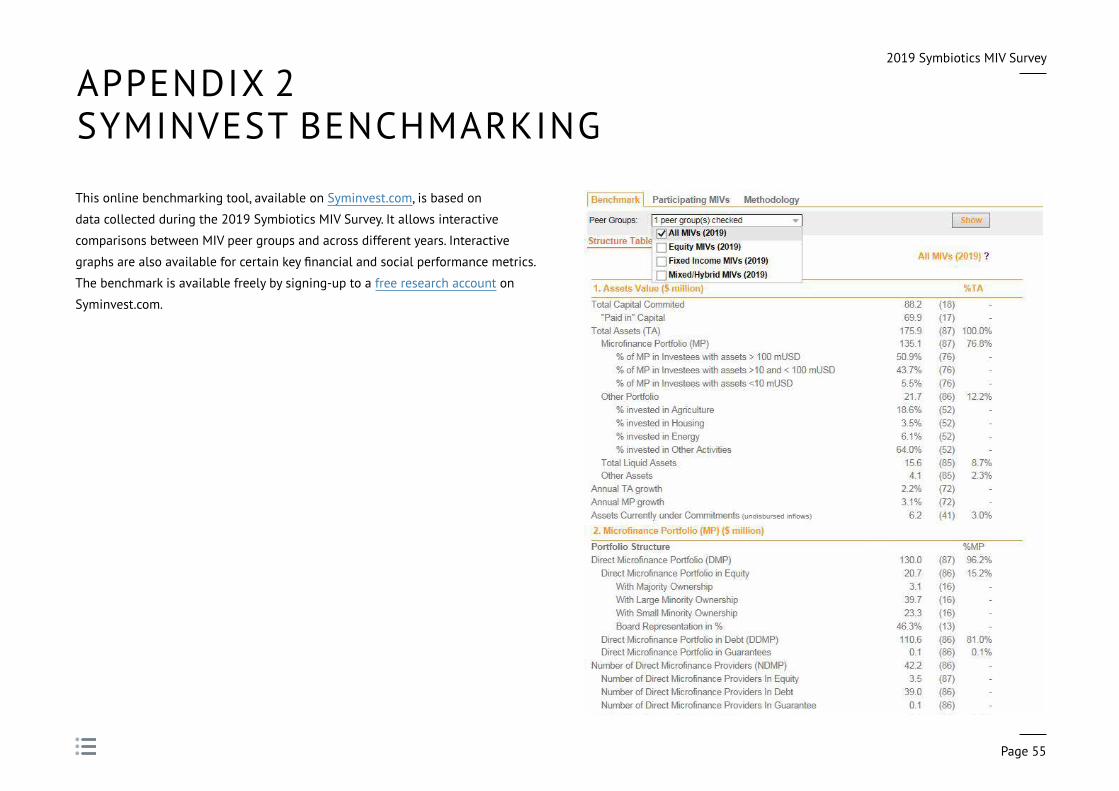
APPENDIX 2SYMINVEST BENCHMARKING
This online benchmarking tool, available on Syminvest .com, is based on
data collected during the 2019 Symbiotics MIV Survey . It allows interactive
comparisons between MIV peer groups and across different years . Interactive
graphsarealsoavailableforcertainkeyfinancialandsocialperformancemetrics.
The benchmark is available freely by signing-up to a free research account on
Syminvest .com .
GENEVA(HQ)Rue de la Synagogue 31
1204 Geneva
Switzerland
t +41 22 338 15 40
SINGAPORE134 Amoy Street #03-01
Singapore 049963
t +65 31 63 71 80
ZURICHLimmatquai 86
8001 Zurich
Switzerland
t +41 43 499 87 89
CAPETOWN4 Loop Street, Studio 502
Cape Town 8001
South Africa
t +27 21 425 51 19
MEXICOCITYAv . Insurgentes Sur 619-202
Colonia Nápoles C .P . 03810
México City, México
t +52 55 55 84 78 72
LONDON6 Bevis Marks
London EC3A 7BA
United Kingdom
t +44 203 786 1186
AMSTERDAMMeester Treublaan 7
1097 DP Amsterdam
The Netherlands
t +31 20 240 93 29
SALTLAKECITY222 S . Main Street
Salt Lake City 84101, Utah
United States
t +01 807 657 1987
symbioticsgroup.com