2019 INGREDIENT DATABASE - USDEC
102
Katie Phelan COPYRIGHT ©2019. USDEC. ALL RIGHTS RESERVED 2019 INGREDIENT DATABASE Explanatory Notes
Transcript of 2019 INGREDIENT DATABASE - USDEC
Katie Phelan
COPYRIGHT ©2019. USDEC. ALL RIGHTS RESERVED
2019 INGREDIENT DATABASE Explanatory Notes
Contents 1 Asia .......................................................................................................................................... 1 1.1 Bangladesh ..................................................................................................................... 1 1.2 China .............................................................................................................................. 3 1.3 Hong Kong ...................................................................................................................... 6 1.4 India ................................................................................................................................ 7 1.5 Indonesia ...................................................................................................................... 10 1.6 Japan ............................................................................................................................ 12 1.7 Malaysia........................................................................................................................ 15 1.8 Pakistan ........................................................................................................................ 16 1.9 Philippines .................................................................................................................... 17 1.10 Singapore ................................................................................................................... 19 1.11 South Korea ................................................................................................................ 20 1.12 Taiwan ........................................................................................................................ 22 1.13 Thailand ...................................................................................................................... 23 1.14 Vietnam....................................................................................................................... 25 2 Middle East & Africa .............................................................................................................. 27 2.1 Algeria ........................................................................................................................... 27 2.2 Egypt ............................................................................................................................. 29 2.3 Morocco ........................................................................................................................ 32 2.4 Nigeria .......................................................................................................................... 36 2.5 Saudi Arabia ................................................................................................................. 38 2.6 Turkey ........................................................................................................................... 42 2.7 UAE .............................................................................................................................. 44 3 Australasia ............................................................................................................................. 48 3.1 Australia ........................................................................................................................ 48 3.2 New Zealand ................................................................................................................ 53 4 Europe ................................................................................................................................... 58 4.1 EU-28 ............................................................................................................................ 58 5 North America ........................................................................................................................ 64 5.1 Canada ........................................................................................................................ 64 5.2 USA ............................................................................................................................. 66 6 Latin America ......................................................................................................................... 69 6.1 Argentina ...................................................................................................................... 69 6.2 Brazil ............................................................................................................................. 72 6.3 Chile .............................................................................................................................. 75 6.4 Colombia....................................................................................................................... 79 6.5 Guatemala .................................................................................................................... 82 6.6 Mexico .......................................................................................................................... 85 6.7 Peru .............................................................................................................................. 88 6.8 Uruguay ........................................................................................................................ 91 6.9 Venezuela ..................................................................................................................... 93 7 Former Soviet Union (FSU) ................................................................................................... 95 7.1 Belarus.......................................................................................................................... 95 7.2 Russia ........................................................................................................................... 97 7.3 Ukraine ......................................................................................................................... 99
1
1. Asia
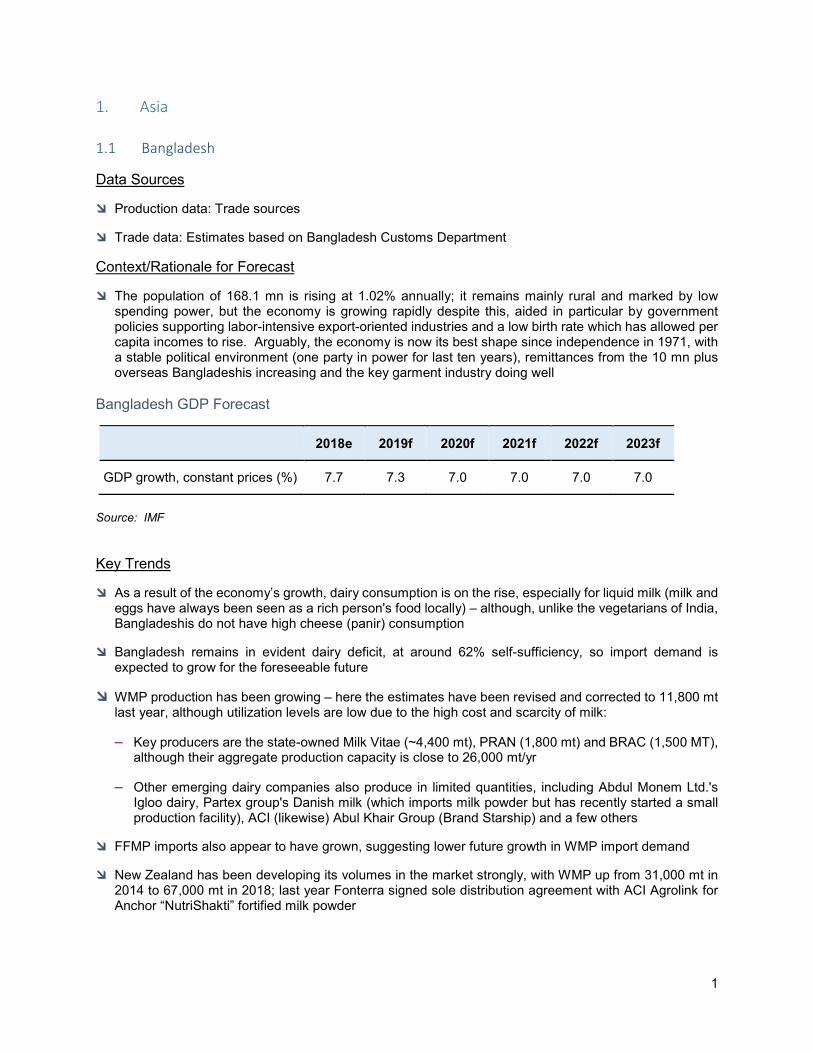
1.1 Bangladesh
Data Sources
Production data: Trade sources
Trade data: Estimates based on Bangladesh Customs Department
Context/Rationale for Forecast
The population of 168.1 mn is rising at 1.02% annually; it remains mainly rural and marked by low spending power, but the economy is growing rapidly despite this, aided in particular by government policies supporting labor-intensive export-oriented industries and a low birth rate which has allowed per capita incomes to rise. Arguably, the economy is now its best shape since independence in 1971, with a stable political environment (one party in power for last ten years), remittances from the 10 mn plus overseas Bangladeshis increasing and the key garment industry doing well
Bangladesh GDP Forecast
2018e 2019f 2020f 2021f 2022f 2023f
GDP growth, constant prices (%) 7.7 7.3 7.0 7.0 7.0 7.0
Source: IMF Key Trends
As a result of the economy’s growth, dairy consumption is on the rise, especially for liquid milk (milk and eggs have always been seen as a rich person's food locally) – although, unlike the vegetarians of India, Bangladeshis do not have high cheese (panir) consumption
Bangladesh remains in evident dairy deficit, at around 62% self-sufficiency, so import demand is expected to grow for the foreseeable future
WMP production has been growing – here the estimates have been revised and corrected to 11,800 mt last year, although utilization levels are low due to the high cost and scarcity of milk:
– Key producers are the state-owned Milk Vitae (~4,400 mt), PRAN (1,800 mt) and BRAC (1,500 MT), although their aggregate production capacity is close to 26,000 mt/yr
– Other emerging dairy companies also produce in limited quantities, including Abdul Monem Ltd.'s Igloo dairy, Partex group's Danish milk (which imports milk powder but has recently started a small production facility), ACI (likewise) Abul Khair Group (Brand Starship) and a few others
FFMP imports also appear to have grown, suggesting lower future growth in WMP import demand
New Zealand has been developing its volumes in the market strongly, with WMP up from 31,000 mt in 2014 to 67,000 mt in 2018; last year Fonterra signed sole distribution agreement with ACI Agrolink for Anchor “NutriShakti” fortified milk powder
2
Regulatory Changes
The government is putting in a lot of measures to support the development of the local dairying and dairy processing sector:
– Import duties on milk powder were raised from the existing 5% to 10% in the budget for FY 2019-20 (this took effect from July 1, 2019)
– To encourage local dairy producing companies, concessionary benefits have been provided by Statutory Regulatory Order for insulated road milk tankers, animal feed, raw milk preservatives and for AI equipment
– The local supplementary duty on skimmed milk manufacturing has also been withdrawn. It was originally charged at 20%, as it was considered a luxury product, and then later reduced to 15%. A supplementary duty for butter and other fats and oils derived from milk and dairy spreads has also been reduced
– With the support from World Bank, the Department of Livestock Services (DLS) started the Livestock Development based Dairy Revolution and Meat Production Project in July, 2018. The World Bank commitment to this is US$500 mn, with the Bangladesh government due to add around US$100 mn more. The project will be completed by June, 2021. Key expected results are improved agricultural technology, increased productivity by species, increased market access and so sales for producers and processors, more risk resilient operating practices backed up by livestock insurance products
– The Bangladesh Dairy Development Board Act-2017 has been drafted and sent to Cabinet. On its approval a Dairy Development Board will be created to regulate the dairy market, set standards and facilitate research and regulations and activities to improve local dairy production
– Bangladesh Bank has launched a 2 bn BDT (Bangladeshi Taka) refinancing scheme to dairy farming, facilitating credit for dairy farmers for rearing dairy cows and AI
– There are regular extension program of DLS for breed improvement, husbandry practice improvement and feed improvement for dairy cattle
New Plant / Capacity Expansions
Two existing key players (BRAC and PRAN) have also increased their production of butter and cheese, competing vs. Milk Vitae, whose production levels are steady. Some of the country’s large food processors have entered the market with butter and cheese products, including Ejab Group, Golden Harvest and Igloo Dairy (Abdul Monem Ltd.)
Nestlé is setting up an infant milk plant in Bangladesh this year
3
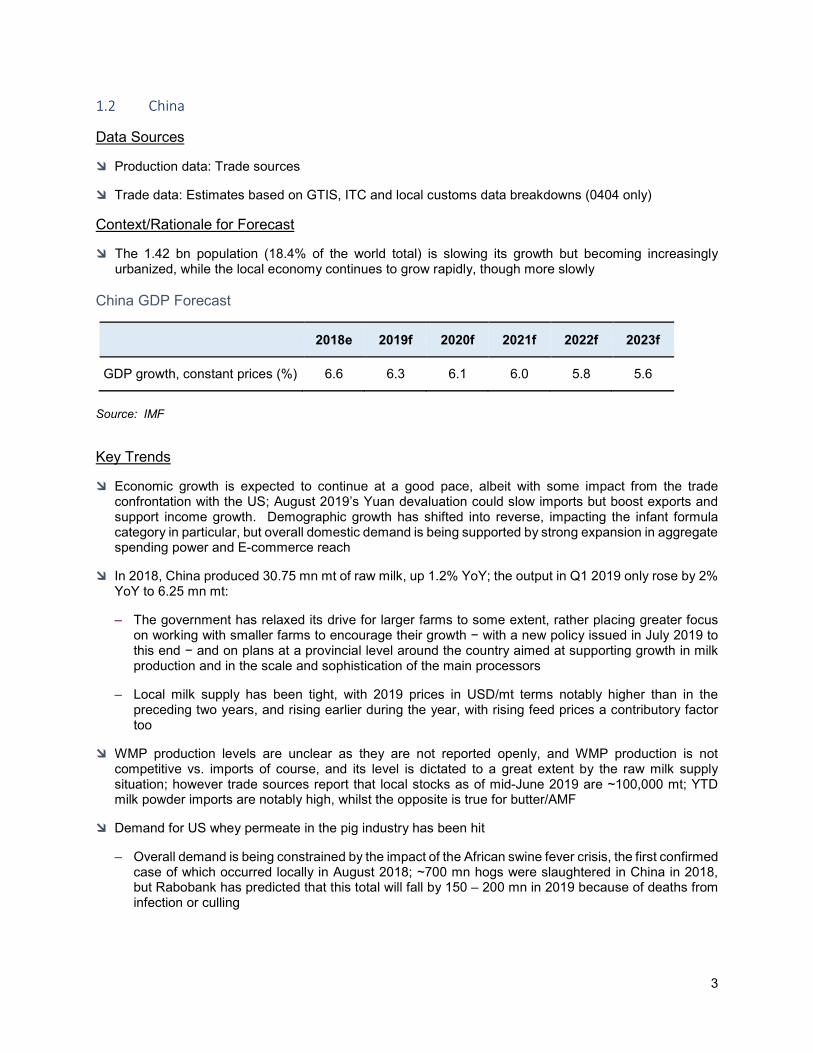
1.2 China
Data Sources
Production data: Trade sources
Trade data: Estimates based on GTIS, ITC and local customs data breakdowns (0404 only)
Context/Rationale for Forecast
The 1.42 bn population (18.4% of the world total) is slowing its growth but becoming increasingly urbanized, while the local economy continues to grow rapidly, though more slowly
China GDP Forecast
2018e 2019f 2020f 2021f 2022f 2023f
GDP growth, constant prices (%) 6.6 6.3 6.1 6.0 5.8 5.6
Source: IMF Key Trends
Economic growth is expected to continue at a good pace, albeit with some impact from the trade confrontation with the US; August 2019’s Yuan devaluation could slow imports but boost exports and support income growth. Demographic growth has shifted into reverse, impacting the infant formula category in particular, but overall domestic demand is being supported by strong expansion in aggregate spending power and E-commerce reach
In 2018, China produced 30.75 mn mt of raw milk, up 1.2% YoY; the output in Q1 2019 only rose by 2% YoY to 6.25 mn mt:
– The government has relaxed its drive for larger farms to some extent, rather placing greater focus on working with smaller farms to encourage their growth − with a new policy issued in July 2019 to this end − and on plans at a provincial level around the country aimed at supporting growth in milk production and in the scale and sophistication of the main processors
– Local milk supply has been tight, with 2019 prices in USD/mt terms notably higher than in the preceding two years, and rising earlier during the year, with rising feed prices a contributory factor too
WMP production levels are unclear as they are not reported openly, and WMP production is not competitive vs. imports of course, and its level is dictated to a great extent by the raw milk supply situation; however trade sources report that local stocks as of mid-June 2019 are ~100,000 mt; YTD milk powder imports are notably high, whilst the opposite is true for butter/AMF
Demand for US whey permeate in the pig industry has been hit
– Overall demand is being constrained by the impact of the African swine fever crisis, the first confirmed case of which occurred locally in August 2018; ~700 mn hogs were slaughtered in China in 2018, but Rabobank has predicted that this total will fall by 150 – 200 mn in 2019 because of deaths from infection or culling
4
Whey import volumes:
– For the main Chapter 4 whey products, these have been revised using Chinese customs data breaking down imports for 2017 and 2018, with extrapolations back over 2014-2016 (where no such data is available) based on the HS040410 import trends; for whey permeate it has been estimated that some limited additional volumes enter under HS codes outside Chapter 4; as far as possible small exports of milk permeate have been removed from these volumes
– WPC80/WPI volumes are based on an estimated 90/10 split of HS350220 imports plus “stray” volumes identified under HS040410 (extrapolated for 2014-2016 as above)
– Permeate volumes have been badly hit with some SWP substitution and reduced demand due to culls; investment is already going in to replace and expand the larger operators, but demand will take some to time to recover
MPC:
– Import volumes have been revised using Chinese customs data breaking down imports for 2017 and 2018, with extrapolations back over 2014-2016
Milk permeate:
– This is exported from the US under HS040490 but in China the shipments are declared by the importers under HS040410
Regulatory Changes
The main thrust of regulatory changes in the industry since last year has been on enforcement of tighter control around formulations on infant nutritionals, establishing a stricter inspection regime for their manufacturers and on labeling/claims of dairy products in general; the infant nutritional area has been the subject of a national work plan issued in June and focusing on aspirations such as domestic formula taking 60% of the market and local processors improving their sophistication and quality levels
During 2019 there has been a marked focus on establishing regulations and registering acceptable products in the Food for Special Medical Purpose category, most of which are in the specialized infant nutritionals segment (Nestlé is the main local FSMP manufacturer, whilst some pharma companies have entered this segment); this category’s growth should be aided as a result
2019 has seen Guangzhou begin to pioneer regulations supporting breastfeeding at a local level. This could well be the first part of a wider drive for change around the country, acting as a constraint on future demand for infant formula (and related ingredients)
Trade Agreements
A notable impact of the Sino-US trade war has been that tariffs imposed on US whey permeate have assisted substitution by SWP from suppliers such as Belarus, which started to increase its exports to China notably from June 2018 onwards
Higher tariffs on US alfalfa have also helped local feed and therefore milk prices appreciate, in principle enhancing the price competitiveness of imported ingredients
5
New Plant / Capacity Expansions
Growth in processing capacity is far outstripping that in milk supply:
– For example, in H1 2019, numerous domestic dairy processors invested in capacity expansion:
Mengniu invested USD152.4mn (RMB1.05bn) and USD72.6mn (RMB500mn) to enlarge its plants in Jiaozuo (Henan) and Qiqihar (Heilongjiang)
Yili expanded its Daqing (Heilongjiang) and Quzhou (Zhejiang) factories with investments of USD290.3mn (RMB2bn) and USD182.9mn (RMB1.26bn) respectively
Shanxi-based Jinzhogn Yili Dairy Co., Ltd. planned an investment of US$12.7mn (RMB87.15mn) into the technical rectification of its existing fermented dairy production lines and the building of 2 UHT dairy production lines. If this commissions at the end of this year as scheduled, the company’s capacity will expand to 310,000 mt/yr from 210,000 mt/yr
Saishang Nestle Hulun Buir Ltd. spent US$17.4mn (RMB120mn) on a UHT whipping cream & milk plant to start up in late 2019, as well as a cheese plant to enter pilot production in 2020
Guangzhou Fengxing Milk Co., Ltd. started construction of a 300,000 mt/yr dairy factory at the cost of USD145.1mn (RMB1bn)
Wissun International Nutrition Group Co., Ltd. announced a US$59.5mn (RMB410mn) investment in its liquid dairy project with 2 phases adding 5 and 15 production lines and new milk processing capacity of 300 mt/d and 5,000 mt/d in the 2 phases respectively
Such growth is being supported by province-level subsidies designed to expand and upgrade processors’ capabilities in producing dairy products and nutritional formula
6
1.3 Hong Kong
Data Sources
Production data: N/A
Trade data: Estimates based on GTIS/ITC
Context/Rationale for Forecast
The 7.4mn population is wealthy on an overall per capita basis; however, in 2018, Hong Kong’s economy was weak (+3%, vs average 5.2% over 1974 – 2018), and market uncertainties around the US-China trade disputes persist alongside weak stock markets
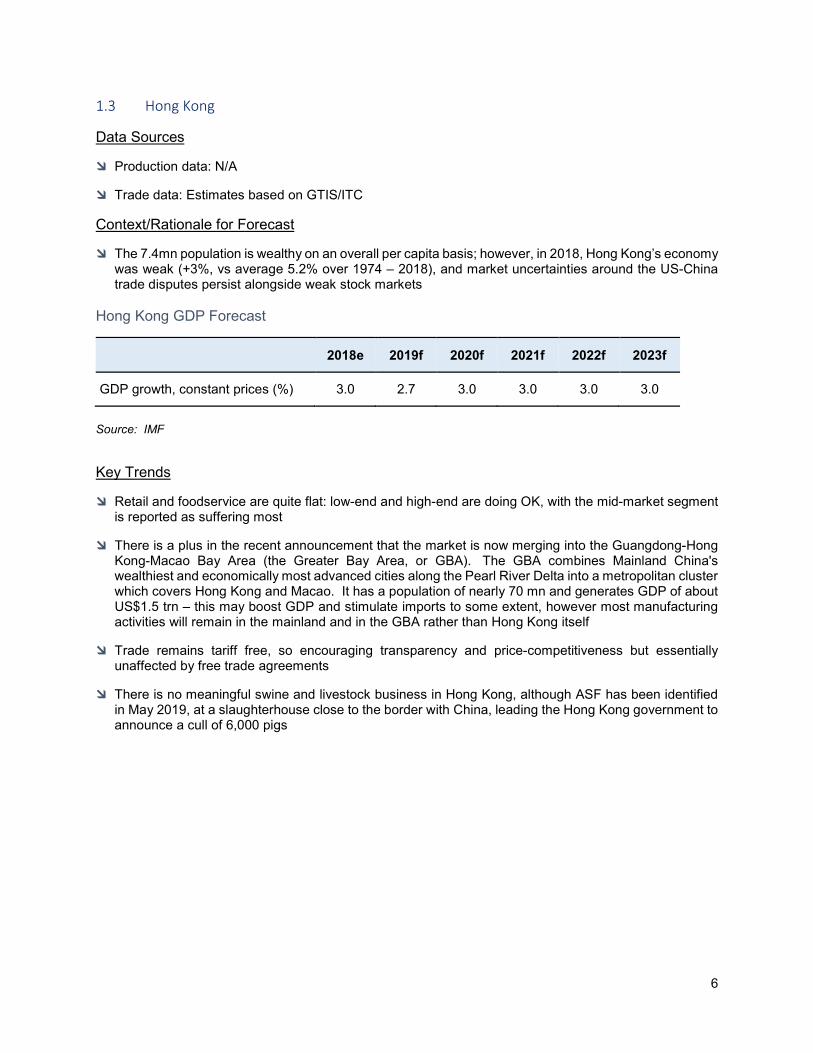
Hong Kong GDP Forecast
2018e 2019f 2020f 2021f 2022f 2023f
GDP growth, constant prices (%) 3.0 2.7 3.0 3.0 3.0 3.0
Source: IMF Key Trends
Retail and foodservice are quite flat: low-end and high-end are doing OK, with the mid-market segment is reported as suffering most
There is a plus in the recent announcement that the market is now merging into the Guangdong-Hong Kong-Macao Bay Area (the Greater Bay Area, or GBA). The GBA combines Mainland China's wealthiest and economically most advanced cities along the Pearl River Delta into a metropolitan cluster which covers Hong Kong and Macao. It has a population of nearly 70 mn and generates GDP of about US$1.5 trn – this may boost GDP and stimulate imports to some extent, however most manufacturing activities will remain in the mainland and in the GBA rather than Hong Kong itself
Trade remains tariff free, so encouraging transparency and price-competitiveness but essentially unaffected by free trade agreements
There is no meaningful swine and livestock business in Hong Kong, although ASF has been identified in May 2019, at a slaughterhouse close to the border with China, leading the Hong Kong government to announce a cull of 6,000 pigs
7
1.4 India
Data Sources
Production data: estimates based on trade sources and sporadic official data when released
Trade data: Estimates based on GTIS/ITC, Import Genius (customs data / bill of lading analysis on whey category)
Context/Rationale for Forecast
The still mainly rural 1.37 bn population (17.7% of the world total) is growing rapidly; the local economy continues to grow very rapidly
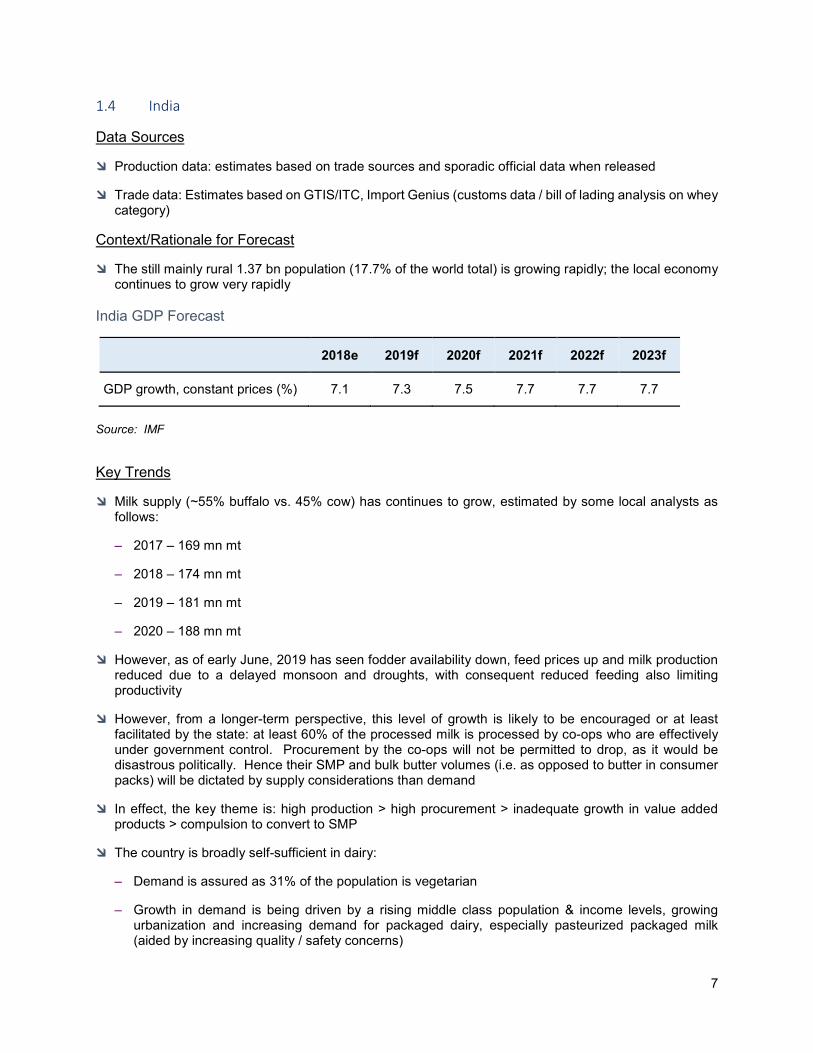
India GDP Forecast
2018e 2019f 2020f 2021f 2022f 2023f
GDP growth, constant prices (%) 7.1 7.3 7.5 7.7 7.7 7.7
Source: IMF Key Trends
Milk supply (~55% buffalo vs. 45% cow) has continues to grow, estimated by some local analysts as follows:
– 2017 – 169 mn mt
– 2018 – 174 mn mt
– 2019 – 181 mn mt
– 2020 – 188 mn mt
However, as of early June, 2019 has seen fodder availability down, feed prices up and milk production reduced due to a delayed monsoon and droughts, with consequent reduced feeding also limiting productivity
However, from a longer-term perspective, this level of growth is likely to be encouraged or at least facilitated by the state: at least 60% of the processed milk is processed by co-ops who are effectively under government control. Procurement by the co-ops will not be permitted to drop, as it would be disastrous politically. Hence their SMP and bulk butter volumes (i.e. as opposed to butter in consumer packs) will be dictated by supply considerations than demand
In effect, the key theme is: high production > high procurement > inadequate growth in value added products > compulsion to convert to SMP
The country is broadly self-sufficient in dairy:
– Demand is assured as 31% of the population is vegetarian
– Growth in demand is being driven by a rising middle class population & income levels, growing urbanization and increasing demand for packaged dairy, especially pasteurized packaged milk (aided by increasing quality / safety concerns)
8
However per capita consumption of milk is still only 97 L/yr, and product mix is a challenge:
– 64% of the industry = liquid milk, milk powders, beverage whiteners (estimated annual growth for category – 15%)
– 33% = Traditional Value Added Products (curd (like plain yogurt), paneer, ghee, butter, ice cream, butter milk (estimated annual growth for category – 16%)
– 1% = New Value Added Products (cheese, UHT Milk, flavored milk, yogurt, whey powders) (estimated annual growth for category – 25%)
SMP / butter / ghee (AMF):
– Production of these products has been growing rapidly due to sheer milk availability and the lack of other options, causing last year’s strong export growth
– In 2018 SMP stocks reached ~200,000 mt, leading the central government to introduce a subsidy of 10% on export prices, and exports grew substantially in Q4 2018, especially to Bangladesh and Malaysia; this continued in Q1 2019
– However, this level of SMP exports will not continue
The domestic market’s demand has been supported by the lower prices caused by the surplus last year and by moves by several States to use SMP for their mid-day meal (MDM) schemes
SMP now sells for US$4,000 at home vs US$2,500 internationally (subsidies for exports ended about March/April)
Even price aside, India should not be competitive internationally as many exporters are not plugged into the MNC supply chains. There is always inconsistency in the availability and quality of milk and therefore the end product: Local SMP sometimes has higher thermophilic plate count, making it unsuitable for making UHT milk (and only viable in processes where high heat is not involved)
– Exports of white butter are expected to stay relative strong by contrast, reflecting domestic prices of US$4,000 vs US$5,000 internationally; likewise exports of ghee (=AMF) in consumer packs
Whey imports – whey powder has been substituted by SMP in some local formulations, however whey imports are likely to continue for the long term, despite some local production which will show an altered profile as part of the industry gravitate gradually towards higher added value variants:
– Both the sports and health nutrition markets are growing rapidly, with sales of imported brands (notably Glanbia’s ON, BSN and Isopure) increasing exponentially: the main local brandowner is MuscleBlaze, producing locally from mainly imported suppliers
– Mainly WPC80 is being imported under 350220 and (in limited quantities) 350290
– Although production of cheese and paneer are growing, local production of whey and whey derivatives is constrained
Liquid milk growth remains high (~20%/yr) and fresh milk is quite profitable when compared to many products, reducing incentive to develop market for new products, especially in light of the high investment required for whey processing and the negligible market for western type cheeses
Paneer is a big market but 97% in unorganized sector, whilst even the 3% organized sector volumes are shared across many players = whey availability issues, plus questions on suitability of whey from paneer for further processing into derivatives
9
– Parag Milk Foods is main local manufacturer seeking to take advantage of these categories’ expansion; its sales are ~22% based on cheese/whey (no-other major player exceeds 2%), no. 2 in cheese after Amul; brand focused, low ROCE due to high capex − has set out to dominate the local whey market via the most integrated & largest whey processing facility in the country at Manchar, Maharashtra state
It is focusing on increasing added value products’ share of its portfolio, and has made a series of launches based on whey:
(1) 2014 – whey ingredients for local B2B sale
(2) 2017 – Avvatar Advanced Mass Gainer (a sports nutrition product “truly made in India” containing WPC and WPI)
(3) 2018 – supplement Go Protein Power (a health nutrition product aimed at the adult mass market)
Parag’s whey business is expected to grow strongly from a low base due to its partnerships with Amazon India (35‐40% of whey supplement sales are via e‐commerce) and gym chains
Lactose volumes reflect a major change in the approach of Lactose India, which has set up a plant dedicated for Kerry with annual volume of 10,000 mt of lactose using crude lactose (imported) as raw material: this has removed the constraint caused by limited whey availability and is likely a factor behind the rising lactose imports in 2017 and 2018; demand for lactose for standardization remains key of course as SMP production grows
Casein exports – these are practically all rennet casein made from buffalo milk to the US; exports volumes are not expected to grow as their pricing would be uncompetitive given the SMP price level
A notable development is Fonterra’s moves towards producing consumer dairy products
10
1.5 Indonesia
Data Sources
Production data: Trade sources
Trade data: Estimates based on GTIS/ITC and trade sources
Context/Rationale for Forecast
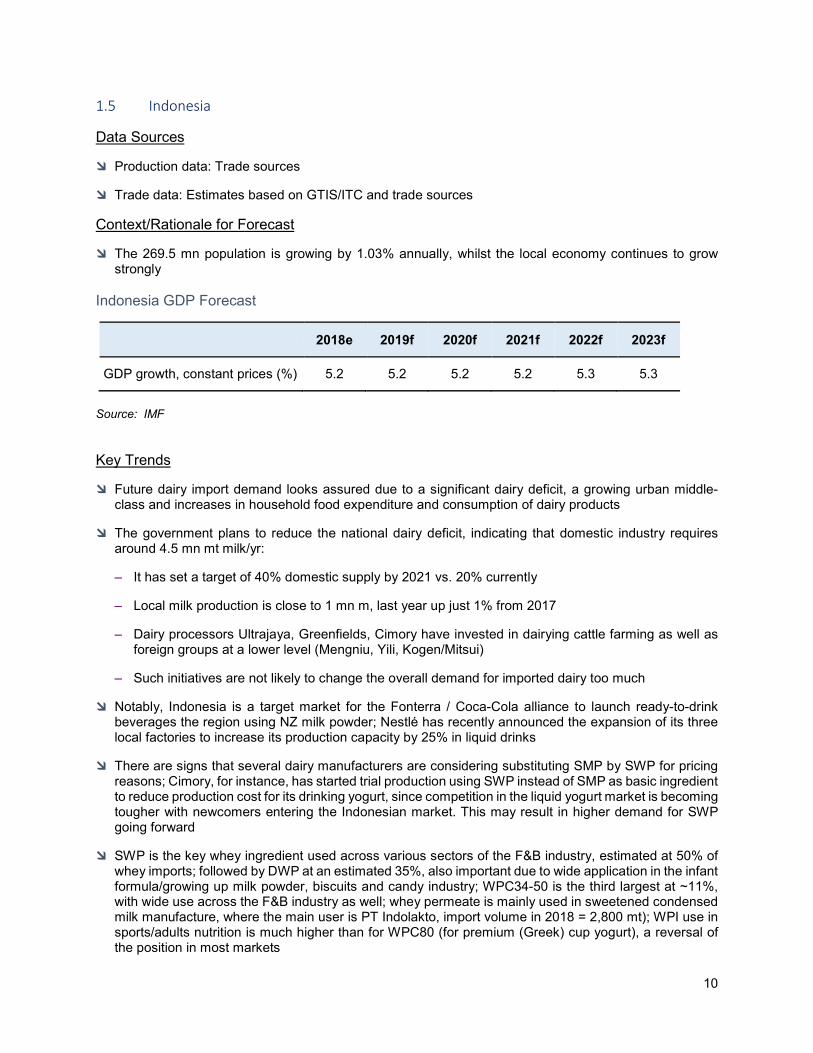
The 269.5 mn population is growing by 1.03% annually, whilst the local economy continues to grow strongly
Indonesia GDP Forecast
2018e 2019f 2020f 2021f 2022f 2023f
GDP growth, constant prices (%) 5.2 5.2 5.2 5.2 5.3 5.3
Source: IMF Key Trends
Future dairy import demand looks assured due to a significant dairy deficit, a growing urban middle-class and increases in household food expenditure and consumption of dairy products
The government plans to reduce the national dairy deficit, indicating that domestic industry requires around 4.5 mn mt milk/yr:
– It has set a target of 40% domestic supply by 2021 vs. 20% currently
– Local milk production is close to 1 mn m, last year up just 1% from 2017
– Dairy processors Ultrajaya, Greenfields, Cimory have invested in dairying cattle farming as well as foreign groups at a lower level (Mengniu, Yili, Kogen/Mitsui)
– Such initiatives are not likely to change the overall demand for imported dairy too much
Notably, Indonesia is a target market for the Fonterra / Coca-Cola alliance to launch ready-to-drink beverages the region using NZ milk powder; Nestlé has recently announced the expansion of its three local factories to increase its production capacity by 25% in liquid drinks
There are signs that several dairy manufacturers are considering substituting SMP by SWP for pricing reasons; Cimory, for instance, has started trial production using SWP instead of SMP as basic ingredient to reduce production cost for its drinking yogurt, since competition in the liquid yogurt market is becoming tougher with newcomers entering the Indonesian market. This may result in higher demand for SWP going forward
SWP is the key whey ingredient used across various sectors of the F&B industry, estimated at 50% of whey imports; followed by DWP at an estimated 35%, also important due to wide application in the infant formula/growing up milk powder, biscuits and candy industry; WPC34-50 is the third largest at ~11%, with wide use across the F&B industry as well; whey permeate is mainly used in sweetened condensed milk manufacture, where the main user is PT Indolakto, import volume in 2018 = 2,800 mt); WPI use in sports/adults nutrition is much higher than for WPC80 (for premium (Greek) cup yogurt), a reversal of the position in most markets
11
MPC34-50 and milk permeate, are used mainly in milk powder, notably by Kalbe for its senior/adult nutrition range. One of Cimory’s subsidiaries is also adding MPC34-50 in its soymilk. MPC85 is used by premium cup yogurt producers (Yummy Food Utama, Nutrifood)
Small volumes of micellar casein have been used in trial production of non-dairy creamer, exploring the potential to substitute caseinate used by the manufacturers. For example, Santos has been testing out MC as a potential replacer of DuPont’s sodium caseinate, used as an emulsifier in its creamer – although the test result proved negative, changing the taste of the final product. However the other main local creamer manufacturer, Lautan Natural Krimerindo, has no plans to substitute casein
Trade Agreements
The duty-free access provided from 2019 under the terms of AANZFTA (ASEAN Australia New Zealand Free Trade Area) – this is especially relevant for SMP/NFDM (the March 2019 Indonesia-Australia Comprehensive Economic Partnership Agreement (IA-CEPA) is less relevant in terms of the ingredients covered in this database)
Indonesia’s trade minister has recently threatened to impose higher tariffs on EU dairy imports in response to the EU’s proposed move to hit biodiesel made from palm oil with anti-subsidy duties
12
1.6 Japan
Data Sources
Production data: Ministry of Agriculture, Forestry and Fisheries (MAFF), Japan Dairy Council
Trade data: Estimates based on GTIS/ITC and trade sources Context/Rationale for Forecast
The 126.9 mn population is shrinking; it has high spending power
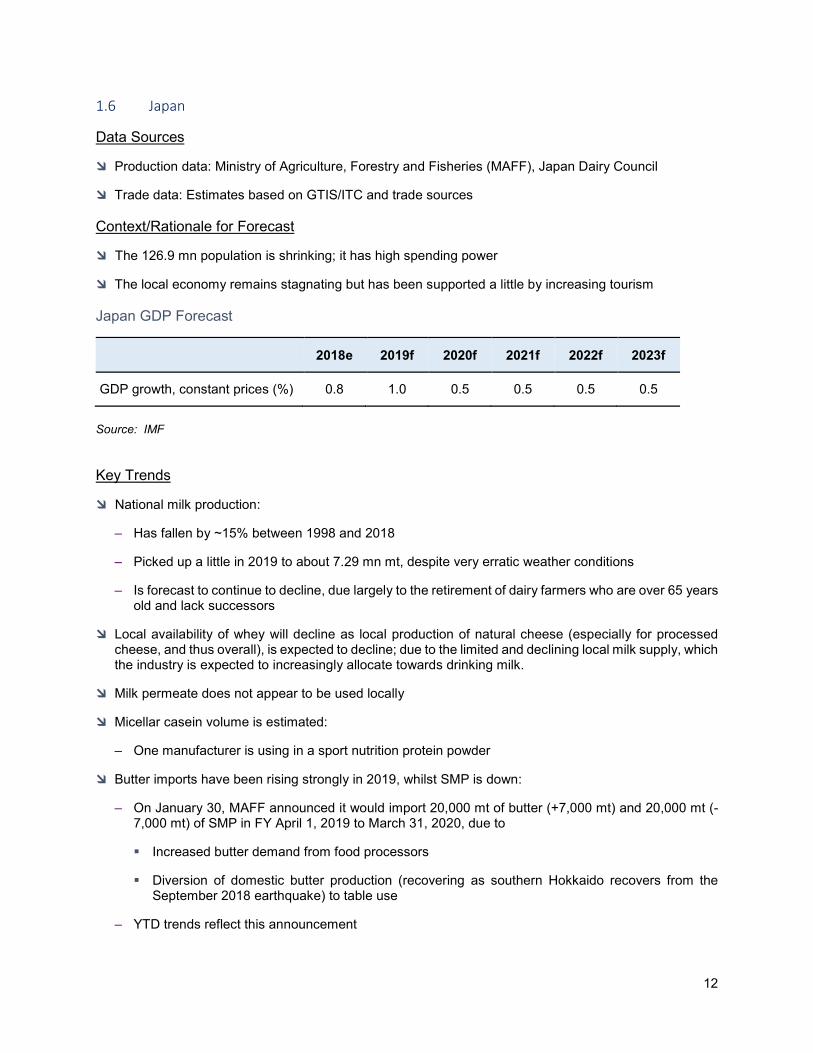
The local economy remains stagnating but has been supported a little by increasing tourism Japan GDP Forecast
2018e 2019f 2020f 2021f 2022f 2023f
GDP growth, constant prices (%) 0.8 1.0 0.5 0.5 0.5 0.5
Source: IMF Key Trends
National milk production:
– Has fallen by ~15% between 1998 and 2018
– Picked up a little in 2019 to about 7.29 mn mt, despite very erratic weather conditions
– Is forecast to continue to decline, due largely to the retirement of dairy farmers who are over 65 years old and lack successors
Local availability of whey will decline as local production of natural cheese (especially for processed cheese, and thus overall), is expected to decline; due to the limited and declining local milk supply, which the industry is expected to increasingly allocate towards drinking milk.
Milk permeate does not appear to be used locally
Micellar casein volume is estimated:
– One manufacturer is using in a sport nutrition protein powder
Butter imports have been rising strongly in 2019, whilst SMP is down:
– On January 30, MAFF announced it would import 20,000 mt of butter (+7,000 mt) and 20,000 mt (-7,000 mt) of SMP in FY April 1, 2019 to March 31, 2020, due to
Increased butter demand from food processors
Diversion of domestic butter production (recovering as southern Hokkaido recovers from the September 2018 earthquake) to table use
– YTD trends reflect this announcement
13
Regulatory Changes
Plans to increase the consumption tax on goods and services to 10% in October 2019 from the current levels of 8% will dampen demand at least in the short term
Trade Agreements
CPTPP and JEEPA:
– Will mean lower cost dairy ingredient imports from the US’s key dairy competitors
– This should support demand to some extent by significantly reducing tariffs on a number of products over various periods of time
– This excludes the US unless a bilateral agreement is reached
SMP:
– Local production predominates but has been declining
– Import demand is not expected to be affected by CPTPP and JEEPA, as most imports will remain under the control of the state trading system. Demand has been weak, moreover, meaning higher stocks at the end of 2018 and so constraining what had initially been expected to be higher state imports in 2018
– Demand may be affected by some substitution by increased imports of WPC35 due to lower tariffs under the CPTPP and JEEPA
Imports of Chapter 4 whey are expected to increase under CPTPP and JEEPA:
– Make the out-of-quota imports feasible by lowering the tariff (critical, as in-quota supply has been erratic), enabling use in the food industry which has remained relatively limited
These agreements provide additional TRQs for whey mineral concentrate, whey for infant formula and permeate, and phase out the high tariffs over coming years (these have stood at 29.8% + a specific tariff of JPY 99 to 687 per kg)
– There will be new demand for WPC60 and WPC70 instead of WPC80 as the import duty for whey with protein content ≥45% but <80% will be reduced to zero in the 6th year
– Note: there is no change in respect of feed whey and ALIC tender whey quantities, and some of the minor whey import classifications; imports of whey for infant formula are expected to decline
– Whey permeate is essentially not used apart from a few trials by bakery/snack manufacturers; demineralized whey powder is barely present in the market either
In terms of Chapter 35 whey
– WPC80 will benefit only marginally if at all from elimination of the 2.9% tariff from signatory countries (CPTPP and JEEPA): however, the demand for WPI may benefit more, given the price differential; moreover, demand for both ingredients in end products has been increasing strongly due to rising purchases of high protein foods/beverages (aided by the ageing population) and should be boosted by growing interest in healthy foods and low-carb meals, with take-up of sports nutritionals and other healthy foods also set to be encouraged by the Tokyo Olympic Games in 2020
For lactose, demand in the key end applications looks flat
14
– Due to the recent trend of low carb products, consumption of sweetened dairy drinks is declining. The soup broth market is expanding, but dextrin is a cheaper ingredient in terms of sweeteners
– CPTPP and JEEPA eliminate the 8.5% tariff; whilst this seems unlikely to create growth in imports it may sustain demand
New Plant / Capacity Expansions
Declining population and milk supply effectively rule this out for dairy ingredients themselves
However whilst infant formula production by the major local manufacturers is under pressure with the declining population, making exports more important where viable (the new Asahi-NutiFood JV to target the Vietnamese infant nutrition market is interesting in this context)
15
1.7 Malaysia
Data Sources
Production data: Trade sources
Trade data: Estimates based on GTIS/ITC and trade sources
Context/Rationale for Forecast
The 32.5 mn population is growing more slowly, however the local economy continues to grow strongly
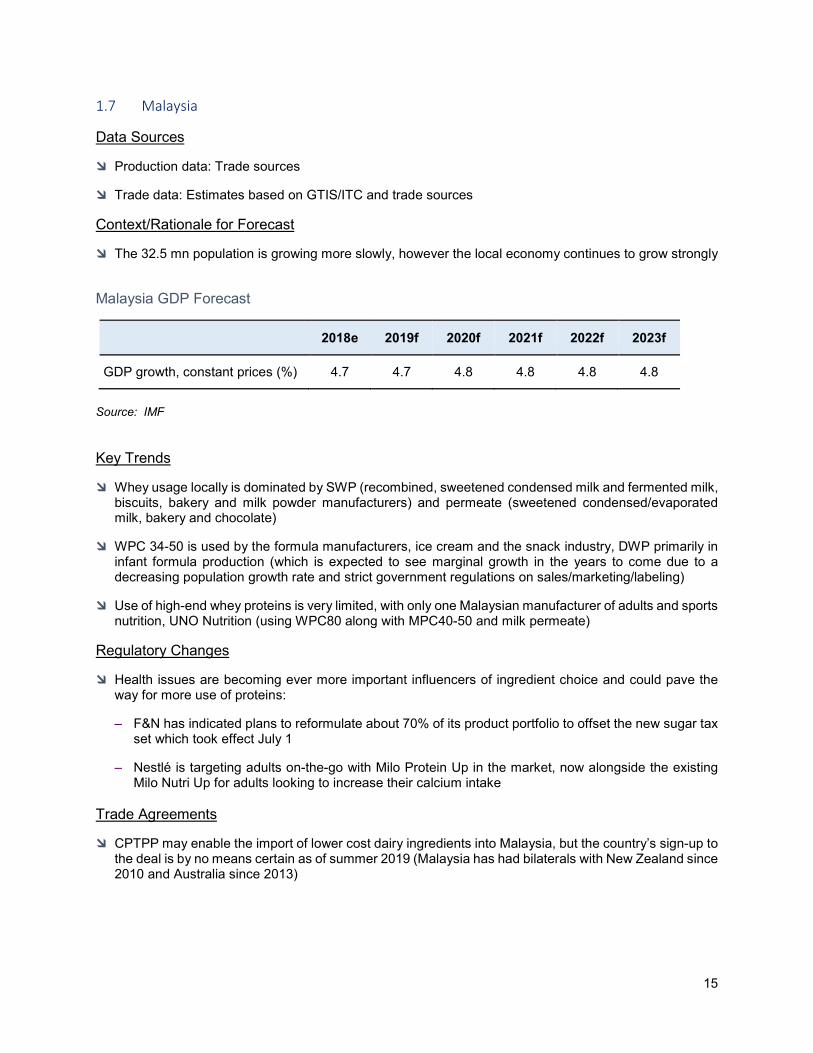
Malaysia GDP Forecast
2018e 2019f 2020f 2021f 2022f 2023f
GDP growth, constant prices (%) 4.7 4.7 4.8 4.8 4.8 4.8
Source: IMF Key Trends
Whey usage locally is dominated by SWP (recombined, sweetened condensed milk and fermented milk, biscuits, bakery and milk powder manufacturers) and permeate (sweetened condensed/evaporated milk, bakery and chocolate)
WPC 34-50 is used by the formula manufacturers, ice cream and the snack industry, DWP primarily in infant formula production (which is expected to see marginal growth in the years to come due to a decreasing population growth rate and strict government regulations on sales/marketing/labeling)
Use of high-end whey proteins is very limited, with only one Malaysian manufacturer of adults and sports nutrition, UNO Nutrition (using WPC80 along with MPC40-50 and milk permeate)
Regulatory Changes
Health issues are becoming ever more important influencers of ingredient choice and could pave the way for more use of proteins:
– F&N has indicated plans to reformulate about 70% of its product portfolio to offset the new sugar tax set which took effect July 1
– Nestlé is targeting adults on-the-go with Milo Protein Up in the market, now alongside the existing Milo Nutri Up for adults looking to increase their calcium intake
Trade Agreements
CPTPP may enable the import of lower cost dairy ingredients into Malaysia, but the country’s sign-up to the deal is by no means certain as of summer 2019 (Malaysia has had bilaterals with New Zealand since 2010 and Australia since 2013)
16
1.8 Pakistan
Data Sources
Production data: Pakistan Dairy Association and trade sources
Trade data: Estimates based on ITC, Pakistan Federal Board of Revenue, trade sources
Context/Rationale for Forecast
The 204.6 mn population (annual +1.88%) is still mainly rural, but the local economy continues to grow relatively strongly
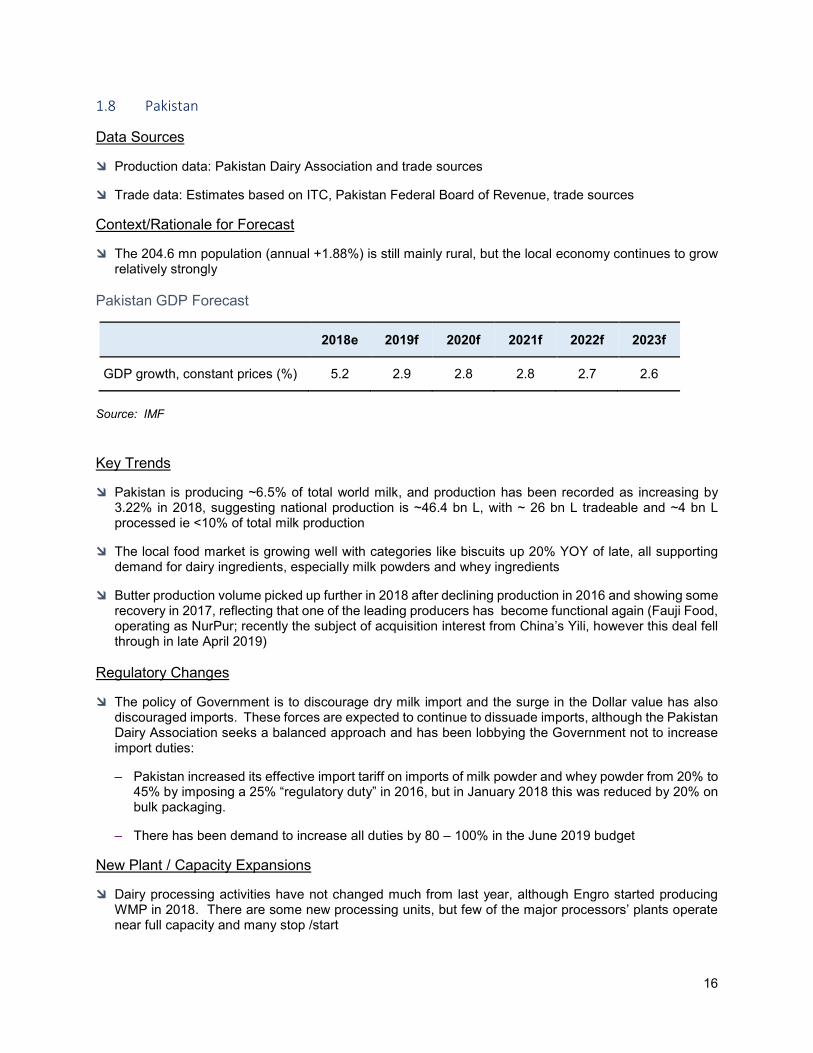
Pakistan GDP Forecast
2018e 2019f 2020f 2021f 2022f 2023f
GDP growth, constant prices (%) 5.2 2.9 2.8 2.8 2.7 2.6
Source: IMF Key Trends
Pakistan is producing ~6.5% of total world milk, and production has been recorded as increasing by 3.22% in 2018, suggesting national production is ~46.4 bn L, with ~ 26 bn L tradeable and ~4 bn L processed ie <10% of total milk production
The local food market is growing well with categories like biscuits up 20% YOY of late, all supporting demand for dairy ingredients, especially milk powders and whey ingredients
Butter production volume picked up further in 2018 after declining production in 2016 and showing some recovery in 2017, reflecting that one of the leading producers has become functional again (Fauji Food, operating as NurPur; recently the subject of acquisition interest from China’s Yili, however this deal fell through in late April 2019)
Regulatory Changes
The policy of Government is to discourage dry milk import and the surge in the Dollar value has also discouraged imports. These forces are expected to continue to dissuade imports, although the Pakistan Dairy Association seeks a balanced approach and has been lobbying the Government not to increase import duties:
– Pakistan increased its effective import tariff on imports of milk powder and whey powder from 20% to 45% by imposing a 25% “regulatory duty” in 2016, but in January 2018 this was reduced by 20% on bulk packaging.
– There has been demand to increase all duties by 80 – 100% in the June 2019 budget
New Plant / Capacity Expansions
Dairy processing activities have not changed much from last year, although Engro started producing WMP in 2018. There are some new processing units, but few of the major processors’ plants operate near full capacity and many stop /start
17
1.9 Philippines
Data Sources
Production data: n/a
Trade data: Estimates based on GTIS/ITC and trade sources
Context/Rationale for Forecast
The 108 mn population is growing rapidly (+1.5%/yr) but is still mainly rural (56%); GDP per capita is low, but the local economy continues to grow very strongly and is supported by overseas workers’ remittances which came to US$31.3 bn in 2017
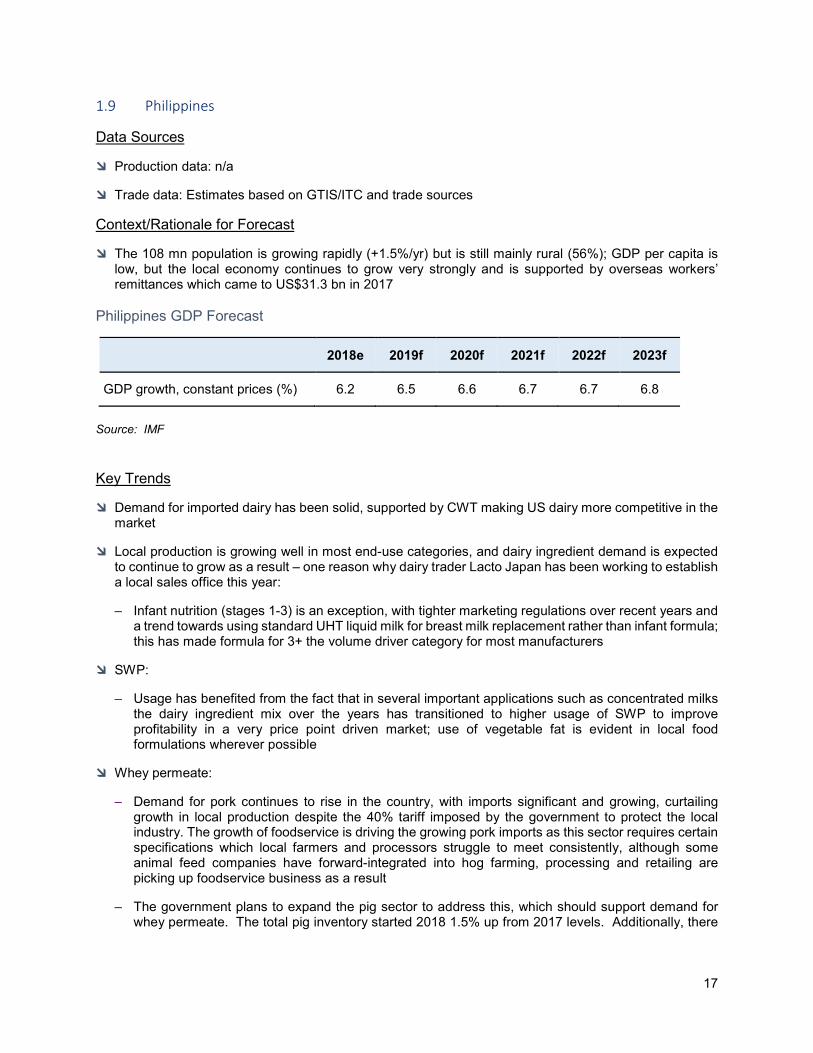
Philippines GDP Forecast
2018e 2019f 2020f 2021f 2022f 2023f
GDP growth, constant prices (%) 6.2 6.5 6.6 6.7 6.7 6.8
Source: IMF Key Trends
Demand for imported dairy has been solid, supported by CWT making US dairy more competitive in the market
Local production is growing well in most end-use categories, and dairy ingredient demand is expected to continue to grow as a result – one reason why dairy trader Lacto Japan has been working to establish a local sales office this year:
– Infant nutrition (stages 1-3) is an exception, with tighter marketing regulations over recent years and a trend towards using standard UHT liquid milk for breast milk replacement rather than infant formula; this has made formula for 3+ the volume driver category for most manufacturers
SWP:
– Usage has benefited from the fact that in several important applications such as concentrated milks the dairy ingredient mix over the years has transitioned to higher usage of SWP to improve profitability in a very price point driven market; use of vegetable fat is evident in local food formulations wherever possible
Whey permeate:
– Demand for pork continues to rise in the country, with imports significant and growing, curtailing growth in local production despite the 40% tariff imposed by the government to protect the local industry. The growth of foodservice is driving the growing pork imports as this sector requires certain specifications which local farmers and processors struggle to meet consistently, although some animal feed companies have forward-integrated into hog farming, processing and retailing are picking up foodservice business as a result
– The government plans to expand the pig sector to address this, which should support demand for whey permeate. The total pig inventory started 2018 1.5% up from 2017 levels. Additionally, there
18
was a swing towards commercial enterprises, in which the pig number increased by nearly 5%. Increased domestic production is expected this year, with USDA forecasting growth of ~2%
– By end of July, no ASF had been detected in the local pig industry
– Lactose usage in the sector is higher than for permeate. However there are positive prospects of use in edible applications; for instance in sliced white bread the market leader, Gardenia Bakery, has a price fighter positioned loaf bread (Neu Bake Gardenia) that uses whey permeate which has gained increasing market share driven by the good pricing and very wide distribution. Whey permeate is expected to be used by more and more loaf bread manufacturers
WPC80/WPI:
– Previous import data under HS350220 is believed to have been different product(s) misclassified; however, WPC80 is seeing rapid growth from a very low base as sports nutrition emerges as a segment, although WPI use appears negligible/zero
– Relevant manufacturers driving this new segment are Ethical Pharma, Wheyl Nutrition, Athlene Nutrition and Greenplus Corporation (more of a toll manufacturer but also makes its own weight/muscle building drinks)
Regulatory Changes
The government has recently sacked the head of the Philippine Bureau of Food and Drug – this may have some impact on the import inspection regime going forward but it is too early to determine what this could be
19
1.10 Singapore
Data Sources
Production data: N/A
Trade data: Estimates based on GTIS/ITC and trade sources
Context/Rationale for Forecast
The 5.6 mn population has high spending power but the local economy continues to grow relatively slowly
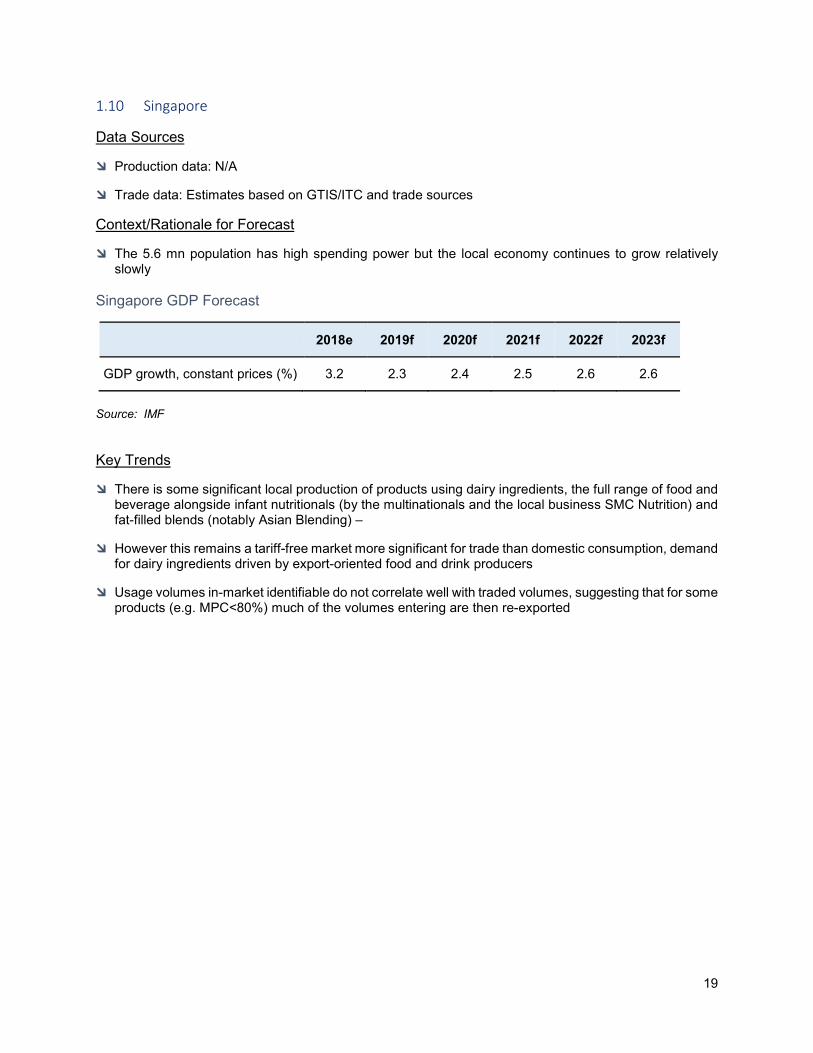
Singapore GDP Forecast
2018e 2019f 2020f 2021f 2022f 2023f
GDP growth, constant prices (%) 3.2 2.3 2.4 2.5 2.6 2.6
Source: IMF Key Trends
There is some significant local production of products using dairy ingredients, the full range of food and beverage alongside infant nutritionals (by the multinationals and the local business SMC Nutrition) and fat-filled blends (notably Asian Blending) –
However this remains a tariff-free market more significant for trade than domestic consumption, demand for dairy ingredients driven by export-oriented food and drink producers
Usage volumes in-market identifiable do not correlate well with traded volumes, suggesting that for some products (e.g. MPC<80%) much of the volumes entering are then re-exported
20
1.11 South Korea
Data Sources
Production data: Korea statistics office
Trade data: Estimates based on GTIS/ITC and trade sources
Context/Rationale for Forecast
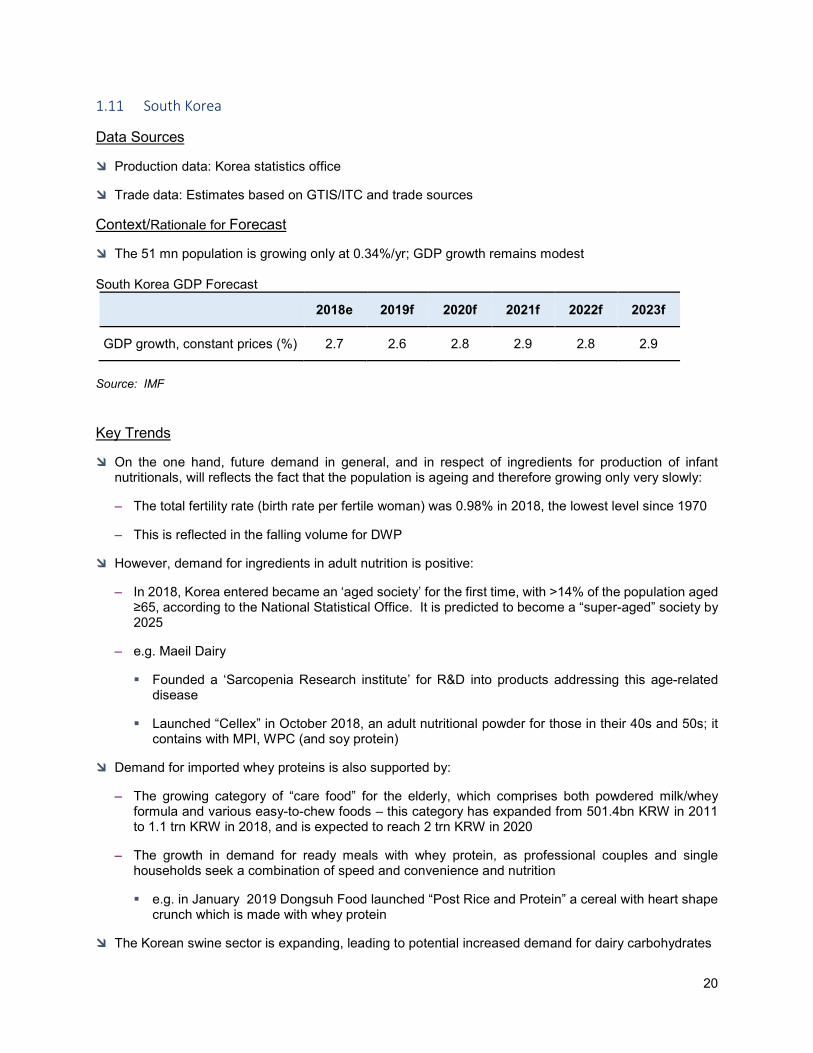
The 51 mn population is growing only at 0.34%/yr; GDP growth remains modest South Korea GDP Forecast
2018e 2019f 2020f 2021f 2022f 2023f
GDP growth, constant prices (%) 2.7 2.6 2.8 2.9 2.8 2.9
Source: IMF Key Trends
On the one hand, future demand in general, and in respect of ingredients for production of infant nutritionals, will reflects the fact that the population is ageing and therefore growing only very slowly:
– The total fertility rate (birth rate per fertile woman) was 0.98% in 2018, the lowest level since 1970
– This is reflected in the falling volume for DWP
However, demand for ingredients in adult nutrition is positive:
– In 2018, Korea entered became an ‘aged society’ for the first time, with >14% of the population aged ≥65, according to the National Statistical Office. It is predicted to become a “super-aged” society by 2025
– e.g. Maeil Dairy
Founded a ‘Sarcopenia Research institute’ for R&D into products addressing this age-related disease
Launched “Cellex” in October 2018, an adult nutritional powder for those in their 40s and 50s; it contains with MPI, WPC (and soy protein)
Demand for imported whey proteins is also supported by:
– The growing category of “care food” for the elderly, which comprises both powdered milk/whey formula and various easy-to-chew foods – this category has expanded from 501.4bn KRW in 2011 to 1.1 trn KRW in 2018, and is expected to reach 2 trn KRW in 2020
– The growth in demand for ready meals with whey protein, as professional couples and single households seek a combination of speed and convenience and nutrition
e.g. in January 2019 Dongsuh Food launched “Post Rice and Protein” a cereal with heart shape crunch which is made with whey protein
The Korean swine sector is expanding, leading to potential increased demand for dairy carbohydrates
21
New Plant / Capacity Expansions
Local production of SMP/butter and WMP is expected to remain flat/decreasing:
– It is carried out mainly to store local raw milk (still 70% of raw milk production is marketed as fluid milk, and fluid milk consumption has been decreasing – whereas demand for other dairy products (such as cheese) has been increasing)
– By end 2018 SMP stocks were about 11,000 mt, the lowest monthly inventory in the last 5 years
– Import demand should remain robust, despite Seoul Milk’s current construction of a new 1.69 mn L/day plant in Yangju, Gyeonggi Province: this is due to commission in April 2021 and its output will include some SMP+WMP+butter
22
1.12 Taiwan
Data Sources
Production data: n/a
Trade data: Estimates based on GTIS/ITC and trade sources
Context/Rationale for Forecast
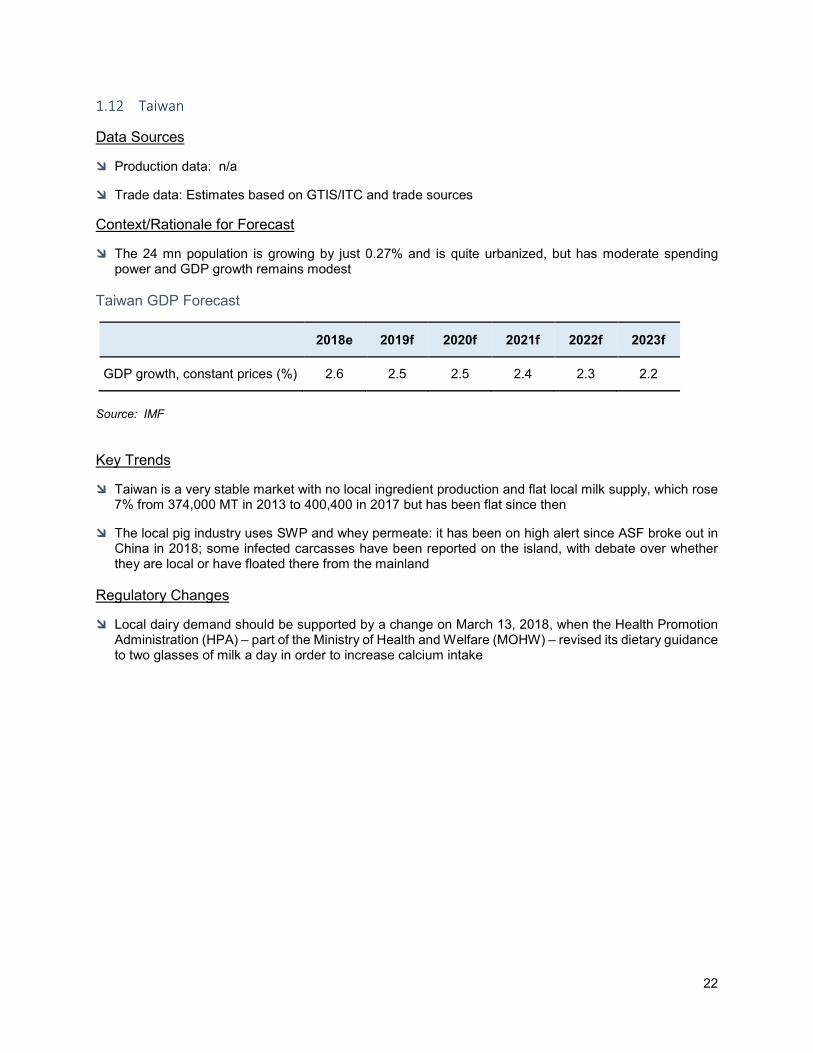
The 24 mn population is growing by just 0.27% and is quite urbanized, but has moderate spending power and GDP growth remains modest
Taiwan GDP Forecast
2018e 2019f 2020f 2021f 2022f 2023f
GDP growth, constant prices (%) 2.6 2.5 2.5 2.4 2.3 2.2
Source: IMF Key Trends
Taiwan is a very stable market with no local ingredient production and flat local milk supply, which rose 7% from 374,000 MT in 2013 to 400,400 in 2017 but has been flat since then
The local pig industry uses SWP and whey permeate: it has been on high alert since ASF broke out in China in 2018; some infected carcasses have been reported on the island, with debate over whether they are local or have floated there from the mainland
Regulatory Changes
Local dairy demand should be supported by a change on March 13, 2018, when the Health Promotion Administration (HPA) – part of the Ministry of Health and Welfare (MOHW) – revised its dietary guidance to two glasses of milk a day in order to increase calcium intake
23
1.13 Thailand
Data Sources
Production data: trade sources
Trade data: Estimates based on GTIS/ITC and trade sources
Context/Rationale for Forecast
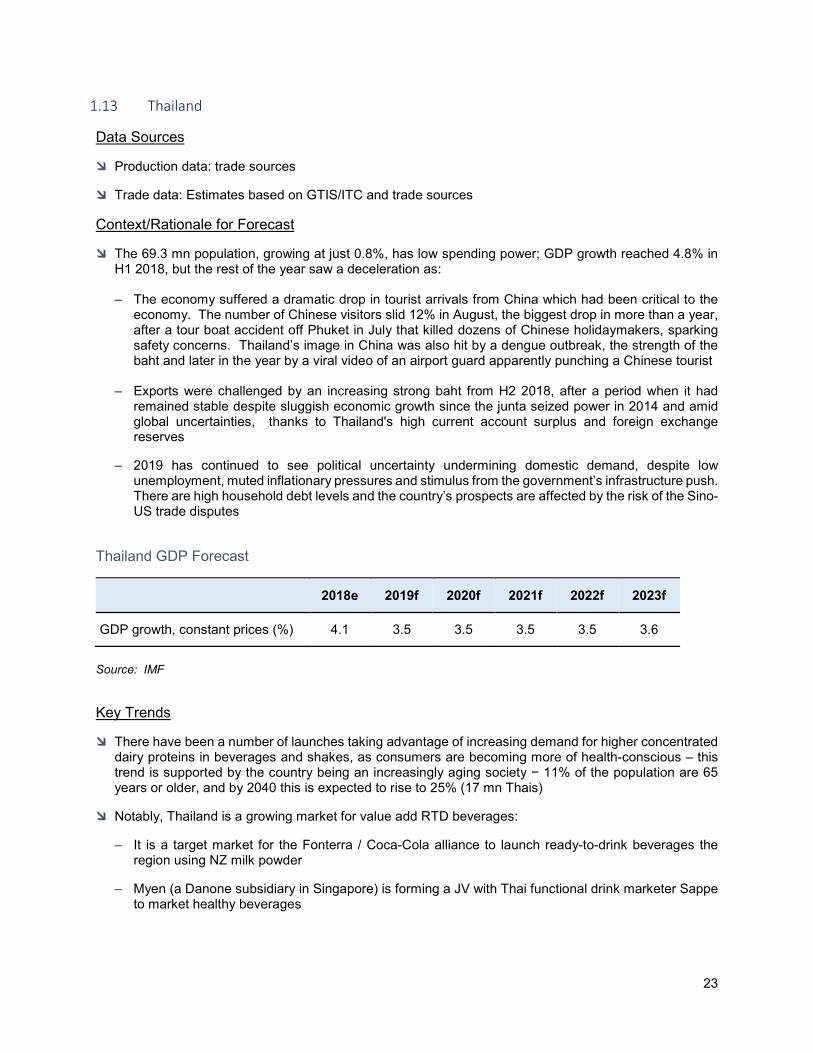
The 69.3 mn population, growing at just 0.8%, has low spending power; GDP growth reached 4.8% in H1 2018, but the rest of the year saw a deceleration as:
– The economy suffered a dramatic drop in tourist arrivals from China which had been critical to the economy. The number of Chinese visitors slid 12% in August, the biggest drop in more than a year, after a tour boat accident off Phuket in July that killed dozens of Chinese holidaymakers, sparking safety concerns. Thailand’s image in China was also hit by a dengue outbreak, the strength of the baht and later in the year by a viral video of an airport guard apparently punching a Chinese tourist
– Exports were challenged by an increasing strong baht from H2 2018, after a period when it had remained stable despite sluggish economic growth since the junta seized power in 2014 and amid global uncertainties, thanks to Thailand's high current account surplus and foreign exchange reserves
– 2019 has continued to see political uncertainty undermining domestic demand, despite low unemployment, muted inflationary pressures and stimulus from the government’s infrastructure push. There are high household debt levels and the country’s prospects are affected by the risk of the Sino-US trade disputes
Thailand GDP Forecast
2018e 2019f 2020f 2021f 2022f 2023f
GDP growth, constant prices (%) 4.1 3.5 3.5 3.5 3.5 3.6
Source: IMF Key Trends
There have been a number of launches taking advantage of increasing demand for higher concentrated dairy proteins in beverages and shakes, as consumers are becoming more of health-conscious – this trend is supported by the country being an increasingly aging society − 11% of the population are 65 years or older, and by 2040 this is expected to rise to 25% (17 mn Thais)
Notably, Thailand is a growing market for value add RTD beverages:
– It is a target market for the Fonterra / Coca-Cola alliance to launch ready-to-drink beverages the region using NZ milk powder
– Myen (a Danone subsidiary in Singapore) is forming a JV with Thai functional drink marketer Sappe to market healthy beverages

24
SMP:
– Quota administration for SMP is complicated and has long led some manufacturers to avoid SMP in their formulations. In addition to the standard ‘Quota’, Australia and New Zealand have additional quotas of 10,000+ mt of SMP each, that do not appear in the ‘Quota’ as part of the Thai-Australia FTA and Thai-New Zealand CEP Agreement
Whey:
– WPI – Dutch Mill has begun using alongside MPC60 and MPI, all EU sourced (the three are used in combination in its green tea Matcha milk which has reportedly been very successful); the other identified user is Tacha Interfood producing the Maximus WPI protein shake
– WPC80 – CP Meiji is notable in using from the US, alongside MPC and WPC34; there are also a number of local manufacturers of sports nutritionals using this ingredient
– Thailand produces over 2mn hogs each year, and has so far held back African Swine Fever from entering the country. However, whey permeate use is very low, and has been constrained by the regulations of the local Ministry of Agriculture and Cooperatives (MOA) which require minimum 3% protein, restricting imports of US permeate
25
1.14 Vietnam
Data Sources
Production data: trade sources
Trade data: Estimates based on GTIS/ITC direct and mirror data, plus some customs data / bill of lading analysis (whey category)
Context/Rationale for Forecast
The mainly rural 97.4 mn population, growing by 0.97%, has low spending power, but GDP growth remains very strong
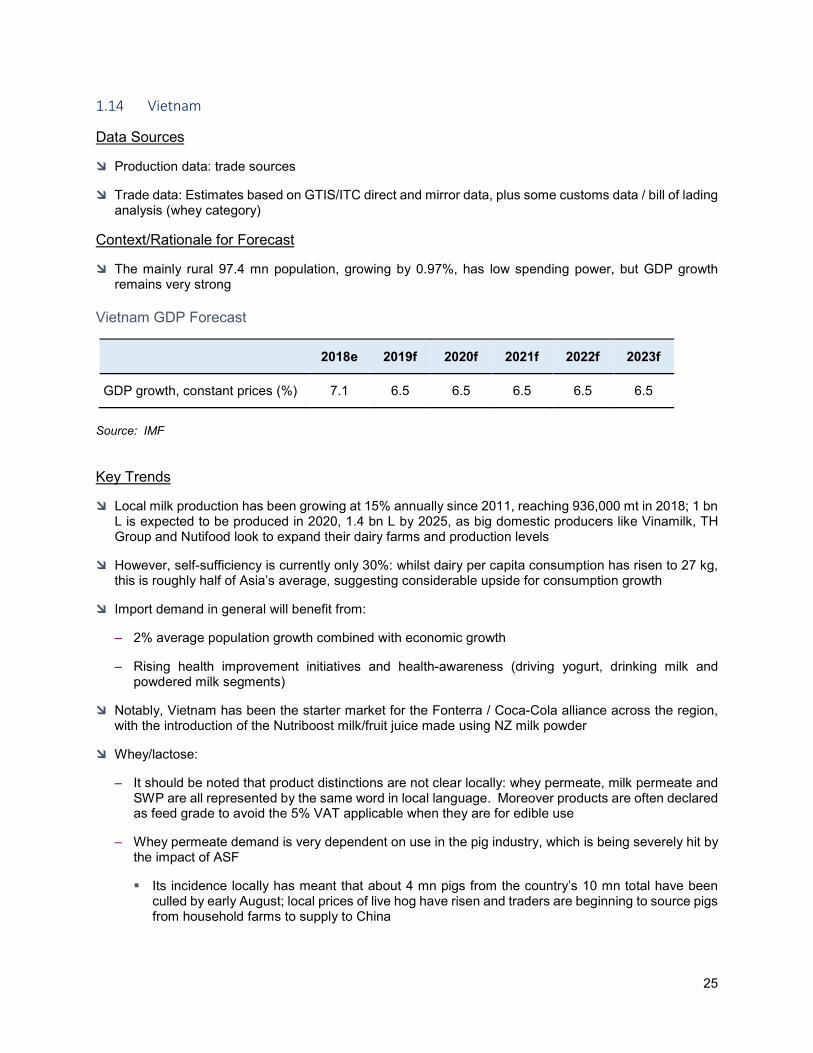
Vietnam GDP Forecast
2018e 2019f 2020f 2021f 2022f 2023f
GDP growth, constant prices (%) 7.1 6.5 6.5 6.5 6.5 6.5
Source: IMF Key Trends
Local milk production has been growing at 15% annually since 2011, reaching 936,000 mt in 2018; 1 bn L is expected to be produced in 2020, 1.4 bn L by 2025, as big domestic producers like Vinamilk, TH Group and Nutifood look to expand their dairy farms and production levels
However, self-sufficiency is currently only 30%: whilst dairy per capita consumption has risen to 27 kg, this is roughly half of Asia’s average, suggesting considerable upside for consumption growth
Import demand in general will benefit from:
– 2% average population growth combined with economic growth
– Rising health improvement initiatives and health-awareness (driving yogurt, drinking milk and powdered milk segments)
Notably, Vietnam has been the starter market for the Fonterra / Coca-Cola alliance across the region, with the introduction of the Nutriboost milk/fruit juice made using NZ milk powder
Whey/lactose:
– It should be noted that product distinctions are not clear locally: whey permeate, milk permeate and SWP are all represented by the same word in local language. Moreover products are often declared as feed grade to avoid the 5% VAT applicable when they are for edible use
– Whey permeate demand is very dependent on use in the pig industry, which is being severely hit by the impact of ASF
Its incidence locally has meant that about 4 mn pigs from the country’s 10 mn total have been culled by early August; local prices of live hog have risen and traders are beginning to source pigs from household farms to supply to China
26
Future exports will also need declarations as ASF-free, as the contamination of water and soil can last for up to 20 years
Consumers will buy imported pork but are also moving to other meats instead of pork
– WPI: Nutifood started using small volumes of instant WPI in late 2018, but the volumes are limited, less than 10 mt per month
– Lactose is used in feed and in edible applications, however price is a challenge, and whey and sometimes permeate are generally preferred in both
Regulatory Changes
Demand for imported SMP, AMF and WMP will also be helped considerably when the local school milk program goes national in scope from September this year:
– This is funded 50% by government, 35% by parents’ payments and 15% by packaging suppliers
– So far it has not covered HCMC and Hanoi
– It comprises mainly recombined or reconstituted milk, with fresh milk preferred for premium sales in the local fluid milk market
Trade Agreements
Lower cost dairy imports via zero import tariff with FTAs will support increased dairy ingredient use:
– From January 14, 2019, Vietnam has been part of the CPTPP, leading to tariff reductions and likely increased dairy imports from New Zealand in particular, and also Canada
– On June 30 the EU-Vietnam trade agreement (EVFTA) was signed, providing a 2nd threat to US dairy exports; EU dairy exports to Vietnam face tariffs of up to 20% currently, but under the new agreement, these will be removed over a 5-year period. In 2018 EU-28 exports to Vietnam included 36,700 mt of SMP, 1,000 mt of WMP and 9,150 mt of whey products under HS040410
27
2. Middle East & Africa
2.1 Algeria
Data Sources
Production data: Estimates based on Algeria Ministry of Agriculture, Office National Interprofressionel du Lait ONIL and trade sources
Trade data: 2018 Algerian trade data did not become available, so for 2018 only, UN ITC TradeMap mirror data was used (ie exports from the rest of the world to Algeria)
– For 2017, direct import data and mirror data was fairly similar (max diversion +/- 10%) – on this basis it seems more reliable to use mirror data for just 2018 rather than revise all the back data to mirror data too, especially given that hopefully Algeria will start to supply direct import data again going forward
Context/Rationale for Forecast
The mainly urban 42 mn population has low spending power, while GDP growth remains uncertain
With lower oil prices since 2014, Algeria’s foreign exchange reserves have declined by more than half and its oil stabilization fund has decreased from about US$20 bn at the end of 2013 to about US$7 billion in 2017, which is the statutory minimum.
Declining oil prices have also reduced the government’s ability to use state-driven growth to distribute rents and fund generous public subsidies, and the government has been under pressure to reduce spending
– Over the past three years, the government has enacted incremental increases in some taxes, resulting in modest increases in prices for gasoline, cigarettes, alcohol, and certain imported goods, but it has refrained from reducing subsidies, particularly for education, healthcare, and housing programs
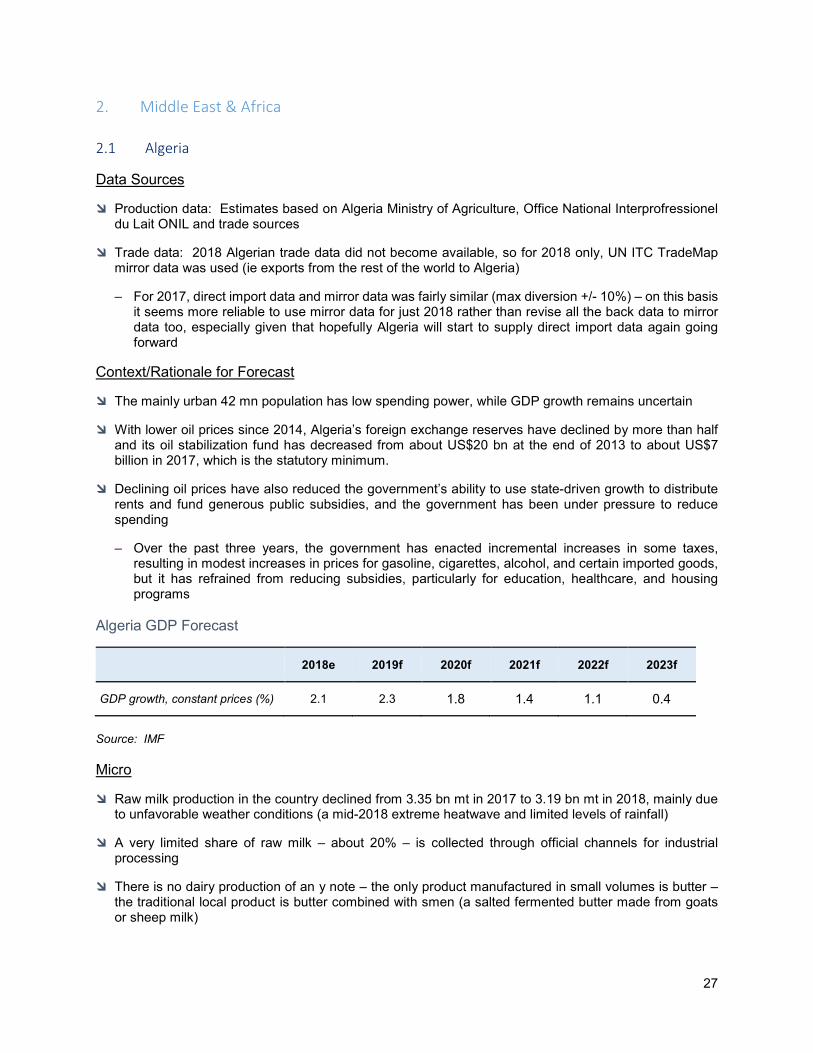
Algeria GDP Forecast
2018e 2019f 2020f 2021f 2022f 2023f
GDP growth, constant prices (%) 2.1 2.3 1.8 1.4 1.1 0.4
Source: IMF Micro
Raw milk production in the country declined from 3.35 bn mt in 2017 to 3.19 bn mt in 2018, mainly due to unfavorable weather conditions (a mid-2018 extreme heatwave and limited levels of rainfall)
A very limited share of raw milk – about 20% – is collected through official channels for industrial processing
There is no dairy production of an y note – the only product manufactured in small volumes is butter – the traditional local product is butter combined with smen (a salted fermented butter made from goats or sheep milk)
28
Algeria’s expanding population continues to drive the demand for cheap imported dairy ingredients, most notably milk powders, for the production of subsidized recombined drinking milk
– Higher value products have seen a decline in imports, especially butter as this product has experienced a strong increase in international prices in 2017-18, therefore import volumes have reduced
This expanding market for drinking milk and consequently demand for imported milk powders is set to continue
– Algerian trade sources do not see the recent / current social unrest driven by a desire for political change impacting negatively on milk powder demand
– Subsidized cheap drinking milk has become an integral part of the Algerian diet and population expansion will continue to drive volumes
Processed cheese is an important product and continues to grow
Industry sources do not cite any investment in capacity expansion or new processing units
29
2.2 Egypt
Production data: interviews with trade sources
Trade data: GTIS and UN ITC TradeMap Context/Rationale for Forecast
The 101 mn population, growing by 1.8% annually, has low spending power, although GDP growth rates are forecast to remain strong
In late 2016, persistent dollar shortages and waning aid from its Gulf allies led Cairo to turn to the IMF for a 3-year, US$12 bn loan program. To secure the deal, Cairo floated its currency, introduced new taxes, and cut energy subsidies – all of which pushed inflation above 30% for most of 2017, a high that had not been seen in a generation
– Given high inflation and a generally struggling economy, prices in restaurants have increased by around 14% compared to last year, affecting purchasing activities for raw materials and ingredients
– A weaker currency has made Egyptian resource more attractive and capital inflows have strengthened, enabling the Central Bank of Egypt to re-build its FOREX reserves
– The weaker Egyptian Pound is also boosting external competitiveness, supporting a rebound in manufacturing activity in both food and non-food sectors – however at the same time, it makes it harder for Egypt to pay for imported goods
The economy is expected to continue to improve with strong investment and improvements to the regulatory environment – major infrastructure projects include the expansion of the Suez Canal, construction of a new administrative capital to the east of Cairo and building the world’s largest coal-fired power plant
Ramping up the tourism sector, a major pillar in Egypt’s economy, is witnessing major developments such as the new airport at Giza and the new Grand Egyptian Museum
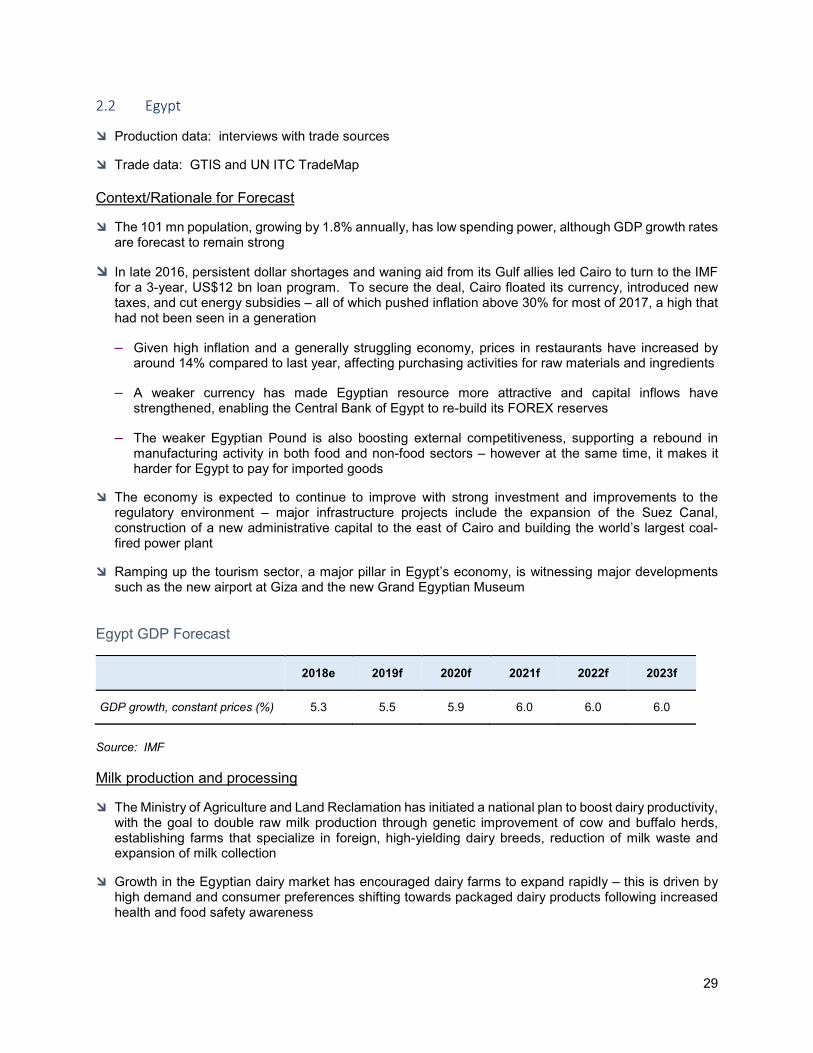
Egypt GDP Forecast
2018e 2019f 2020f 2021f 2022f 2023f
GDP growth, constant prices (%) 5.3 5.5 5.9 6.0 6.0 6.0
Source: IMF Milk production and processing
The Ministry of Agriculture and Land Reclamation has initiated a national plan to boost dairy productivity, with the goal to double raw milk production through genetic improvement of cow and buffalo herds, establishing farms that specialize in foreign, high-yielding dairy breeds, reduction of milk waste and expansion of milk collection
Growth in the Egyptian dairy market has encouraged dairy farms to expand rapidly – this is driven by high demand and consumer preferences shifting towards packaged dairy products following increased health and food safety awareness
30
– The EBRD has provided a US$7 mn loan to support the expansion plan of Obour Land, a leading Egyptian milk and dairy producer – this includes the establishment of a dairy farm with an estimated production of 60 mt of milk / day
– Qalaa Holding, owner of Dina Farms, has announced a further US$24 mn in Egypt’s largest private-sector agricultural facility – the expectation is that Dina Farms will be milking more than 8,500 cows at the end of 2019
Stock levels
Most companies import products that can be used as stock for up to 6 months, with many companies importing every 1-3 months, therefore stock levels are not huge
Consumer / market trends
White cheese remains the most popular product in natural cheeses, with Feta and Domiati leading consumer preference – the growth in this segment will further increase demand for SMP, whey products and MPC
Egypt is currently witnessing an increase in health awareness among consumers, driving demand for yoghurt, fruit-flavored yoghurt and labneh (strained yoghurt) – this will grow demand for ingredients such as SMP and MPC70
– There has been talk about the production of high protein yoghurt, but this has not happened yet
– There is currently also some product development of nutritional bars containing WPI for the growing body building trend
The food sector in general and the dairy sector in particular are continuing to provide growing opportunities for dairy ingredient sales – demand for packaged and convenience foods will continue to increase due to higher levels of disposable incomes among some consumer groups and ongoing food safety scares
Egypt is considered a manufacturing hub for the Middle East and wider African markets
The confectionery / bakery sector in Egypt continues to thrive, introducing new production lines and working on product development and geographical expansion into new markets
– Morocco is a major market for Egyptian manufacturing companies’ expansion plans
Public concerns about the safety and quality of fresh milk highlights the importance of imported dairy powders from reputable sources
In terms of dairy ingredients:
– There is only one SMP producer in Egypt – Dina Farms – with an estimated volume of no more than 100 mt p.a. when it has excess volumes of raw milk
– Butter is produced in small volumes by very small, traditional manufacturers in the suburbs of Cairo for local consumption – there are no volume statistics for this production
Butter and AMF are forecast to grow strongly to recover to previous volumes – the strong dip in 2017/18 imports was likely caused by high international butter prices during that period
– Whey powders are mainly sourced from the EU and New Zealand, with German quality considered the best
31
– Whey permeate is imported mainly by flavor manufacturing companies and is also used by local confectionery / bakery producers, but on a smaller scale
– SWP and some permeate is used to develop confectionery fillings (chocolate and caramel) and spreads
– Chocolate-flavored spreadable products using SWP are manufactured for local consumption and export to Palestine, Jordan and Oman – these are considered healthier alternative to chocolate dips which are not dairy-based (many of these are lower-cost Nutella imitations or for use in layer cakes)
– The majority of the whey volume in Egypt is SWP as manufacturers are used to it and hesitate to switch it – if whey permeate is lower in price than SWP, they would be tempted to switch however
In April / May 2019, SWP was cheaper than whey permeate in the Egyptian market with SWP selling at around US$800 / mt whereas permeate commanded US$1,200 / mt
– MPC is in demand for spreadable processed cheese and white cheese production, eps for Feta, Akkawi, Halloumi and double cream cheese but also other varieties
The vast majority of this is MPC70 Regulatory changes
The government is making continuous efforts to modernize and reduce barriers for international companies investing and operating in Egypt to make Egypt a gateway to other international markets
ASF / other diseases
FMD outbreaks recur frequently, causing huge economic losses and setting back the dairy sector Plant / capacity expansion
For Q1, 2019, Egypt’s food production capacity has increased significantly – the Chairman of the Export Council for Food Industries is aiming to increase the sector’s exports by 6% to reach US$3 bn in 2019 compared to US$2.8 bn last year
– Food exports grew by 9% during April / May 2019 reaching US$520 mn, compared to US$476 mn during the same period in 2018
– The UAE has expressed interest to strengthen a food and agricultural production partnership with Egypt
A french dairy processor has acquired Greenland Group for Food Industries, an Egyptian cheese maker and subsidiary of Middle East food company Americana Group, to strengthen their position as the major dairy processor in Egypt and will reinforce the production of white cheese, processed cheese, yoghurt and UHT milk
– Greenland has well developed structures and organization and is looking to upgrade its production facility – it is expected that this will lead to increased demand for ingredients such as MPC
Arabian Food Industries will continue to pursue its domestic and international expansion with plans to enter the baked goods sector – it is seeking to start production of new products such as flavored milk as well as baked goods, and is planning to set up a new branch and distribution center in the Rwandan capital of Kigali
Riyada Egypt (Soudanco), a major cheese manufacturer, plans to open new markets for its products in South Africa and East Asia as part of its export growth plan – the company exports more than 35-40% of its production to more than 22 countries. It has recently acquired the rights to package cooked
32
Mozzarella for Kraft Food Inc for distribution in Egypt and other African countries – this will further drive demand for ingredients such as MPC
33
2.3 Morocco
Data Sources
Production data: Interviews with Trade sources
Trade data: GTIS and ITC Context/Rationale for Forecast
The 35 mn population, growing at just 0.95%, has low spending power, although there are reasonable rates of GDP growth
Morocco has capitalized on its proximity to Europe and relatively low labor costs to work towards building a diverse, open, market-oriented economy – key sectors of the economy include agriculture, tourism, aerospace, automotive, phosphates, textiles, apparel, and subcomponents
Morocco has increased investment in its port, transportation, and industrial infrastructure to position itself as a center and broker for business throughout Africa – industrial development strategies and infrastructure improvements, most visibly illustrated by a new port and free trade zone near Tangier, are improving Morocco's competitiveness
Despite Morocco's economic progress, the country suffers from high unemployment, poverty, and illiteracy, particularly in rural areas. Key economic challenges for Morocco include reforming the education system and the judiciary
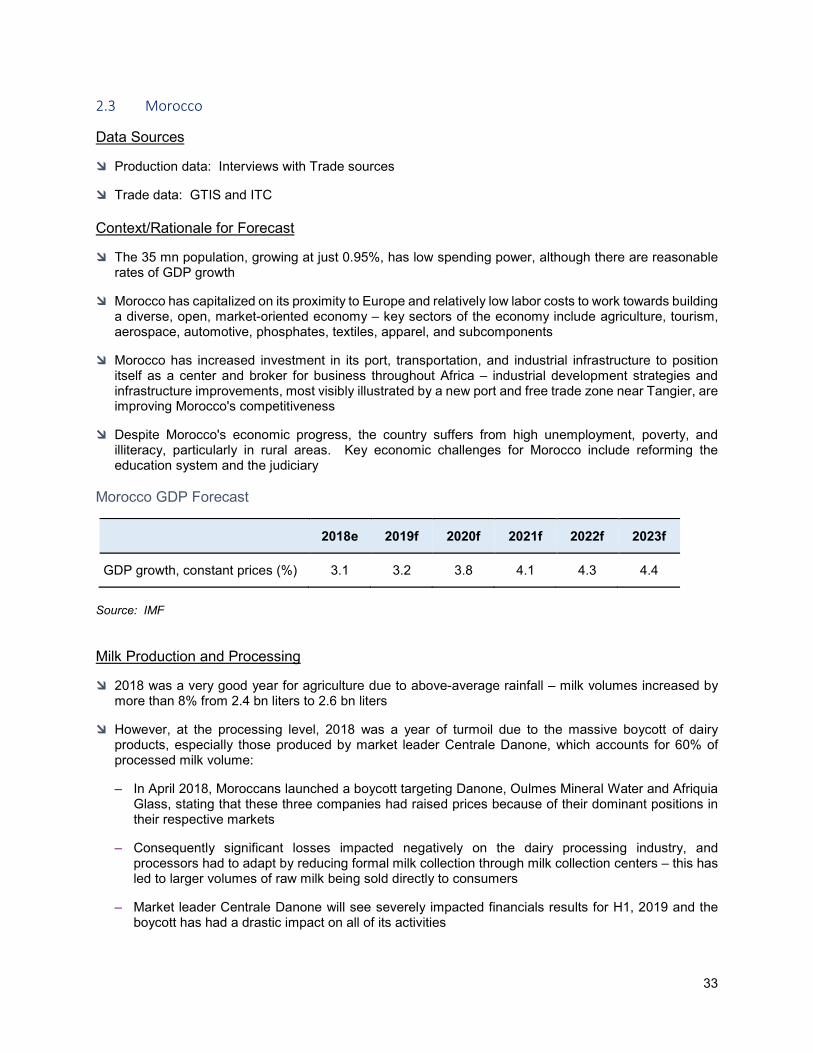
Morocco GDP Forecast
2018e 2019f 2020f 2021f 2022f 2023f
GDP growth, constant prices (%) 3.1 3.2 3.8 4.1 4.3 4.4
Source: IMF Milk Production and Processing
2018 was a very good year for agriculture due to above-average rainfall – milk volumes increased by more than 8% from 2.4 bn liters to 2.6 bn liters
However, at the processing level, 2018 was a year of turmoil due to the massive boycott of dairy products, especially those produced by market leader Centrale Danone, which accounts for 60% of processed milk volume:
– In April 2018, Moroccans launched a boycott targeting Danone, Oulmes Mineral Water and Afriquia Glass, stating that these three companies had raised prices because of their dominant positions in their respective markets
– Consequently significant losses impacted negatively on the dairy processing industry, and processors had to adapt by reducing formal milk collection through milk collection centers – this has led to larger volumes of raw milk being sold directly to consumers
– Market leader Centrale Danone will see severely impacted financials results for H1, 2019 and the boycott has had a drastic impact on all of its activities
34
– Processors also increased their stocks of milk powder and butter as they had to process excess raw milk into long-life products – more butter was produced both in formal and informal channels
International high prices impacted on imports of butter, additionally to increased local production
Conversely, SMP seeing lower prices has led to a surge in imports
Morocco does not produce any whey / lactose / casein-based ingredients
Importers / traders contacted in the market referred to general ingredients such as “whey powders” and “milk powders” without distinguishing protein content or whether products were, for example, WPCs or MPCs:
– Whey ingredients and MPCs are used mainly for cheese spreads / processed cheese
– Casein is used in commercial cheese production Market / Consumer Trends
The local market is forecast to continue to expand – as the effects of the boycott are receding, there is an expectation that local milk processing will ramp up again
Processors and importers interviewed see the volatility of international prices as the main threat to their operations and profitability, given the price sensitivity of local consumers especially when it comes to common products such as cheese spreads or yogurt
Social media has an increasing impact on the market and consumer opinion – the dairy product boycott, especially of Laitiere Danone products, was instigated by Facebook, Instagram and WhatsApp campaigns going viral
Retail and foodservice (esp fast food) are both growing strongly, with rising purchasing power, an expanding Middle class and growing westernization of Moroccan culture, driven by the younger population:
– McDonald’s is leading the way in the emerging QSR segment, with Pizza Hut, Domino’s and KFC also popular chains
– The café segment is very popular and the largest foodservice segment – Alshaya Maroc (Moroccan brand owner of Starbucks) is the leader in this segment
Consumer behavior is gradually changing – as in other parts of the region – with Moroccan consumers increasingly looking for healthier and convenient food options – packaged foods and healthy choices are the fastest growing segment sin the F&B industry
Whilst Morocco is renowned for having a large informal market, and although the market is still extremely fragmented, the development of retail, foodservice and food processing sectors is evident
Growing tourism, a trend for dining out among the affluent segment and increasing sophistication of consumers is expected to be reflected in higher expenditure on food
The bakery and confectionery / snack sector in Morocco is expected to continue to thrive – for example, Egypt’s Edita Food Industries (EFID) signed a contract with the local DISLOG Group to establish a snack food factory in Morocco – in time, this will likely lead to increased demand for dairy ingredients
Morocco has traditionally looked towards the EU, but is now increasingly positioning itself towards Africa, joining the African Union after more than 30 years – it is expected that this trend will continue
35
Regulatory Changes
A decrease of import duties due to FTAs with the EU and USA, which will particularly impact SMP, cheeses and UHT milk, is expected to lead to further increases in SMP imports:
– Fort US SMP/NFDM, the tariff rate is 8%, to be reduced to zero in 2020
– Whey products were immediately reduced to zero in 2008
Following the recall of millions of infant formula products around the world in December 2017, the Moroccan Ministry of Health reacted in December 2018 by announcing the discontinuation of nine types of IF and three cereals manufactured by the company producing the recalled infant formula.
The issue has also led to more rigorous controls of sanitary certificates and audits of companies dealing with baby food
Plant / Capacity Expansion
No processor has mentioned the intention to invest in new / expanded processing units as capacity is sufficient to cover the needs of the domestic market and a lack of export orientation / opportunity
36
2.4 Nigeria
Data Sources
Production data: no local production of dairy ingredients
Trade data: Import data is based on ITC Trademap mirror data Context/Rationale for Forecasts
The 186 mn population has low spending power, and now has the largest number of people living in extreme poverty of any country, according to a recent study; GDP growth is modest only
Nigeria is Sub Saharan Africa’s largest economy and relies heavily on oil as its main source of foreign exchange earnings and government revenues
Following the 2008-09 global financial crises, the banking sector was effectively recapitalized and regulation enhanced. Since then, Nigeria’s economic growth has been driven by growth in agriculture, telecommunications, and services
However, economic diversification and strong growth have not translated into a significant decline in poverty levels; over 62% of Nigeria's population still live in extreme poverty
Despite its strong fundamentals, oil-rich Nigeria has been hobbled by inadequate power supply, lack of infrastructure, delays in the passage of legislative reforms, an inefficient property registration system, restrictive trade policies, an inconsistent regulatory environment, a slow and ineffective judicial system, unreliable dispute resolution mechanisms, insecurity, and pervasive corruption:
– Regulatory constraints and security risks have limited new investment in oil and natural gas, and Nigeria's oil production had been contracting every year since 2012 until a slight rebound in 2017
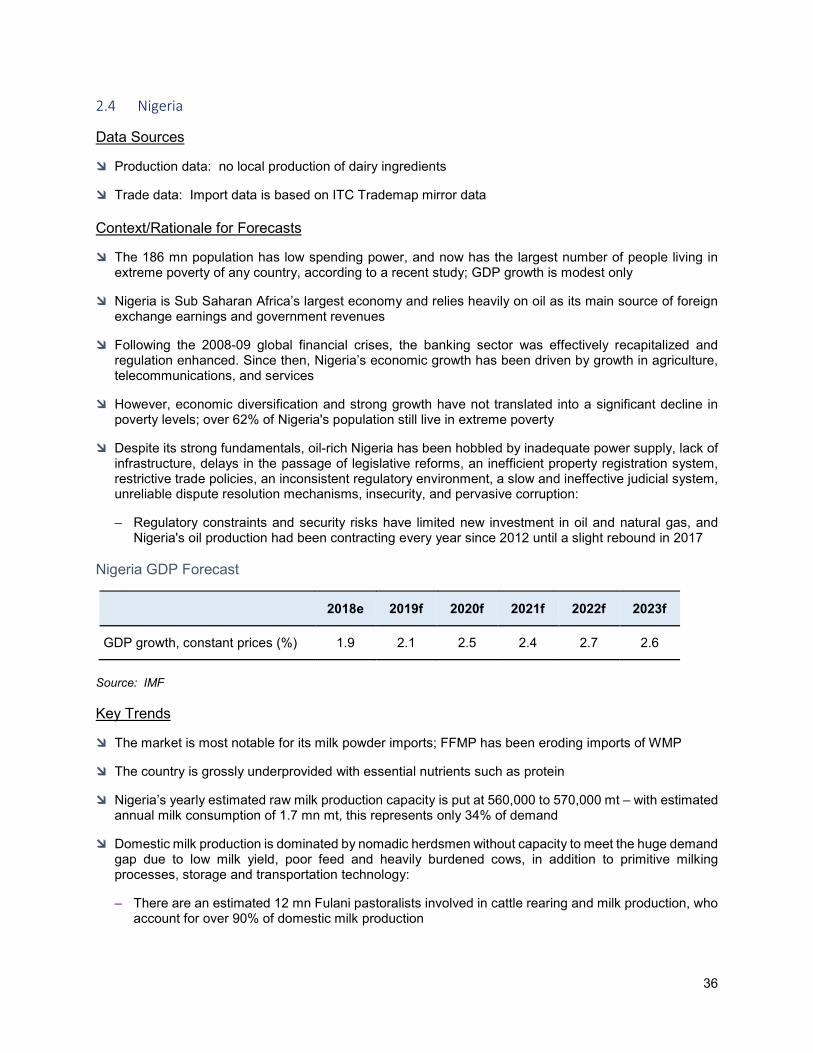
Nigeria GDP Forecast
2018e 2019f 2020f 2021f 2022f 2023f
GDP growth, constant prices (%) 1.9 2.1 2.5 2.4 2.7 2.6
Source: IMF Key Trends
The market is most notable for its milk powder imports; FFMP has been eroding imports of WMP
The country is grossly underprovided with essential nutrients such as protein
Nigeria’s yearly estimated raw milk production capacity is put at 560,000 to 570,000 mt – with estimated annual milk consumption of 1.7 mn mt, this represents only 34% of demand
Domestic milk production is dominated by nomadic herdsmen without capacity to meet the huge demand gap due to low milk yield, poor feed and heavily burdened cows, in addition to primitive milking processes, storage and transportation technology:
– There are an estimated 12 mn Fulani pastoralists involved in cattle rearing and milk production, who account for over 90% of domestic milk production
37
– Affordable, quality fodder available throughout the year is a major challenge – this has led to conflict between farmers and herdsmen, with drastic consequences (regional fighting, esp in the north of the country) now reaching the national level
– In spite of some projects – with some success – by NGOs and several international commercial players to build a network of high-quality milk suppliers, there seems little scope at national level of Nigeria’s milk production increasing or the sector modernizing in the short- to medium-term
– This July, the Central Bank of Nigeria (CBN) has declared its preparedness to provide loans to investors who are interested in tapping into its milk production initiative. This announcement followed the restriction placed on access to foreign exchange by the apex bank in order to reduce milk importation in the country
38
2.5 Saudi Arabia
Data Sources
Production data: USDEC regional office based on trade sources
Trade data: ITC Context/Rationale for Forecast
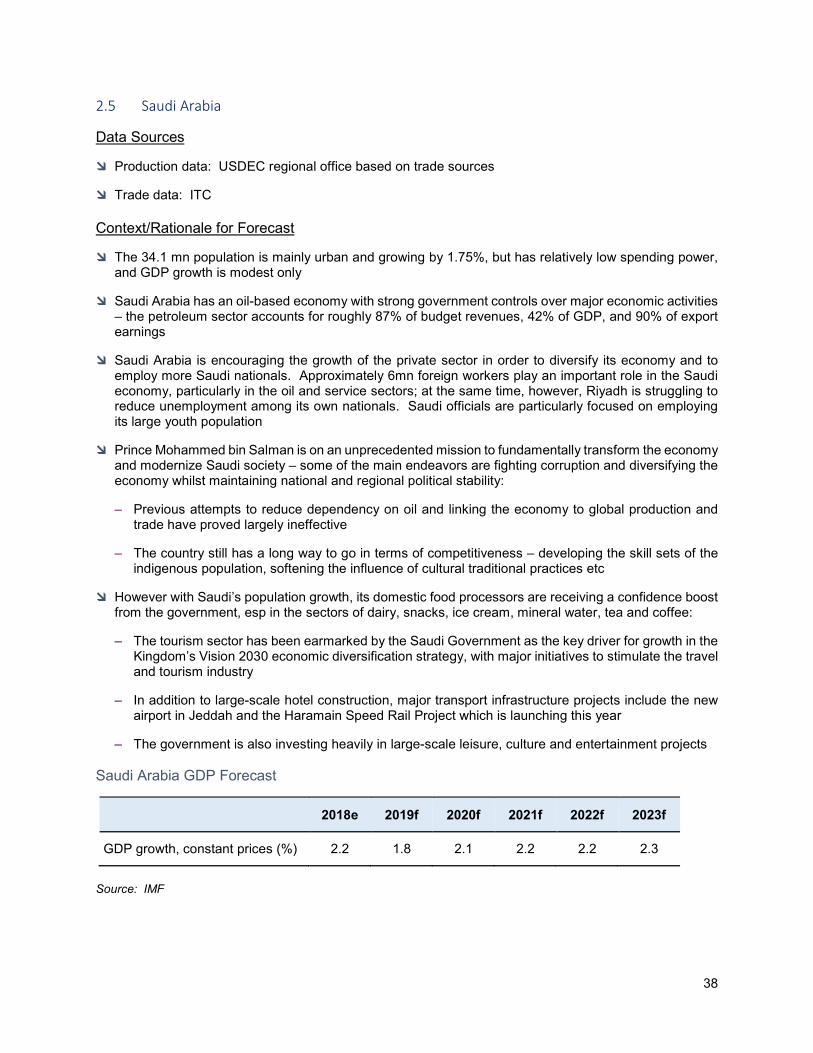
The 34.1 mn population is mainly urban and growing by 1.75%, but has relatively low spending power, and GDP growth is modest only
Saudi Arabia has an oil-based economy with strong government controls over major economic activities – the petroleum sector accounts for roughly 87% of budget revenues, 42% of GDP, and 90% of export earnings
Saudi Arabia is encouraging the growth of the private sector in order to diversify its economy and to employ more Saudi nationals. Approximately 6mn foreign workers play an important role in the Saudi economy, particularly in the oil and service sectors; at the same time, however, Riyadh is struggling to reduce unemployment among its own nationals. Saudi officials are particularly focused on employing its large youth population
Prince Mohammed bin Salman is on an unprecedented mission to fundamentally transform the economy and modernize Saudi society – some of the main endeavors are fighting corruption and diversifying the economy whilst maintaining national and regional political stability:
– Previous attempts to reduce dependency on oil and linking the economy to global production and trade have proved largely ineffective
– The country still has a long way to go in terms of competitiveness – developing the skill sets of the indigenous population, softening the influence of cultural traditional practices etc
However with Saudi’s population growth, its domestic food processors are receiving a confidence boost from the government, esp in the sectors of dairy, snacks, ice cream, mineral water, tea and coffee:
– The tourism sector has been earmarked by the Saudi Government as the key driver for growth in the Kingdom’s Vision 2030 economic diversification strategy, with major initiatives to stimulate the travel and tourism industry
– In addition to large-scale hotel construction, major transport infrastructure projects include the new airport in Jeddah and the Haramain Speed Rail Project which is launching this year
– The government is also investing heavily in large-scale leisure, culture and entertainment projects Saudi Arabia GDP Forecast
2018e 2019f 2020f 2021f 2022f 2023f
GDP growth, constant prices (%) 2.2 1.8 2.1 2.2 2.2 2.3
Source: IMF
39
Milk Production
Raw milk production continues to increase – during Ramadan and Hajj, some major dairy processors are processing raw milk into cream for applications such as desserts and oriental sweets
2018 output was estimated at 2.72 mn liters, down slightly (-0.7%) from 2017’s 2.74 mn liters
SMP: Almarai has started to produce SMP – from 2020 onwards, this will only be used internally:
– Production capacity is 18,000 mt p.a., but at present only 4,000-5,000 mt are produced, so 20-25% of capacity
Butter: NADEC produces around 1,000 mt p.a., with Almarai also producing some from fresh milk:
– Saudi culture is not accustomed to consume butter however it is used in the production of homemade and industrial bakery and confectionery goods
WPC – nutritional bars are currently being developed in Saudi Arabia which include WPC
Whey powders – mainly SWP – are used in various confectionery and bakery items as well as in dairy products
Demand for MPC is mainly for MPC70 for the production of Turkish labneh and cheese fillings for croissants
Saudi importers prefer not to take on large stock levels due to fluctuations in oil and commodity prices Market / Consumer Trends
Saudi Arabia’s fast food market continues to expand and is projected to reach US$9 bn in 2023 – this will affect the import of various dairy products including dairy powders for applications in desserts, confectionery and baked goods served in these outlets
Demographic changes and increasing health challenges are providing new opportunities for food and beverage growth – consumers are increasingly seeking better value and healthier products:
– Saudi consumers, esp the young population, are paying more attention to product labels
Whilst global brands maintain their traditional dominance in the preserved food categories, Saudis are increasingly preferring locally-produced dairy and fresh food products
Saudi Arabia is witnessing a rising demand for organic products, with over half of Saudi consumers purchasing organic foods more than once a month:
– This trend is bolstered by the growing interest in health and wellness, with consumers increasingly looking for natural food as well as becoming more aware of issues such as animal welfare and environmental concerns
– Demand for gluten-free, vegan and high protein products is also rising, but consumers are remaining very cost-conscious
Saudi eating habits are changing rapidly, including the removal of “family sections” previously enforced in restaurants – this is resulting in people going out more and is changing the social / dining dynamic:
– This creates new foodservice opportunities that were previously off limits for investors to explore
40
The rise of ready-to-eat (RTE) and grab-and-go meals is shaping the future of Saudi food packaging trends, with more focus on shelf appearance and manufacturers moving into individual packs, with more focus on packaging quality
Regulatory Changes
The 5% VAT launched on January 1, 2018 took a few months of adjustment
Saudization is being enforced at 30% of the company workforce with Saudis in some cases being paid 1/3 more than their expatriate counterparts
Saudi started to issue tourist visas for the first time in 2018, the driving ban for women was lifted and cinemas returned to the country for the first time in 35 years
The Saudi Food and Drug Administration (SFDA) has given restaurants and café instructions to display ingredients and calorie counts of their food and beverage offer in an effort to raise health standards in response to the country’s diabetes epidemic
There are discussions about SFDA suggesting upper limits of sugar and fat in foods – these are proving to be of concern due to their negative impact on the smooth flow of trade in packaged US food and beverage products
SFDA is considering maximum salt levels in food products
In September 2018, SFDA announced a voluntary Front of Pack Nutritional Labelling (FoPNL) traffic light system which is expected to be made mandatory in 2021
SFDA has also issued a new technical regulation that requires calorie counts on menus starting New Plant / Capacity Expansions
Saudi Arabia’s National Agricultural Development Co acquired Danone’s venture in the country, creating one of the Kingdom’s largest dairy producers
Saudia Dairy & Foodstuff Co. (SADAFCO) acquired a 76% stake in Poland’s Mlekoma and its subsidiaries Foodexo and Mlekoma Dairy at a value of US$32 mn
Saudi Arabia’s Almarai, the largest dairy company in the Gulf, signed a sale purchase agreement with Alamar Foods to acquire a 100% stake in Premier Foods, a leading producer of value-added halal products
GEA has worked with Alamarai to build the nation’s largest and most modern dairy processing facility:
– The new plant at Al Kharj includes multiple production lines for a wide range of milk and yogurt products
– It has the capacity to process 2 mn liters of milk / day
– The project has already been successfully completed and the plant is in operation
– It processes mainly Almarai’s own raw milk but utilizes imported dairy ingredients to make up shortfalls
FrieslandCampina targets expansion in the Kingdom, aiming to break into the foodservice sector with its new cream range and to increase its distribution network
UAE’s Al Rawabi Dairy is currently assessing the feasibility of an operation base in Saudi Arabia
41
As Morocco’s Centrale Danone, a subsidiary of French dairy giant Danone, is counting its losses given the ongoing boycott against it, Alamarai is emerging as a potential future investor in Morocco, planning to open a dairy factory there in 2019
NZMP, Fonterra’s ingredient arm, has launched a full cream milk powder with 25% more protein per serving than average as well as a new product catering for the health and wellness trend – this is a dairy blend made with WPI
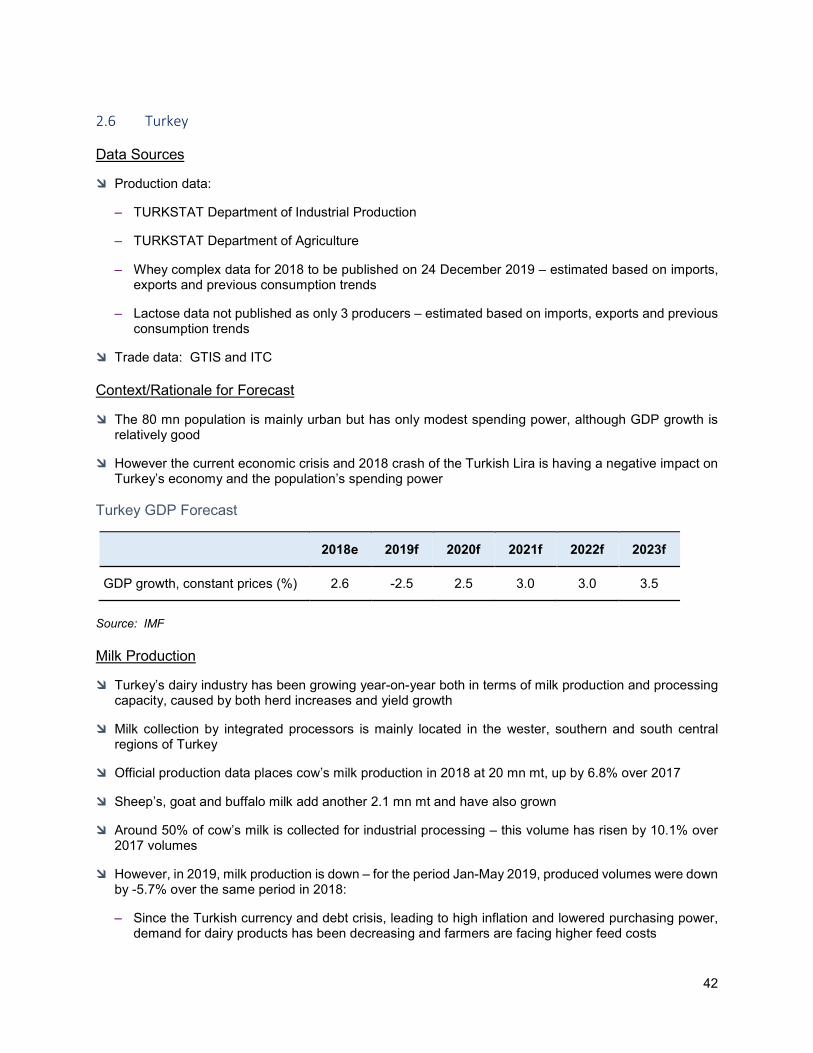
42
2.6 Turkey
Data Sources
Production data:
– TURKSTAT Department of Industrial Production
– TURKSTAT Department of Agriculture
– Whey complex data for 2018 to be published on 24 December 2019 – estimated based on imports, exports and previous consumption trends
– Lactose data not published as only 3 producers – estimated based on imports, exports and previous consumption trends
Trade data: GTIS and ITC Context/Rationale for Forecast
The 80 mn population is mainly urban but has only modest spending power, although GDP growth is relatively good
However the current economic crisis and 2018 crash of the Turkish Lira is having a negative impact on Turkey’s economy and the population’s spending power
Turkey GDP Forecast
2018e 2019f 2020f 2021f 2022f 2023f
GDP growth, constant prices (%) 2.6 -2.5 2.5 3.0 3.0 3.5
Source: IMF Milk Production
Turkey’s dairy industry has been growing year-on-year both in terms of milk production and processing capacity, caused by both herd increases and yield growth
Milk collection by integrated processors is mainly located in the wester, southern and south central regions of Turkey
Official production data places cow’s milk production in 2018 at 20 mn mt, up by 6.8% over 2017
Sheep’s, goat and buffalo milk add another 2.1 mn mt and have also grown
Around 50% of cow’s milk is collected for industrial processing – this volume has risen by 10.1% over 2017 volumes
However, in 2019, milk production is down – for the period Jan-May 2019, produced volumes were down by -5.7% over the same period in 2018:
– Since the Turkish currency and debt crisis, leading to high inflation and lowered purchasing power, demand for dairy products has been decreasing and farmers are facing higher feed costs

43
Key processed products are:
– Drinking milk – 1.6 mn mt
– Cream – 33,000 mt
– Butter and AMF – 66,000 mt
– WMP – 46,000 mt
– SMP – 63,000 mt
– Cheese made from cow’s milk – 723,000 mt
– Cheese made from goat’s / sheep / buffalo milk – 33,000 mt
– Yogurt – 1.2 mn mt
– Fermented / cultured beverages – 731,000 mt
Cheese production has risen strongly in 2018 (up by 9% for cow’s milk cheese and 17.9% for goats / sheep / buffalo milk cheese) leading to higher availability of whey, but the cheese volume has dropped by -5.7% for cow’s milk cheese and -16.6% for goats / sheep / buffalo cheese during the first five months of 2019, indicating that less why may be available going forward
Two Turkish companies manufacture MPC – all of this is MPC70, and market demand is largely for MPC70
Consumer / Market Trends
Turkish consumers are more health conscious than ever, with organic, functional and health foods very popular at the moment – this may well drive growing demand for WPCs and MPCs
The large Turkish bakery sector, traditionally dominated by artisanal breads and continues to grow – an important user sector for dairy ingredients
Going forward, a key element determining growth in demand and dairy ingredient imports will be if the Turkish Lira recovers value in the international currency exchange markets
Regulatory Changes
After years of negotiation to re-open the market to US dairy products, agreement on a new certificate was reached in July 2018 and the market is now open for dairy products for human consumption sourced from the US:
– Before the previous certificate expired, the US exported around US$24.2 mn to Turkey, the bulk of it butter
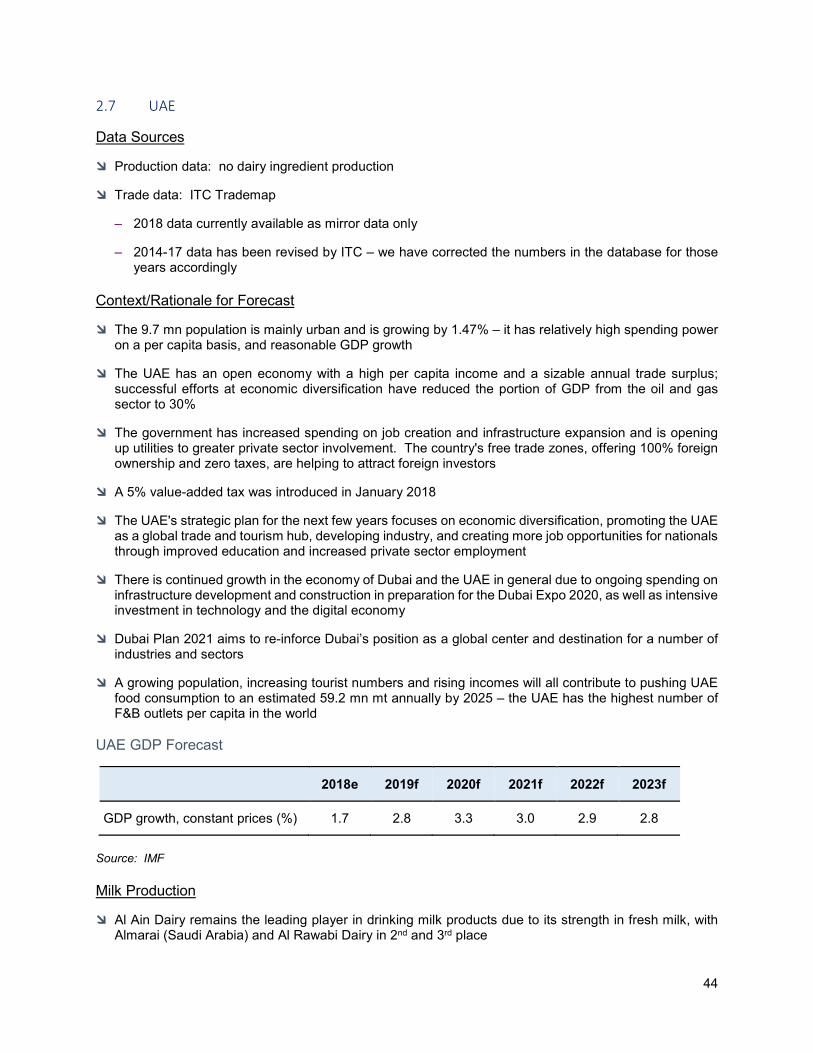
44
2.7 UAE
Data Sources
Production data: no dairy ingredient production
Trade data: ITC Trademap
– 2018 data currently available as mirror data only
– 2014-17 data has been revised by ITC – we have corrected the numbers in the database for those years accordingly
Context/Rationale for Forecast
The 9.7 mn population is mainly urban and is growing by 1.47% – it has relatively high spending power on a per capita basis, and reasonable GDP growth
The UAE has an open economy with a high per capita income and a sizable annual trade surplus; successful efforts at economic diversification have reduced the portion of GDP from the oil and gas sector to 30%
The government has increased spending on job creation and infrastructure expansion and is opening up utilities to greater private sector involvement. The country's free trade zones, offering 100% foreign ownership and zero taxes, are helping to attract foreign investors
A 5% value-added tax was introduced in January 2018
The UAE's strategic plan for the next few years focuses on economic diversification, promoting the UAE as a global trade and tourism hub, developing industry, and creating more job opportunities for nationals through improved education and increased private sector employment
There is continued growth in the economy of Dubai and the UAE in general due to ongoing spending on infrastructure development and construction in preparation for the Dubai Expo 2020, as well as intensive investment in technology and the digital economy
Dubai Plan 2021 aims to re-inforce Dubai’s position as a global center and destination for a number of industries and sectors
A growing population, increasing tourist numbers and rising incomes will all contribute to pushing UAE food consumption to an estimated 59.2 mn mt annually by 2025 – the UAE has the highest number of F&B outlets per capita in the world
UAE GDP Forecast
2018e 2019f 2020f 2021f 2022f 2023f
GDP growth, constant prices (%) 1.7 2.8 3.3 3.0 2.9 2.8
Source: IMF Milk Production
Al Ain Dairy remains the leading player in drinking milk products due to its strength in fresh milk, with Almarai (Saudi Arabia) and Al Rawabi Dairy in 2nd and 3rd place
45
Milk production has increased significantly from 2014’s 170,929 mt to 242,729 mt in 2017 – a 42% increase, with 2016-17 growth at 34%
There is basically no production of the target ingredients in the UAE
Most importers and traders do not bring in huge amounts of stock, purchasing to cover a 3-6 month period
In terms of imported dairy ingredients:
– WPC is imported for functionality as well as nutrition
It is used for developing confectionery fillings (chocolate and caramel) and spreads
It is used in applications such as sports nutrition, infant nutrition and high protein beverages
– WPI is mainly imported for products intended for distribution to gyms and the athletic sector, often incorporated in nutritional bars
– Whey permeate and DWP are used mainly in the production of confectionery, esp cookies, biscuits and chocolate bars
Whey permeate is also seen as a cost effective dairy ingredient
– SWP is used in dairy products, confectionery and in the snack industry – it is considered a relatively affordable ingredients
However, supply competition is fierce and it is mainly imported from Lithuania, Ukraine, Poland and Latvia
– MPC is mainly used in salty white cheese production for further distribution to bakeries and restaurants which use large quantities of white cheese in baked goods, croissants, cheese pies and other menu applications
Market / Consumption Trends
The UAE continues to position itself as a food production and distribution hub, with its food processing sector forecast to grow in parallel with a growing population and increasing export activity:
– The continuous development of the food manufacturing and processing sector is an important part of working towards food security
Dubai has recently made a huge investment in the Dubai Food Park – this is a US$1.5 bn mega project in Dubai Wholesale City, established to enhance the Emirate’s competitiveness as a leading regional hub in the food sector and food re-export:
– Food processing takes center stage in the new plants’ operation with 75% of the total area allocated to factories, 17% to warehouses and 8% divided between offices and other facilities
There is a growing trend towards fit and healthy lifestyles, with the younger generation especially driving this trend – this is expected to increase the demand for whey protein in the coming years:
– The number of people going to gyms is rising which is driving demand for whey protein products
– This trend is also leading to rising popularity of healthy snacks – local consumers are switching to low fat dairy products such as yogurts which are perceived as healthier, and dairy beverages instead of traditional sweet treats
46
– Consumers are increasingly looking for products that are free from preservatives, artificial colorings and flavorings
– Organic food at present remains a niche but growth in this space is being driven by new products and strong marketing campaigns from large manufacturers
Online retailing is starting to gain share as a result of growing interest from different dairy companies – however, dairy products are still typically purchased in hyper / supermarkets and traditional groceries
Social media provides brands with a free platform to interact with their consumer base – F&B manufacturers are tailoring their existing products and introducing new ones to meet the ever-changing tastes and behaviors of their target audience
Convenience is important, with UAE consumers increasingly looking to buy “food on the go” – esp in terms of snacks and breakfast items
It is increasingly important for UAE food suppliers to match consumer values – as UAE consumers are more educated and aware of global issues such as sustainability, transparency etc
White cheeses and Mediterranean types of dairy products are in high demand and are considered nutritious fresh food with a low fat content – more attention is being paid to labels, esp by the younger population
Regulatory Changes
5% VAT was introduced on January 1, 2018 and is levied on most goods and services
A new food registration portal is currently being released (called ZAD) and is still in the testing phase
– It is related to product registration – once a food product is registered in one Emirate, it will be visible on the system and the registration will be effective in all the other Emirates as well
– When lab testing has been done for a product, the new system will show the result sin all seven Emirates
– This new system and law applies to all food products including dairy Plant / Capacity Expansions
Leading UAE regional supplier Chef Middle East has signed a major deal with a French dairy producer– Chef Middle East’s broad client portfolio within the hotel / foodservice sector and its experience will strengthen the French dairy producer’s exposure and sales growth in the region
FrieslandCampina is looking to expand regionally and has started to sell a foodservice range via its distributor MH Enterprise, selling directly to hotels, restaurants and catering companies
Unikai, a UAE ice cream manufacturer, recently launched a fresh line of products including the Royal Treat Premium Ice Cream which is made from 100% butter fat and will be offered in 6 flavors – this will be distributed in the UAE and Oman
Halal Requirements
Halal mark:
– For dairy, the Halal Mark is optional – all imported products are Halal by default so no declaration is required
47
– However is a supplier wishes to have a Halal mark, it has to use the ESMA Halal mark – this means companies need to go through an audit process
Emirates Quality Mark (EQM):
– Obtaining an EQM is mandatory for certain products incl yogurt, flavored milk, Laban, fermented Laban, flavored yogurt, pasteurized camel milk and goat milk
48
3. Australasia
3.1 Australia
Data Sources
Production data: Dairy Australia, ABARE and trade sources
Trade data: Estimates based on Australian Bureau of Statistics
Context/Rationale for Forecast
The 25.1 mn population is mainly urban and growing with an influx from Asia in particular; there is high spending power on a per capita basis, and reasonable GDP growth
The domestic fresh category’s demand for raw milk represents 29% of total raw milk production, with demand forecast to grow further. Additionally, a reasonable volume of milkfats, cheese and other dried or concentrated product is consumed domestically
This means that the Australian industry might now have, and possibly for the first time, the opportunity to arbitrage between domestic and export market demand depending on returns
Australia GDP Forecast
2018e 2019f 2020f 2021f 2022f 2023f
GDP growth, constant prices (%) 2.8 2.1 2.8 2.8 2.6 2.7
Source: IMF Key Trends
In 2018 Australia’s raw milk production fell by 1.8%, driven by an accelerating H2 decline of 5.0% YoY. Despite this, and the significant domestic demand (much more so than in NZ), manufactured product exports grew 1.2% – and if Fresh and Liquid are added, exports grew 1.8%
Local milk supply continues to fall, with more dramatic decline (-11.2%) in Q1 2019. Hence the 2019 forecast production of raw milk is -8%, reflecting the continuing effects of the 2018/19 heat waves and drought conditions in Northern Victoria (not to the exclusion of overall declines in VIC, NSW and QLD) and the eastern effects of low rainfall on grain, hay and water prices
There are forecast declines in SMP, WMP and milkfat production – the latter two drawing milk which could be allocated to cheese; for WMP raised imports in 2017-2018 reflect weak production, and Australia cannot compete with NZ in this product; these declined are balanced 1% growth in cheese and some growth in value added whey product streams
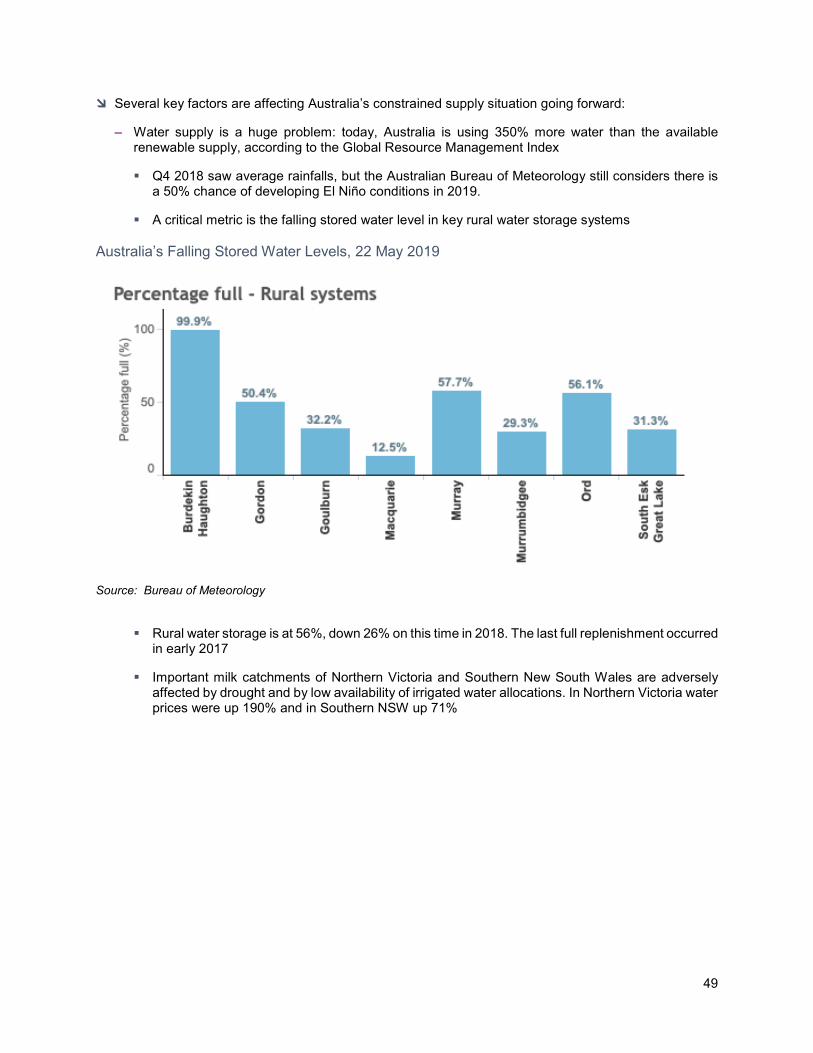
49
Several key factors are affecting Australia’s constrained supply situation going forward:
– Water supply is a huge problem: today, Australia is using 350% more water than the available renewable supply, according to the Global Resource Management Index
Q4 2018 saw average rainfalls, but the Australian Bureau of Meteorology still considers there is a 50% chance of developing El Niño conditions in 2019.
A critical metric is the falling stored water level in key rural water storage systems Australia’s Falling Stored Water Levels, 22 May 2019
Source: Bureau of Meteorology
Rural water storage is at 56%, down 26% on this time in 2018. The last full replenishment occurred in early 2017
Important milk catchments of Northern Victoria and Southern New South Wales are adversely affected by drought and by low availability of irrigated water allocations. In Northern Victoria water prices were up 190% and in Southern NSW up 71%
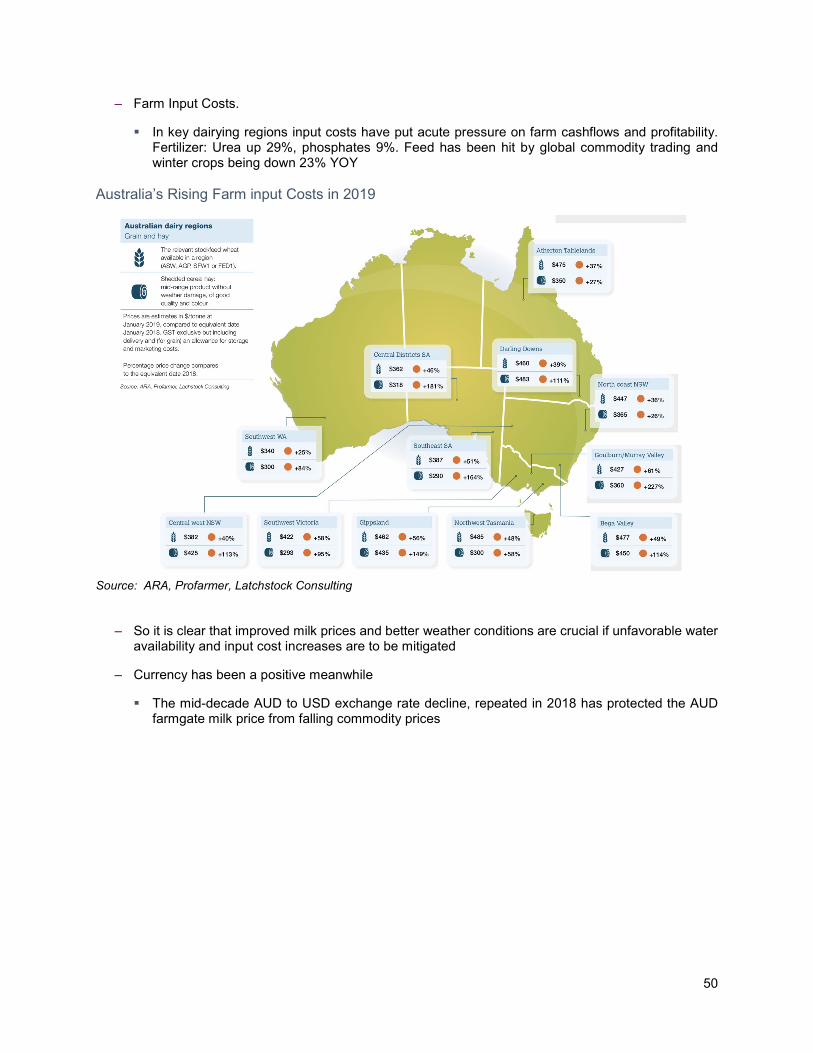
50
– Farm Input Costs.
In key dairying regions input costs have put acute pressure on farm cashflows and profitability. Fertilizer: Urea up 29%, phosphates 9%. Feed has been hit by global commodity trading and winter crops being down 23% YOY
Australia’s Rising Farm input Costs in 2019
Source: ARA, Profarmer, Latchstock Consulting
– So it is clear that improved milk prices and better weather conditions are crucial if unfavorable water availability and input cost increases are to be mitigated
– Currency has been a positive meanwhile
The mid-decade AUD to USD exchange rate decline, repeated in 2018 has protected the AUD farmgate milk price from falling commodity prices
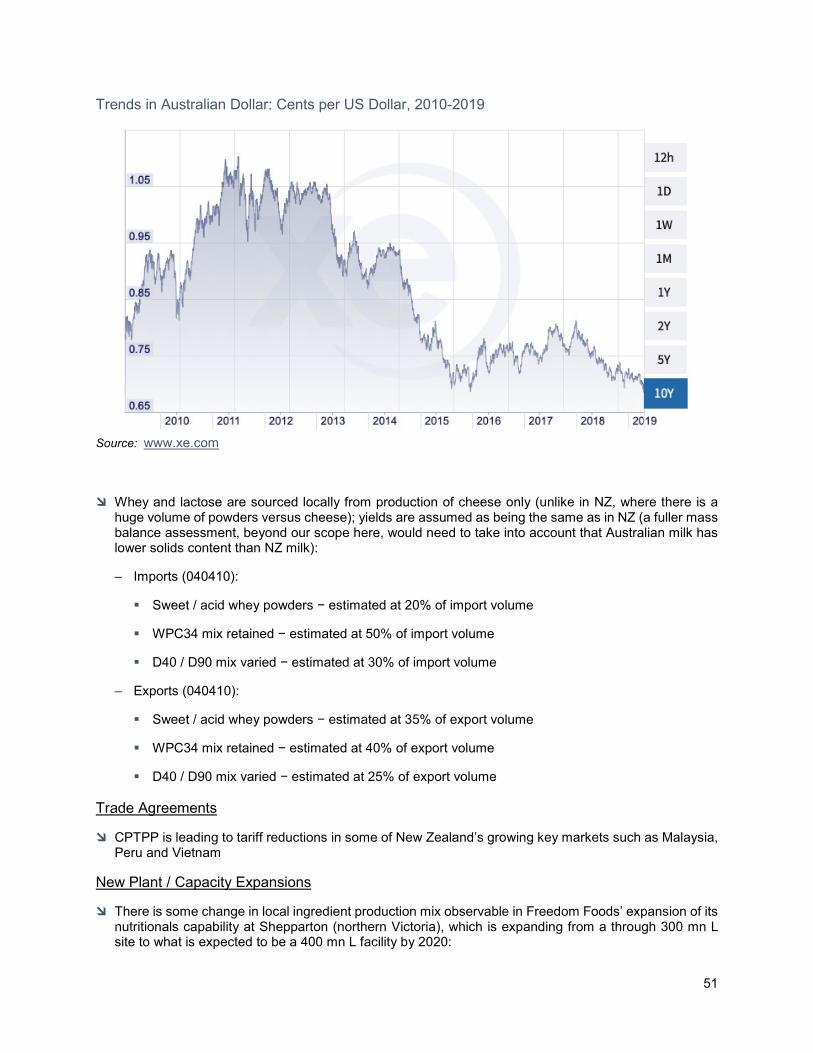
51
Trends in Australian Dollar: Cents per US Dollar, 2010-2019
Source: www.xe.com
Whey and lactose are sourced locally from production of cheese only (unlike in NZ, where there is a huge volume of powders versus cheese); yields are assumed as being the same as in NZ (a fuller mass balance assessment, beyond our scope here, would need to take into account that Australian milk has lower solids content than NZ milk):
– Imports (040410):
Sweet / acid whey powders − estimated at 20% of import volume
WPC34 mix retained − estimated at 50% of import volume
D40 / D90 mix varied − estimated at 30% of import volume
– Exports (040410):
Sweet / acid whey powders − estimated at 35% of export volume
WPC34 mix retained − estimated at 40% of export volume
D40 / D90 mix varied − estimated at 25% of export volume Trade Agreements
CPTPP is leading to tariff reductions in some of New Zealand’s growing key markets such as Malaysia, Peru and Vietnam
New Plant / Capacity Expansions
There is some change in local ingredient production mix observable in Freedom Foods’ expansion of its nutritionals capability at Shepparton (northern Victoria), which is expanding from a through 300 mn L site to what is expected to be a 400 mn L facility by 2020:
52
– Micellar casein is now being produced from February 2019, but sold only in liquid format at this point
– Native WPI is due to come on stream in H2 2019, with forward contracts in place for H2 2019 and 2020; however, volumes look like remaining niche over the next five year period
53
3.2 New Zealand
Data Sources
Production data: trade sources
Trade data: Estimates based on Statistics New Zealand
Context/Rationale for Forecast
The 4.8 mn population is mainly urban and also growing with an influx from Asia in particular; there is relatively high spending power on a per capita basis, and reasonable GDP growth
However it’s evident that, unlike in Australia, in NZ the domestic fresh category’s demand for raw milk represents only 5% of total raw milk production, so exports are the absolute driver
New Zealand GDP Forecast
2018e 2019f 2020f 2021f 2022f 2023f
GDP growth, constant prices (%) 3.0 2.5 2.9 2.8 2.5 2.5
Source: IMF 2018 NZ raw milk production grew 2.1% based on H2 production running 5.1% ahead YoY on the back
of favorable farming conditions. However, the forecast by calendar year is cautious given the stress from the 2018/19 summer drought and unusually hot and dry 2019 autumn. Zero growth is expected in H1 2019 as a consequence, with key North Island catchments worst affected. Whilst H2 2018 NZ raw milk production was 40% higher than H1 and 5.1% ahead YoY, the impacts in H1 2019 will have unfavorable effects in H2
The 2019 data forecasts use a 1% raw milk production growth factor at a product stream level. Forecasting recognizes the volume of raw milk consumed for export purposes is typically viewed as being 95% of total raw milk produced
In terms of trade:
– NZ manufactured dairy exports (excluding liquid dairy) fell 0.6% in 2018 − only growth in Fresh and Liquid offset this decline, allowing exports to grow 0.4%
– Product mix exports in 2018 marginally favored growth in SMP / Butter / AMF and WMP streams over Cheese / Butter / AMF / Whey and Casein and the 2019 forecast assumes this is to continue
Several key factors are affecting New Zealand’s supply situation going forward:
– Currency has been a positive
Since the H2 2015 exchange rate correction the NZD has trade at an average NZD 0.13 less to the USD than was the case in from 2012 to FH 2015
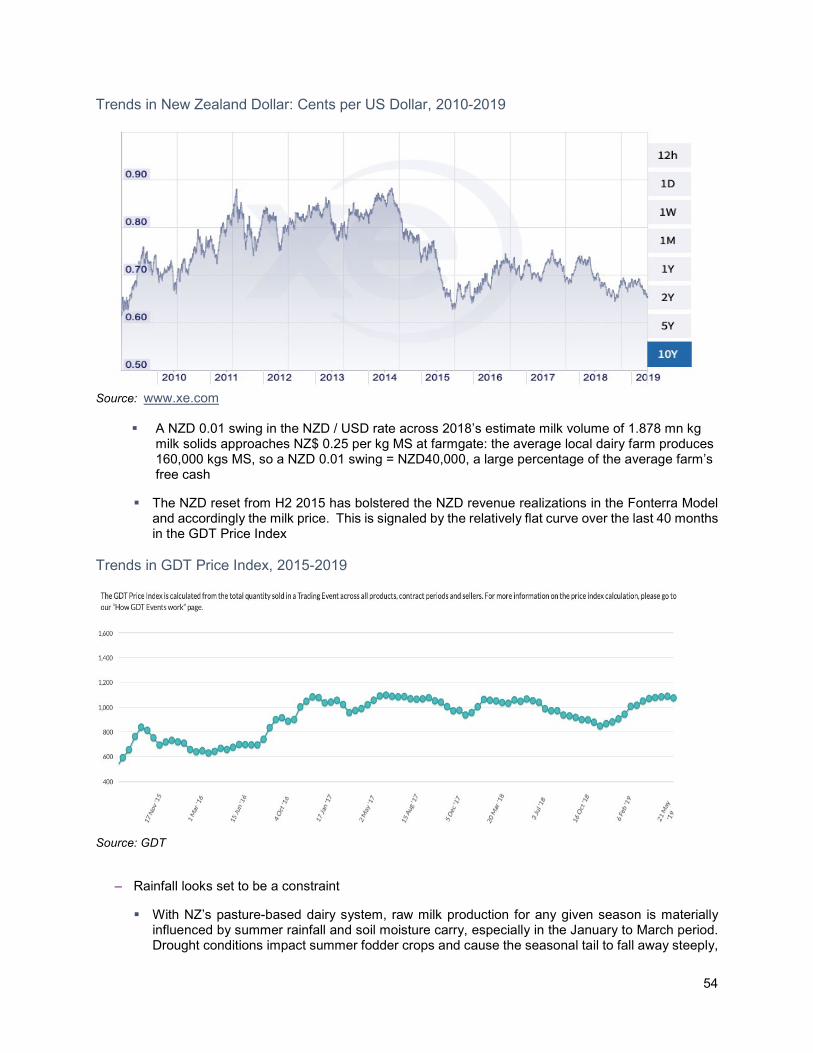
54
Trends in New Zealand Dollar: Cents per US Dollar, 2010-2019
Source: www.xe.com
A NZD 0.01 swing in the NZD / USD rate across 2018’s estimate milk volume of 1.878 mn kg milk solids approaches NZ$ 0.25 per kg MS at farmgate: the average local dairy farm produces 160,000 kgs MS, so a NZD 0.01 swing = NZD40,000, a large percentage of the average farm’s free cash
The NZD reset from H2 2015 has bolstered the NZD revenue realizations in the Fonterra Model and accordingly the milk price. This is signaled by the relatively flat curve over the last 40 months in the GDT Price Index
Trends in GDT Price Index, 2015-2019
Source: GDT
– Rainfall looks set to be a constraint
With NZ’s pasture-based dairy system, raw milk production for any given season is materially influenced by summer rainfall and soil moisture carry, especially in the January to March period. Drought conditions impact summer fodder crops and cause the seasonal tail to fall away steeply,
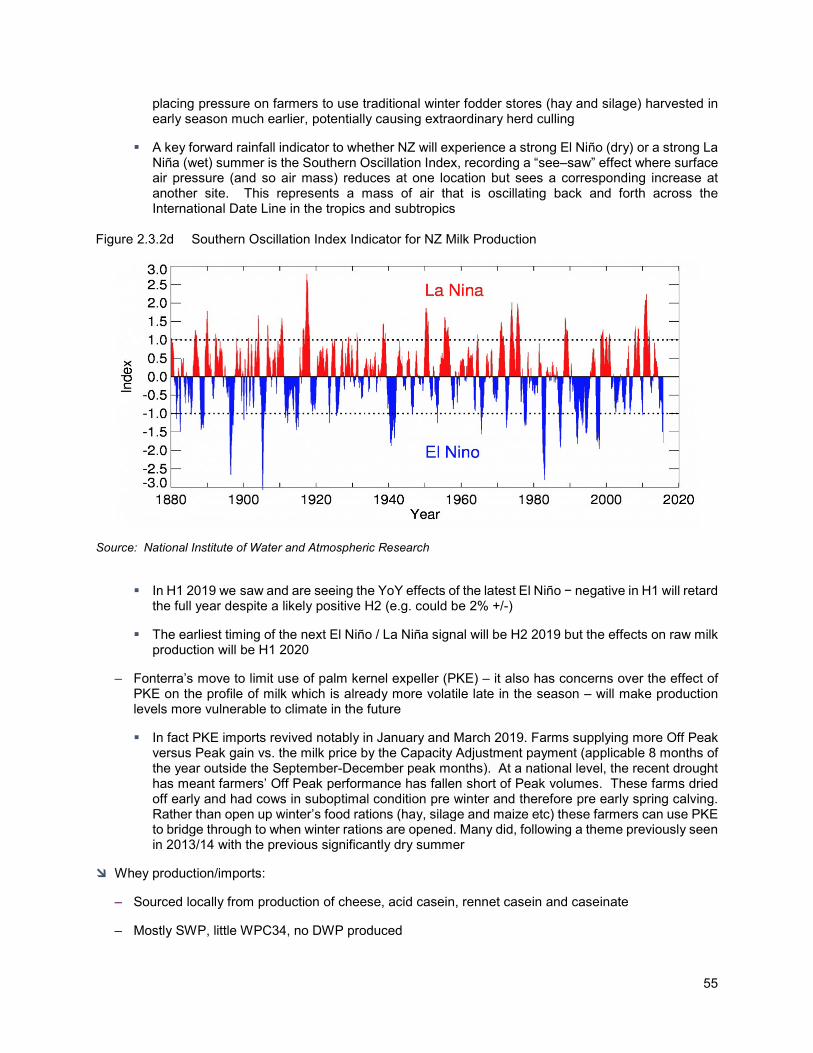
55
placing pressure on farmers to use traditional winter fodder stores (hay and silage) harvested in early season much earlier, potentially causing extraordinary herd culling
A key forward rainfall indicator to whether NZ will experience a strong El Niño (dry) or a strong La Niña (wet) summer is the Southern Oscillation Index, recording a “see–saw” effect where surface air pressure (and so air mass) reduces at one location but sees a corresponding increase at another site. This represents a mass of air that is oscillating back and forth across the International Date Line in the tropics and subtropics
Figure 2.3.2d Southern Oscillation Index Indicator for NZ Milk Production
Source: National Institute of Water and Atmospheric Research
In H1 2019 we saw and are seeing the YoY effects of the latest El Niño − negative in H1 will retard the full year despite a likely positive H2 (e.g. could be 2% +/-)
The earliest timing of the next El Niño / La Niña signal will be H2 2019 but the effects on raw milk production will be H1 2020
– Fonterra’s move to limit use of palm kernel expeller (PKE) – it also has concerns over the effect of PKE on the profile of milk which is already more volatile late in the season – will make production levels more vulnerable to climate in the future
In fact PKE imports revived notably in January and March 2019. Farms supplying more Off Peak versus Peak gain vs. the milk price by the Capacity Adjustment payment (applicable 8 months of the year outside the September-December peak months). At a national level, the recent drought has meant farmers’ Off Peak performance has fallen short of Peak volumes. These farms dried off early and had cows in suboptimal condition pre winter and therefore pre early spring calving. Rather than open up winter’s food rations (hay, silage and maize etc) these farmers can use PKE to bridge through to when winter rations are opened. Many did, following a theme previously seen in 2013/14 with the previous significantly dry summer
Whey production/imports:
– Sourced locally from production of cheese, acid casein, rennet casein and caseinate
– Mostly SWP, little WPC34, no DWP produced
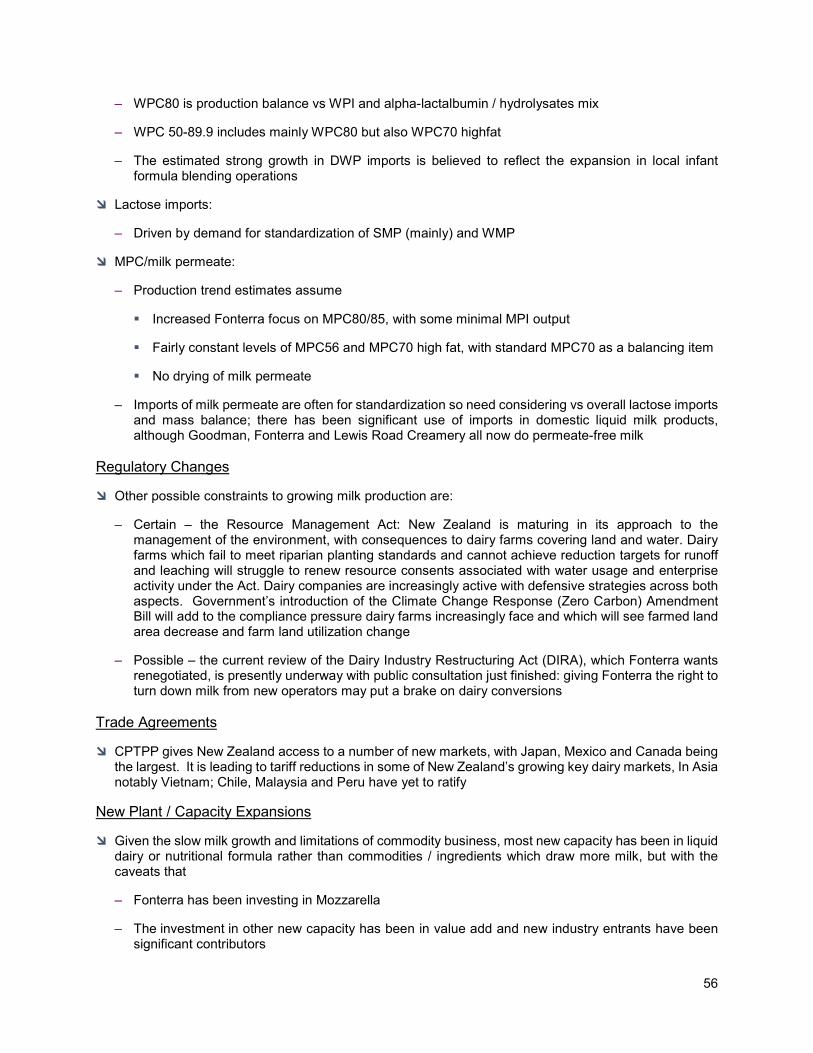
56
– WPC80 is production balance vs WPI and alpha-lactalbumin / hydrolysates mix
– WPC 50-89.9 includes mainly WPC80 but also WPC70 highfat
– The estimated strong growth in DWP imports is believed to reflect the expansion in local infant formula blending operations
Lactose imports:
– Driven by demand for standardization of SMP (mainly) and WMP
MPC/milk permeate:
– Production trend estimates assume
Increased Fonterra focus on MPC80/85, with some minimal MPI output
Fairly constant levels of MPC56 and MPC70 high fat, with standard MPC70 as a balancing item
No drying of milk permeate
– Imports of milk permeate are often for standardization so need considering vs overall lactose imports and mass balance; there has been significant use of imports in domestic liquid milk products, although Goodman, Fonterra and Lewis Road Creamery all now do permeate-free milk
Regulatory Changes
Other possible constraints to growing milk production are:
– Certain – the Resource Management Act: New Zealand is maturing in its approach to the management of the environment, with consequences to dairy farms covering land and water. Dairy farms which fail to meet riparian planting standards and cannot achieve reduction targets for runoff and leaching will struggle to renew resource consents associated with water usage and enterprise activity under the Act. Dairy companies are increasingly active with defensive strategies across both aspects. Government’s introduction of the Climate Change Response (Zero Carbon) Amendment Bill will add to the compliance pressure dairy farms increasingly face and which will see farmed land area decrease and farm land utilization change
– Possible – the current review of the Dairy Industry Restructuring Act (DIRA), which Fonterra wants renegotiated, is presently underway with public consultation just finished: giving Fonterra the right to turn down milk from new operators may put a brake on dairy conversions
Trade Agreements
CPTPP gives New Zealand access to a number of new markets, with Japan, Mexico and Canada being the largest. It is leading to tariff reductions in some of New Zealand’s growing key dairy markets, In Asia notably Vietnam; Chile, Malaysia and Peru have yet to ratify
New Plant / Capacity Expansions
Given the slow milk growth and limitations of commodity business, most new capacity has been in liquid dairy or nutritional formula rather than commodities / ingredients which draw more milk, but with the caveats that
– Fonterra has been investing in Mozzarella
– The investment in other new capacity has been in value add and new industry entrants have been significant contributors

57
Very limited growth is likely in availability of whey for drying: there is a risk that NZ production of hard cheese (Cheddar, Gouda etc) could decline driven by (a) the competition in commoditized markets of North Asia, North Africa and Middle East and/or (b) Fonterra’s belief in its WMP strategy and that stream returns for powders and milk fat are better than protein and cheese
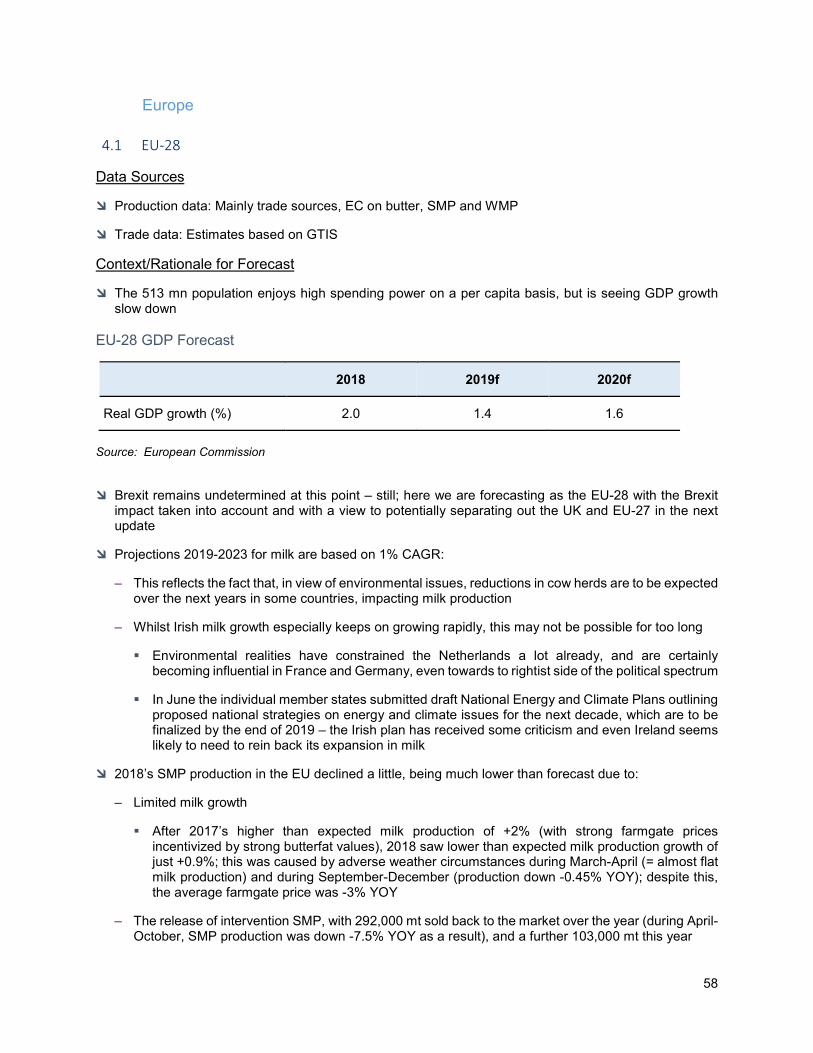
58
Europe
4.1 EU-28
Data Sources
Production data: Mainly trade sources, EC on butter, SMP and WMP
Trade data: Estimates based on GTIS
Context/Rationale for Forecast
The 513 mn population enjoys high spending power on a per capita basis, but is seeing GDP growth slow down
EU-28 GDP Forecast
2018 2019f 2020f
Real GDP growth (%) 2.0 1.4 1.6
Source: European Commission
Brexit remains undetermined at this point – still; here we are forecasting as the EU-28 with the Brexit impact taken into account and with a view to potentially separating out the UK and EU-27 in the next update
Projections 2019-2023 for milk are based on 1% CAGR:
– This reflects the fact that, in view of environmental issues, reductions in cow herds are to be expected over the next years in some countries, impacting milk production
– Whilst Irish milk growth especially keeps on growing rapidly, this may not be possible for too long
Environmental realities have constrained the Netherlands a lot already, and are certainly becoming influential in France and Germany, even towards to rightist side of the political spectrum
In June the individual member states submitted draft National Energy and Climate Plans outlining proposed national strategies on energy and climate issues for the next decade, which are to be finalized by the end of 2019 – the Irish plan has received some criticism and even Ireland seems likely to need to rein back its expansion in milk
2018’s SMP production in the EU declined a little, being much lower than forecast due to:
– Limited milk growth
After 2017’s higher than expected milk production of +2% (with strong farmgate prices incentivized by strong butterfat values), 2018 saw lower than expected milk production growth of just +0.9%; this was caused by adverse weather circumstances during March-April (= almost flat milk production) and during September-December (production down -0.45% YOY); despite this, the average farmgate price was -3% YOY
– The release of intervention SMP, with 292,000 mt sold back to the market over the year (during April-October, SMP production was down -7.5% YOY as a result), and a further 103,000 mt this year
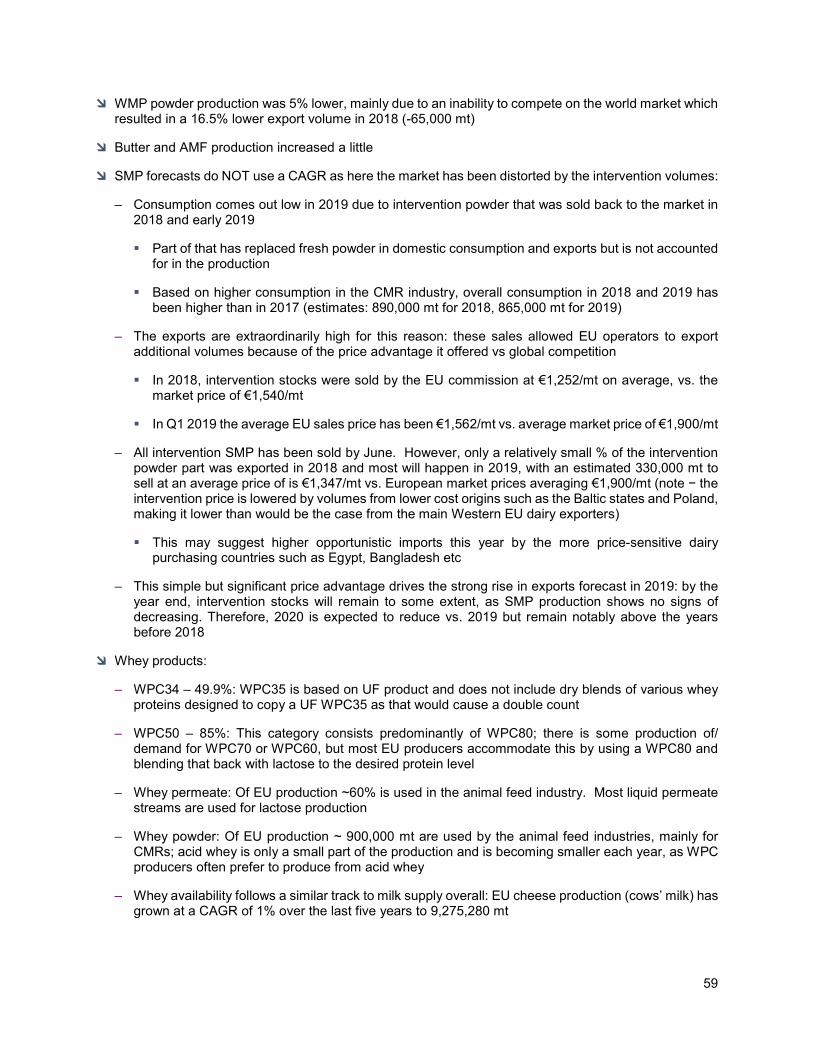
59
WMP powder production was 5% lower, mainly due to an inability to compete on the world market which resulted in a 16.5% lower export volume in 2018 (-65,000 mt)
Butter and AMF production increased a little
SMP forecasts do NOT use a CAGR as here the market has been distorted by the intervention volumes:
– Consumption comes out low in 2019 due to intervention powder that was sold back to the market in 2018 and early 2019
Part of that has replaced fresh powder in domestic consumption and exports but is not accounted for in the production
Based on higher consumption in the CMR industry, overall consumption in 2018 and 2019 has been higher than in 2017 (estimates: 890,000 mt for 2018, 865,000 mt for 2019)
– The exports are extraordinarily high for this reason: these sales allowed EU operators to export additional volumes because of the price advantage it offered vs global competition
In 2018, intervention stocks were sold by the EU commission at €1,252/mt on average, vs. the market price of €1,540/mt
In Q1 2019 the average EU sales price has been €1,562/mt vs. average market price of €1,900/mt
– All intervention SMP has been sold by June. However, only a relatively small % of the intervention powder part was exported in 2018 and most will happen in 2019, with an estimated 330,000 mt to sell at an average price of is €1,347/mt vs. European market prices averaging €1,900/mt (note − the intervention price is lowered by volumes from lower cost origins such as the Baltic states and Poland, making it lower than would be the case from the main Western EU dairy exporters)
This may suggest higher opportunistic imports this year by the more price-sensitive dairy purchasing countries such as Egypt, Bangladesh etc
– This simple but significant price advantage drives the strong rise in exports forecast in 2019: by the year end, intervention stocks will remain to some extent, as SMP production shows no signs of decreasing. Therefore, 2020 is expected to reduce vs. 2019 but remain notably above the years before 2018
Whey products:
– WPC34 – 49.9%: WPC35 is based on UF product and does not include dry blends of various whey proteins designed to copy a UF WPC35 as that would cause a double count
– WPC50 – 85%: This category consists predominantly of WPC80; there is some production of/ demand for WPC70 or WPC60, but most EU producers accommodate this by using a WPC80 and blending that back with lactose to the desired protein level
– Whey permeate: Of EU production ~60% is used in the animal feed industry. Most liquid permeate streams are used for lactose production
– Whey powder: Of EU production ~ 900,000 mt are used by the animal feed industries, mainly for CMRs; acid whey is only a small part of the production and is becoming smaller each year, as WPC producers often prefer to produce from acid whey
– Whey availability follows a similar track to milk supply overall: EU cheese production (cows’ milk) has grown at a CAGR of 1% over the last five years to 9,275,280 mt
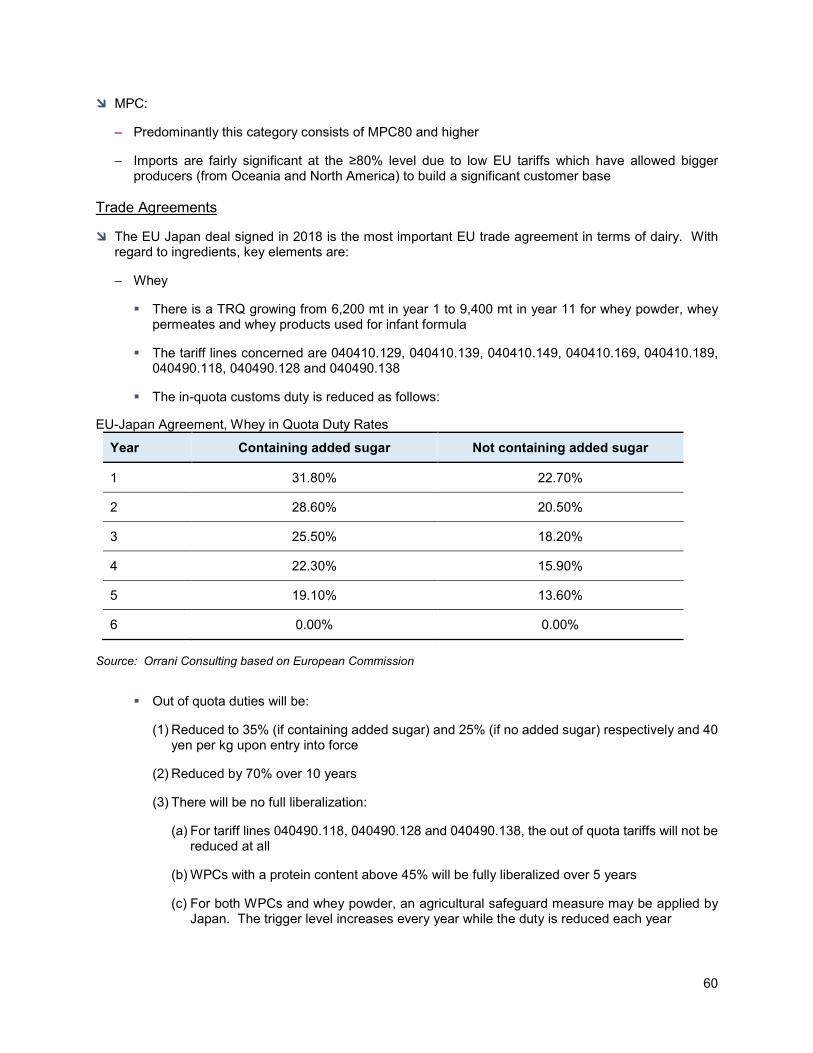
60
MPC:
– Predominantly this category consists of MPC80 and higher
– Imports are fairly significant at the ≥80% level due to low EU tariffs which have allowed bigger producers (from Oceania and North America) to build a significant customer base
Trade Agreements
The EU Japan deal signed in 2018 is the most important EU trade agreement in terms of dairy. With regard to ingredients, key elements are:
– Whey
There is a TRQ growing from 6,200 mt in year 1 to 9,400 mt in year 11 for whey powder, whey permeates and whey products used for infant formula
The tariff lines concerned are 040410.129, 040410.139, 040410.149, 040410.169, 040410.189, 040490.118, 040490.128 and 040490.138
The in-quota customs duty is reduced as follows: EU-Japan Agreement, Whey in Quota Duty Rates
Year Containing added sugar Not containing added sugar
1 31.80% 22.70%
2 28.60% 20.50%
3 25.50% 18.20%
4 22.30% 15.90%
5 19.10% 13.60%
6 0.00% 0.00% Source: Orrani Consulting based on European Commission
Out of quota duties will be:
(1) Reduced to 35% (if containing added sugar) and 25% (if no added sugar) respectively and 40 yen per kg upon entry into force
(2) Reduced by 70% over 10 years
(3) There will be no full liberalization:
(a) For tariff lines 040490.118, 040490.128 and 040490.138, the out of quota tariffs will not be reduced at all
(b) WPCs with a protein content above 45% will be fully liberalized over 5 years
(c) For both WPCs and whey powder, an agricultural safeguard measure may be applied by Japan. The trigger level increases every year while the duty is reduced each year
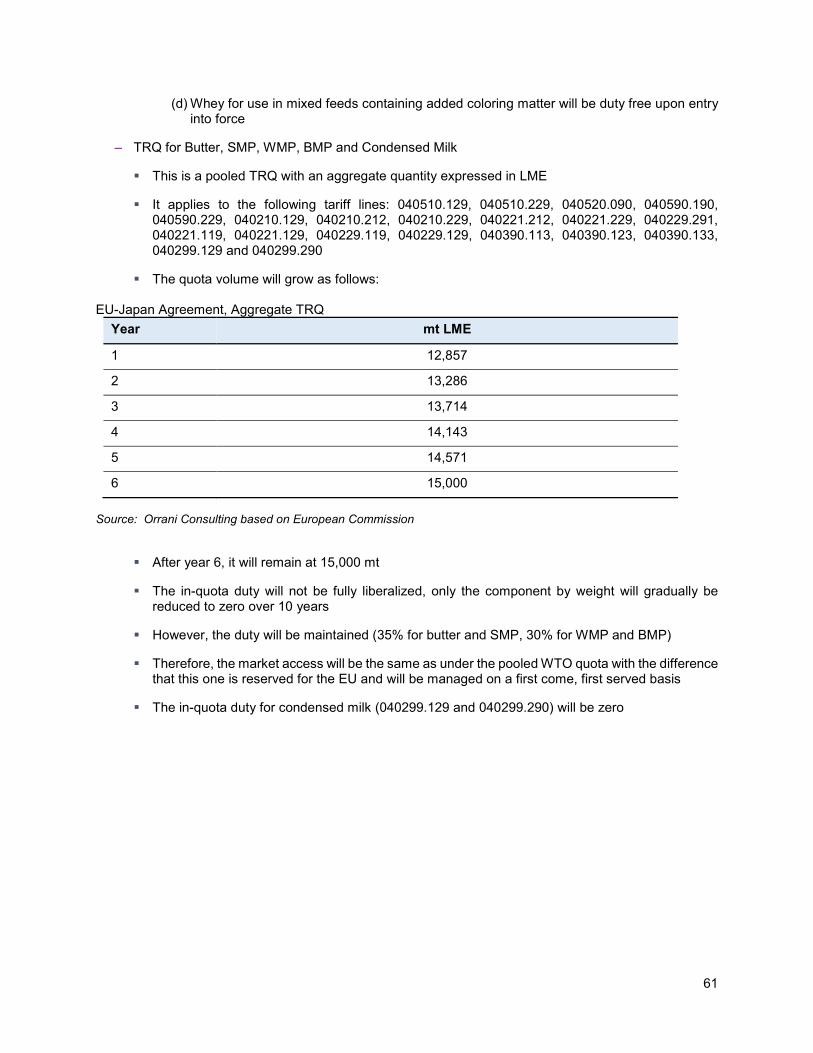
61
(d) Whey for use in mixed feeds containing added coloring matter will be duty free upon entry into force
– TRQ for Butter, SMP, WMP, BMP and Condensed Milk
This is a pooled TRQ with an aggregate quantity expressed in LME
It applies to the following tariff lines: 040510.129, 040510.229, 040520.090, 040590.190, 040590.229, 040210.129, 040210.212, 040210.229, 040221.212, 040221.229, 040229.291, 040221.119, 040221.129, 040229.119, 040229.129, 040390.113, 040390.123, 040390.133, 040299.129 and 040299.290
The quota volume will grow as follows: EU-Japan Agreement, Aggregate TRQ
Year mt LME
1 12,857
2 13,286
3 13,714
4 14,143
5 14,571
6 15,000 Source: Orrani Consulting based on European Commission
After year 6, it will remain at 15,000 mt
The in-quota duty will not be fully liberalized, only the component by weight will gradually be reduced to zero over 10 years
However, the duty will be maintained (35% for butter and SMP, 30% for WMP and BMP)
Therefore, the market access will be the same as under the pooled WTO quota with the difference that this one is reserved for the EU and will be managed on a first come, first served basis
The in-quota duty for condensed milk (040299.129 and 040299.290) will be zero
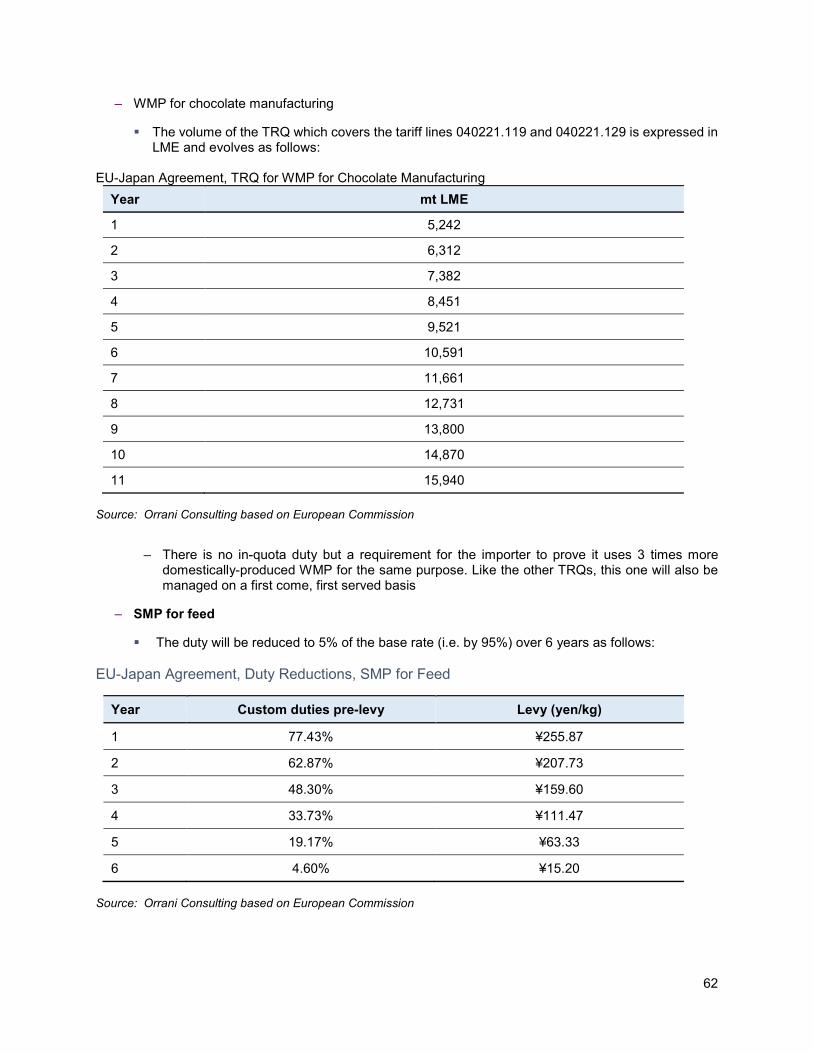
62
– WMP for chocolate manufacturing
The volume of the TRQ which covers the tariff lines 040221.119 and 040221.129 is expressed in LME and evolves as follows:
EU-Japan Agreement, TRQ for WMP for Chocolate Manufacturing
Year mt LME
1 5,242
2 6,312
3 7,382
4 8,451
5 9,521
6 10,591
7 11,661
8 12,731
9 13,800
10 14,870
11 15,940 Source: Orrani Consulting based on European Commission
– There is no in-quota duty but a requirement for the importer to prove it uses 3 times more domestically-produced WMP for the same purpose. Like the other TRQs, this one will also be managed on a first come, first served basis
– SMP for feed
The duty will be reduced to 5% of the base rate (i.e. by 95%) over 6 years as follows: EU-Japan Agreement, Duty Reductions, SMP for Feed
Year Custom duties pre-levy Levy (yen/kg)
1 77.43% ¥255.87
2 62.87% ¥207.73
3 48.30% ¥159.60
4 33.73% ¥111.47
5 19.17% ¥63.33
6 4.60% ¥15.20 Source: Orrani Consulting based on European Commission
63
A similar reduction scheme is applied to milk powder with a fat content above 1.5% used for feed
The summer 2019 EU/Mercosur trade deal includes a 10,000 mt quota for SMP with gradual tariff elimination over 9 yrs. Duties will be cut for EU butter by 30% from the outset. To some extent Mercosur and EU milk production are complementary, since northern and southern hemisphere countries produce at different times of the year. However tariffs on dairy are generally too high to allow EU exporters to compete vs other Mercosur origins that are duty free, and most products required are now produced within the bloc
New Plant / Capacity Expansions
Due to the limited milk growth expected, it is notable that there have been very little investment in new dairy ingredient capacity, with the leading processors making investments in 3 main areas − out-of-region acquisitions, purchases of cheese distribution/cutting businesses, or moves into plant/vegetable milk/yogurt processing; exceptions have been:
– Ireland: a number of investments (Carbery, Lakeland etc) tending to shift away from FFMP to cheese, whey and potentially more added value ingredients
– UK:
In 2018 Dairy Crest raised ~£70 mn to increase cheese / whey production capacity at Davidstow, Cornwall; any impact on this due to the 2019 acquisition of Dairy Crest by Saputo remains unclear
– France:
Lacto Sérum has added a new whey drying tower, but this is replacing old kit rather than adding truly new capacity
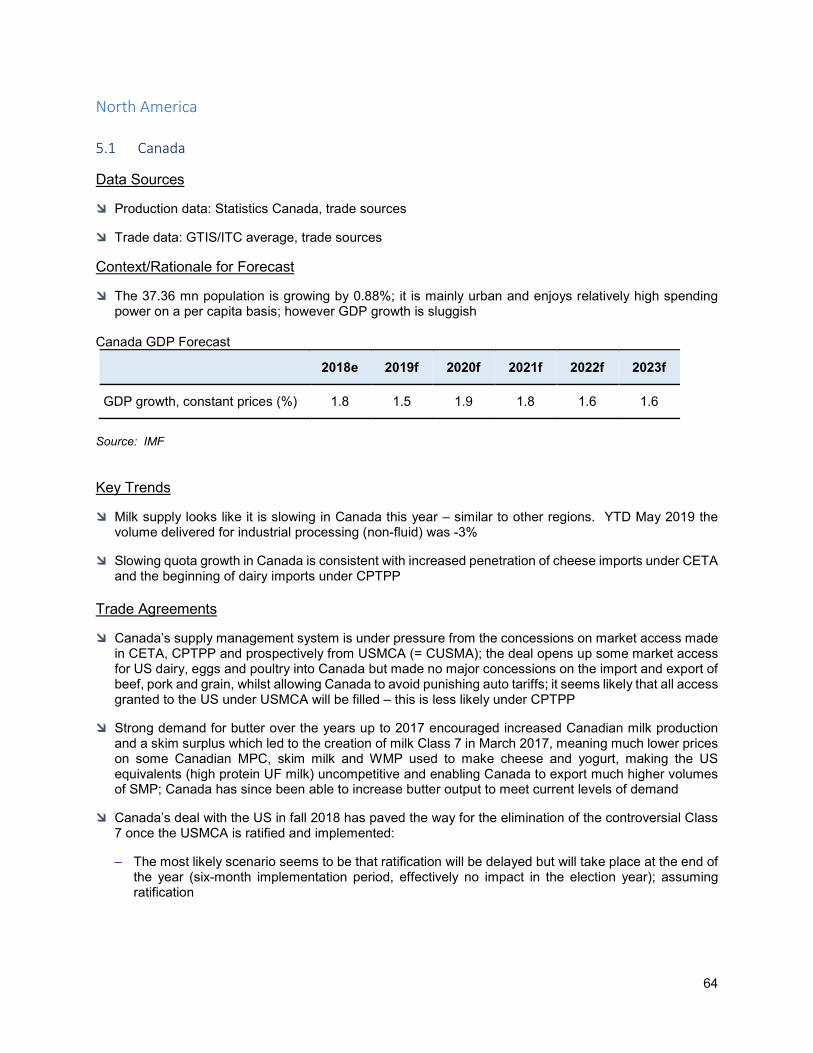
64
North America
5.1 Canada
Data Sources
Production data: Statistics Canada, trade sources
Trade data: GTIS/ITC average, trade sources
Context/Rationale for Forecast
The 37.36 mn population is growing by 0.88%; it is mainly urban and enjoys relatively high spending power on a per capita basis; however GDP growth is sluggish
Canada GDP Forecast
2018e 2019f 2020f 2021f 2022f 2023f
GDP growth, constant prices (%) 1.8 1.5 1.9 1.8 1.6 1.6
Source: IMF Key Trends
Milk supply looks like it is slowing in Canada this year – similar to other regions. YTD May 2019 the volume delivered for industrial processing (non-fluid) was -3%
Slowing quota growth in Canada is consistent with increased penetration of cheese imports under CETA and the beginning of dairy imports under CPTPP
Trade Agreements
Canada’s supply management system is under pressure from the concessions on market access made in CETA, CPTPP and prospectively from USMCA (= CUSMA); the deal opens up some market access for US dairy, eggs and poultry into Canada but made no major concessions on the import and export of beef, pork and grain, whilst allowing Canada to avoid punishing auto tariffs; it seems likely that all access granted to the US under USMCA will be filled – this is less likely under CPTPP
Strong demand for butter over the years up to 2017 encouraged increased Canadian milk production and a skim surplus which led to the creation of milk Class 7 in March 2017, meaning much lower prices on some Canadian MPC, skim milk and WMP used to make cheese and yogurt, making the US equivalents (high protein UF milk) uncompetitive and enabling Canada to export much higher volumes of SMP; Canada has since been able to increase butter output to meet current levels of demand
Canada’s deal with the US in fall 2018 has paved the way for the elimination of the controversial Class 7 once the USMCA is ratified and implemented:
– The most likely scenario seems to be that ratification will be delayed but will take place at the end of the year (six-month implementation period, effectively no impact in the election year); assuming ratification
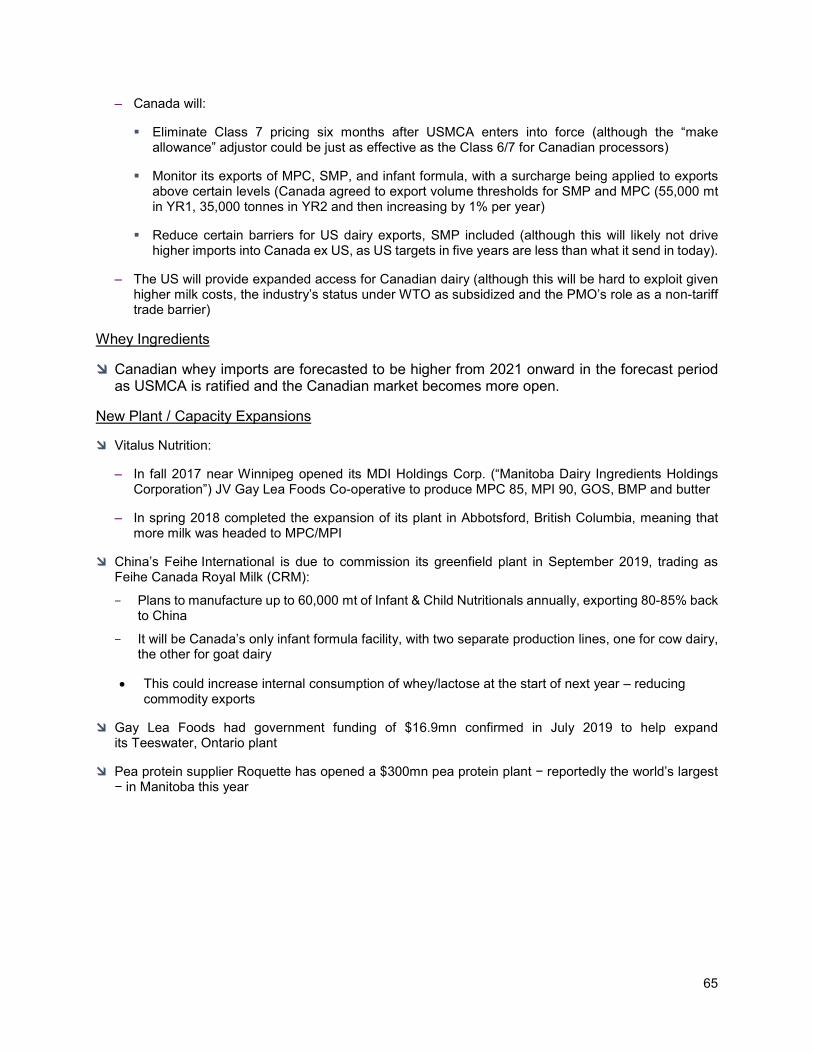
65
– Canada will:
Eliminate Class 7 pricing six months after USMCA enters into force (although the “make allowance” adjustor could be just as effective as the Class 6/7 for Canadian processors)
Monitor its exports of MPC, SMP, and infant formula, with a surcharge being applied to exports above certain levels (Canada agreed to export volume thresholds for SMP and MPC (55,000 mt in YR1, 35,000 tonnes in YR2 and then increasing by 1% per year)
Reduce certain barriers for US dairy exports, SMP included (although this will likely not drive higher imports into Canada ex US, as US targets in five years are less than what it send in today).
– The US will provide expanded access for Canadian dairy (although this will be hard to exploit given higher milk costs, the industry’s status under WTO as subsidized and the PMO’s role as a non-tariff trade barrier)
Whey Ingredients
Canadian whey imports are forecasted to be higher from 2021 onward in the forecast period as USMCA is ratified and the Canadian market becomes more open.
New Plant / Capacity Expansions
Vitalus Nutrition:
– In fall 2017 near Winnipeg opened its MDI Holdings Corp. (“Manitoba Dairy Ingredients Holdings Corporation”) JV Gay Lea Foods Co-operative to produce MPC 85, MPI 90, GOS, BMP and butter
– In spring 2018 completed the expansion of its plant in Abbotsford, British Columbia, meaning that more milk was headed to MPC/MPI
China’s Feihe International is due to commission its greenfield plant in September 2019, trading as Feihe Canada Royal Milk (CRM):
Plans to manufacture up to 60,000 mt of Infant & Child Nutritionals annually, exporting 80-85% back to China
It will be Canada’s only infant formula facility, with two separate production lines, one for cow dairy, the other for goat dairy
• This could increase internal consumption of whey/lactose at the start of next year – reducing commodity exports
Gay Lea Foods had government funding of $16.9mn confirmed in July 2019 to help expand its Teeswater, Ontario plant
Pea protein supplier Roquette has opened a $300mn pea protein plant − reportedly the world’s largest − in Manitoba this year
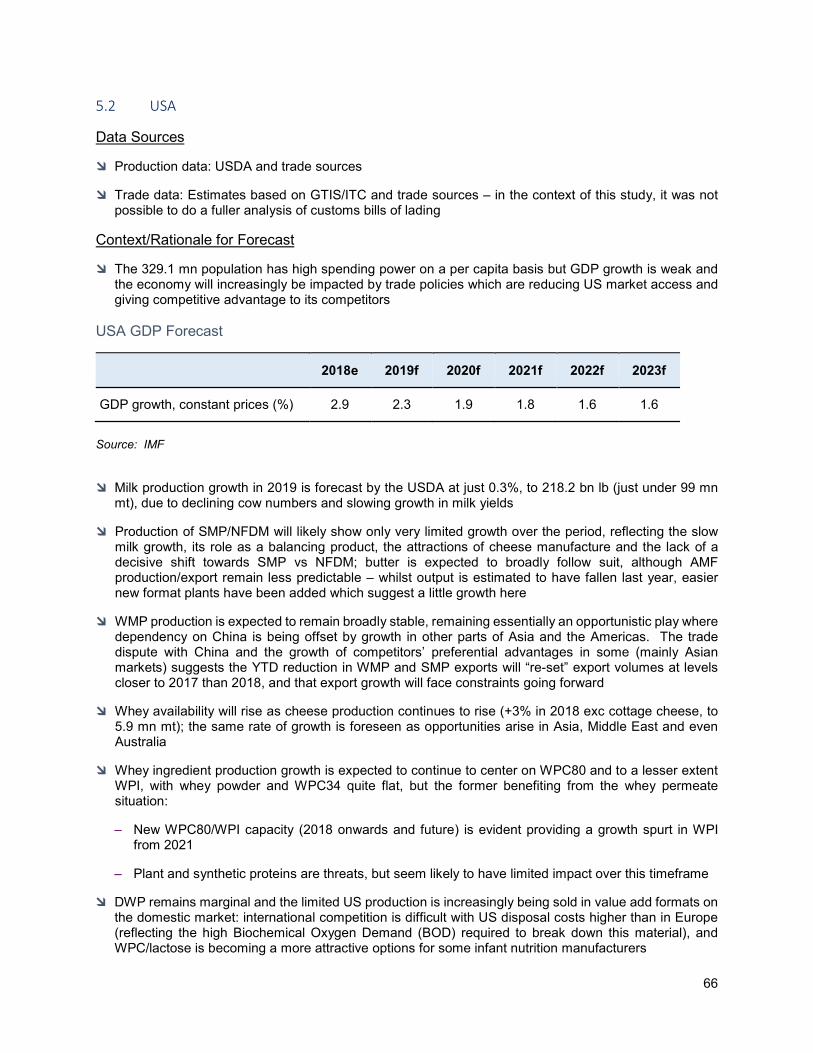
66
5.2 USA
Data Sources
Production data: USDA and trade sources
Trade data: Estimates based on GTIS/ITC and trade sources – in the context of this study, it was not possible to do a fuller analysis of customs bills of lading
Context/Rationale for Forecast
The 329.1 mn population has high spending power on a per capita basis but GDP growth is weak and the economy will increasingly be impacted by trade policies which are reducing US market access and giving competitive advantage to its competitors
USA GDP Forecast
2018e 2019f 2020f 2021f 2022f 2023f
GDP growth, constant prices (%) 2.9 2.3 1.9 1.8 1.6 1.6
Source: IMF
Milk production growth in 2019 is forecast by the USDA at just 0.3%, to 218.2 bn lb (just under 99 mn mt), due to declining cow numbers and slowing growth in milk yields
Production of SMP/NFDM will likely show only very limited growth over the period, reflecting the slow milk growth, its role as a balancing product, the attractions of cheese manufacture and the lack of a decisive shift towards SMP vs NFDM; butter is expected to broadly follow suit, although AMF production/export remain less predictable – whilst output is estimated to have fallen last year, easier new format plants have been added which suggest a little growth here
WMP production is expected to remain broadly stable, remaining essentially an opportunistic play where dependency on China is being offset by growth in other parts of Asia and the Americas. The trade dispute with China and the growth of competitors’ preferential advantages in some (mainly Asian markets) suggests the YTD reduction in WMP and SMP exports will “re-set” export volumes at levels closer to 2017 than 2018, and that export growth will face constraints going forward
Whey availability will rise as cheese production continues to rise (+3% in 2018 exc cottage cheese, to 5.9 mn mt); the same rate of growth is foreseen as opportunities arise in Asia, Middle East and even Australia
Whey ingredient production growth is expected to continue to center on WPC80 and to a lesser extent WPI, with whey powder and WPC34 quite flat, but the former benefiting from the whey permeate situation:
– New WPC80/WPI capacity (2018 onwards and future) is evident providing a growth spurt in WPI from 2021
– Plant and synthetic proteins are threats, but seem likely to have limited impact over this timeframe
DWP remains marginal and the limited US production is increasingly being sold in value add formats on the domestic market: international competition is difficult with US disposal costs higher than in Europe (reflecting the high Biochemical Oxygen Demand (BOD) required to break down this material), and WPC/lactose is becoming a more attractive options for some infant nutrition manufacturers
67
Whey permeate:
– Exports take place across multiple HS codes which vary amongst countries, their broad level being estimated based on trade sources
– Consumption in the US is estimated to have grown with some pig industry expansion; however edible take-up remains limited and it remains a feed- and export-led product which has therefore been badly affected by the combination of the ASF outbreak in China and other Asian markets, together with the Sino-US trade war, making 2019 about damage limitation: plant shutdowns and flexing to other ingredients where plants have this capability suggest marked drops in both drying and export; this means that new plants which should impact mainly from 2021 will not have the impact to sector volumes that would otherwise have been expected; there are clear technical education opportunities which can drive future growth in buyers’ usage levels in Asia, but these will take time and will face a major headwind in terms of reduced demand
WPC80/WPI trade:
– For the purposes of this study, HS350220 volumes in and out of the US are estimated at 85% WPC80 vs 15% WPI; additional estimates are made for the volume of WPC80 known to be exported under Chapter 4 (exc. MF retentate)
Lactose production will continue as whey proteins grow; it should benefit to some extent from the whey permeate situation but growth prospects in some of the key export markets
MPC/MPI:
– Imports <80% protein (HS040490) contain the higher fat content, which takes the protein level of the initial nonfat solids (70%) down to around 42-45% – this derives from Fonterra; it was developed in collaboration with Kraft for use in cream cheese in particular; these have been declining due to high international fat prices
– Imports ≥80% protein are estimates based on
The rising volume of MPC85 being traded (hidden) in 040490, driven by use in protein beverages
Trade under HS3501101000 (but excluding volumes from Belarus (not known as a producer);
– Exports take place across several codes such as 3504.00 and 0404.90, and vary amongst countries; trade sources indicate that they are much for significant for ≥80% protein formats (estimated at 12% of output) than for <80% MPCs (estimated at 5% of output)
Unlike for other markets, casein imports are HS3501105000 only to exclude MPCs#:
– Casein and caseinates volumes have been in decline due to
Casein selling into applications which are relatively flat
Over the last 2 years, movement by some end users to replace caseinates by micellar casein where viable in functionality terms
Limited production capacity in high protein beverages, where there is real demand
– In the past caseinate import volumes were inflated by push into cheese milk extension applications coming from NZ and EU exporters who had excess milk to dispose of – that supply push has gone, making the lower level of imports more reflective of true demand in sports nutrition, medical nutrition, creamers, beverages

68
– The next 5 years could see some stabilization and perhaps even modest growth, as there is more capacity for high protein beverages due to come onstream in 2019/2020
Micellar casein is expected to continue from a low base, most selling into liquid coffee creamers
Even though Casein isn’t produced in the US, the US does export some via Fonterra that brings it into the Philadelphia and the re-shipping elsewhere were needed.
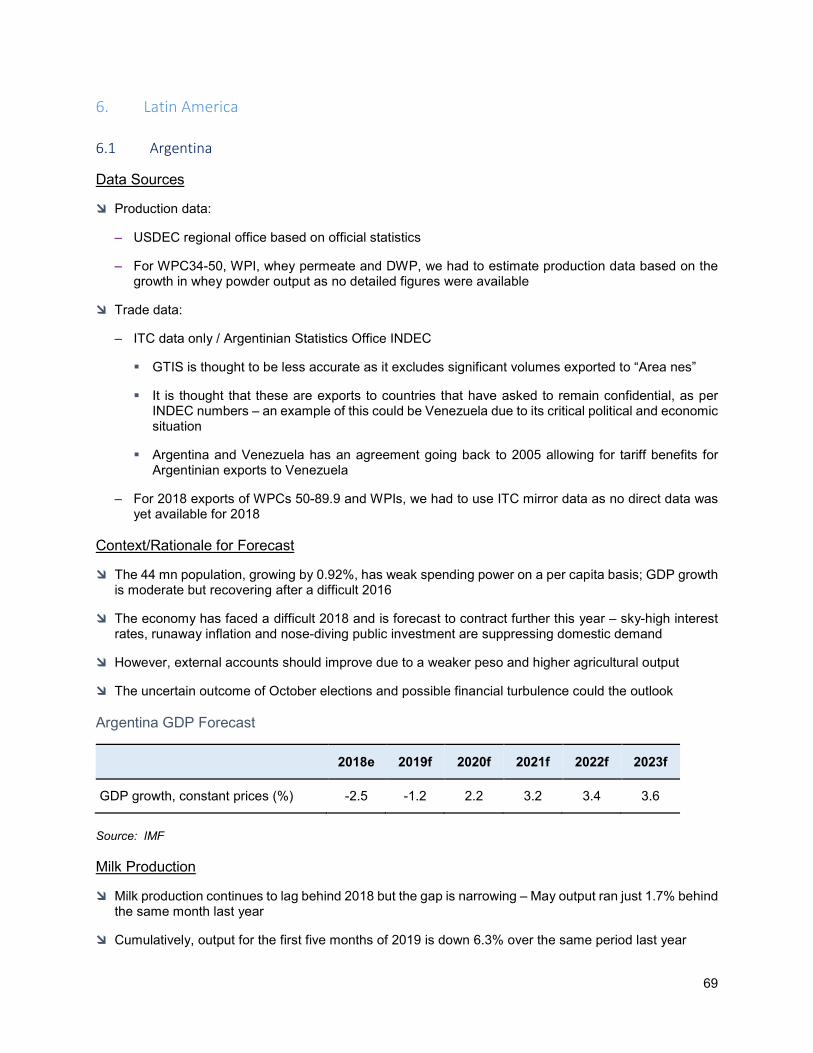
69
6. Latin America
6.1 Argentina
Data Sources
Production data:
– USDEC regional office based on official statistics
– For WPC34-50, WPI, whey permeate and DWP, we had to estimate production data based on the growth in whey powder output as no detailed figures were available
Trade data:
– ITC data only / Argentinian Statistics Office INDEC
GTIS is thought to be less accurate as it excludes significant volumes exported to “Area nes”
It is thought that these are exports to countries that have asked to remain confidential, as per INDEC numbers – an example of this could be Venezuela due to its critical political and economic situation
Argentina and Venezuela has an agreement going back to 2005 allowing for tariff benefits for Argentinian exports to Venezuela
– For 2018 exports of WPCs 50-89.9 and WPIs, we had to use ITC mirror data as no direct data was yet available for 2018
Context/Rationale for Forecast
The 44 mn population, growing by 0.92%, has weak spending power on a per capita basis; GDP growth is moderate but recovering after a difficult 2016
The economy has faced a difficult 2018 and is forecast to contract further this year – sky-high interest rates, runaway inflation and nose-diving public investment are suppressing domestic demand
However, external accounts should improve due to a weaker peso and higher agricultural output
The uncertain outcome of October elections and possible financial turbulence could the outlook Argentina GDP Forecast
2018e 2019f 2020f 2021f 2022f 2023f
GDP growth, constant prices (%) -2.5 -1.2 2.2 3.2 3.4 3.6
Source: IMF Milk Production
Milk production continues to lag behind 2018 but the gap is narrowing – May output ran just 1.7% behind the same month last year
Cumulatively, output for the first five months of 2019 is down 6.3% over the same period last year
70
Higher milk prices are leading to improved profitability for farmers and the expected strong grain harvest puts downward pressure on concentrate prices
However lack of raw milk means that processors were only utilizing 38.8% of installed capacity in April 2019:
– The production mix has shifted to favor milk powders over cheese and fluid milk – this means that, going forward, less whey is likely to be available
– This change has helped stabilize powder stocks which are at historically low levels Consumer / Market Trends
Local consumers are looking for healthier products and this is driving investment in sectors such as organic – Nestlé is the first company to invest in organic milk production in the market
There has been investment in infant formulae and special nutritional formulae for consumers with specific dietary restrictions – again, Nestlé is leading this development
The sales of leading brands have declined due to the current economic situation, leading to a proliferation of alternative, “secondary” brands (ie low-priced products) in the market – these are growing fast
The current health trend and a new forthcoming regulation on labelling has led companies to invest in new products with reduced sugar, sodium and fat levels and the inclusion of probiotics
La Serenísima has launched a new line of milk products with varying fat contents from 0-3% with color-coded packaging to tap into the trend for healthier products and easier communication with consumers
Regulatory Changes
“Tasa estadística”: The government has this year implemented an import tariff for products which has increased from 0.5% to 2.5% – this increase will be valid until; December 2019 and will be used to balance public accounts
The “Precios Cuidados” program has come into force under which prices of 64 products which are part of the grocery basked have been foxed until October – including milk and yogurt:
– This measure also ensures that the prices of these products must be highlighted for consumers in retail outlets
– This measure is aimed at helping consumers during these times of extremely high inflation
The government is currently discussing a model of warning labels to be implemented on processed foods
A Mercosur FTA with the EU has been concluded but it is thought that this will not impact majorly on dairy ingredient trade
Argentina and Vietnam have signed new commercial agreements and treatment for some product has already been agreed – the Argentinean President has indicated his intention for the agreement to be expanded to include Argentinian milk powder
New Plant / Capacity Expansion
Adecoagro finalized the purchase of the two Sancor processing plants, located in Chivicoy and Morteros, as well as the brands "Las Tres Niñas" and "Angelita", enabling Adecoagro to afford to pay their debts to their suppliers. The amount payed was US$50.4 mn
71
Nestle launched a new production line for liquid milk, and plans new investments in infant formulae, organic milk and A2 milk. This year, it also launched a new production line at its Villa Nueva plant which would be responsible for making chocolate milk for the production of the famous Nesquik in its liquid version, which until then was produced in Tregar
Arcor and Bagley increased their participation in Mastellone. In a letter sent to the National Securities Commission, they announced the purchase of 2.3 mn shares of the dairy company for US$996,600. With this operation, the companies together accumulate 43% of the social capital of the owner of La Serenísima. According to an agreement signed in 2015, Arcor will have the right to purchase 100% of Mastellone shares between 2020 and 2025
The equity fund manager Aqua Capital is running the brands Lac Léo and Cruzília in Brazil. The group’s focus is the growth of the businesses already acquired, but it considers entering the Parmesan cheese market, as well as the acquisition of new companies in Argentina and Uruguay, places that already have authorization to operate
A new player entered in the dairy market this year, the dairy company Cerlac: a public-private company whose products can already be found on the market. The first products launched were a pasteurized milk, cream and dulce de leche, with the company planning to enter the cheese market soon
The Agribusiness Secretariat of Argentina provided US$100,000 to milk producers to modernize and increase production. Six producers benefited from this program, and with these investments they expect to increase milk production by 48% over the next seven years in the region
The Manfrey cooperative plans to build a large farm to house animals from several producers. The main idea is to share the production costs and gain bargaining power due to the high production volumes. The difference of this model is that the animals would be relocated to a single space and the producers' farms would be converted into crops that would supply the animal feed demand, with the surplus to be sold, making the operations more profitable
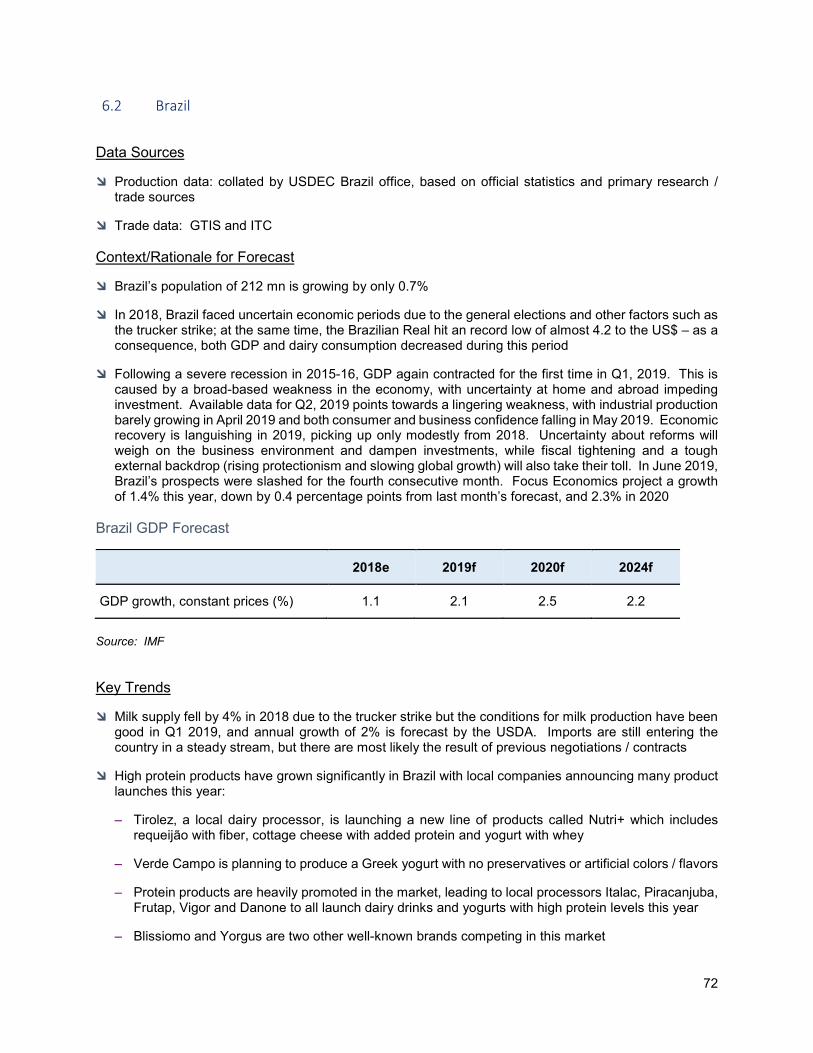
72
6.2 Brazil
Data Sources
Production data: collated by USDEC Brazil office, based on official statistics and primary research / trade sources
Trade data: GTIS and ITC Context/Rationale for Forecast
Brazil’s population of 212 mn is growing by only 0.7%
In 2018, Brazil faced uncertain economic periods due to the general elections and other factors such as the trucker strike; at the same time, the Brazilian Real hit an record low of almost 4.2 to the US$ – as a consequence, both GDP and dairy consumption decreased during this period
Following a severe recession in 2015-16, GDP again contracted for the first time in Q1, 2019. This is caused by a broad-based weakness in the economy, with uncertainty at home and abroad impeding investment. Available data for Q2, 2019 points towards a lingering weakness, with industrial production barely growing in April 2019 and both consumer and business confidence falling in May 2019. Economic recovery is languishing in 2019, picking up only modestly from 2018. Uncertainty about reforms will weigh on the business environment and dampen investments, while fiscal tightening and a tough external backdrop (rising protectionism and slowing global growth) will also take their toll. In June 2019, Brazil’s prospects were slashed for the fourth consecutive month. Focus Economics project a growth of 1.4% this year, down by 0.4 percentage points from last month’s forecast, and 2.3% in 2020
Brazil GDP Forecast
2018e 2019f 2020f 2024f
GDP growth, constant prices (%) 1.1 2.1 2.5 2.2
Source: IMF Key Trends
Milk supply fell by 4% in 2018 due to the trucker strike but the conditions for milk production have been good in Q1 2019, and annual growth of 2% is forecast by the USDA. Imports are still entering the country in a steady stream, but there are most likely the result of previous negotiations / contracts
High protein products have grown significantly in Brazil with local companies announcing many product launches this year:
– Tirolez, a local dairy processor, is launching a new line of products called Nutri+ which includes requeijão with fiber, cottage cheese with added protein and yogurt with whey
– Verde Campo is planning to produce a Greek yogurt with no preservatives or artificial colors / flavors
– Protein products are heavily promoted in the market, leading to local processors Italac, Piracanjuba, Frutap, Vigor and Danone to all launch dairy drinks and yogurts with high protein levels this year
– Blissiomo and Yorgus are two other well-known brands competing in this market
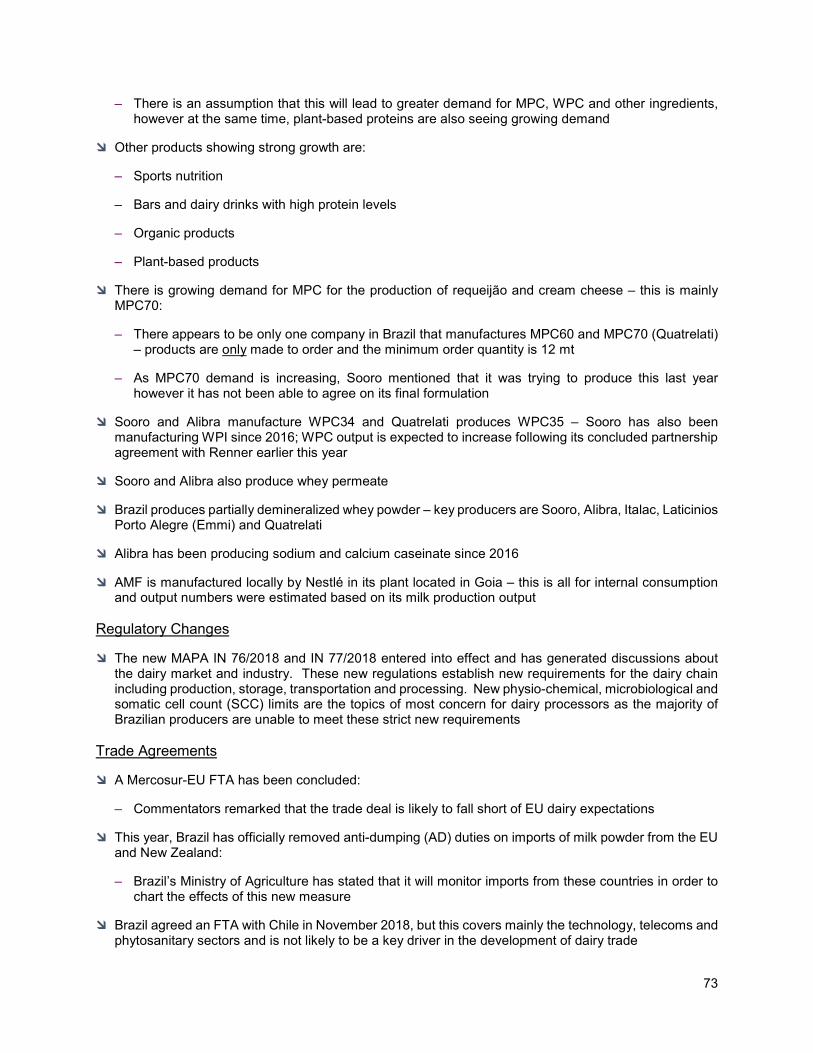
73
– There is an assumption that this will lead to greater demand for MPC, WPC and other ingredients, however at the same time, plant-based proteins are also seeing growing demand
Other products showing strong growth are:
– Sports nutrition
– Bars and dairy drinks with high protein levels
– Organic products
– Plant-based products
There is growing demand for MPC for the production of requeijão and cream cheese – this is mainly MPC70:
– There appears to be only one company in Brazil that manufactures MPC60 and MPC70 (Quatrelati) – products are only made to order and the minimum order quantity is 12 mt
– As MPC70 demand is increasing, Sooro mentioned that it was trying to produce this last year however it has not been able to agree on its final formulation
Sooro and Alibra manufacture WPC34 and Quatrelati produces WPC35 – Sooro has also been manufacturing WPI since 2016; WPC output is expected to increase following its concluded partnership agreement with Renner earlier this year
Sooro and Alibra also produce whey permeate
Brazil produces partially demineralized whey powder – key producers are Sooro, Alibra, Italac, Laticinios Porto Alegre (Emmi) and Quatrelati
Alibra has been producing sodium and calcium caseinate since 2016
AMF is manufactured locally by Nestlé in its plant located in Goia – this is all for internal consumption and output numbers were estimated based on its milk production output
Regulatory Changes
The new MAPA IN 76/2018 and IN 77/2018 entered into effect and has generated discussions about the dairy market and industry. These new regulations establish new requirements for the dairy chain including production, storage, transportation and processing. New physio-chemical, microbiological and somatic cell count (SCC) limits are the topics of most concern for dairy processors as the majority of Brazilian producers are unable to meet these strict new requirements
Trade Agreements
A Mercosur-EU FTA has been concluded:
– Commentators remarked that the trade deal is likely to fall short of EU dairy expectations
This year, Brazil has officially removed anti-dumping (AD) duties on imports of milk powder from the EU and New Zealand:
– Brazil’s Ministry of Agriculture has stated that it will monitor imports from these countries in order to chart the effects of this new measure
Brazil agreed an FTA with Chile in November 2018, but this covers mainly the technology, telecoms and phytosanitary sectors and is not likely to be a key driver in the development of dairy trade
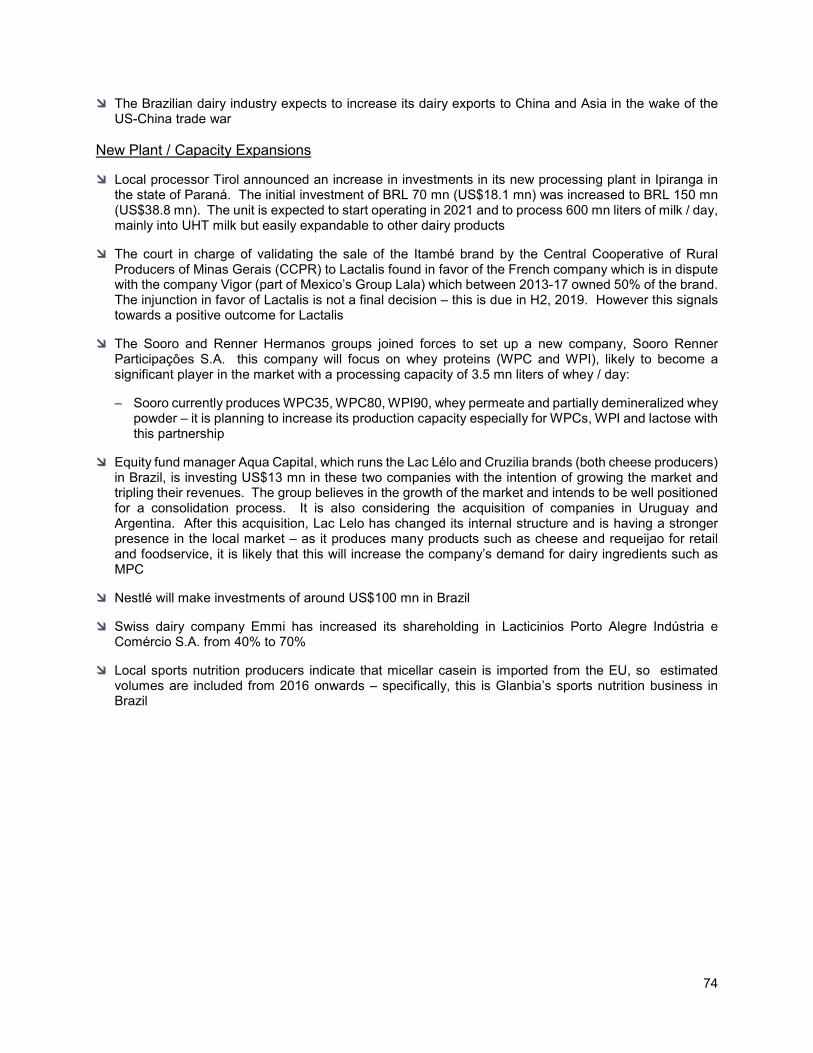
74
The Brazilian dairy industry expects to increase its dairy exports to China and Asia in the wake of the US-China trade war
New Plant / Capacity Expansions
Local processor Tirol announced an increase in investments in its new processing plant in Ipiranga in the state of Paraná. The initial investment of BRL 70 mn (US$18.1 mn) was increased to BRL 150 mn (US$38.8 mn). The unit is expected to start operating in 2021 and to process 600 mn liters of milk / day, mainly into UHT milk but easily expandable to other dairy products
The court in charge of validating the sale of the Itambé brand by the Central Cooperative of Rural Producers of Minas Gerais (CCPR) to Lactalis found in favor of the French company which is in dispute with the company Vigor (part of Mexico’s Group Lala) which between 2013-17 owned 50% of the brand. The injunction in favor of Lactalis is not a final decision – this is due in H2, 2019. However this signals towards a positive outcome for Lactalis
The Sooro and Renner Hermanos groups joined forces to set up a new company, Sooro Renner Participaçôes S.A. this company will focus on whey proteins (WPC and WPI), likely to become a significant player in the market with a processing capacity of 3.5 mn liters of whey / day:
– Sooro currently produces WPC35, WPC80, WPI90, whey permeate and partially demineralized whey powder – it is planning to increase its production capacity especially for WPCs, WPI and lactose with this partnership
Equity fund manager Aqua Capital, which runs the Lac Lélo and Cruzilia brands (both cheese producers) in Brazil, is investing US$13 mn in these two companies with the intention of growing the market and tripling their revenues. The group believes in the growth of the market and intends to be well positioned for a consolidation process. It is also considering the acquisition of companies in Uruguay and Argentina. After this acquisition, Lac Lelo has changed its internal structure and is having a stronger presence in the local market – as it produces many products such as cheese and requeijao for retail and foodservice, it is likely that this will increase the company’s demand for dairy ingredients such as MPC
Nestlé will make investments of around US$100 mn in Brazil
Swiss dairy company Emmi has increased its shareholding in Lacticinios Porto Alegre Indústria e Comércio S.A. from 40% to 70%
Local sports nutrition producers indicate that micellar casein is imported from the EU, so estimated volumes are included from 2016 onwards – specifically, this is Glanbia’s sports nutrition business in Brazil
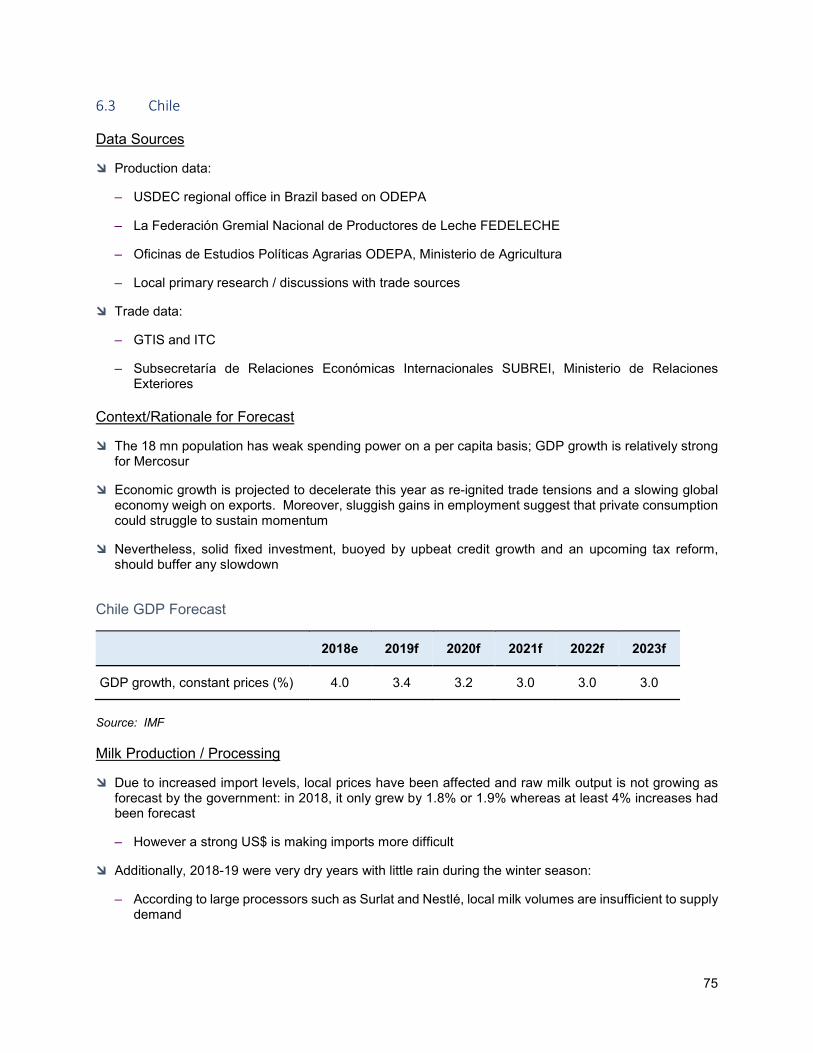
75
6.3 Chile Data Sources
Production data:
– USDEC regional office in Brazil based on ODEPA
– La Federación Gremial Nacional de Productores de Leche FEDELECHE
– Oficinas de Estudios Políticas Agrarias ODEPA, Ministerio de Agricultura
– Local primary research / discussions with trade sources
Trade data:
– GTIS and ITC
– Subsecretaría de Relaciones Económicas Internacionales SUBREI, Ministerio de Relaciones Exteriores
Context/Rationale for Forecast
The 18 mn population has weak spending power on a per capita basis; GDP growth is relatively strong for Mercosur
Economic growth is projected to decelerate this year as re-ignited trade tensions and a slowing global economy weigh on exports. Moreover, sluggish gains in employment suggest that private consumption could struggle to sustain momentum
Nevertheless, solid fixed investment, buoyed by upbeat credit growth and an upcoming tax reform, should buffer any slowdown
Chile GDP Forecast
2018e 2019f 2020f 2021f 2022f 2023f
GDP growth, constant prices (%) 4.0 3.4 3.2 3.0 3.0 3.0
Source: IMF Milk Production / Processing
Due to increased import levels, local prices have been affected and raw milk output is not growing as forecast by the government: in 2018, it only grew by 1.8% or 1.9% whereas at least 4% increases had been forecast
– However a strong US$ is making imports more difficult
Additionally, 2018-19 were very dry years with little rain during the winter season:
– According to large processors such as Surlat and Nestlé, local milk volumes are insufficient to supply demand
76
– At the same time, producers claim that cost increases are stopping milk producers from making further investments
– In February 2019, Prolesur and Watt’s, two of the major raw milk buyers in the country, announced lower milk prices – this news was not welcome by the different producer associations
Current milk prices remain relatively high
Chile’s Oficina de Estudios y Políticas Agrarias (ODEPA), part of the Ministry of Agriculture, collects production statistics directly from the milk processors to check what type of products raw milk is used for:
– It publishes much reduced SMP production for 2018, whereas more raw milk was diverted into WMP, partially skimmed milk powder and pasteurized milk
– Chile is not traditionally a big SMP producer and industry sources see this drop in local production as a revision to more usual levels
– Generally, Chile has a deficit in SMP and butter
– Milk reception in 2019 so far has been flat or shown a slightly downward trend, which means there will be less WMP – milk prices are currently too high to make WMP viable / profitable
Whey products:
– Prolesur (Soprole) is currently producing WPC34, whey permeate and DWP locally
– Schwager (Lácteos y Energía) is currently producing WPC34 locally – but need to buy this in from other sources so only produce if they can buy in whey
– Most WPC34 is used in blends for Chile’s National Health Service programs as long as it is competitive
– Surlat is currently producing WPC50-89.9 locally – actual volumes could not be confirmed so we estimate this to be around 100 mt annually
– Prolesur (Fonterra) used to send some whey permeate to South Korea under a trade deal, with small volumes going to South East Asia
However the quality of this product was poor and it was useful for stockfeed only – this trade was basically simply disposal of a by-product and has since stopped
Production capacity was a round 100 mt / month, however Prolesur now has the option to produce WPC instead, or to sell liquid whey to the Government’s health programs
Nestlé is producing AMF locally – estimates are in the region of 5,000 mt, only in the summer when there is surplus fat:
– Some of this is exported to Peru
Loncoleche is apparently producing some batches of lactose as a trial, but there has been no commercial use / sale of these products yet:
– Lactose is generally used as a cheap filler to standardize milk powder
HS code 0404.90 includes MPCs as well as dairy preparations (incl dairy blends) – it is estimated that these may make up around 40% of the total import volume and have therefore been excluded from the database numbers
77
Regulations
Since 2015, dairy imports have broken records year after year – in December 2018, local producers through the association FEDELECHE (the largest raw milk producers’ association) asked the Chilean Government to implement tariffs for a 2-year period; whilst this request was accepted for review, until now there has been no decision on this and analysts feel that this is unlikely to happen given that Chile is one of the countries with the most liberal trading regime in the region and that such a decision would hurt the interests of many other sectors
The Ministry of Agriculture has invited all producers to create joint ventures with other local companies to reduce costs and increase competitiveness in international markets:
– Some small to medium-sized companies have already formed these partnerships and there are several examples of successful joint ventures
New labelling regulations with warnings on high content of sodium, sugar, saturated fat and calories from 2016 are leading to dairy products receiving more attention
There is a draft law running through Senate which requires the mandatory presence on the label of the origin of milk used in the production of dairy products – this is a purely political move against imports
Trade Agreements
Chile deepened its longstanding commitment to trade liberalization with the signing of a free trade agreement with the US, effective 1 January 2004. Chile has 26 trade agreements covering 60 countries including agreements with the EU (currently a modernization of the FTA is under negotiation), Mercosur, China, India, South Korea, and Mexico. In May 2010, Chile signed the OECD Convention, becoming the first South American country to join the OECD. In October 2015, Chile signed the Trans-Pacific Partnership trade agreement, which was finalized as the Comprehensive and Progressive Trans-Pacific Partnership (CPTPP) and signed at a ceremony in Chile in March 2018. CTTPP negotiations with New Zealand are ongoing
Consumption / Market Trends
Overall, the Chilean dairy market is sluggish – the economy is growing only slowly, retail sales are down and a large part of the population is still poor and extremely price conscious
The Chilean Government is implementing programs to increase dairy consumption among children with the goal to increase per capita consumption from 161 L to 175 L. There are also plans to introduce other dairy products / ingredients as components of daily school meals in public schools
Increasing numbers of Chilean consumers are focusing on healthier food and the nutritional content of purchased food products:
– However a lot of people still don’t have a lot of disposable income and price is key
There is strong growth in products with higher protein levels, including yogurt, milk and dairy beverages – this is increasing the demand for MPC and WPC:
– Key producers / brands in this segment are Soprole, LoncoLeche (Watt’s), Nestlé, Colun and Surlat Plant / Capacity Expansions
Saputo has been investigating potential investment in Chile since February 2019 but no official decision has been announced yet
78
Colun – the only cooperative in the country and therefore not paying tax – purchased 32,000 sq m of land in Chile in January 2019 in order to build a new distribution center
Generally, Chile lacks volume so will never be a huge player in the international market – the only products for consistent exports are WMP and cheese
Future volumes will depend to a large extent on what Fonterra’s plans are with their Chilean investments of Prolesur and Soprole – as the company aims to reduce its debt, it depends on its strategy for Brazil and its farming operations in China – it is uncertain whether the Chilean investment is also on the list to be axed
There is talk of some local investments in plants, but in the past these have not been very successful as they have lacked critical mass – however, some wealthy local businessmen are interested
79
6.4 Colombia Data Sources
Production data:
– Asoleche
– Analac
– Ministry of Agriculture
– Interviews with key processors / trade sources
We have revised SWP data upwards for previous years due to a difference in sources:
– Production data in previous years was mainly based on Asoleche, which excludes whey products for feed applications
– This year we have used figures from the Ministry of Agriculture, which include whey products for feed applications – we have therefore revised the production numbers up for the period 2014-18
Trade data:
– GTIS and ITC
– Dirección de Impuestos y Aduanas Nacionales DIAN
– Legiscomex shipping data for 2018 – as this does not go into sufficient detail, the whey codes / numbers have been cross-checked with a personal contact at a large freight forwarder who knows dairy imports extremely well and can interpret the Legiscomex / DIAN numbers
– Based on these results, we have revised the 2014-17 data too to reflect the 2018 splits more closely Context/Rationale for Forecast
The 49 mn population, growing by around 0.8%, has weak spending power on a per capita basis; GDP growth is relatively strong for the region however
Colombia’s economic development is hampered by inadequate infrastructure, poverty, narco-trafficking and an uncertain security situation, in addition to heavy reliance on primary commodities with little value-adding
Colombia GDP Forecast 2018e 2019f 2020f 2021f 2022f 2023f
GDP growth, constant prices (%) 2.7 3.5 3.6 3.7 3.7 3.7
Source: IMF Milk Production
Fresh milk production grew by 11% last year – cooperation programs between the large processors such as Alpina, Alqueria and Colanta with local farmers have improved the milk’s solid contents and overall quality
80
42% of drinking milk is sold through informal channels and under regulated milk prices, with lower quality milk used to further process it into consumer products other than drinking milk
Colombian production levels are among the highest in the region and a healthy industry supports local producers:
– Colombia’s food industry is also growing fast which is making dairy more important as a food ingredient rather than just drinking milk
Improvements in the country’s social and security situation has opened wider regions to the national dairy industry and market, where previously production was either too expensive or impossible due to security reasons:
– Cost reductions in transport, labor, commerce etc in these regions is helping milk producers and processors to improver technology and invest in expansion
Stock levels are normal as the industry is balanced – production growth and imports push prices down but growing exports balance the market out to avoid overstocking
There has been a big push on whey production – in less than four years, production of SWP has doubled due to official programs and efforts from academia to educate producers on the correct utilization and commercialization of whey:
– Support from the industrial sector by the main companies has also been a factor in this growth
Most of the locally-produced milk powder (esp WMP) is for local consumption – previously Venezuela was the main buyer of Colombian WMP but payment issues given the current situation within Venezuela have led to Colombian producers to avoid that market:
– Other natural export markets such as Ecuador, Panama and Costa Rica have phytosanitary restrictions or high tariffs for Colombian dairy products
– However the loss of export markets is being balanced by strong growth in the domestic food processing market and a decline in imports
The last two years have seen an intense battle between margarine and butter producers with consumers now increasingly aware of the benefits and healthy attributes of butter – this is leading to a growth in butter output
Trade Agreements
Colombia has signed or is negotiating FTAs with more than a dozen countries – the Colombia – USA FTA went into effect in May 2012, however milk producers have requested that he Colombian Government keep dairy out of future FTAs
New Zealand will join the USA and Europe for which tariffs on dairy products will go to zero in 2026 and 2028 respectively
Consumption / Market Trends
A growing demand for healthy products is increasing industrial demand for WPC and MPC in any form or concentration – this is a fast-growing segment
Plant / Capacity Expansions
There are no reports of any significant investments in plant or capacity

81
Danone and Alquería are dissolving their JV, and Alquería is now starting to produce a wide assortment of dairy products both for B2B and B2C
Alpina has made some investment in its plants (around US$35 mn) but this has been on beverage lines, not dairy lines
82
6.5 Guatemala
Data Sources
Production data: There are no or few official production statistics for dairy production in Guatemala:
– One source consulted is the Ministerio de Economía
– Our production numbers are estimates made by the Guatemala Producers’ Association
– The biggest local production is butter, most of which is produced by small artisanal producers who do not keep records in order to avoid taxation – this is sold though informal channels, hence there is only a poor record in dairy products manufacture and sales in Guatemala
Trade data: GTIS and ITC, Ministerio de Economía, Legiscomex:
– Note: ITC data not yet available for 20108 so for this year, the source is GTIS only. However, generally, GTIS and ITC data are in close agreement
– In Guatemala, as is the case in other countries in the region, it is hard to differentiate products by HS code only as these are often interchanged freely:
WPC34 enters under HS Code 0404.10and 3502.20- which should be reserved for the higher concentration WPCs (80 plus) and WPI
Conversely, imports of WPC80 / WPI can also be found under 0404.10, not just 3502.20
SWP and DWP is imported under 0404.10 and 0404.90 (which is strange given that 0404.90 attracts 6% duty compared to zero duty for 0404.10)
MPC, which should enter under 0404.90, also comes in under 3502.20 which should be reserved for WPCs
– Our estimates of trade volumes is therefore based on a mixture of trade data analysis, analysis of shipment data for 2018 and best estimates made on the basis of discussions with industry / trade
Context/Rationale for Forecast
With a population of 16.6 mn growing annually at 1.93%, Guatemala is the most populous country in Central America, with a GDP per capita roughly half the average for Latin America and the Caribbean:
– The agricultural sector accounts for 13.5% of GDP and 31% of the labor force
Guatemala is the top remittance recipient in Central America as a result of Guatemala's large expatriate community in the US – these inflows are a primary source of foreign income, equivalent to two-thirds of the country's exports and about a tenth of its GDP
The 1996 peace accords, which ended 36 years of civil war, removed a major obstacle to foreign investment, and Guatemala has since pursued important reforms and macroeconomic stabilization. The Dominican Republic-Central America Free Trade Agreement (CAFTA-DR) entered into force in July 2006, spurring increased investment and diversification of exports, with the largest increases in ethanol and non-traditional agricultural exports. While CAFTA-DR has helped improve the investment climate, concerns over security, the lack of skilled workers, and poor infrastructure continue to hamper foreign direct investment
Over the last few years, Guatemala has had one of the best economic performances in Latin America with a growth rate above 3% since 2012, reaching 4.1% in 2015. However, it ranks amongst the countries with the highest income inequality in Latin America:
83
– The distribution of income remains highly unequal with the richest 20% of the population accounting for more than 51% of Guatemala's overall consumption:
More than half of the population is below the national poverty line, and 23% of the population lives in extreme poverty
Poverty among indigenous groups, which make up more than 40% of the population, averages 79%, with 40% of the indigenous population living in extreme poverty
Nearly one-half of Guatemala's children under age five are chronically malnourished, one of the highest malnutrition rates in the world
That said, analysts believe that, given Guatemala’s further capacity for economic growth, there is an opportunity to reduce poverty, with accelerating economic growth crucial to achieve social objectives in the medium and longer term
Guatemala GDP Forecast 2018e 2019f 2020f 2021f 2022f 2023f
GDP growth, constant prices (%) 3.1 3.4 3.6 3.8 3.6 3.5
Source: IMF Milk Production
Only around 60% of Guatemala’s installed milk processing capacity is being utilized as there is a lack of quality local milk – additionally, it is hard for local processors to compete in a highly competitive market full of imported products
In terms of milk production, mediocre profitability, high costs, lack of logistics capacity and lack of investment (both from the public and private sector) hamper development of local milk production:
– There is no government involvement in the dairy sector, with dairy farming in private hand through the Chamber of Dairymen – there is generally weak management and most of milk production takes place with dual purpose herds
– Raw milk is generally sold at collection centers or to informal buyers for artisanal processing into cheese, cream and butter – it is estimated that only 20% of local raw milk is processed industrially
As an open market for imported products, especially fluid milk but also dairy ingredients for recombining, locally made products based on raw Guatemala milk find it hard to compete
This is leading to Guatemala becoming a significant net importer in the region
Guatemala is a producer and exporter of cheese, but only produces a small amount of whey – very small volumes have been exported lately:
– There are some efforts to utilize local whey which at present it is treated as waste:
The Universidad San Carlos has been working with cheese producer associations and small producers to encourage whey processing
Costa Rica’s Dos Pinos has also been working with local cheese producers to develop whey utilization (Guatemalan cheese is mainly exported to Costa Rica) but no commercial whey processing exists in the country as of yet
84
Regulatory Changes
At present, certain fractions of the dairy sector are arguing that there is unfair competition in the country due to a proliferation of lower-cost dairy imports and imported products being sold at lower prices than in their countries of origin (“dumping”) – the Chamber of Milk Producers announced that it will file a complaint to the Ministry of the Economy through the Directorate of Foreign Trade. However, the government at the same time is aiming to increase the usage of whey in dairy production, so there is doubt which products / ingredients this complaint will cover
Since the emergence of highly pathogenic avian influenza (H5N1) in the Dominican Republic (a member of the CAFTA-DR trade bloc), products of animal origin have been subject to intense examination since January 2019. The livestock sector is highly sensitive in Guatemala because most producers are small-scale with low levels of technology which cannot protect themselves from diseases, therefore all imported animal-origin products are currently under extra scrutiny before being allowed to enter the country
Trade Agreements
Guatemala is part of the CAFTA-DR-USA FTA, under which 95% of US agricultural exports can enter the country duty free, with the remaining 5% on 5- or 10-year tariff phase-outs (0404.90, currently at 6% duty, will become duty free in 2020)
In addition to CAFTA-DR-USA, Guatemala has signed bilateral or regional FTAs with Chile, Mexico, Colombia, Taiwan, Panama, the EU, Peru and the European Free Trade Area (EFTA) and is currently negotiating an FTA with South Korea – it has also signed partial scope agreements with Belize, Ecuador, Cuba, Trinidad & Tobago and Venezuela which cover a reduced number of products
Central America established a common external tariff schedule in 1998 and the so-called “Northern Triangle” countries (Guatemala, El Salvador and Honduras) are moving towards fuller integration in shape of a customs union. Honduras and Guatemala implemented the first stage of a customs union in 2017 with El Salvador starting negotiations to join this in October 2017
Plant / Capacity Expansion
Given that only an estimated 60% of industrial processing capacity in the country is utilized, there are no current efforts to increase capacity:
– It is not envisaged that there will be any capacity expansion investments in the near future – at the contrary, there is actually some divestment for some mid-size milk producers of fresh milk and cheese
– Costa Rican company Dos Pinos has had a plant in Guatemala since 2007 and has been updating this, but this has not included an expansion of capacity
– Investments by current players are very small and there are no reports of new entrants into the market / industry
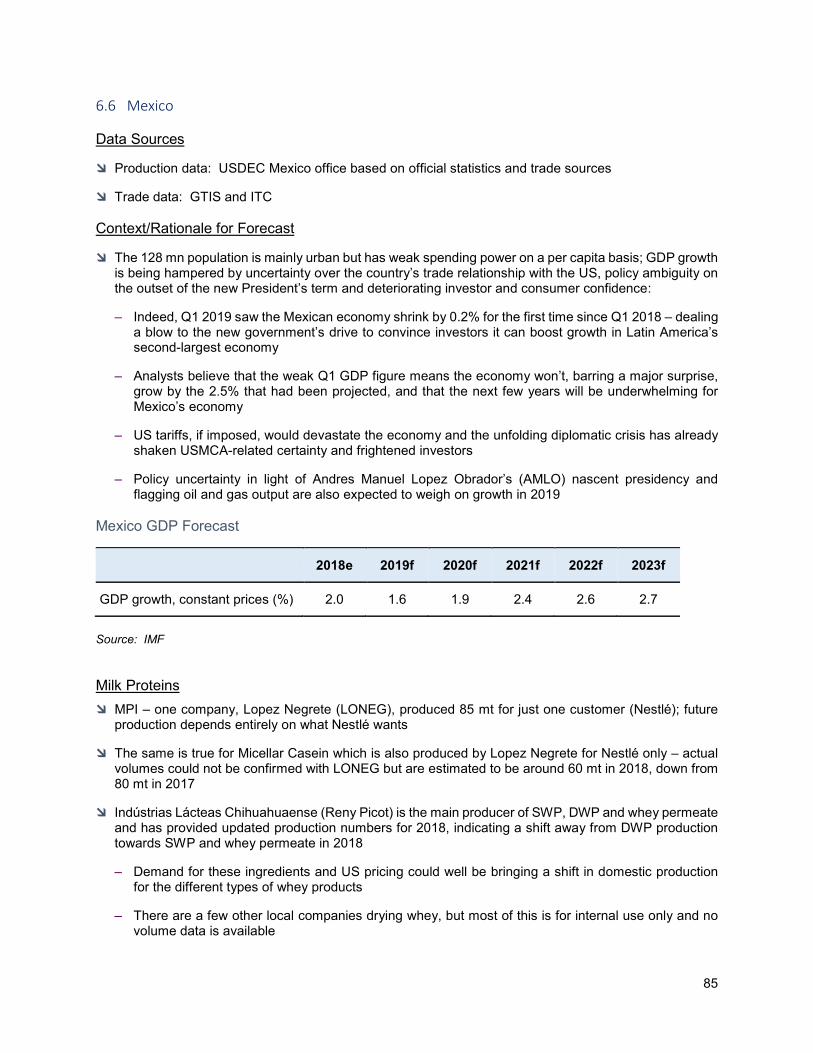
85
6.6 Mexico Data Sources
Production data: USDEC Mexico office based on official statistics and trade sources
Trade data: GTIS and ITC Context/Rationale for Forecast
The 128 mn population is mainly urban but has weak spending power on a per capita basis; GDP growth is being hampered by uncertainty over the country’s trade relationship with the US, policy ambiguity on the outset of the new President’s term and deteriorating investor and consumer confidence:
– Indeed, Q1 2019 saw the Mexican economy shrink by 0.2% for the first time since Q1 2018 – dealing a blow to the new government’s drive to convince investors it can boost growth in Latin America’s second-largest economy
– Analysts believe that the weak Q1 GDP figure means the economy won’t, barring a major surprise, grow by the 2.5% that had been projected, and that the next few years will be underwhelming for Mexico’s economy
– US tariffs, if imposed, would devastate the economy and the unfolding diplomatic crisis has already shaken USMCA-related certainty and frightened investors
– Policy uncertainty in light of Andres Manuel Lopez Obrador’s (AMLO) nascent presidency and flagging oil and gas output are also expected to weigh on growth in 2019
Mexico GDP Forecast
2018e 2019f 2020f 2021f 2022f 2023f
GDP growth, constant prices (%) 2.0 1.6 1.9 2.4 2.6 2.7
Source: IMF Milk Proteins MPI – one company, Lopez Negrete (LONEG), produced 85 mt for just one customer (Nestlé); future
production depends entirely on what Nestlé wants
The same is true for Micellar Casein which is also produced by Lopez Negrete for Nestlé only – actual volumes could not be confirmed with LONEG but are estimated to be around 60 mt in 2018, down from 80 mt in 2017
Indústrias Lácteas Chihuahuaense (Reny Picot) is the main producer of SWP, DWP and whey permeate and has provided updated production numbers for 2018, indicating a shift away from DWP production towards SWP and whey permeate in 2018
– Demand for these ingredients and US pricing could well be bringing a shift in domestic production for the different types of whey products
– There are a few other local companies drying whey, but most of this is for internal use only and no volume data is available
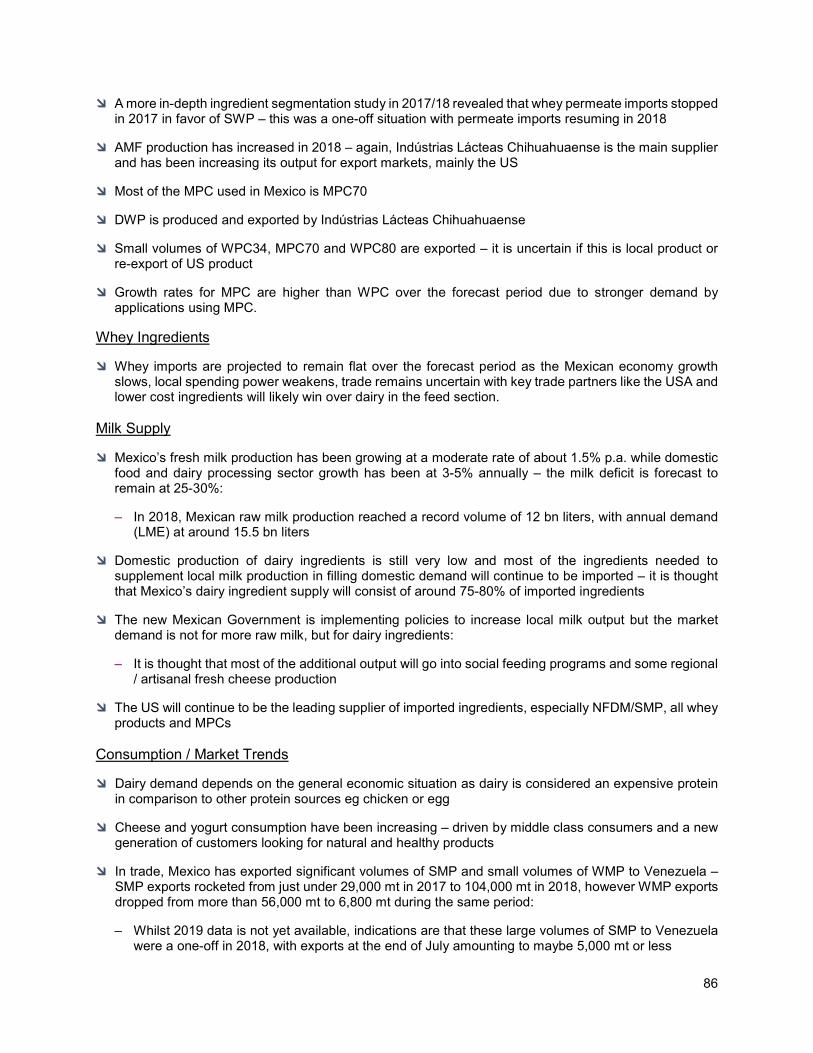
86
A more in-depth ingredient segmentation study in 2017/18 revealed that whey permeate imports stopped in 2017 in favor of SWP – this was a one-off situation with permeate imports resuming in 2018
AMF production has increased in 2018 – again, Indústrias Lácteas Chihuahuaense is the main supplier and has been increasing its output for export markets, mainly the US
Most of the MPC used in Mexico is MPC70
DWP is produced and exported by Indústrias Lácteas Chihuahuaense
Small volumes of WPC34, MPC70 and WPC80 are exported – it is uncertain if this is local product or re-export of US product
Growth rates for MPC are higher than WPC over the forecast period due to stronger demand by applications using MPC.
Whey Ingredients
Whey imports are projected to remain flat over the forecast period as the Mexican economy growth slows, local spending power weakens, trade remains uncertain with key trade partners like the USA and lower cost ingredients will likely win over dairy in the feed section.
Milk Supply
Mexico’s fresh milk production has been growing at a moderate rate of about 1.5% p.a. while domestic food and dairy processing sector growth has been at 3-5% annually – the milk deficit is forecast to remain at 25-30%:
– In 2018, Mexican raw milk production reached a record volume of 12 bn liters, with annual demand (LME) at around 15.5 bn liters
Domestic production of dairy ingredients is still very low and most of the ingredients needed to supplement local milk production in filling domestic demand will continue to be imported – it is thought that Mexico’s dairy ingredient supply will consist of around 75-80% of imported ingredients
The new Mexican Government is implementing policies to increase local milk output but the market demand is not for more raw milk, but for dairy ingredients:
– It is thought that most of the additional output will go into social feeding programs and some regional / artisanal fresh cheese production
The US will continue to be the leading supplier of imported ingredients, especially NFDM/SMP, all whey products and MPCs
Consumption / Market Trends
Dairy demand depends on the general economic situation as dairy is considered an expensive protein in comparison to other protein sources eg chicken or egg
Cheese and yogurt consumption have been increasing – driven by middle class consumers and a new generation of customers looking for natural and healthy products
In trade, Mexico has exported significant volumes of SMP and small volumes of WMP to Venezuela – SMP exports rocketed from just under 29,000 mt in 2017 to 104,000 mt in 2018, however WMP exports dropped from more than 56,000 mt to 6,800 mt during the same period:
– Whilst 2019 data is not yet available, indications are that these large volumes of SMP to Venezuela were a one-off in 2018, with exports at the end of July amounting to maybe 5,000 mt or less
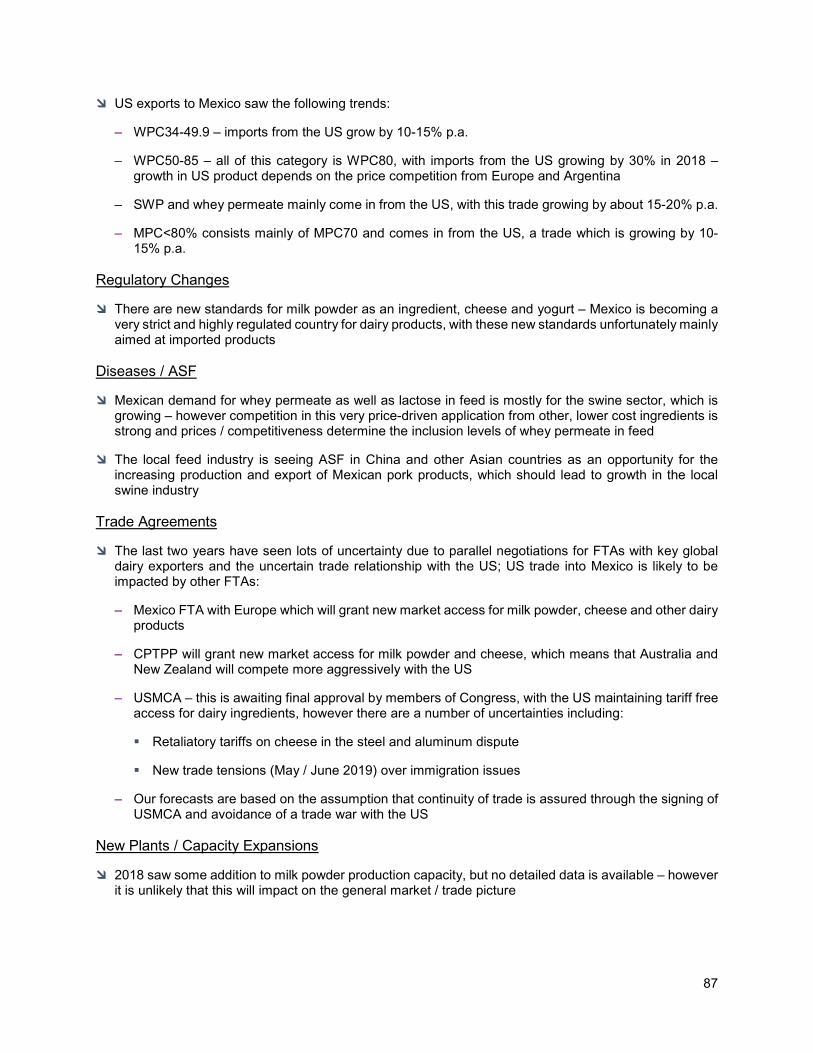
87
US exports to Mexico saw the following trends:
– WPC34-49.9 – imports from the US grow by 10-15% p.a.
– WPC50-85 – all of this category is WPC80, with imports from the US growing by 30% in 2018 – growth in US product depends on the price competition from Europe and Argentina
– SWP and whey permeate mainly come in from the US, with this trade growing by about 15-20% p.a.
– MPC<80% consists mainly of MPC70 and comes in from the US, a trade which is growing by 10-15% p.a.
Regulatory Changes
There are new standards for milk powder as an ingredient, cheese and yogurt – Mexico is becoming a very strict and highly regulated country for dairy products, with these new standards unfortunately mainly aimed at imported products
Diseases / ASF
Mexican demand for whey permeate as well as lactose in feed is mostly for the swine sector, which is growing – however competition in this very price-driven application from other, lower cost ingredients is strong and prices / competitiveness determine the inclusion levels of whey permeate in feed
The local feed industry is seeing ASF in China and other Asian countries as an opportunity for the increasing production and export of Mexican pork products, which should lead to growth in the local swine industry
Trade Agreements
The last two years have seen lots of uncertainty due to parallel negotiations for FTAs with key global dairy exporters and the uncertain trade relationship with the US; US trade into Mexico is likely to be impacted by other FTAs:
– Mexico FTA with Europe which will grant new market access for milk powder, cheese and other dairy products
– CPTPP will grant new market access for milk powder and cheese, which means that Australia and New Zealand will compete more aggressively with the US
– USMCA – this is awaiting final approval by members of Congress, with the US maintaining tariff free access for dairy ingredients, however there are a number of uncertainties including:
Retaliatory tariffs on cheese in the steel and aluminum dispute
New trade tensions (May / June 2019) over immigration issues
– Our forecasts are based on the assumption that continuity of trade is assured through the signing of USMCA and avoidance of a trade war with the US
New Plants / Capacity Expansions
2018 saw some addition to milk powder production capacity, but no detailed data is available – however it is unlikely that this will impact on the general market / trade picture
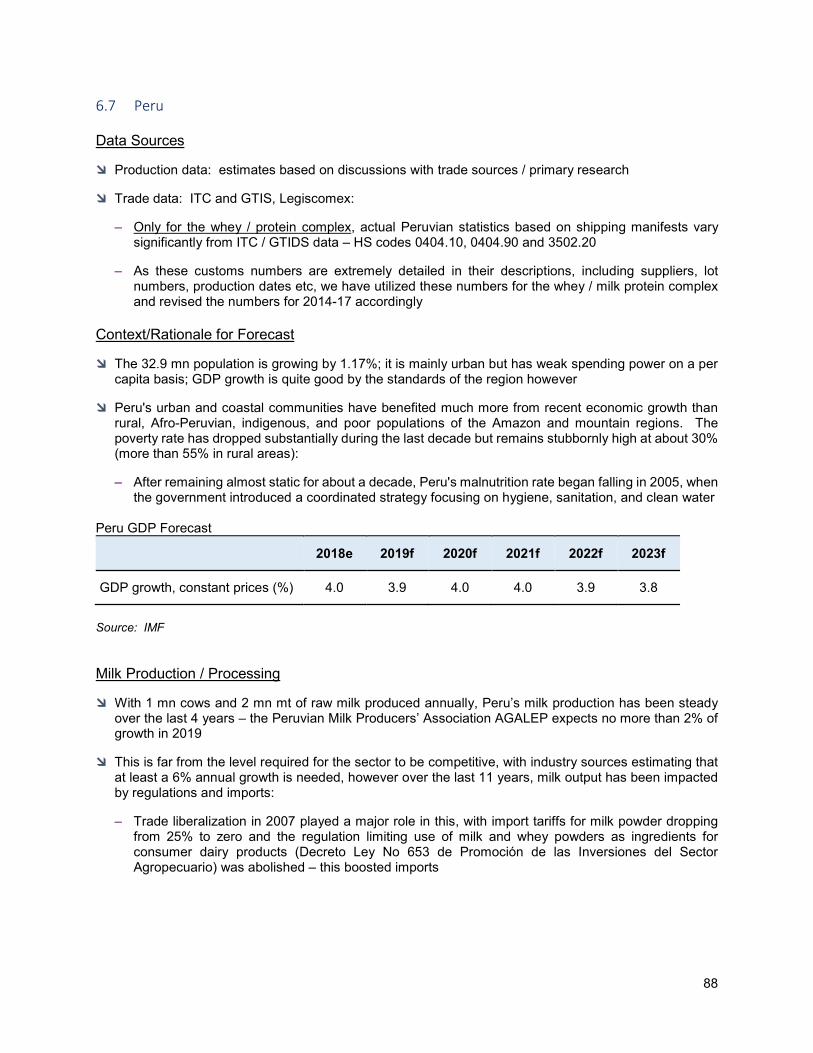
88
6.7 Peru Data Sources
Production data: estimates based on discussions with trade sources / primary research
Trade data: ITC and GTIS, Legiscomex:
– Only for the whey / protein complex, actual Peruvian statistics based on shipping manifests vary significantly from ITC / GTIDS data – HS codes 0404.10, 0404.90 and 3502.20
– As these customs numbers are extremely detailed in their descriptions, including suppliers, lot numbers, production dates etc, we have utilized these numbers for the whey / milk protein complex and revised the numbers for 2014-17 accordingly
Context/Rationale for Forecast
The 32.9 mn population is growing by 1.17%; it is mainly urban but has weak spending power on a per capita basis; GDP growth is quite good by the standards of the region however
Peru's urban and coastal communities have benefited much more from recent economic growth than rural, Afro-Peruvian, indigenous, and poor populations of the Amazon and mountain regions. The poverty rate has dropped substantially during the last decade but remains stubbornly high at about 30% (more than 55% in rural areas):
– After remaining almost static for about a decade, Peru's malnutrition rate began falling in 2005, when the government introduced a coordinated strategy focusing on hygiene, sanitation, and clean water
Peru GDP Forecast 2018e 2019f 2020f 2021f 2022f 2023f
GDP growth, constant prices (%) 4.0 3.9 4.0 4.0 3.9 3.8
Source: IMF Milk Production / Processing
With 1 mn cows and 2 mn mt of raw milk produced annually, Peru’s milk production has been steady over the last 4 years – the Peruvian Milk Producers’ Association AGALEP expects no more than 2% of growth in 2019
This is far from the level required for the sector to be competitive, with industry sources estimating that at least a 6% annual growth is needed, however over the last 11 years, milk output has been impacted by regulations and imports:
– Trade liberalization in 2007 played a major role in this, with import tariffs for milk powder dropping from 25% to zero and the regulation limiting use of milk and whey powders as ingredients for consumer dairy products (Decreto Ley No 653 de Promoción de las Inversiones del Sector Agropecuario) was abolished – this boosted imports
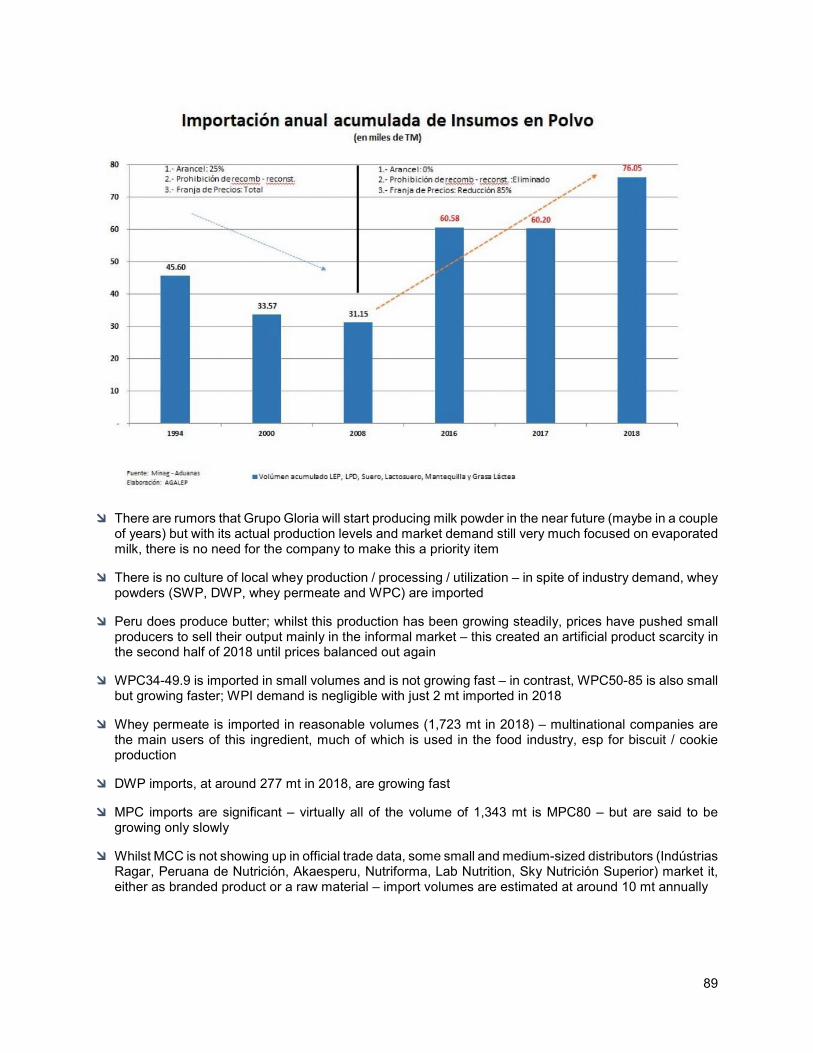
89
There are rumors that Grupo Gloria will start producing milk powder in the near future (maybe in a couple of years) but with its actual production levels and market demand still very much focused on evaporated milk, there is no need for the company to make this a priority item
There is no culture of local whey production / processing / utilization – in spite of industry demand, whey powders (SWP, DWP, whey permeate and WPC) are imported
Peru does produce butter; whilst this production has been growing steadily, prices have pushed small producers to sell their output mainly in the informal market – this created an artificial product scarcity in the second half of 2018 until prices balanced out again
WPC34-49.9 is imported in small volumes and is not growing fast – in contrast, WPC50-85 is also small but growing faster; WPI demand is negligible with just 2 mt imported in 2018
Whey permeate is imported in reasonable volumes (1,723 mt in 2018) – multinational companies are the main users of this ingredient, much of which is used in the food industry, esp for biscuit / cookie production
DWP imports, at around 277 mt in 2018, are growing fast
MPC imports are significant – virtually all of the volume of 1,343 mt is MPC80 – but are said to be growing only slowly
Whilst MCC is not showing up in official trade data, some small and medium-sized distributors (Indústrias Ragar, Peruana de Nutrición, Akaesperu, Nutriforma, Lab Nutrition, Sky Nutrición Superior) market it, either as branded product or a raw material – import volumes are estimated at around 10 mt annually
90
Regulatory Changes / Consumption And Market Trends
Production plants are increasingly relying on imported milk powder for recombining:
– Peruvian law is flexible with what the industry can call “milk”, so powdered ingredients are used in significant volumes to make final consumer dairy products
– Grupo Gloria, Peru’s largest dairy processor, is engaged in strong lobbying to congress to keep it this way as it is more profitable to recombine from imported ingredients than purchasing from local producers
– Even though local farmers / producers are pressuring the government to re-instate the 25% import tariff on milk / dairy powders, Peru is lacking the land needed to bring up local milk production sufficiently to cover demand, therefore this is not a realistic possibility
Following a 2017 scandal on whether Gloria’s / other local brands products are really milk, consumers were demanding more “proper” milk products based on local raw milk or milk powder rather than whey-based ingredients:
– As a consequence, fresh, pasteurized and UHT milk grew by 15%
– Milk powder imports grew as well whereas whey powder imports stayed constant
– Local processors were forced to reduce whey usage in final consumer products in order for their products to be accepted in the market
Peru is the only country in APEC not belonging to the OECD – one of the reasons for this are discrepancies in nutritional standards / legislation, mainly based on the dairy chapter:
– However the Peruvian Government does not see changes in nutritional regulations as a priority as it is more concerned about larger issues such as corruption levels and taxation laws
– It is therefore likely that whey powder will remain an important ingredient with a high import volume
As in many other countries, the demand for plant-based products is growing
Alejandro Daly, President of the Dairy Committee of the National Society of Industries (SNI), stated that the transporters’ strike in February 2019 affected more than 6,000 local farmers in the north of the country and that these lost more than 300 mt of raw milk per day
91
6.8 Uruguay
Data Sources
Production data:
– Instituto Nacional de la Leche INALE
– Trade and industry sources
Trade data:
– GTIS and ITC
– Legiscomex shipment data Context/Rationale for Forecast
The 3 mn population is mainly urban but has relatively good spending power on a per capita basis and GDP growth by the standards of the region
Uruguay GDP Forecast
2018e 2019f 2020f 2021f 2022f 2023f
GDP growth, constant prices (%) 2.1 1.9 3.0 3.0 3.0 3.0
Source: IMF Milk Production
2018 was a good year for milk producers and dairy processors, with 2019 following this trend so far
International prices have helped producers and many farms managed to save themselves from imminent bankruptcy:
– International prices make the Uruguayan market that interesting that even Peru’s Grupo Gloria has decided to re-open its Uruguayan operation Ecolat in June 2019, processing 50,000 liters / day
Ecolat was closed some 4 years ago
– During the first 5 months of 2019, exports increased by 19% over the same period in 2018 due to increases in raw milk production
– Prices are expected to rise due to increasing demand from China, a slowdown in the global raw milk output and Ecolat’s re-opening
In the last 6 years, the number of dairy farms has decreased by 18% but the volume of milk sent for industrial processing has increased by 30% – this illustrates the ongoing industrialization and investment of Uruguay’s remaining dairy farming sector:
– The main reason for the closure of 650 dairy farming operations was internal cost / lack of profitability
2015 was the last year that Uruguay exported milk powder to Venezuela, and processors have been looking for new, non-traditional export markets – this is how, in 2018, Algeria for the first time has
92
become a customer for Uruguayan milk powder, purchasing 44% of the exported milk powder at a value of US$185 mn
Since 2017, WMP has been one of the key products with the highest growth in exports in terms of US$ values, with this trend continuing in 2018 – however, this increase was less marked in volume terms
Industry trends
Clearly, exports are key for the Uruguayan dairy industry
Small and medium-sized farmers connected with Conaprole have gone through a hard time – commodity prices have not helped them and Conaprole has political internal difficulties that have negatively impacted on confidence, efficiency and profitability:
– It is owed US$30 for exports to Venezuela
– It had to close a plant and its CEO has been dismissed
However, in other parts of the dairy sector, there is new confidence, with a feeling that the last few difficult years have given the sector the push it needed to modernize and look for new markets – several processors are planning to move away from commodities and invest in differentiated / value-added dairy products:
– A healthy industry is expecting accelerated growth and is looking to attract international investors over the next few years
– There is international investment coming into the industry and new markets are being opened, especially for non-traditional, value-added products
– Large companies and innovative processors are confident, supported by government plans to support the production of value-added, high-margin products
Regulatory Changes
The valorization of whey powder is being financially incentivized by the government and capabilities should increase – official programs financially support small producers of non-commodity and value-added whey products such as WPC
SWP producers receive loans and technical support to help them utilize whey Plant / Capacity Expansion
Peru’s Grupo Gloria is re-opening its Ecolat operation in Uruguay to initially process 50,000 liters / day:
– It has started operations at its Nueva Helvecia plant, focusing on cheese exports
Ex-employees of bankrupt processor Pili are in the process of opening a company to dry whey:
– It is part of the company’s plan to pay its former employees and that they will be able to utilize the company’s premises and machinery
– During Q3, 2019, the central bank will evaluate financial projects in order to determine whether to grant a loan for this venture
– Production is thought to be in the region of 50,000 liters of cheese whey / day to be dried
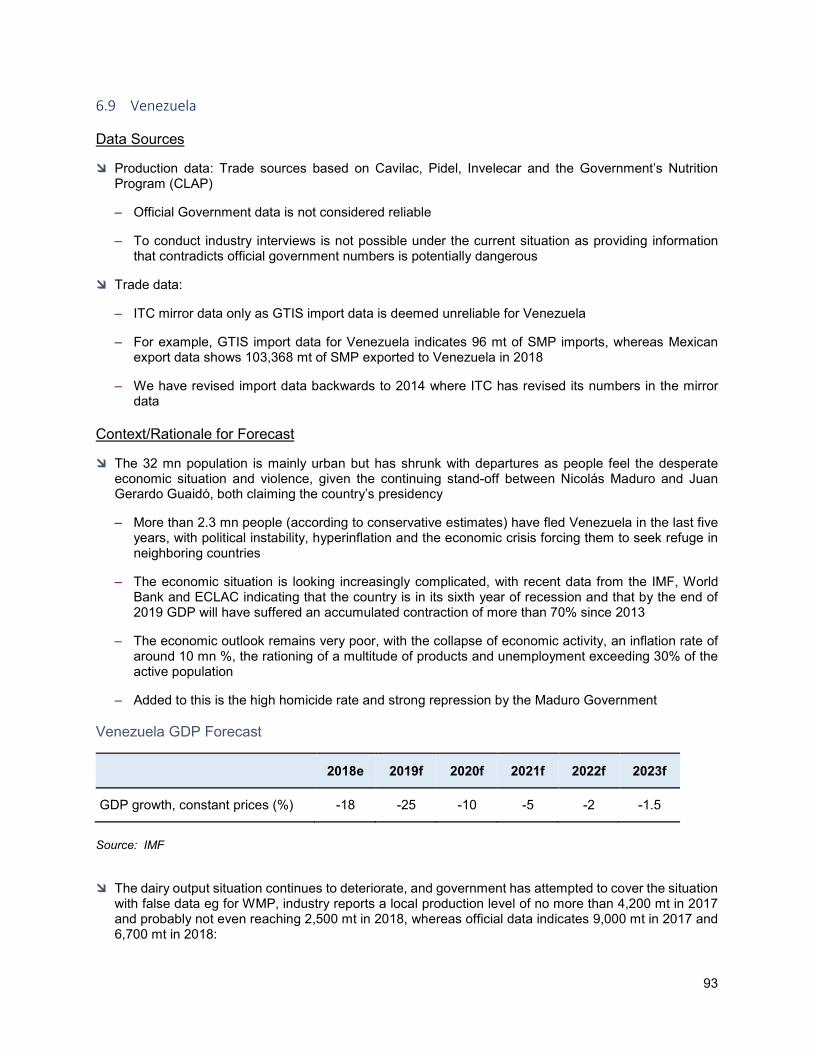
93
6.9 Venezuela Data Sources
Production data: Trade sources based on Cavilac, Pidel, Invelecar and the Government’s Nutrition Program (CLAP)
– Official Government data is not considered reliable
– To conduct industry interviews is not possible under the current situation as providing information that contradicts official government numbers is potentially dangerous
Trade data:
– ITC mirror data only as GTIS import data is deemed unreliable for Venezuela
– For example, GTIS import data for Venezuela indicates 96 mt of SMP imports, whereas Mexican export data shows 103,368 mt of SMP exported to Venezuela in 2018
– We have revised import data backwards to 2014 where ITC has revised its numbers in the mirror data
Context/Rationale for Forecast
The 32 mn population is mainly urban but has shrunk with departures as people feel the desperate economic situation and violence, given the continuing stand-off between Nicolás Maduro and Juan Gerardo Guaidó, both claiming the country’s presidency
– More than 2.3 mn people (according to conservative estimates) have fled Venezuela in the last five years, with political instability, hyperinflation and the economic crisis forcing them to seek refuge in neighboring countries
– The economic situation is looking increasingly complicated, with recent data from the IMF, World Bank and ECLAC indicating that the country is in its sixth year of recession and that by the end of 2019 GDP will have suffered an accumulated contraction of more than 70% since 2013
– The economic outlook remains very poor, with the collapse of economic activity, an inflation rate of around 10 mn %, the rationing of a multitude of products and unemployment exceeding 30% of the active population
– Added to this is the high homicide rate and strong repression by the Maduro Government Venezuela GDP Forecast
2018e 2019f 2020f 2021f 2022f 2023f
GDP growth, constant prices (%) -18 -25 -10 -5 -2 -1.5
Source: IMF
The dairy output situation continues to deteriorate, and government has attempted to cover the situation with false data eg for WMP, industry reports a local production level of no more than 4,200 mt in 2017 and probably not even reaching 2,500 mt in 2018, whereas official data indicates 9,000 mt in 2017 and 6,700 mt in 2018:
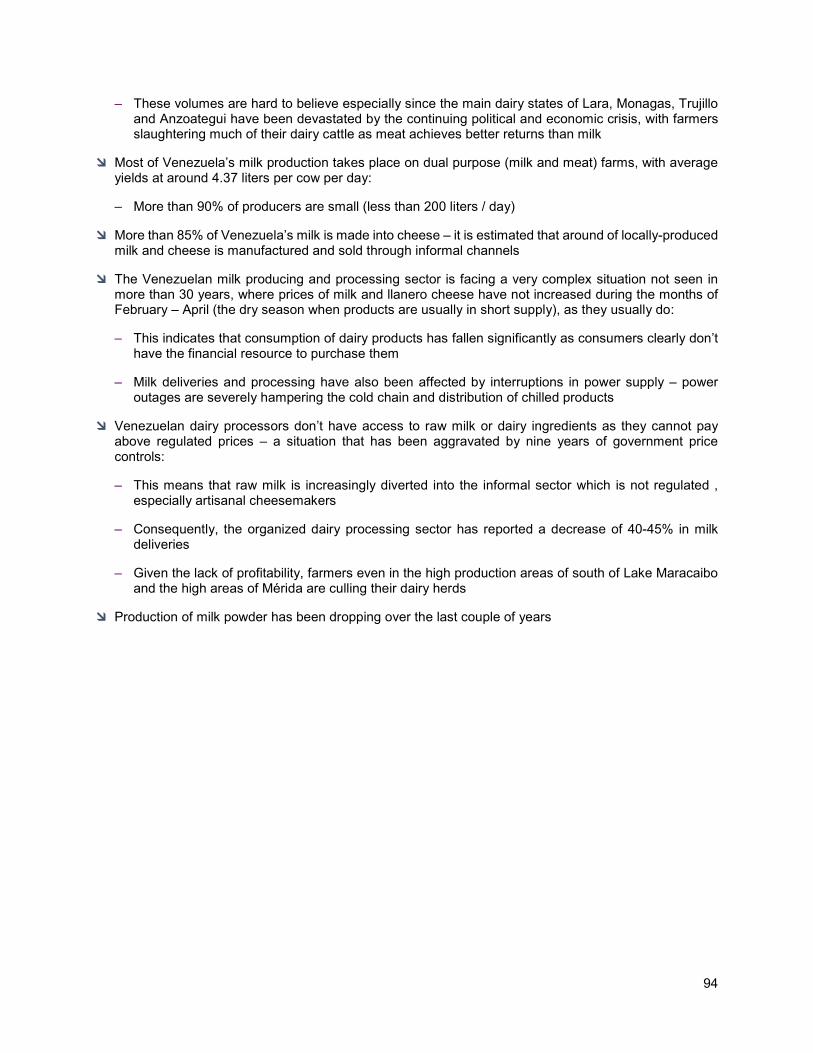
94
– These volumes are hard to believe especially since the main dairy states of Lara, Monagas, Trujillo and Anzoategui have been devastated by the continuing political and economic crisis, with farmers slaughtering much of their dairy cattle as meat achieves better returns than milk
Most of Venezuela’s milk production takes place on dual purpose (milk and meat) farms, with average yields at around 4.37 liters per cow per day:
– More than 90% of producers are small (less than 200 liters / day)
More than 85% of Venezuela’s milk is made into cheese – it is estimated that around of locally-produced milk and cheese is manufactured and sold through informal channels
The Venezuelan milk producing and processing sector is facing a very complex situation not seen in more than 30 years, where prices of milk and llanero cheese have not increased during the months of February – April (the dry season when products are usually in short supply), as they usually do:
– This indicates that consumption of dairy products has fallen significantly as consumers clearly don’t have the financial resource to purchase them
– Milk deliveries and processing have also been affected by interruptions in power supply – power outages are severely hampering the cold chain and distribution of chilled products
Venezuelan dairy processors don’t have access to raw milk or dairy ingredients as they cannot pay above regulated prices – a situation that has been aggravated by nine years of government price controls:
– This means that raw milk is increasingly diverted into the informal sector which is not regulated , especially artisanal cheesemakers
– Consequently, the organized dairy processing sector has reported a decrease of 40-45% in milk deliveries
– Given the lack of profitability, farmers even in the high production areas of south of Lake Maracaibo and the high areas of Mérida are culling their dairy herds
Production of milk powder has been dropping over the last couple of years
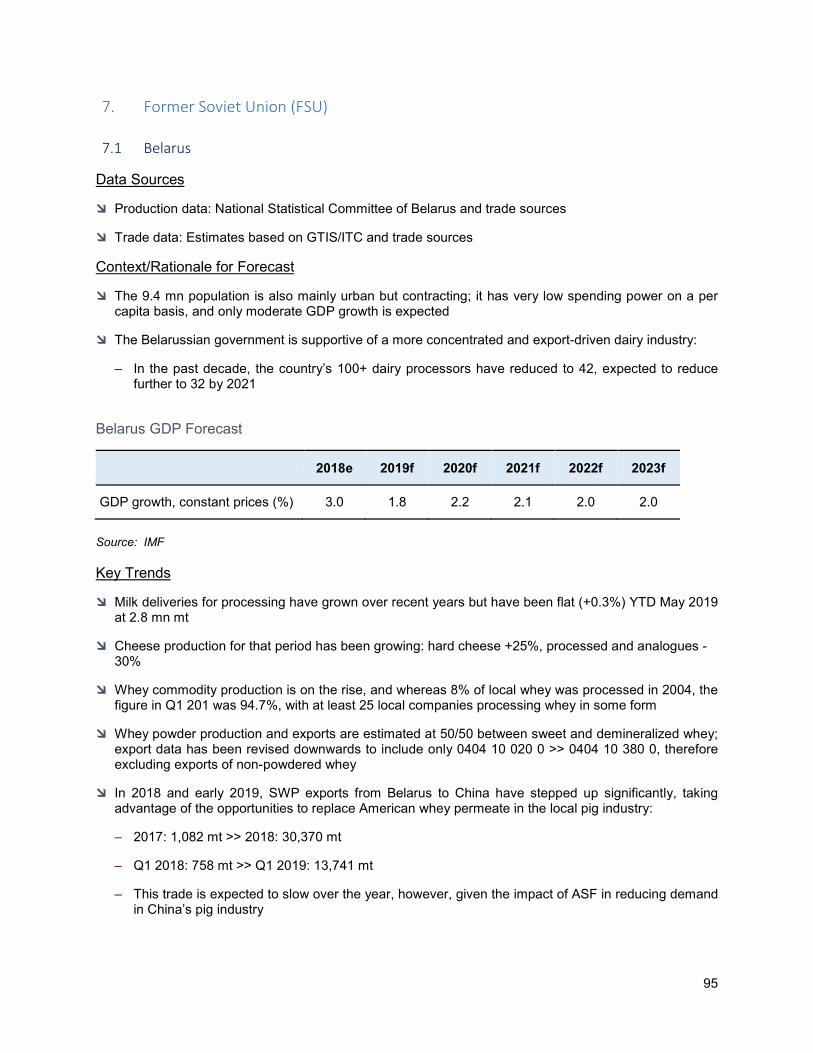
95
7. Former Soviet Union (FSU)
7.1 Belarus
Data Sources
Production data: National Statistical Committee of Belarus and trade sources
Trade data: Estimates based on GTIS/ITC and trade sources
Context/Rationale for Forecast
The 9.4 mn population is also mainly urban but contracting; it has very low spending power on a per capita basis, and only moderate GDP growth is expected
The Belarussian government is supportive of a more concentrated and export-driven dairy industry:
– In the past decade, the country’s 100+ dairy processors have reduced to 42, expected to reduce further to 32 by 2021
Belarus GDP Forecast
2018e 2019f 2020f 2021f 2022f 2023f
GDP growth, constant prices (%) 3.0 1.8 2.2 2.1 2.0 2.0
Source: IMF Key Trends
Milk deliveries for processing have grown over recent years but have been flat (+0.3%) YTD May 2019 at 2.8 mn mt
Cheese production for that period has been growing: hard cheese +25%, processed and analogues -30%
Whey commodity production is on the rise, and whereas 8% of local whey was processed in 2004, the figure in Q1 201 was 94.7%, with at least 25 local companies processing whey in some form
Whey powder production and exports are estimated at 50/50 between sweet and demineralized whey; export data has been revised downwards to include only 0404 10 020 0 >> 0404 10 380 0, therefore excluding exports of non-powdered whey
In 2018 and early 2019, SWP exports from Belarus to China have stepped up significantly, taking advantage of the opportunities to replace American whey permeate in the local pig industry:
– 2017: 1,082 mt >> 2018: 30,370 mt
– Q1 2018: 758 mt >> Q1 2019: 13,741 mt
– This trade is expected to slow over the year, however, given the impact of ASF in reducing demand in China’s pig industry
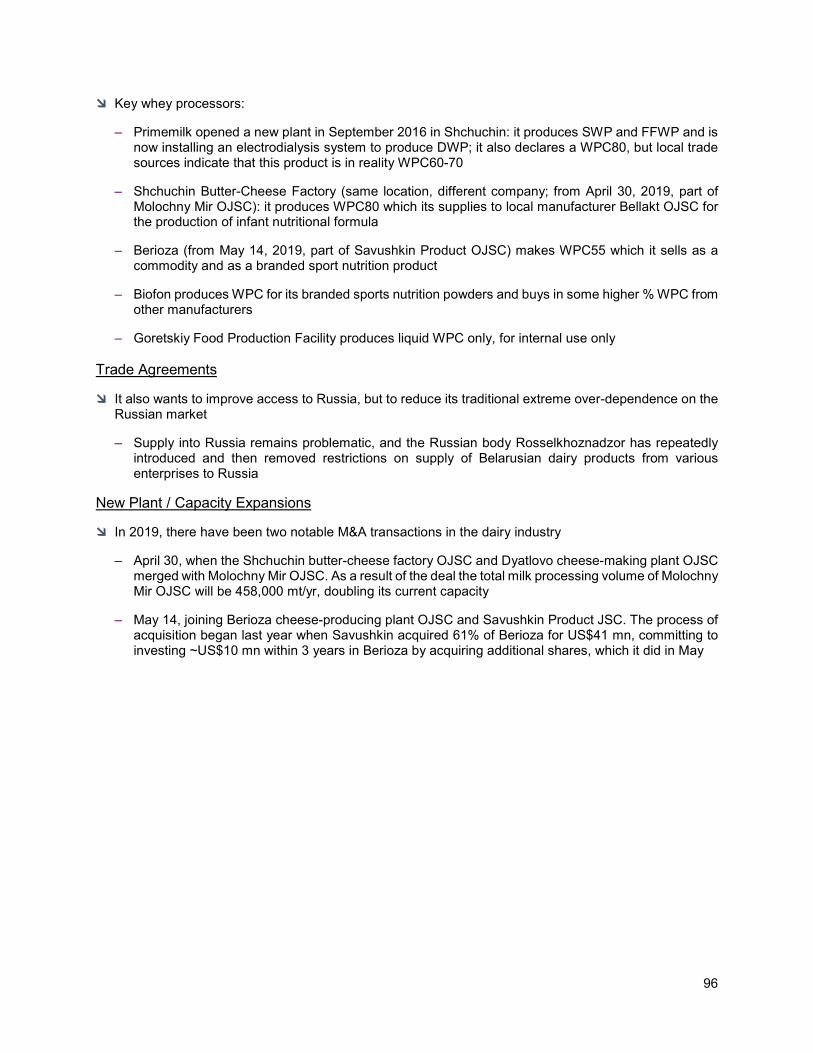
96
Key whey processors:
– Primemilk opened a new plant in September 2016 in Shchuchin: it produces SWP and FFWP and is now installing an electrodialysis system to produce DWP; it also declares a WPC80, but local trade sources indicate that this product is in reality WPC60-70
– Shchuchin Butter-Cheese Factory (same location, different company; from April 30, 2019, part of Molochny Mir OJSC): it produces WPC80 which its supplies to local manufacturer Bellakt OJSC for the production of infant nutritional formula
– Berioza (from May 14, 2019, part of Savushkin Product OJSC) makes WPC55 which it sells as a commodity and as a branded sport nutrition product
– Biofon produces WPC for its branded sports nutrition powders and buys in some higher % WPC from other manufacturers
– Goretskiy Food Production Facility produces liquid WPC only, for internal use only Trade Agreements
It also wants to improve access to Russia, but to reduce its traditional extreme over-dependence on the Russian market
– Supply into Russia remains problematic, and the Russian body Rosselkhoznadzor has repeatedly introduced and then removed restrictions on supply of Belarusian dairy products from various enterprises to Russia
New Plant / Capacity Expansions
In 2019, there have been two notable M&A transactions in the dairy industry
– April 30, when the Shchuchin butter-cheese factory OJSC and Dyatlovo cheese-making plant OJSC merged with Molochny Mir OJSC. As a result of the deal the total milk processing volume of Molochny Mir OJSC will be 458,000 mt/yr, doubling its current capacity
– May 14, joining Berioza cheese-producing plant OJSC and Savushkin Product JSC. The process of acquisition began last year when Savushkin acquired 61% of Berioza for US$41 mn, committing to investing ~US$10 mn within 3 years in Berioza by acquiring additional shares, which it did in May
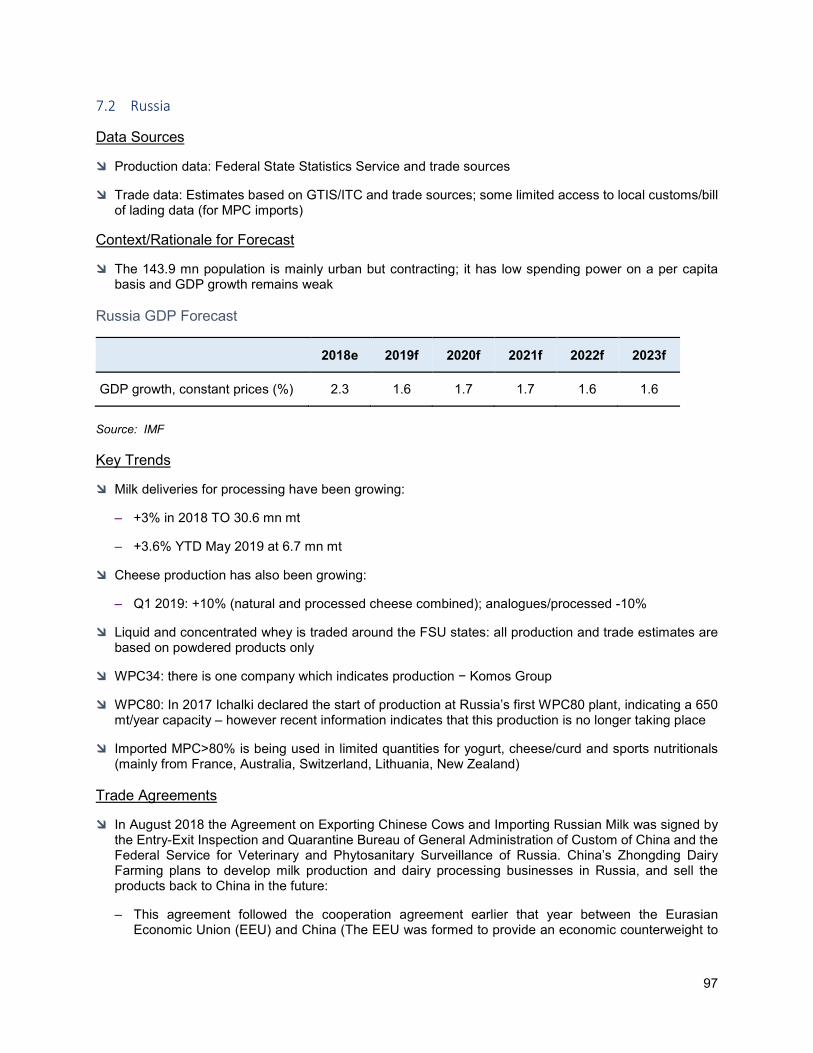
97
7.2 Russia
Data Sources
Production data: Federal State Statistics Service and trade sources
Trade data: Estimates based on GTIS/ITC and trade sources; some limited access to local customs/bill of lading data (for MPC imports)
Context/Rationale for Forecast
The 143.9 mn population is mainly urban but contracting; it has low spending power on a per capita basis and GDP growth remains weak
Russia GDP Forecast
2018e 2019f 2020f 2021f 2022f 2023f
GDP growth, constant prices (%) 2.3 1.6 1.7 1.7 1.6 1.6
Source: IMF Key Trends
Milk deliveries for processing have been growing:
– +3% in 2018 TO 30.6 mn mt
– +3.6% YTD May 2019 at 6.7 mn mt
Cheese production has also been growing:
– Q1 2019: +10% (natural and processed cheese combined); analogues/processed -10%
Liquid and concentrated whey is traded around the FSU states: all production and trade estimates are based on powdered products only
WPC34: there is one company which indicates production − Komos Group
WPC80: In 2017 Ichalki declared the start of production at Russia’s first WPC80 plant, indicating a 650 mt/year capacity – however recent information indicates that this production is no longer taking place
Imported MPC>80% is being used in limited quantities for yogurt, cheese/curd and sports nutritionals (mainly from France, Australia, Switzerland, Lithuania, New Zealand)
Trade Agreements
In August 2018 the Agreement on Exporting Chinese Cows and Importing Russian Milk was signed by the Entry-Exit Inspection and Quarantine Bureau of General Administration of Custom of China and the Federal Service for Veterinary and Phytosanitary Surveillance of Russia. China’s Zhongding Dairy Farming plans to develop milk production and dairy processing businesses in Russia, and sell the products back to China in the future:
– This agreement followed the cooperation agreement earlier that year between the Eurasian Economic Union (EEU) and China (The EEU was formed to provide an economic counterweight to
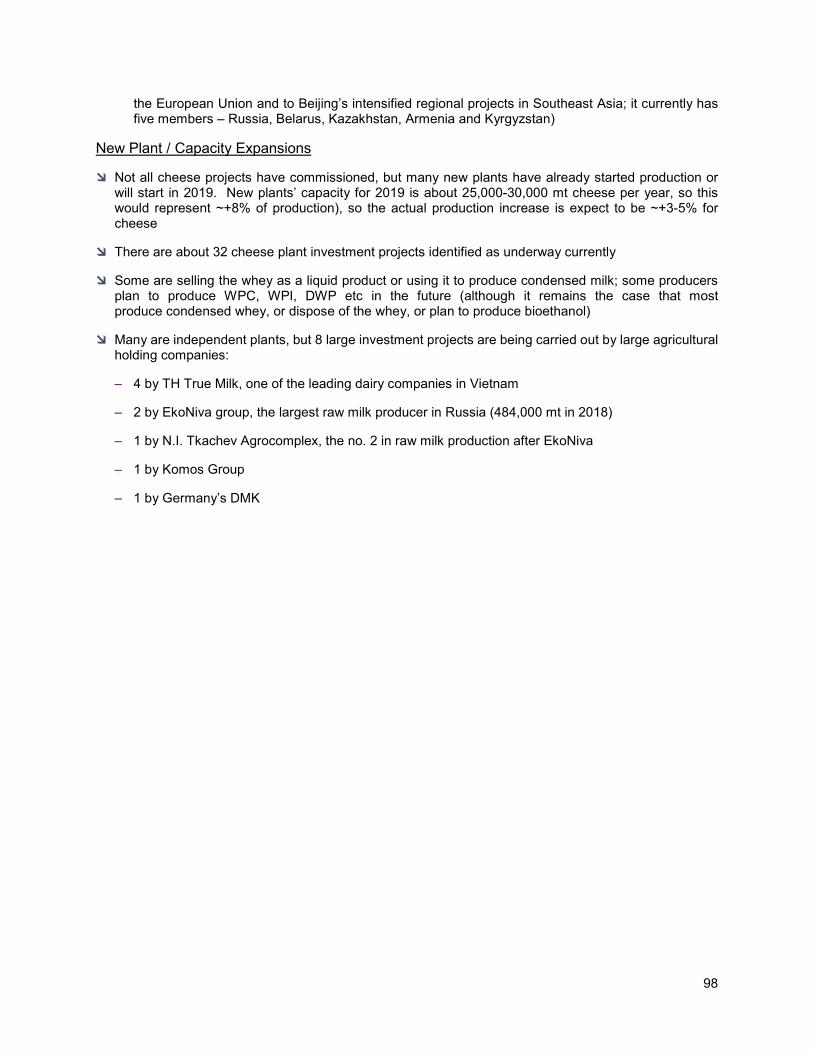
98
the European Union and to Beijing’s intensified regional projects in Southeast Asia; it currently has five members – Russia, Belarus, Kazakhstan, Armenia and Kyrgyzstan)
New Plant / Capacity Expansions
Not all cheese projects have commissioned, but many new plants have already started production or will start in 2019. New plants’ capacity for 2019 is about 25,000-30,000 mt cheese per year, so this would represent ~+8% of production), so the actual production increase is expect to be ~+3-5% for cheese
There are about 32 cheese plant investment projects identified as underway currently
Some are selling the whey as a liquid product or using it to produce condensed milk; some producers plan to produce WPC, WPI, DWP etc in the future (although it remains the case that most produce condensed whey, or dispose of the whey, or plan to produce bioethanol)
Many are independent plants, but 8 large investment projects are being carried out by large agricultural holding companies:
– 4 by TH True Milk, one of the leading dairy companies in Vietnam
– 2 by EkoNiva group, the largest raw milk producer in Russia (484,000 mt in 2018)
– 1 by N.I. Tkachev Agrocomplex, the no. 2 in raw milk production after EkoNiva
– 1 by Komos Group
– 1 by Germany’s DMK
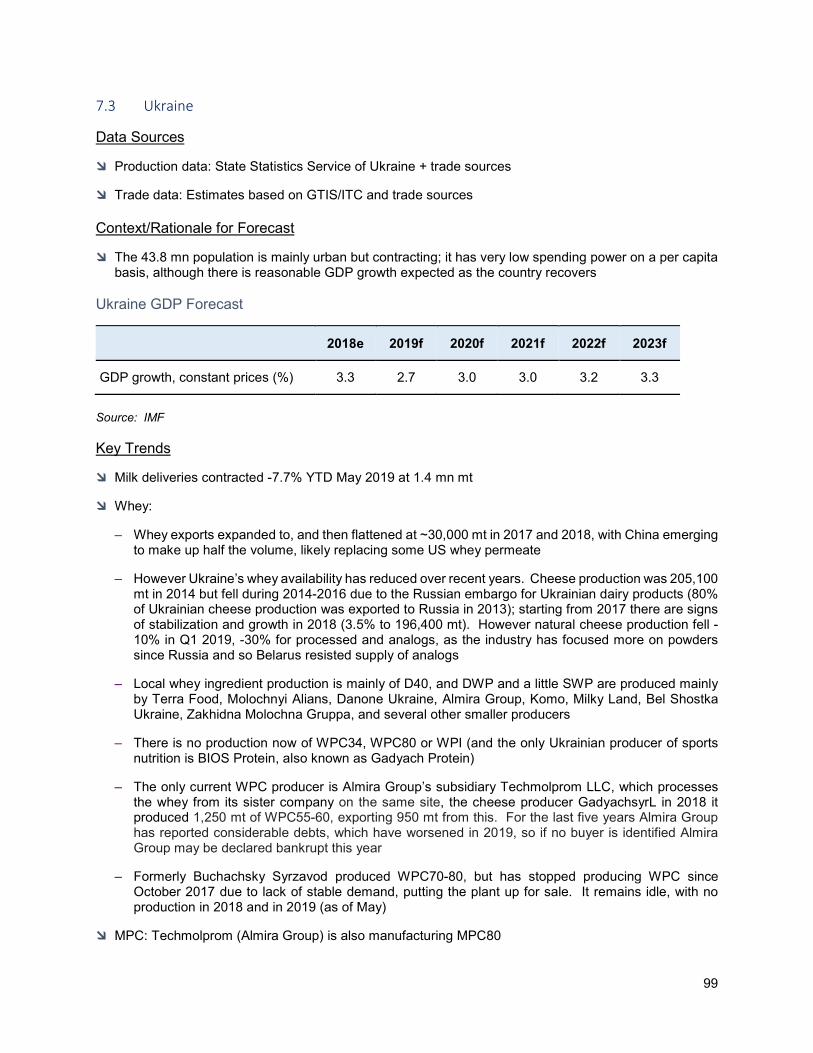
99
7.3 Ukraine
Data Sources
Production data: State Statistics Service of Ukraine + trade sources
Trade data: Estimates based on GTIS/ITC and trade sources Context/Rationale for Forecast
The 43.8 mn population is mainly urban but contracting; it has very low spending power on a per capita basis, although there is reasonable GDP growth expected as the country recovers
Ukraine GDP Forecast
2018e 2019f 2020f 2021f 2022f 2023f
GDP growth, constant prices (%) 3.3 2.7 3.0 3.0 3.2 3.3
Source: IMF Key Trends
Milk deliveries contracted -7.7% YTD May 2019 at 1.4 mn mt
Whey:
– Whey exports expanded to, and then flattened at ~30,000 mt in 2017 and 2018, with China emerging to make up half the volume, likely replacing some US whey permeate
– However Ukraine’s whey availability has reduced over recent years. Cheese production was 205,100 mt in 2014 but fell during 2014-2016 due to the Russian embargo for Ukrainian dairy products (80% of Ukrainian cheese production was exported to Russia in 2013); starting from 2017 there are signs of stabilization and growth in 2018 (3.5% to 196,400 mt). However natural cheese production fell -10% in Q1 2019, -30% for processed and analogs, as the industry has focused more on powders since Russia and so Belarus resisted supply of analogs
– Local whey ingredient production is mainly of D40, and DWP and a little SWP are produced mainly by Terra Food, Molochnyi Alians, Danone Ukraine, Almira Group, Komo, Milky Land, Bel Shostka Ukraine, Zakhidna Molochna Gruppa, and several other smaller producers
– There is no production now of WPC34, WPC80 or WPI (and the only Ukrainian producer of sports nutrition is BIOS Protein, also known as Gadyach Protein)
– The only current WPC producer is Almira Group’s subsidiary Techmolprom LLC, which processes the whey from its sister company on the same site, the cheese producer GadyachsyrL in 2018 it produced 1,250 mt of WPC55-60, exporting 950 mt from this. For the last five years Almira Group has reported considerable debts, which have worsened in 2019, so if no buyer is identified Almira Group may be declared bankrupt this year
– Formerly Buchachsky Syrzavod produced WPC70-80, but has stopped producing WPC since October 2017 due to lack of stable demand, putting the plant up for sale. It remains idle, with no production in 2018 and in 2019 (as of May)
MPC: Techmolprom (Almira Group) is also manufacturing MPC80

100
Butter exports to the EU have been enabled by strong prices to expand beyond the 2018 quota of 2,100 mt, approaching close to 4,000 mt