2019 GLOBAL CONTAINER SHIPPING OUTLOOK · research consultant Drewry), carriers plying the...
6
FEBRUARY 2019 2019 GLOBAL CONTAINER SHIPPING OUTLOOK IMO 2020 weighs on an industry struggling to generate sustained profitability
Transcript of 2019 GLOBAL CONTAINER SHIPPING OUTLOOK · research consultant Drewry), carriers plying the...

FEBRUARY 2019
2019 GLOBAL CONTAINER SHIPPING OUTLOOKIMO 2020 weighs on an industry struggling to generate sustained profitability

22019 Global container shipping outlook
The year 2018 was a turbulent one for the container shipping industry, but it might have been only a warm-up for 2019.
Political crosscurrents in the form of trade disputes resulting in new tariffs—and to a lesser extent, the UK’s impending exit from the EU—could rock the industry throughout 2019. Even as the industry’s challenges with pricing discipline and the steady expansion of fleet capacity continue to drag down carriers’ financial performance, the industry is facing new pressures, including the costs associated with the implementation of the IMO 2020 cap on sulfur emissions next year. Those factors, combined with limited success in cost cutting, are dramatically increasing financial leverage, which will likely further constrain carriers’ room to maneuver.
Significant revenue increases seem unlikely in 2019, in light of growth in fleet capacity that continues to exert downward pressure on rates for most major trade routes, including the busy westbound Asia–Europe lane. There was one key exception to that trend in 2018: the heavily trafficked eastbound transpacific (EBTP) trade route. Rates on that route, usually considered a bellwether for financial performance, doubled in 2018 as US shippers raced to build
up inventories before new tariffs take effect. But those rates are already on the downswing again as demand slackens, and they could fall further as volumes return to more-normal levels in the spring.
The implementation of the IMO 20201 regulations will pose a daunting challenge for carriers. IMO 2020 mandates sharp reductions in sulfur emissions from container ships beginning in 2020. This mandate will require carriers to either switch from cheap, 'dirty' bunker fuel—most commonly IFO 380—intermediate fuel oil with a maximum viscosity of 380 centistokes—to more-costly low-sulfur fuel oil (LSFO) or invest in scrubbers. It’s unclear whether refiners can produce enough low-sulfur fuel to meet increased demand in 2020 and beyond. Scrubbers can help carriers comply with the new limits, but concerns are growing among carriers that the supply of scrubbers won’t meet demand. This fundamental change to such a large component could make or break carriers' margins depending on how successful carriers are in passing along fuel-cost increases.
1. International Maritime Organisation’s (IMO) planned change to bunker fuel regulation
32019 Global container shipping outlook
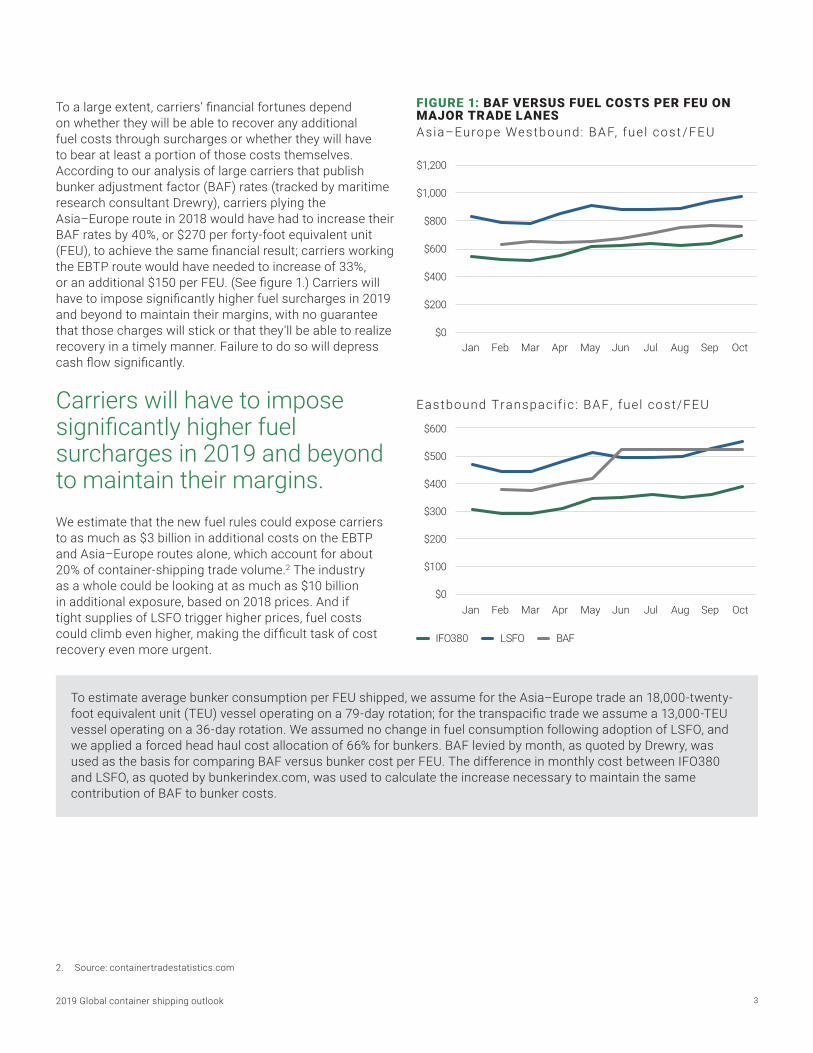
To estimate average bunker consumption per FEU shipped, we assume for the Asia–Europe trade an 18,000-twenty-foot equivalent unit (TEU) vessel operating on a 79-day rotation; for the transpacific trade we assume a 13,000-TEU vessel operating on a 36-day rotation. We assumed no change in fuel consumption following adoption of LSFO, and we applied a forced head haul cost allocation of 66% for bunkers. BAF levied by month, as quoted by Drewry, was used as the basis for comparing BAF versus bunker cost per FEU. The difference in monthly cost between IFO380 and LSFO, as quoted by bunkerindex.com, was used to calculate the increase necessary to maintain the same contribution of BAF to bunker costs.
FIGURE 1: BAF VERSUS FUEL COSTS PER FEU ON MAJOR TRADE LANESAsia–Europe Westbound: BAF, fue l cost /FEU
$0
$200
$400
$600
$800
$1,000
$1,200
Jan Feb Mar Apr May Jun Jul Aug Sep Oct
Eastbound Transpacif ic : BAF, fuel cost/FEU
IFO380 LSFO BAF
$0
$100
$200
$300
$400
$500
$600
Jan Feb Mar Apr May Jun Jul Aug Sep Oct
To a large extent, carriers’ financial fortunes depend on whether they will be able to recover any additional fuel costs through surcharges or whether they will have to bear at least a portion of those costs themselves. According to our analysis of large carriers that publish bunker adjustment factor (BAF) rates (tracked by maritime research consultant Drewry), carriers plying the Asia–Europe route in 2018 would have had to increase their BAF rates by 40%, or $270 per forty-foot equivalent unit (FEU), to achieve the same financial result; carriers working the EBTP route would have needed to increase of 33%, or an additional $150 per FEU. (See figure 1.) Carriers will have to impose significantly higher fuel surcharges in 2019 and beyond to maintain their margins, with no guarantee that those charges will stick or that they'll be able to realize recovery in a timely manner. Failure to do so will depress cash flow significantly.
Carriers will have to impose significantly higher fuel surcharges in 2019 and beyond to maintain their margins. We estimate that the new fuel rules could expose carriers to as much as $3 billion in additional costs on the EBTP and Asia–Europe routes alone, which account for about 20% of container-shipping trade volume.2 The industry as a whole could be looking at as much as $10 billion in additional exposure, based on 2018 prices. And if tight supplies of LSFO trigger higher prices, fuel costs could climb even higher, making the difficult task of cost recovery even more urgent.
2. Source: containertradestatistics.com

42019 Global container shipping outlook
PRECARIOUS FINANCES
The threat of new costs and the damaging impacts of increasing leverage could reduce the aggregate Altman Z-score3 of our sample of 14 carriers that publish their financials, which has recovered somewhat since hitting an all-time low just prior to Hanjin’s 2016 bankruptcy filing. (See figure 2.) The aggregate Z-score in 2018 climbed to 2.02, reflecting savings realized following a round of industry consolidation. That improved score is not in the immediate danger zone, but it’s a reminder that the industry remains under serious financial strain.
In addition, the industry’s leverage has risen to a debt-to-EBITDA ratio of 10.1 in the latest 12 months from 7.5 in 2017 and a recent low of 2.2 in 2010. The increase is the result of declining margins as well as increased borrowing by carriers taking on debt to finance acquisitions and fleet expansion. (See figure 3.)
The global fleet’s capacity has increased to close to 23 million twenty-foot equivalent units (TEU). (See figure 4.) Even as ships grow ever larger—the average vessel in the global fleet has increased by 2%, as measured in TEU capacity, since mid-2018—scrapping activities have plunged. Braemar ACM Shipbroking reports that carriers scrapped only 120,000 TEU of capacity in 2018—less than 1% of the global fleet’s total capacity. That’s the lowest volume of scrappage since 2011.
Scrapping activities have plunged to the lowest volume of scrappage since 2011.
Grey zone
Distressed zone
FIGURE 2: ALTMAN Z-SCORE
0
0.50
1.00
1.50
2.00
2.50
2.02
1.641.52 1.40 1.52 1.52
1.24 1.35
2.02
2010 2011 2012 2013 2014 2015 2016 2017 LTM
FIGURE 3: LEVERAGE (DEBT-TO-EBITDA RATIO)
2010 2011 2012 2013 2014 2015 2016 2017 LTM
2.2
4.0
5.5 5.5
8.4
5.3 6.2
7.5
10.1
0
2.0
4.0
6.0
8.0
10.0
12.0
3. The Z-score is a metric that gauges a company’s credit strength and the likelihood that it will seek bankruptcy protection within the coming 24 months; a score of 1.8 or lower signals a high risk of bankruptcy
FIGURE 4: TOTAL DEBT VERSUS GLOBAL CELLULAR FLEET CAPACITY
Total debt ($ billion) Global TEU capacity
69.8 79.5
88.7 92.7 82.2 76.2 74.3 82.7
92.3
0
5
10
15
20
25
0
20
40
60
80
100
120
140
2010 2011 2012 2013 2014 2015 2016 2017 LTM
GLO
BA
L TEU
CA
PA
CIT
Y
TO
TA
L D
EB
T (
$BIL
LIO
N)
Note: LTM as of September 30, 2018

52019 Global container shipping outlook
THE TRANSPACIFIC ROUTE DELIVERS A SHORT-LIVED BOOST
One bright spot for carriers amid the general gloom was the extraordinary rise in rates along the EBTP route. Rates from Asia to the US West Coast roughly doubled during the third quarter of 2018, as US companies built inventory from Asian markets ahead of the US imposition of stiff tariffs on certain key import categories and in anticipation of retaliatory measures by China. The effect of those high shipping rates should boost the financial results of carriers with exposure to transpacific routes in 2018.
Those high rates were the exception to the general trend in 2018, when lower rates on other key routes, in particular between Asia and Europe, bumped up only slightly during the peak season and have since retreated. (See figure 5.) Moreover, prevailing rates, including those on the EBTP route, have already declined considerably and could fall further as the volume of Asia-to-US shipping returns to customary levels.
Today’s environment of volatile fuel costs, rising leverage, and unpredictable developments on the global trade front presents carriers with a stark strategic choice. If they continue to increase their fleet capacities and the sizes of their vessels, they will benefit from the increased cost efficiency of the newer ships. But an increase in the capacity of the industry as a whole will work to further depress rate levels. Meanwhile, if global trade disruptions prompt shifts in trade patterns, carriers with smaller average vessels will gain the advantage, because their more flexible fleets will enable them to respond more quickly to changes in shippers’ supply networks. In 2019’s unsettled market, either strategy carries with it sizable inherent risks.
A RETURN TO VERTICAL INTEGRATION?
There are signs that carriers are turning to the third-party logistics (3PL) industry to improve their strategic positions, with several of them acquiring or bidding for 3PL providers. This development marks a reversal of the trend in the first decade of this century, when carriers were divesting themselves of such operations in the name of shedding noncore assets. It also comes as margins in the 3PL sector are compressing despite strong revenue increases in recent years. Our analysis of 26 logistics companies4 reveals that less than a quarter of them improved their EBITDA margins by more than 50 basis points in 2018 compared with about half whose margins compressed.
Nonetheless, both strategic and financial acquirers have been actively scouting the 3PL sector recently. Some of the largest carriers have signaled an interest in expanding their footprints into trucking and warehousing, suggesting that they are considering offering additional upstream and downstream
services or acting as a one-stop shops for smaller shippers. These carriers are actively trying to reposition as solutions providers with deep, long-lasting relationships with customers; a strategy that has had limited success in the past. As a result of the interest in the sector, 3PL companies are changing hands at high EBITDA multiples, making it unlikely that carriers can simply acquire their way to higher margins. Of course, carriers will have to borrow to finance any acquisitions, and given the deterioration in the industry’s creditworthiness, the all-in cost of acquisition will climb even higher.
In the face of such constraints, carriers that follow through with acquisitions face a sizable challenge to make those deals pay by wringing every possible efficiency out of the combined companies. The container shipping industry’s track record in postmerger integration is spotty at best, and its recent efforts to curtail SG&A costs do not inspire confidence.
FIGURE 4: TOTAL DEBT VERSUS GLOBAL CELLULAR FLEET CAPACITY
Total debt ($ billion) Global TEU capacity
69.8 79.5
88.7 92.7 82.2 76.2 74.3 82.7
92.3
0
5
10
15
20
25
0
20
40
60
80
100
120
140
2010 2011 2012 2013 2014 2015 2016 2017 LTM
GLO
BA
L TEU
CA
PA
CIT
Y
TO
TA
L D
EB
T (
$BIL
LIO
N)
Q3 – Peak season
FIGURE 5: SHANGHAI CONTAINER FREIGHT INDEX
US West Coast (base port) Europe (base port)
2017
-11
2017
-12
2018
-01
2018
-02
2018
-03
2018
-04
2018
-05
2018
-06
2018
-07
2018
-08
2018
-09
2018
-10
2018
-11
0
500
1,000
1,500
2,000
2,500
3,000U
SD
PE
R F
EU
4. Sample consists of 26 companies that derive a significant portion of their revenues from providing logistics management services and post their financials publicly
Note: LTM as of September 30, 2018
©2019 AlixPartners, LLP
ABOUT US
For nearly forty years, AlixPartners has helped businesses around the world respond quickly and decisively to their most critical challenges – circumstances as diverse as urgent performance improvement, accelerated transformation, complex restructuring and risk mitigation.These are the moments when everything is on the line – a sudden shift in the market, an unexpected performance decline, a time-sensitive deal, a fork-in-the-road decision. But it’s not what we do that makes a difference, it’s how we do it. Tackling situations when time is of the essence is part of our DNA – so we adopt an action-oriented approach at all times. We work in small, highly qualified teams with specific industry and functional expertise, and we operate at pace, moving quickly from analysis to implementation. We stand shoulder to shoulder with our clients until the job is done, and only measure our success in terms of the results we deliver.Our approach enables us to help our clients confront and overcome truly future-defining challenges. We partner with you to make the right decisions and take the right actions. And we are right by your side. When it really matters.
The opinions expressed are those of the author and do not necessarily reflect the views of AlixPartners, LLP, its affiliates, or any of its or their respective professionals or clients. This article regarding 2019 Global container shipping outlook (“Article”) was prepared by AlixPartners, LLP (“AlixPartners”) for general information and distribution on a strictly confidential and non-reliance basis. No one in possession of this Article may rely on any portion of this Article. This Article may be based, in whole or in part, on projections or forecasts of future events. A forecast, by its nature, is speculative and includes estimates and assumptions which may prove to be wrong. Actual results may, and frequently do, differ from those projected or forecast. The information in this Article reflects conditions and our views as of this date, all of which are subject to change. We undertake no obligation to update or provide any revisions to the Article. This article is the property of AlixPartners, and neither the article nor any of its contents may be copied, used, or distributed to any third party without the prior written consent of AlixPartners.
CONTACT THE AUTHORS:
Esben Christensen Managing Director +1 646 746 2496 [email protected]
Jeff Drake Managing Director +44 20 7098 7612 [email protected]
Jim Blaeser Director +1 212 297 1599 [email protected]
Gabe Koch Director +1 214 647 7599 [email protected]
Jon Labovitz Director +1 212 845 4097 [email protected]
Brian Nemeth Director +1 646 746 2492 [email protected]
Henry Pringle Director +44 20 7098 7653 [email protected]
CONCLUSIONS
Every market stakeholder must closely monitor the dynamic and volatile conditions prevailing in the container shipping market and the uncertainty around global trade conditions and events and be prepared to respond rapidly to events as they unfold. More specifically:
• Carriers must be prepared to mitigate the effects of IMO 2020. Above all, they will have to find ways to pass through at least some of the anticipated $10 billion or greater increase in their annual costs. Several carriers are testing the market for forwarding and 3PL acquisitions, though competition for such assets could drive multiples higher, making the deals too expensive for cash-strapped carriers. In any case, carriers must be ready to reallocate shipping capacity as needed if they're going to be able to handle to handle sourcing changes in the wake of new tariffs and other trade challenges. And last but not least, they must find ways to limit the growth in TEU capacity to levels roughly in line with demand.
• Forwarders and 3PL providers will have to navigate shifting currents in their industry. Independent forwarders may find themselves sidelined by carriers intent on supporting their own captive forwarding and logistics units. Every player in the sector will have to be vigilant to avoid being stuck with the bill for fuel cost recovery prompted by the implementation of IMO 2020.
• Shippers can expect pressure from carriers seeking to recover their added fuel costs and improve profitability. Shippers along the EBTP route may benefit by holding off from locking in contract rates until volumes along the route subside following inventory buildups in anticipation of tariffs. Shippers that have in the past relied on forwarders to afford access to multiple carriers should keep careful watch of where those forwarders’ allegiances lie, given the number of forwarders that are now captives of one carrier or another.
• Investors can expect to see higher multiples for 3PL and forwarding assets as strategic investors in the container shipping space scout for acquisitions. Financial investors should consider exiting any mature investments they hold in such companies.