2019 City of Kelowna Annual Water and Filtration Deferral ...
95
2019 City of Kelowna Annual Water and Filtration Deferral Report Prepared for: Interior Health and City of Kelowna Prepared by: Ed Hoppe, Water Quality and Customer Care Supervisor City of Kelowna 951 Raymer Ave, Kelowna, BC www.kelowna.ca Report Date Covered: January through December 2019 Report Submitted: June 30, 2020
Transcript of 2019 City of Kelowna Annual Water and Filtration Deferral ...

2019 City of Kelowna Annual Water and Filtration Deferral Report
Prepared for: Interior Health and City of Kelowna
Prepared by: Ed Hoppe, Water Quality and Customer Care Supervisor
City of Kelowna
951 Raymer Ave, Kelowna, BC
www.kelowna.ca Report Date Covered: January through December 2019
Report Submitted: June 30, 2020

City of Kelowna 2019 Annual Water Quality and Filtration Exclusion Report
Page | i
Table of Contents
Introduction ....................................................................................................................................................................... 1
Water System Overview ..................................................................................................................................................... 1
Service Area .................................................................................................................................................................... 1
Domestic Water Source and Treatment ............................................................................................................................ 3
Domestic Distribution System ........................................................................................................................................ 4
Irrigation Water Source and Treatment ............................................................................................................................. 6
Reservoir and Dam Inspections ...................................................................................................................................... 6
Irrigation Distribution System ........................................................................................................................................ 7
System Control ................................................................................................................................................................... 7
Staffing ............................................................................................................................................................................... 7
Capital Works Projects ....................................................................................................................................................... 9
Cross Connection Program ............................................................................................................................................... 11
Water Quality Monitoring ................................................................................................................................................ 13
Sample Collection and Frequency ................................................................................................................................ 13
Source Water Quality Monitoring ................................................................................................................................ 14
2019 Source Water Quality Summary ...................................................................................................................... 14
Overall Lake Okanagan Water Quality Health ......................................................................................................... 14
Treated Water Quality Monitoring .............................................................................................................................. 15
2019 Treated Water Quality Summary .................................................................................................................... 15
Annual Physical, Chemical and Biological Analysis .................................................................................................. 15
Pesticides and Herbicides ......................................................................................................................................... 16
Radiological .............................................................................................................................................................. 16
Distribution System Testing Program .......................................................................................................................... 16
2019 Distribution Water Quality Summary .............................................................................................................. 17
Filtration Deferral Requirements ..................................................................................................................................... 18
Dual Disinfection .......................................................................................................................................................... 18
Protozoa Sampling ....................................................................................................................................................... 18
Source Water Protection .............................................................................................................................................. 18
Drainage Water Quality Program ................................................................................................................................. 19
Raw Water Bacteria ..................................................................................................................................................... 19
Raw Water Physical Parameters .................................................................................................................................. 20

City of Kelowna 2019 Annual Water Quality and Filtration Exclusion Report
Page | ii
Water Production ............................................................................................................................................................. 23
Water Sustainability Management .................................................................................................................................. 26
Water Conservation ..................................................................................................................................................... 26
Landscape Water Conservation Reports (LWCR) ..................................................................................................... 26
Water Restrictions .................................................................................................................................................... 26
Water Rebates .......................................................................................................................................................... 26
QWEL ........................................................................................................................................................................ 27
Irrigation Inquiries / Service Requests / Community Events ................................................................................... 27
Water Disruption Events .................................................................................................................................................. 27
Emergency Response and Notifications ........................................................................................................................... 28
Water Quality Advisory ................................................................................................................................................ 28
Service Requests and Responses ..................................................................................................................................... 29
Long Term Improvements ................................................................................................................................................ 29
Conclusion ........................................................................................................................................................................ 30
Appendix A ......................................................................................................................................................... 31
Appendix B ......................................................................................................................................................... 35
Source Water Quality Parameters ................................................................................................................................... 36
Turbidity ....................................................................................................................................................................... 36
Total Coliform ............................................................................................................................................................... 37
E. Coli. ........................................................................................................................................................................... 39
pH ................................................................................................................................................................................. 40
Color ............................................................................................................................................................................. 42
Temperature ................................................................................................................................................................ 43
UV Transmittance ......................................................................................................................................................... 45
Algae ............................................................................................................................................................................. 46
Appendix C ......................................................................................................................................................... 48
Treated Water Quality Parameters .................................................................................................................................. 49
Turbidity ....................................................................................................................................................................... 49
Chlorine – Free ............................................................................................................................................................. 50
Total Coliform ............................................................................................................................................................... 52
E. Coli. ........................................................................................................................................................................... 52
pH ................................................................................................................................................................................. 53
Color ............................................................................................................................................................................. 54
Temperature ................................................................................................................................................................ 56

City of Kelowna 2019 Annual Water Quality and Filtration Exclusion Report
Page | iii
UV Transmittance ......................................................................................................................................................... 57
Annual Physical, Chemical and Biological Analysis ...................................................................................................... 59
Pesticides and Herbicides ............................................................................................................................................. 61
Radiological Parameters ............................................................................................................................................... 63
Appendix D ......................................................................................................................................................... 64
Distribution Water Quality Parameters ........................................................................................................................... 65
Chlorine – Free ............................................................................................................................................................. 65
Total Coliform ............................................................................................................................................................... 66
E. Coli. ........................................................................................................................................................................... 66
Trihalomethanes .......................................................................................................................................................... 67
Haloacetic Acids ........................................................................................................................................................... 68
Appendix E ......................................................................................................................................................... 70
Drainage and Beaches ...................................................................................................................................................... 71
Introduction ................................................................................................................................................................. 71
Creek Monthly Monitoring ........................................................................................................................................... 71
Creek Testing during elevated Turbidity at Intakes ..................................................................................................... 82
First Flush and Rain Event Monitoring at Outfalls ....................................................................................................... 86
Fascieux Creek Rain Event Sampling ............................................................................................................................ 87
Beach Sampling for E. coli ............................................................................................................................................ 89
Sampling Sites .................................................................................................................................................................. 90

City of Kelowna 2019 Annual Drinking Water and Filtration Exclusion Report
Page | 1
Introduction
As required by the British Columbia Drinking Water Protection Act, the City of Kelowna (COK) provides the following annual report in accordance with our conditions on permit and conditions on filtration treatment deferral.
This report provides an overview of our service area, staff certification program, water source protection assessments, water sustainability initiatives, distribution system overview, capital works projects, cross connection program, water quality monitoring program, emergency response plan, and water services provided.
The City of Kelowna’s primary focus is to provide sustainable, quality drinking water from source to tap and to ensure it is safe to drink for the customers of the Kelowna Water Utility. For further details on the content of this report or to request additional information, please contact the City of Kelowna at 250-469-8475 or email [email protected].
Water System Overview
The City of Kelowna water utility is one of four water providers operating within the municipal boundary and services approximately 73,000 residents as well as a diverse and robust commercial and business sector. Within the water boundary, there is one main distribution system that services over 99% of the population. This includes the Poplar Point, Eldorado and Cedar Creek pump stations and one small water system that services approximately 300 residents via the Swick Road pump station. The northern industrial area of the City, bordering Lake Country, is supplied with water from Okanagan Lake by the Lake Country Water Utility through infrastructure maintained by COK.
COK also operates and maintains the Kelowna International Airport Water System which receives treated water from the Glenmore Ellison Improvement District (GEID).
Service Area
The defined geographical service area for City of Kelowna Water Utility customers is bordered by Lake Okanagan to the West and four listed water districts to the East as presented in Figure 1. The Southeast Kelowna Irrigation District (SEKID) was amalgamated by the COK in 2018 and underwent extensive water pipe construction in 2019 to extend the Kelowna Utility domestic water system into the area while converting the existing SEKID pipe infrastructure into a dedicated Irrigation system. There are several areas that are identified as “Future City” which currently does not have water supplied by the utility, but is slated for servicing pending future water demand and land development.

City of Kelowna 2019 Annual Drinking Water and Filtration Exclusion Report
Page | 2
Figure 1. Water Supply area for City of Kelowna Water Utility and surrounding water districts
City of Kelowna 2019 Annual Drinking Water and Filtration Exclusion Report
Page | 3
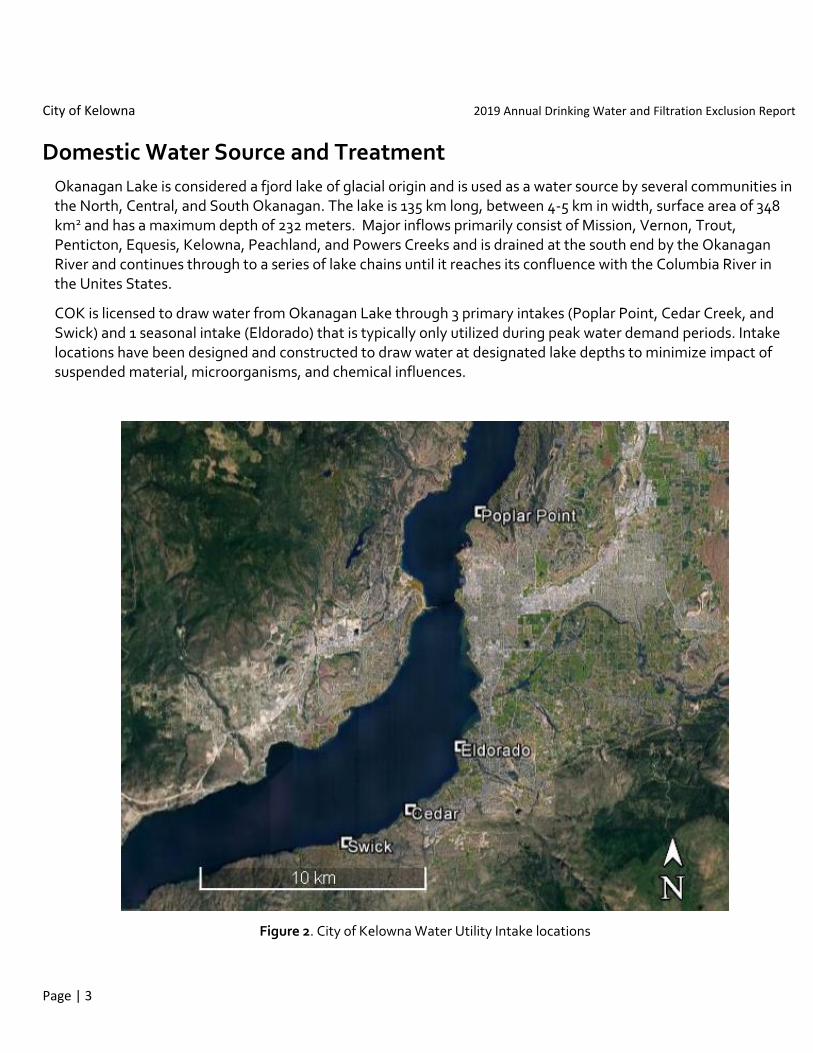
Domestic Water Source and Treatment
Okanagan Lake is considered a fjord lake of glacial origin and is used as a water source by several communities in the North, Central, and South Okanagan. The lake is 135 km long, between 4-5 km in width, surface area of 348 km2 and has a maximum depth of 232 meters. Major inflows primarily consist of Mission, Vernon, Trout, Penticton, Equesis, Kelowna, Peachland, and Powers Creeks and is drained at the south end by the Okanagan River and continues through to a series of lake chains until it reaches its confluence with the Columbia River in the Unites States.
COK is licensed to draw water from Okanagan Lake through 3 primary intakes (Poplar Point, Cedar Creek, and Swick) and 1 seasonal intake (Eldorado) that is typically only utilized during peak water demand periods. Intake locations have been designed and constructed to draw water at designated lake depths to minimize impact of suspended material, microorganisms, and chemical influences.
Figure 2. City of Kelowna Water Utility Intake locations

City of Kelowna 2019 Annual Drinking Water and Filtration Exclusion Report
Page | 4
Utilizing multiple intakes insures that there is water source redundancy in the event that an intake needs to be taken off-line due to water quality issues in localized areas, such as contaminated spills, and provides some flexibility to redirect water volume to meet demand. The Swick System remains the only independent connected intake due to geographical location.
Intake On-site Treatment Depth (m) Intake
Clearance (m) Pump Capacity
(L/day) Date
Commissioned Modifications
Poplar Point UV, Chlorine 26 1 75,000,000 1985 UV Treatment (2005)
Eldorado UV, Chlorine 14 0.3 25,000,000 1972 UV Treatment (2005)
Cedar Creek UV, Chlorine 20 1.5 15,000,000 1997 UV Treatment (2015)
Swick UV, Chlorine 16 1.2 1,200,000 1984 UV Treatment (2005)
Table 1. City of Kelowna Water Utility intake specifications
Intakes are annually inspected to ensure the integrity of the screens are maintained, intake clearance is adequate, and any buildup of material on the screens is noted and cleaned as necessary.
As part of the Southeast Kelowna water integration plan, previous domestic well sources for the district were taken off-line, but kept as a potential source of water in the event of exceptionally high water demand in the area required them to be temporarily put back in service.
The city water system is classified as a Level 2 water treatment system and employs a multi-barrier treatment approach that consists of UV dosing and chlorination disinfection prior to the water entering the distribution system. This aligns and complies with the “Drinking Water Treatment Objectives (Microbiological) for Surface Water Supplies in BC” as established and adopted by the Ministry of Health – Health Protection Branch.
The source water supplied to the Airport comes from Okanagan Lake via GEID and has both chlorination and UV treatment applied, much like the Kelowna Utility treatment system as well as on-site filtration.
Domestic Distribution System
The Poplar Point, Cedar Creek, and Eldorado water distribution systems are classified as EOCP level IV based on population served, water storage capacity, flow and pumping ability, whereas the Swick system distribution is classified as a Small Water System.
The COK Utility domestic system infrastructure consists of 511 km of pipe and has approximately 20,400 service connections of which 18,000 connections are residential, 1,800 commercial, and 600 as farm or agricultural. This represents a 17% increase in the total number of connections over 2018 and 50% increase in the length of total distribution pipe, primarily attributed to the Southeast Kelowna water integration project.

City of Kelowna 2019 Annual Drinking Water and Filtration Exclusion Report
Page | 5
Cast iron and Asbestos Cement pipe material continue to be replaced by PVC material as part of infrastructure asset renewal and concurrent development projects. The relatively small amount of Cast Iron piping left remains in the older part of the distribution system and continues to be put on an annual replacement schedule.
Pipe Material Length in
Service Comments
Asbestos Cement 145.4 km Majority installed prior to 1978
Cast Iron 10.3 km Majority installed prior to 1978
Concrete - RCCP 14 km Majority installed prior to 1978, used in larger diameter applications
Copper 1.4 km Used in smaller applications
Ductile Iron 24 km Ductile Iron still used in some applications
Galvanized 0.08 km Galvanized still used is some applications
High Density Polyethylene 1.4 km Used for specialized applications
PVC 229.7 km Used in most applications since 1979
PVCO 1.5 km Used for specialized applications
Steel 0.26 km Used for specialized or larger applications
Thermal Lined Ductile Iron 0.69 km Used for specialized applications
Total 428.7 km
Table 2. Water distribution system pipe material in use for the Kelowna Utility through 2019
In addition to the existing distribution system, over 200 km of pipe was added to the distribution system as a result of the water integration project. Approximately 82Km of new PVC was installed over the course of the project, which represents 40% of the total pipe infrastructure in the area.
Pipe Material Length in
Service Comments
Asbestos Cement 53.1 km Majority installed prior to 1978
Copper 0.02 km Used in smaller applications
Galvanized 1.17 km Existing pipe
High Density Polyethylene 0.04 km Used for specialized applications
PVC 53.5 km Existing Pipe - irrigation
PVC 82.0 km New domestic water pipe
Concrete - RCCP 6.40 km Used for large diameter, high pressure application
Steel 6.97 km Used for specialized or larger applications
Total 203.7 km Includes Irrigation distribution system
Table 3. Water distribution system pipe material in used in Southeast Kelowna through 2019

City of Kelowna 2019 Annual Drinking Water and Filtration Exclusion Report
Page | 6
The COK distribution system connections are serviced by 4 pump stations, 25 booster stations, 33 pressure reduction stations, 25 balancing reservoirs, and delivered over 15 million cubic meters of water to customers in 2019. Associated costs for treatment and delivery are recovered through water meter billing whereby water users are charged by a flat rate in addition to a tiered volume consumption calculation and a water quality enhancement fee to cover future improvements.
The distribution system infrastructure is maintained by the COK Utility Network Maintenance division that included 69 km of pipe flushing and 2182 hydrant checks in 2019.
Asset Category Dimension Replacement Value (millions)
Water main 633 km $457
Booster Stations and PRV's 58 $36
Meters 18,000 $14
Reservoirs 25 $54
Source Water Pump Stations 4 $30
UV Treatment Facilities 4 $30
Total $620
Table 4. City of Kelowna Domestic Water System Asset inventory and estimated value in 2019
Irrigation Water Source and Treatment
Although not part of the potable domestic water system, the Southeast Kelowna Irrigation system plays an important role in the supply of water to the Agricultural community. The water source primarily comes from a series of upland reservoirs in the Hydraulic Watershed that covers approximately 140 km2 and relies predominantly on snowpack for replenishing annual water supply. The reservoirs feed tributary streams that converge to supply the water intake located on Hydraulic Creek, which employs a single-barrier water treatment consisting of course mechanical screening and chlorine dosing. Chlorine residual will continue to be maintained in the future as it plays a vital role to minimize the growth of bacteria and pipe slime which can clog pipes, fittings and coat sensor equipment.
Reservoir and Dam Inspections
The McCulloch Reservoir is located in the Okanagan Valley approximately 20 km south east of East Kelowna. The reservoir consists of a series of lakes and streams to control and store water for the purpose of water supply. Control is achieved by the use of dams that require regular surveillance and inspections based on the risk classification of the structure. The inspections indicated no significant change in these facilities that pose risk to the integrity or safety of the water system.
McCulloch Reservoir

City of Kelowna 2019 Annual Drinking Water and Filtration Exclusion Report
Page | 7
In 2019 a Dam Safety Review was carried out by Golder Associates whose scope of work included:
• Review of available information
• Site visits and interviews
• Dam Safety (Hazards/Failure Modes/Hydrotechnical/Geotechnical and Deficiencies)
The report indicated the dams are reasonably safe and identified areas of work and maintenance to be carried out.
Irrigation Distribution System
The bulk of the current irrigation distribution system was installed in the late 1960’s with expansion and repairs made as required to maintain the system. The large geographical area and initial design of the system makes system looping and maintaining clean lines a challenge. The majority of the irrigation system is metered and will need significant renewal and replacement over the next 30 years, which will be funded through asset management reserves.
System Control The operation and maintenance monitoring of the water quality, operating pumps, reservoir water levels, distribution system water pressures are all conducted through the use of a Supervisory Control and Data Acquisition Software (SCADA) program. Connected by wireless links, the SCADA software remotely collects information from sensors at all of the pump stations and reservoirs. The software interprets the receiving data and automatically adjusts pumps and system settings to maintain pre-defined operating requirements. When an issue is detected within the system, the SCADA system issues alerts and alarms to water system operators who then respond to the concerns. This software platform also allows the COK to collect and track historical performance of our system for auditing and future optimization of our water system.
Staffing Section 12 of the Drinking Water Protection Regulations (DWPR) refers to the qualification standards for water system operators. In this section, the “Environmental Operators Certification Program” (EOCP) is required for certification of operators to maintain, operate, or repair a water system. The qualification levels required for operators are determined by the class of the system under the EOCP. Current list of water system operators and certification levels are listed in Table 5, which now include Dam Inspection and Maintenance as a result of the integration of the SEKID upland water sources.

City of Kelowna 2019 Annual Drinking Water and Filtration Exclusion Report
Page | 8
Name Job Title
Water Treatment
Water Distribution Chlorine Handling
Dam Inspection & Maintenance
Dam Management I II I II III IV
Brad Stuart Water Supply & Pump Stations Supervisor
Sukh Saran Water Supply Foreman
Bob Mandryk
Water Distribution & Sewer Collection Operator
Jason Hilstob
Water Distribution & Sewer Collection Operator
Don Sharpe Water Distribution & Sewer Collection Operator
Derek Enns Water Distribution & Sewer Collection Operator
Mike Lange Water Distribution & Sewer Collection Operator
Rhonda Hogan
Water Distribution & Sewer Collection Operator (Training Op.)
Thomas Hall Water Distribution & Sewer Collection Operator (Training Op.)
Drew Allingham
Water Distribution & Sewer Collection Operator
Cliff Jensen Water Maintenance Foreman
Table 5. City of Kelowna Water System Operators certification levels
COK employs a diverse and talented team of engineers, managers, supervisors, technical and support staff that are responsible for the planning, design, analytical testing, budgeting, inspection, public communications, staffing and management aspects of the Water Utility operations (Table 6).
Staff Role
K. Van Vliet, P.Eng., M.Eng. Utility Services Manager
B. Stuart, WQT Water Supply and Pump Stations Supervisor
M. Murrell Utilities Network Maintenance Supervisor
J. Shaw, P.Eng. Infrastructure Engineering Manager
K. Kay Communications Advisor
A. Weremy Water Manager
M. Nice Human Resource Manager
R. MacLean, P.Eng. Utilities Planning Manager
E. Hoppe, B.Sc., P.Chem. Water Quality and Customer Care Supervisor
C. Moody Cross Connection Control Program Coordinator
L. Jablonski, WQT Water and Wastewater Quality Technician
D. Bachmann, WQT Water and Wastewater Quality Technician
Table 6. City of Kelowna Water System Managers and Support Staff for 2019

City of Kelowna 2019 Annual Drinking Water and Filtration Exclusion Report
Page | 9
Capital Works Projects A number of capital projects were scheduled and completed in 2019 that involved upgrades and improvements to existing water infrastructure and drainage systems that totaled almost $50.0 million. The majority of these funds were directed to the completion of the SEKID water integration phase 1. Projects were initiated and completed according to government grant funding stipulations, priority, contractor pricing, conjunction with other road construction projects, and long term development planning. Summary of budgeted drinking water projects descriptions and values are presented in Table 7 and drainage (storm water) in Table 8.
Water Capital Projects 2019
Description 2019 Budget Level of Completion
Infrastructure Upgrade
Meter Installations $ 196,515 Ongoing Program
Infrastructure Upgrade
Poplar Point Pump Station Electrical Power Upgrades $ 53,840 Complete
Infrastructure Replacement
Water Meter Replacement Program $ 31,420 Ongoing Program
Infrastructure Replacement
Sutherland Ave. Connections and Valve Replacements $ 400,000 Complete
Infrastructure Upgrade
Ethel Street ATC Phase 4 Watermain Upgrades, Sutherland to Springfield
$ 321,870 Complete
Infrastructure Upgrade
SEKID Water Integration Phase 1 $ 32,600,000 Nearing completion (May 2020 target)
Infrastructure Upgrade
South End Water Upgrades $ 9,817,843 Nearing completion (May 2020 target)
Infrastructure Replacement
McCulloch Road Irrigation Main Replacement $ 45,311 Design complete, Construction 2020
Infrastructure Upgrade
South End Cedar Creek Pump Station $ 252,078 In progress
Infrastructure Upgrade
South End SOMID Decommission Upgrades $ 96,351 In progress
Infrastructure Upgrade
SOMID Servicing $ 269,989 In progress
Infrastructure Upgrade
WestPoint Transmission Main $ 201,258 Design complete, Construction 2020
Infrastructure Upgrade
KLO Road Phase 2 Trunk Main $ 2,668,975 Complete

City of Kelowna 2019 Annual Drinking Water and Filtration Exclusion Report
Page | 10
Infrastructure Upgrade
Skyline Pump Station Repairs $ 49,240 In progress
Infrastructure Replacement
Skyline Pump Station DCC - Electrical Building Upgrades $ 104,220 Design in progress,
carried over to 2020
Infrastructure Removal
Okaview 2 Decommission Pump Station $ 48,430 Complete
Infrastructure Upgrade
Offsite and Oversize Water Utility - services beyond developer requirements to meet future demand.
$ 10,000 Ongoing Program
2019 Total Investment $ 47,167,340
Table 7. Drinking Water capital projects through 2019
Drainage Capital Projects 2019
Description 2019 Budget Level of Completion
Stormwater Separator
Sutherland Ave Oil/Water Separator $ 58,750 Complete
Sediment Capture Chichester Pond Sediment Forebay $ 65,890 Design & Materials, Construction 2020
Drainage Repair Upper Vernon Creek Channel Restoration $ 267,287 Complete
Drainage Repair Rotary Beach Wheelchair Ramp and Shoreline Assessment $ 27,280 Complete
Drainage Repair Rotary Park Marsh Concrete Walkway $ 9,510 Complete
Drainage Repair Rotary Park Marsh Shoreline $ 124,380 Complete
Drainage Upgrade Bluebird Storm Station Upgrade (Study) $ 40,020 Complete
Drainage Upgrade Spencer Road Mill Creek Drainage Improvements $ 1,200,000 Complete
Drainage Upgrade Adams Road Drainage Improvement $ 7,150 Design Complete, Construction 2020
Drainage Upgrade Jean Road Drainage Improvements $ 3,360 Property Acquisition,
Construction 2020
Drainage Repair Crosby Road Development Drainage Deficiencies $ 41,110 Complete
Drainage Upgrade Miscellaneous Drainage Upgrades (Operating Budget) $ 400,000 Ongoing Program
2019 Total Investment $ 2,244,737
Table 8. Water Drainage capital projects through 2019

City of Kelowna 2019 Annual Drinking Water and Filtration Exclusion Report
Page | 11
Cross Connection Program The City of Kelowna Water Utility implemented a comprehensive Cross Connection Control (CCC) program in 1998. The CCC program is designed to protect water quality in the distribution system from backflow and any subsequent contaminants that could be carried from point of use sources. Our program has been strategically implemented to include the 4 distinct water district purveyors in Kelowna and tracks 5936 testable backflow prevention assemblies in 2856 facilities throughout the city.
Program Scope
The Cross Connection Control program applies to all water customers within the city regardless of their water purveyor. The City of Kelowna manages the program on behalf of all Kelowna water providers. Although the program applies to all customers, it is focused on Industrial, Commercial, Institutional, and Agricultural customers. There are standard backflow prevention requirements that apply to single family dwellings, but these requirements don’t usually involve testable Back Flow Preventers (BFP) assemblies. Occasionally single family homeowners will install a commercial type system or appliance in their home and in these instances appropriate backflow prevention assemblies may be installed. The program utilizes field inspections and review of construction plans and building permit applications to identify cross-connection hazards and risk of backflow. When a cross-connection hazard is identified, a backflow prevention assembly (BFP) is required to be installed to isolate and contain the hazard and to prevent backflow into the public water system.
Annual Testing
Consumers connected to the public water supply in the City share the responsibility of protecting the water system from the backflow of contaminants. The assembly owners are required to contact the services of a qualified tester and submit a passing test report for the assembly(s) annually.

City of Kelowna 2019 Annual Drinking Water and Filtration Exclusion Report
Page | 12
The City of Kelowna strives to achieve total compliance with the annual testing component of our program and is successful within 2% year after year. For summary of backflow devices in use and testing completed in 2019, refer to Table 9.
Table 9. Summary of 2019 Cross Connection Backflow Devices and compliance tested
2019 Progress
2019 saw approx. 350 Double Check Valve Assembly (DCVA) backflow preventers installed in the former SEKID water service area. These backflow preventers are a requirement on domestic water services installed to properties that have access to the raw water irrigation utility or are engaged in an agricultural activity.
The backflow preventers are in freeze protected pits on the public side of the property line and are therefore owned and maintained by the City of Kelowna water utility. This is a departure from the normal cross connection control; program operation, as it is the drinking water utility protecting itself from the irrigation water utility.
It is estimated that at least 350 more will be installed in 2020 as part of the SEKID water integration project.
Premise Protection In-Service New
Installs Failures Cleaned Repairs
Tests Completed
Double Check Detector Assembly 11 0 0 0 0 12
Double Check Valve Assembly 2750 227 46 1 2 2848
Pressure Vacuum Breaker Assembly 2 0 0 0 0 2
Reduced Pressure Backflow Assembly 1521 126 41 0 0 1624
Total 4284 353 87 1 2 4486
Premise Isolation
Double Check Detector Assembly 1 0 0 0 0 1
Double Check Valve Assembly 1141 480 32 0 0 1198
Reduced Pressure Backflow Assembly 230 27 6 0 0 251
Total 1372 507 38 0 1 1450
Grand Total 5656 860 125 1 2 5936

City of Kelowna 2019 Annual Drinking Water and Filtration Exclusion Report
Page | 13
Water Quality Monitoring The COK Water Quality Program references the following regulations and guidelines to develop a formal reporting and monitoring program:
➢ Guidelines for Canadian Drinking Water Quality (GCDWQ) ➢ British Columbia Approved Water Quality Guidelines ➢ British Columbia Drinking Water Protection Act and Regulation
(DWPA) ➢ Drinking Water Treatment Objectives for Surface Water in BC ➢ IHA Decision Tree for Responding to Turbidity Events in Unfiltered
Water The Guidelines for Canadian Drinking Water Quality are based on the current, published scientific research related to the health effects, aesthetic effects, and operational considerations. Health based guidelines are established on the basis of comprehensive review of the known health effects associated with each contaminant, on exposure levels and on the availability of treatment and analytical techniques. The highest priority guidelines are those dealing with microbiological contaminants such as bacteria, protozoa, and viruses.
Sample Collection and Frequency
A source to tap drinking water quality monitoring program is a function of source water quality, water treatment, and water quality through the distribution system. As a result, the monitoring of the COK drinking water quality consists of 4 main sampling and information collection components:
• Source Water Monitoring
• Monitoring at the outflow of Wastewater Treatment Plant
• Monitoring of the Pump Intakes and Distribution System
• Customer Concerns and Service Requests
The sampling location, frequency, and water quality parameters required at each of the source to tap sites are reviewed yearly, approved by IHA, and samples collected as per frequency referenced in the COK Water Utility Water Quality Sampling Guidelines (Appendix A). Qualified field and lab technicians perform more than 500 monthly tests on source and distribution water at over 80 sites throughout the system. Sampling sites include various locations from Okanagan Lake, tributary creeks, pump stations, reservoirs, booster stations, valve chambers, and final tap source points. Data collection consists of SCADA monitoring, field measurements, in-lab testing and submission of samples to a third party, external, accredited laboratory as part of the quality assurance program. Analytical results are entered into a WaterTrax software database, which has the ability to alert water operation staff and utility management in the event that specific parameters exceed operational or water quality guidelines as outlined in the CDWQG.

City of Kelowna 2019 Annual Drinking Water and Filtration Exclusion Report
Page | 14
Source Water Quality Monitoring
Over 2,000 combined source water samples were tested from Okanagan Lake drawn from each of the four intake locations. The samples are taken prior to both UV and Chlorine treatment and analyzed for a variety of water quality parameters either on-site at the COK laboratory or at the certified lab as per monthly sampling schedule. Detailed chemical and biological parameter descriptions, graphical trends, and related WQ objectives are listed in Appendix B and include the following:
• Turbidity (Table 13, Figures 10-11)
• Total Coliform (Table 14, Figures 12-13)
• Escherichia coli (E. Coli.) (Table 15, Figures 14-15)
• pH (Table 16, Figures 16-17)
• Color (Table 17, Figures 18-19)
• Temperature (Table 18, Figures 20-21)
• UV Transmittance (Table 19, Figures 22-23)
2019 Source Water Quality Summary ➢ There were no water quality advisories issued for the Kelowna Utility related to elevated Turbidity > 1NTU
as previously experienced in 2017 and 2018. This was primarily attributed to an average snowpack melt, moderate temperatures and weather, limited localized flooding events, and no major upstream bank disturbances in the tributaries
➢ Both Total Coliform and E. coli. counts decreased, which aligned with the decrease in Turbidity averages ➢ pH, color, UVT, and yearly average temperature remained historically consistent
Overall Lake Okanagan Water Quality Health
In addition to internal testing, the COK is part of an annual Collaborative Okanagan Lake Water Quality Study, conducted annually since 2011 by Larratt Aquatic Consultants in conjunction with the Ministry of Environment and various Okanagan municipalities. The report captures water quality data at various representative points along Okanagan Lake and comments on the general physical, chemical, and biological health relative to the Water Quality objectives published in the 2005 Nordin Water Quality Guidelines. Physical – overall water clarity improved over 2017 and 2018. Only the shallower north end of OK lake (Vernon) failed to meet objectives. Chemical – Dissolved oxygen, nitrogen, phosphorus concentrations remained consistent in all areas of the lake with the exception of degrading trends in the shallower north end which is most impacted by human activities and watershed degradation including agriculture, cattle, logging and shoreline septic systems. Total nitrogen remains of concern with all sites not meeting the objectives. Biological – Chlorophyll, Phytoplankton (Cyanobacteria), and Zooplankton indicators showed a drop in 2019 values compared to 2018, but there is still an overall increasing trend from 2011-2019 with the highest values observed in the north end.

City of Kelowna 2019 Annual Drinking Water and Filtration Exclusion Report
Page | 15
Treated Water Quality Monitoring
Similar to the source water sampling program, over 2,750 combined treated water samples were tested from each of the four intake location immediately post UV and Chlorine treatment. The purpose of this monitoring program is to establish that the treatment is effectively removing or neutralizing any microbiological threat, improving, or at least not deteriorating the chemical and physical quality of the drinking water, and complying with the established GCDWQ health and aesthetic guidelines.
Detailed chemical and biological parameter descriptions, graphical trends, and related water quality objectives are listed in Appendix C and include:
• Turbidity (Table 20, Figures 24-25)
• Free Chlorine (Table 21, Figures 26-27)
• Total Coliform (Table 22)
• Escherichia coli (E. Coli.) (Table 23)
• pH (Table 24, Figures 28-29)
• Color (Table 25, Figures 30-31)
• Temperature (Table 26, Figures 32-33)
• UV Transmittance (Table 27, Figures 34-35)
2019 Treated Water Quality Summary ➢ Turbidity trend for 2019 indicated a decrease of 0.03-0.10 NTU over 2018 and more in-line with non-flooding years ➢ Total Coliform and E. coli. counts were all below drinking water quality guidelines indicating effective UV
and Chlorine treatment ➢ Although the 5-year trend indicates a decrease in pH, treated water has become notable more alkaline in
2019 after two consecutive years of flooding and lower pH ➢ There was only one record of a treated drinking water sample exceeding the aesthetic color guideline ➢ Temperature and UVT remained consistent with previous year
Annual Physical, Chemical and Biological Analysis
In addition to the on-site and in-lab analytical testing program, the COK submits treated water samples to an external accredited laboratory for full comprehensive physical, chemical, and microbiological analysis from each of the Intake sites. The purpose of utilizing an external lab is to verify internal test results as a quality control check and evaluate a broader range of compounds and highlight any water quality health concerns.
The 2019 analytical results validated the data generated by internal lab testing and did not indicate any significant year over year trend. There were no exceedances of aesthetic or health maximum guideline of any parameters listed and no significant trends relative to previous years of historical comprehensive analysis (Table 28).

City of Kelowna 2019 Annual Drinking Water and Filtration Exclusion Report
Page | 16
Pesticides and Herbicides
The Okanagan valley is renowned for its long standing agricultural industry and continues to be a hallmark of the BC interior region. Farming practices have commonly included the application of a variety of pesticides and herbicides over the past 80 years. Although much of the hazardous compounds have been phased or legislated out, there are still some legacy chemical compounds that are monitored due to its lifespan in the environment. Due to the proximity of the agricultural land to Okanagan Lake, Herbicides and Pesticides are tested on a four-year cycle. Since the beginning of this screening practice, none of the fifty-five scanned Pesticides or Herbicides has been detected in any of the samples (Table 29). Testing was last completed in 2017 and is scheduled every 4 years.
Radiological
Radionuclides are naturally present in the environment and have been surveyed in various regions throughout British Columbia of which Uranium is the most common isotope identified in the Okanagan. Leaching of these radionuclides into ground water is of concern and therefore are measured against health standards. Maximum acceptable concentrations in drinking water have been established for three natural isotopes (210-Pb, 226-Ra, and 236-U) and four artificial isotopes (90-Sr, 131-I, 137-Cs, and H3-Tritium). To date, there has not been any significant Gross Alpha or Gross Beta radionuclides found in the drinking water (Table 28 and 30). Testing was last completed in 2018 and is scheduled every 4 years.
Distribution System Testing Program
The COK has over 400km of in-ground water pipes that services residential, commercial and agricultural properties which in turn has over 17,000 point of use sources that requires consist clean drinking water quality. In order to maintain this service, bacteria, chlorine residual, and chlorination byproducts are routinely monitored and reported to Interior Health to ensure that it strictly meets all BC Drinking Water Regulations and Guidelines for Canadian Drinking Water Quality. Representative sampling sites are determined by COK and approved by IHA and are designed to capture changes in water quality as it flows throughout the distribution system. As part of this program, samples are taken at the outer regions of the water system to ensure that there is free chlorine residual maintained throughout and to monitor chlorination byproducts. Specific parameters that are monitored are listed in Appendix D and include:
• Free Chlorine (Table 31, Figures 36-37)
• Total Coliform (Table 32)
• Escherichia coli (E. Coli) (Table 33)
• Trihalomethanes (THM) (Table 34, Figures 38-39)
• Haloacetic Acids (HAA) (Table 35, Figures 40-41)

City of Kelowna 2019 Annual Drinking Water and Filtration Exclusion Report
Page | 17
As per established GCDWQ guidelines, the following microbiological criteria for drinking water distribution systems are referenced:
➢ No sample should contain more than one Escherichia Coli organisms per 100mL ➢ No two consecutive samples from the same site should show the positive presence of Total Coliform
organisms per 100mL ➢ At least 90% of the samples must have zero Total Coliform per 100mL
As per Table 10, COK demonstrated that the treated drinking water met the guideline criteria for both Total Coliform and E. Coli. throughout 2019 with no recorded exceedances or positive results.
Criteria – Total Coliform City
System Swick
System Airport System
Number of microbiological tests - Total Coliform 1,087 167 112
Number of samples containing positive Total Coliform/100mL 0 0 0
Samples with >10 Total Coliform / 100mL 0 0 0
Occasions with consecutive positive Total Coliform / 100mL 0 0 0
Criteria – Escherichia coli
Number of microbiological tests - E. Coli. 1,087 167 112
Number of samples containing positive E. Coli. /100mL 0 0 0
Table 10: Summary drinking water Bacterial tests
2019 Distribution Water Quality Summary ➢ Over 1000 free Chlorine, Total Coliform and E. coli. tests were run in the distribution system ➢ Total Coliform and E. coli. counts all met drinking water quality objectives with no positive counts ➢ Quarterly and annual running average THM and HAA concentrations were below the drinking water
guidelines

City of Kelowna 2019 Annual Drinking Water and Filtration Exclusion Report
Page | 18
Filtration Deferral Requirements
The City of Kelowna applied for filtration treatment exclusion in 2010 and was approved in 2011 based on the proviso that several treatment and water quality objectives be adopted, monitored, and reported to Interior Health on an annual basis. Since obtaining filtration exclusion, COK has continually met or exceeded the seven requirements outlined by Interior Health and approved by the provincial Medical Health Officer.
Dual Disinfection
In accordance with the IHA dual barrier approach for drinking water, all of the Kelowna intake systems are equipped and utilize both Ultra Violet (UV) and chlorine disinfection prior to the water entering the distribution system. UV disinfection is currently applied at a minimal dose of 40 MJ/cm through the reactor cells and chlorine (Hypochlorite) dosed to maintain a minimum free chlorine residual of 0.2 mg/L in the distribution system.
Protozoa Sampling
Protozoa was analyzed extensively between 1996 and 2013 on raw and treated water samples throughout the COK water system. After consultation and review of the data with IHA, this requirement was removed from the scope in 2014 as it was demonstrated that the UV treatment adequately accounted for the deactivation and neutralization of all protozoa entering the water system.
Source Water Protection
The COK relies on Federal and Provincial Acts, Regulations, Stewardship Plans, Best Management Practices and Local Government bylaws and policies to protect water resources from the impacts of land use in the watershed. As a condition on Permit to Operate, COK contracted an external Environmental consultant with the purpose of conducting and documenting a Water Source Protection Plan (WSPP) assessment. This was formally completed in 2011 with the intent that the resulting recommendations would trigger an assessment action response plan that would be annually reviewed and updated in accordance with the risks identified. Six main risk categories were identified as influential to the water quality for the COK and include:
1) Creek Flow 2) In-Lake Algal Production 3) Wastewater Treatment Plant Discharge 4) Transportation Corridor Spills 5) Boating Activities 6) Impact of Lake Physics

City of Kelowna 2019 Annual Drinking Water and Filtration Exclusion Report
Page | 19
A formal source water protection plan was developed in 2019 that addressed:
• Quality and frequency of the City water quality monitoring program
• Upgrades to protect against invasive mussels,
• Establishing an intake protection zone (IPZ)
• Stormwater management
• Public education
• Utility long range planning
• Climate change
A technical advisory committee (TAC) was formed that consisted of Interior Health, Larratt Aquatic consultant, and the City of Kelowna that meet on a regular basis to review and update current initiatives and actions items
Drainage Water Quality Program
As part of the COK Source Water Protection Assessment Plan, there are number of chemical and biological parameters that are tested and monitored at storm water outfalls and local tributaries that enter Okanagan Lake. Contaminants carried through the drainage system have the potential to impact the water quality at the intakes and therefore have been categorically assessed, recommendations made, and actions taken to mitigate and monitor the risks. Yearly assessments include correlating elevated Turbidity and E. Coli. levels in tributaries to the same parameters at intakes, recording water quality changes during rain and flushing events through the storm water system, summer beach sampling for E. Coli., and testing of routine water quality parameters in creeks at a minimum of 5 times a month to determine the level of nutrient and pathogen contribution to the lake water quality. Details of each category are listed with commentary in Appendix E
Raw Water Bacteria
As per the annual COK water quality sampling program, the source water was monitored for Total and E. Coli. Bacteria throughout the year at each intake. Results are collected and reviewed through the WaterTrax software system that allows for alert levels to flag and notify the Utility of elevated levels. Corresponding monthly summary reports were issued to Interior Health as part of the Condition on Permit to operate and to assess if the water treatment is sufficiently neutralizing the raw water bacterial counts at the intake. For the 2019 calendar year, all samples from poplar Point, Cedar Creek, Eldorado or Swick Road intakes met the Filtration Deferral criteria of:
• No more than 10% of the source water E. Coli. samples exceed 20/100ml in any 6-month period (Table 15 in Appendix B)

City of Kelowna 2019 Annual Drinking Water and Filtration Exclusion Report
Page | 20
The concentrations of Total Coliform in the source water increased in August and September at all intakes and dropped off in October, during which time the Lake experienced thermal stratification (Table 14 in Appendix B). Operational adjustments were made at each intake treatment site throughout the year by adjusting chlorine and UV energy dosage as needed. Distribution system testing indicated that the applied treatment was effective at neutralizing all bacteria despite any elevated levels in the raw water source.
Raw Water Physical Parameters
In 2006, Interior Health introduced the Turbidity Education and Notification Campaign for unfiltered water systems to inform customers that health risks increase as Turbidity rises and to notify customers (particularly for at-risk populations with weakened immune systems) for levels higher than one (1) Nephelometric Turbidity Units (NTU). None of the four COK intakes currently are equipped with filtration and therefore routine testing and reporting of Turbidity levels to Interior Health are required to demonstrate that source water levels meet the 1 NTU target.
Turbidity is continuously measured at all water supply sources via on-line Turbidity meters and monitored by SCADA and is primarily used as a screening or trending indicator. Turbidity is additionally sampled and tested by City lab staff at regular intervals and with increased frequency once in-line monitors indicate that turbidity is approaching or exceeding the 1 NTU threshold using calibrated equipment. 2017-2019 SCADA Turbidity values for each of the intakes are plotted in Figures 3-6 with weekly average granularity and associated guidelines.
The onset of freshet and subsequent increase in Turbidity noted at the intakes was first noted, albeit short lived, at Poplar Point and earlier in the year than in the previous two years (Figure 3). This may be primarily attributed to the general current and wind direction coming from the south and directing tributary turbidity plumes in the direction of Poplar to the north Similar turbidity effects noted, but delayed at the other three intakes. In contrast to 2017 and 2018, at no point did the turbidity measurements exceed the CDWQ guidelines and subsequently, no water quality advisory had to be issued within the City Utility boundary. In order to better understand the relationship and impact of these tributaries, the COK has implemented a sampling program that cross references the freshet as well as timely weather events with water quality tested at the intakes. Summary and commentary on these relationships can be found in the drainage report (Appendix E).
A detailed list of additional raw water physical parameters monitored for filtration exclusion are listed in the Appendix B of this report. The Okanagan Lake Collaborative Monitoring Agreement 2019 Summary Report supplements the findings in this report, but on a larger, lake wide overview to determine if watershed trends exist and what collaborative monitoring and action needs to be taken by valley wide stakeholders.

City of Kelowna 2019 Annual Drinking Water and Filtration Exclusion Report
Page | 21
Figure 3. On-line Turbidity values at Poplar Point intake
Figure 4. On-line Turbidity values at Cedar Creek intake
0
0.2
0.4
0.6
0.8
1
1.2
1.4
Jan-19 Feb-19 Mar-19 Apr-19 May-19 Jun-19 Jul-19 Aug-19 Sep-19 Oct-19 Nov-19 Dec-19
Turb
idit
y (N
TU)
Poplar Point Intake On-Line Turbidity
CDWQG 2017 2018 2019
Start of Freshet
0
0.2
0.4
0.6
0.8
1
1.2
1.4
Jan-19 Feb-19 Mar-19 Apr-19 May-19 Jun-19 Jul-19 Aug-19 Sep-19 Oct-19 Nov-19 Dec-19
Turb
idit
y (N
TU)
Cedar Creek Intake On-Line Turbidity
CDWQG 2017 2018 2019
Start of Freshet

City of Kelowna 2019 Annual Drinking Water and Filtration Exclusion Report
Page | 22
Figure 5. On-line Turbidity values at Eldorado intake
Figure 6. On-line Turbidity values at Swick intake
0
0.2
0.4
0.6
0.8
1
1.2
1.4
1.6
1.8
2
2.2
Jan-19 Feb-19 Mar-19 Apr-19 May-19 Jun-19 Jul-19 Aug-19 Sep-19 Oct-19 Nov-19 Dec-19
Turb
idit
y (N
TU)
Eldorado Intake On-Line Turbidity
CDWQG 2017 2018 2019
Start of Freshet
0
0.2
0.4
0.6
0.8
1
1.2
1.4
1.6
1.8
Jan-19 Feb-19 Mar-19 Apr-19 May-19 Jun-19 Jul-19 Aug-19 Sep-19 Oct-19 Nov-19 Dec-19
Turb
idit
y (N
TU)
Swick Intake On-Line Turbidity
CDWQG 2017 2018 2019
Start of Freshet

City of Kelowna 2019 Annual Drinking Water and Filtration Exclusion Report
Page | 23
Water Production Water production within the COK service area are monitored at each pump station prior to treatment. The Poplar Point system consistently accounts for 84% of the total annual water production with the remaining 16% spread between Cedar Creek, Eldorado and Swick. Production demand typically picks up in April, peaks in late July / early August due to agriculture and irrigation demand and drops through October (Figure 7). 2019 had very similar water demand profile relative to 2018 with less than 1% difference in the total production year over year.
Figure 7. Monthly and Year over Year water production at each COK pump station
During the hotter and direr summer months between June and September, water demand typically spikes in intensity and coupled with increased population growth, 2019 had a marginally higher peak daily demand relative to 2017 and 2018 (Figure 8). However, there continues to be a comparatively long term decreasing trend in overall peak demand.
0
500000
1000000
1500000
2000000
2500000
Jan Feb Mar Apr May Jun Jul Aug Sep Oct Nov Dec
Pro
du
ctio
n m
³
2019 Monthly and Total Water Production
Poplar Point Eldorado Cedar Creek Swick 2018 Total 2019 Totals

City of Kelowna 2019 Annual Drinking Water and Filtration Exclusion Report
Page | 24
Figure 8. Peak daily water production volume trending
Similarly, the total water production has been tracked relative to the population of the Utility service area over the past 14 years (Figure 9). Of note, there is an overall downward water volume production demand trend relative to increasing population due to a combination of factors including level of precipitation, conservation and water restriction efforts, amount of land developed for agricultural purposes, and population densification.
Figure 9. Total water production relative to COK population growth
70000
75000
80000
85000
90000
95000
100000
2000 2001 2002 2003 2004 2005 2006 2007 2008 2009 2010 2011 2012 2013 2014 2015 2016 2017 2018 2019
Vo
lum
e (
m3 )
Peak Daily Water Production Volume
100000
105000
110000
115000
120000
125000
130000
135000
140000
145000
14.0
14.5
15.0
15.5
16.0
16.5
17.0
17.5
18.0
2005 2006 2007 2008 2009 2010 2011 2012 2013 2014 2015 2016 2017 2018 2019
Po
pu
lati
on
Wa
ter V
olu
me
Pro
du
ced
(m
illio
n m
3)
Water Production vs. Kelowna Population
Water Production Population Linear (Water Production)

City of Kelowna 2019 Annual Drinking Water and Filtration Exclusion Report
Page | 25
Consumption is also tracked by service type and metered accounts and provides a correlation between what is produced and what is consumed. Discrepancies between the two values indicate potential water loss due to leakage or line flushing or as a result of unmetered accounts. A SEKID metering program will be implemented in 2020 and a full meter replacement program is planned for 2021-2026 with enhanced features that will allow for much more detailed data regarding water consumption and ability to identify leaks within 24 hours as opposed to 2 month using traditional manual meter reading. The standardized consumption rates have been relatively consistent for the past five years as the population trends have increased (Table 11).
* Includes water sold through fill stations and portable hydrant carts, used by the Utility, City facilities including the Fire Department, and apparent losses.
Table 11. Summary of water production and consumption trends
2013 2014 2015 2016 2017 2018 2019 Unit
Production
Total Pumped 16,962 15,243.20 16,083.60 15,512.80 15,833.28 15,712.41 15,734.10 1000 m3
Population within COK Water Utility Boundary
2.7 per Single Family Dwelling, 1.9 per multifamily unit 68,523 68,077 69,679 70,694 73,542 74,679 75,370 people
Climate
Precipitation (April-September) (Normal: 209 mm) 288 214 153 148 99 134 146 mm
Number of Services (active and inactive)
Residential 14,408 14,425 14,084 14,365 14,313 14,480 14,565 services
Multifamily 409 387 342 351 356 416 434 services
Strata 660 651 648 657 661 663 665 services
Commercial 1,120 1,074 1,361 1,367 966 954 966 services
Parks 187 194 167 167 152 176 175 services
Total 16,784 16,980 16,910 16,907 16,448 16,689 16,805 services
Consumption (Metered)
Residential 5,369.30 5,481.40 6,052.00 5,647.60 5,981.80 5,733.70 5,486.10 1000 m3
Multifamily 2,251.10 2,168.80 2,542.70 2,443.00 2,502.20 2,703.30 2,804.65 1000 m3
Strata 656 673.4 735.5 717 736.2 768.3 658.82 1000 m3
Commercial 3,250.90 3,304.90 3,666.00 3,867.80 3,903.20 3,754.20 3,717.21 1000 m3
Parks 402.2 495.6 585.3 498 499.8 578 564.7 1000 m3
Total 11,929.50 12,124.00 13,599.50 13,173.40 13,699.00 13,537.50 13,231.48 1000 m3
Indicator
Other Use* 2,728.00 829.9 2,421.50 2,201.10 2,134.28 2,174.91 2,480.93 1000 m3
Max Day Demand 89.4 87.7 87.9 77.8 89 88.2 89.2 1000 m3
Average Day Demand 41 41.7 44.1 42.4 43.4 43 43 1000 m3
Utility wide Peak Day Demand 1,304 1,392 1,261 989 1210 1182 1183 L/capita/day
Utility wide Average Day Demand 598 662 633 539 590 576 569 L/capita/day
Single Family Dwelling Demand 371 420 436 403 418 402 382 L/capita/day
Average Monthly Residential Consumption per Service 34 35 36 33 35 33 31 m3/month
Peaking Factor (April-September) 1.6 1.6 1.5 1.4 1.51 1.49 1.52
Peaking Factor (October-March) 1.3 1.5 1.7 1.7 1.8 1.44 1.4

City of Kelowna 2019 Annual Drinking Water and Filtration Exclusion Report
Page | 26
Water Sustainability Management
The COK demand management programs are focused on reducing water demand both internally (within the treatment system and COK sponsored services such as the Parks department) and the customer point of use in order to achieve sustainable use. Since the implementation of several water demand management initiatives since 2005, which includes mandatory installment of water meters for residential, commercial and agriculture, tiered consumption-based water rates, and water conservation education programs, COK has seen an overall reduction in yearly water demand (Figure 9).
Water Conservation
Landscape Water Conservation Reports (LWCR) Submission of Landscape Water Conservation Report is a bylaw requirement within Utility boundary for any irrigation installation or retrofit that covers an area greater than 100m2 in order to confirm that acceptable watering systems and landscape materials are utilized. While the LWC report is a bylaw requirement by the homeowner, the majority of the reports are submitted by private contractors. Participation rates have historically been quite low (18%), but through outreach and education, the number of contractors submitting reports has risen to an estimated 30%. Water Smart walk through follow up visits occurred at more than 20% of the sites in order to verify the water use efficiency and workmanship in relation to the submitted reports. The attributed water savings from this initiative were calculated at 12,000 m3 in 2019 and a total of 70,000 m3 since inception of the LWCR in 2013.
Water Restrictions Year round watering restrictions remain in place since first introduction in 2016 and rarely elevated beyond stage 1. However, a temporary stage 4 restriction was imposed in the Mission area on Sep 4 due to a UV lamp breakage and intake shutdown at Eldorado. No health advisories had to be issued, but restriction was in place until Oct 5 when water demand dropped off. Restrictions are intended to make residents cognoscente of their water usage and to reduce the daily water production peak demand as well as restricted outdoor water use on Mondays to allow the reservoirs to fill. Allowable irrigation times are limited to 3 days per week and specific times during the allowable day to maximize plant material uptake. As with previous years, neighborhoods were patrolled for violations to the restrictions with notifications provided on compliance where needed. The implementation of advanced metering infrastructure in 2020 will allow the Utility to get a better understanding of watering habits and subsequent notifications.
Water Rebates In order to assist residents to reduce water consumption, two rebates were offered in 2019; $40 towards rain sensors purchases coupled to an irrigation controller and a rebate towards retrofitting landscapes and irrigation systems to more water efficient options. Estimated water savings for both rebates totaled 2 million liters and will be carried over into 2020 for promotion.

City of Kelowna 2019 Annual Drinking Water and Filtration Exclusion Report
Page | 27
QWEL The importance of proper planning, design and workmanship of irrigation systems and landscape selection is paramount to an effective water conservation program. Irrigation professionals significantly contribute to each of those stages and as such is vital that they apply water smart principles when designing and installing water systems and landscape materials. In order to accomplish this, the City of Kelowna became the first Canadian Professional Certifying Organization (PCO) to sponsor and endorse a Qualified Water Efficient Landscaper (QWEL) certification program. This training, testing, and on-site follow up inspection program provides an elevated level of contractor accountability. This ensures that knowledge and workmanship of these contractors are in line with water conservation in mind and suitable to our local climate. The City will promote this program and use this in the future as the benchmark for irrigation qualifications in the City along with the various Irrigation Industry Association of BC (IIABC) CIT, CIT2, and CID designations.
Irrigation Inquiries / Service Requests / Community Events The COK offers a number of free services to assist residents with inspection, operation, and scheduling of their irrigation systems. 55 service requests were submitted to Waterkind Services who responded with an on-site visit to assess the condition and operation of the irrigation system and make recommendations as to action required. Water Smart also participated in 11 community events in 2019 including the Builder Information sessions, Park n Play events, Festivals, and Neighborhood Community Association meetings with the assistance of a summer student. Residents are reminded that the City offers free residential and commercial irrigation audits by a qualified professional who will assess and make recommendations that may significantly reduce water use. For more information, please visit www.kelowna.ca/watersmart
Water Disruption Events
As with all water utilities, there are certain events throughout the year that interrupt water services – either planned or unplanned. These include pipe breaks, seized valves, leaking hydrants, and power outage occur. Regardless of cause, the COK strives to quickly correct the deficiencies with minimal disruption to water service as per AWWA standard C651-14. Summary of 2019 infrastructure replacement and repairs are captured in Table 12 relative to previous years.
2015 2016 2017 2018 2019*
Water Main break repairs 11 12 8 7 17
Water service leak repairs 91 100 121 103 123
Fire Hydrant replacements 4 4 3 4 5
Water Main Blow off replacements
7 8 3 5 4
Water Disruption Events 38 66 104 46 77
*Note: includes SEKID distribution system repairs and events
Table 12. 2015-2019 Water disruption events

City of Kelowna 2019 Annual Drinking Water and Filtration Exclusion Report
Page | 28
Emergency Response and Notifications The COK Water Utility and Communications department has developed a series of emergency protocol documents that addresses action that needs to be taken in the event of water quality deviations or emergencies:
➢ Water Utility Emergency Preparedness and Response Plan ➢ Public Notification Protocol ➢ Turbidity Response Plan ➢ Drought Trigger Response Plan
These documents contain information on course of actions, list of appropriate contacts, and procedure necessary to assist operators and staff to make timely and informed decisions. The COK is responsible for notifying IHA as well as the public in the event that the treated water quality does not meet drinking water standards. Notifications are issued in the form of media releases, electronic sign boards, social media outlets, radio messages, automated email notifications for those registered on a sensitive customer list (hospitals, care homes, daycare and nurseries), website updates and links with specific instructions for food establishments, signage at public water fountains, washrooms and facilities, and in some cases door to door hangers distributed by staff. Residents and businesses are reminded to sign up on the City of Kelowna e-subscribe system, found on the City website at www.kelowna.ca, that allows the selection and automatic notification delivery of a number of service updates, including water quality changes and advisories.
Water Quality Advisory
No Water Quality Advisory (WQA) was issued in the Kelowna Water Utility related to freshet turbidity issues in 2019. However, there were 22 localized Boil Water Notices issued (BWN) in the former SEKID area connected to water integration construction events. These were typically short in duration (1-2 days) that allowed proper pipe repairs, disinfection and water quality testing before re-commissioning. In addition to the localized BWN, a SEKID-wide BWN was issued on April 3 due to higher water turbidity related to freshet, which is a common at that time of year. This was downgraded to the year-round WQA on June 15. A water main break was also experienced in the District of Lake Country, which supplies the north industrial area of the City boundary, and a subsequent precautionary BWN was issued on May 23 through May 30 until repairs, disinfection and testing allowed a downgrade to normal water quality conditions. In all cases, water quality testing was conducted in the internal, accredited City run laboratory with results being available within 24 hours of sampling.

City of Kelowna 2019 Annual Drinking Water and Filtration Exclusion Report
Page | 29
Service Requests and Responses
The COK provides residents a number of open and transparent options to report water and water quality related issues to the utility. These include a phone-in number as well as on-line service request form to submit electronically through the COK website. These are all documented and responded to in a timely fashion by related utility staff that are equipped to address the public concerns or comments.
In 2019, there were a total of 108 service requests submitted and responded to by staff: ➢ Water Restrictions: 26 ➢ Dirty/cloudy water: 8 ➢ Taste and Odor: 7 ➢ Drinking Water information: 13 ➢ Pool discharge: 1
➢ Miscellaneous: 16 ➢ Catch Basin discharge: 8 ➢ Source water protection: 1 ➢ Water Smart – Water Conservation: 28
The majority of the service requests in 2019 were similar in scope and frequency as per previous years with the exception of an increase in the number of water restriction inquiries. A number of responses were received from residents in the SEKID area appreciating the improvement in water quality as a result of the integration project.
Long Term Improvements The COK has a dedicated Utility Planning department that works in conjunction with Utility Operations in determining the design, implementation, and funding requirements for long term water service improvements. This requires reliable development forecasts, environmental considerations, government grant funding opportunities, and strategies that chart the path for future growth while balancing the sustainability of existing capital assets. The COK continues to charge an annual Water Quality Enhancement (WQE) fee to residents and businesses that is set aside to fund water quality capital improvement initiatives such as SEKID water integration project and future water filtration. A total of approximately $6M was used for the water integration project while $2.4M was contributed to the fund for a total balance of $9.8 million at the end of 2019.
Current and future initiatives include:
➢ Integration with surrounding water districts to improve water quality and water supply resiliency for all COK residents
➢ Upgrade of the Cedar Creek pump station to increase capacity and allow for the decommissioning of the Eldorado pump station
➢ Comprehensive Kelowna Area Based Water Management Plan that incorporates a full overview and guidance on water quality, quantity and use in the Kelowna and surrounding area
➢ Completion of the water integration project in Southeast Kelowna
➢ Creation of long term water conservation plan through 2027
➢ Full domestic water metering of the Southeast Kelowna area
➢ Utility wide replacement of all water meters to advanced technology data collection and reporting system

City of Kelowna 2019 Annual Drinking Water and Filtration Exclusion Report
Page | 30
Conclusion
The COK is committed to continually improving water quality and services to its residents, commercial users, and agriculture stakeholders. Protecting our water source is not an option – it is a requirement, for our current generation and those to come. To that end, the City has created a list of priorities of which providing safe and reliable drinking water is at the heart of leadership decisions. This requires extensive planning, funding, collaboration, vision and leadership from City Council all the way through to the water utility staff and operators working diligently to support the Kelowna vision statement:
“To be the best mid-sized city in North America”
City of Kelowna is pleased to present the 2019 Annual Water Quality Report, detailing the health and direction of our water system. If you have any questions about this report or wish to have additional information provided, please contact the COK Water Utility at 250-469-8475 or email at [email protected]

City of Kelowna 2019 Annual Drinking Water and Filtration Exclusion Report
Page | 31
Appendix A 2019 Water Quality Sampling and Reporting Guidelines

City of Kelowna 2019 Annual Drinking Water and Filtration Exclusion Report
Page | 32
Kelowna Water Utility - Water Quality Sampling Program 2019 The Kelowna Water Utility (KWU) currently operates four distinct water systems under two permits within the water Utility Boundary. They consist of a primary City of Kelowna System, Swick Road Water System, Kelowna International Airport, and newly acquired South East Kelowna System.
1. Primary City of Kelowna System – fed by Poplar Point intake and Cedar Creek intake supplemented by Eldorado intake when operationally required. The Poplar Point System is interconnected to the Cedar Creek System via a booster pump at Steele Road Reservoir.
2. Swick System – small water system fed by Swick Road intake, completely separate from Poplar Point system.
3. Airport Water System –Glenmore Ellison Irrigation District supplies bulk water to the location, and it is then treated using point of use treatment technology.
4. South East Kelowna System – fed by a single intake on Hydraulic Creek and supplemented with ground water wells as
seasonal agriculture water demand increases. The Hall Road area is exclusively serviced by Johnson Road well and is licensed.
Water quality sampling is to be conducted in accordance with the BC Drinking Water Protection Regulation, 2005, Section 15 Schedule B, which states that the number of bacteriological samples taken per month is to be 1 per 1,000 of population. Based on population estimate of 75,000 in 2018, the City of Kelowna 2019 water quality routine sampling plan will meet and exceed the representative sampling requirements. This will be supplemented by additional testing in the event of water main breaks, re-tests, water advisories, or other irregular activities. Kelowna Water Utility 2019 Sampling Program City of Kelowna, Swick, and South East Kelowna Systems:
Daily On-line Data Monitoring
• Source Water (COK, Swick only) o pH, Turbidity, UVT, Conductivity, Temperature
• Treated Water o Free Chlorine residual, pH and Turbidity (South East Kelowna only)
Weekly
• Source Water o Total Coliform and E. Coli., Turbidity, Color, Temperature, UVT, pH
• Treated Water (Distribution) o Total Coliform and E. Coli., Turbidity, Color, Temperature, UVT, Total/Free Chlorine, Odor
Quarterly (Treated Water)
• Trihalomethanes, Haloacetic Acids
• Ammonia and Algae (Cyanobacteria) – (COK and Swick only) Annual (Treated Water)
• Comprehensive Chemical scan Quadrennial (Source Water)
• Pesticide and Herbicide scan, Radiological parameters – (COK and Swick only)

City of Kelowna 2019 Annual Drinking Water and Filtration Exclusion Report
Page | 33
Airport System: Daily On-line Data Monitoring (Treated Water)
• Turbidity, Chlorine residual Monthly (Treated Water)
• Total Coliform and E. Coli., Turbidity, Temperature, U.V, Free and Total Chlorine, Color, Odor Quarterly (Treated Water)
• Trihalomethanes, Haloacetic Acids, Ammonia
Reporting All Drinking Water Quality and Drainage Water Quality data will be reported to the Watertrax data base. Summary reports of the Drinking Water quality will be reported to IHA monthly and is to include: Drinking Water Quality
• Turbidity, Free & total Chlorine - max, min, mean, number of tests • Total Coliform and E. Coli, number of sites. Only positives will be location specific • UVT on-line and grab samples tested in lab – max, min, mean, number of tests • Operational activities, distribution events, and customer complaints
• Water production data, volume off spec water distributed, and any relevant events and activities
• THM and HAA quarterly *Note-During the winter months (November – March) there is a decrease in the number of sites sampled due to some sample stations not being compatible with the colder weather and freezing. Sampling frequency may also change relative to distribution events, construction, or necessary water advisories. Water Quality Analyst will inform Water operators in the event that elevated bacterial counts or turbidity are noted during source water quality monitoring for operational adjustments. Protocol for notification of positive E Coli. result in distribution system
➢ KWU lab staff will provide immediate notification of confirmed positive E. Coli results to KWU Supervisor ➢ Supervisor will immediately contact IH Environmental Health Officer or designate and provide written copy of test
results within 24 hours ➢ All positive E. Coli will be immediately resampled for confirmation ➢ Appropriate corrective actions will be determined in collaboration with IHA
Protocol for notification of positive Total Coliform result in distribution system
➢ All positive Total Coliform results will be reported to KWU Supervisor and will be resampled immediately ➢ If the following criteria is met, KWU will immediate contact the IH Environmental Health Officer:
1. Result is greater than 10 MPN or CFU per 100mL 2. Consecutive resample result is positive 3. Positive result is under anomalous or suspicious conditions
➢ Appropriate corrective actions will be determined in collaboration with IHA Storm Water Quality
• Regular Sampling- the standard drainage water quality scan (SDWQS) includes ammonia, chloride, color, conductivity, dissolved oxygen, E. Coli, pH, suspended solids, temperature, and turbidity will be analyzed in-house. Site number may change due to seasonal variations

City of Kelowna 2019 Annual Drinking Water and Filtration Exclusion Report
Page | 34
• 5/30 (A- Creek Water)- for filtration exclusion, the mouths of Mission Creek, Mill Creek, and Brandt’s Creek are sampled 5 times in 30 days from April 15th to September 15th, analyzed for the SDWQS and included in the annual report
• Water Quality at Intakes (B- Creek Water)- for filtration exclusion, the mouths of Mission Creek, Mill Creek, and Brandt’s Creek are sampled when decreased water quality of raw water at the intakes occurs, analyzed for the SDWQS and included in the annual report
• Storm Water- for filtration exclusion, the first flush samples are collected at selected outfalls on Mill Creek and Brandt’s Creek, analyzed for the SDWQS and included in the annual report
• Storm / Sanitary interconnect- for filtration exclusion, Fascieux Creek is sampled approx.3 times per year at 3 locations during rain events, analyzed for the SDWQS and included in the annual report
• Irregular events- may be analyzed for parameters in the SDWQS suite (samples may be sent to a private lab for further analysis if the situation dictates). Discretion of either Tech analyst or IHA relative to circumstance.

City of Kelowna 2019 Annual Drinking Water and Filtration Exclusion Report
Page | 35
Appendix B Source Water Quality Monitoring Parameters

City of Kelowna 2019 Annual Drinking Water and Filtration Exclusion Report
Page | 36
Source Water Quality Parameters
Turbidity
Turbidity measurements are related to the optical properties of water. Suspended materials such as clay, silt, organic and inorganic particles, plankton, and other microscopic organisms all contribute to Turbidity and can have a negative effect on disinfection techniques.
In contrast to 2017 and 2018, the Turbidity trend decreased in 2019 with no Water Quality Advisory having to be issued related to freshet. The average and maximum values decreased as did the number of exceedances over the CDWQG of 1 NTU (Table 13). Both the monthly and 5-year Turbidity trend indicated a decrease after 2 years of elevated concentrations (Figure 10 and 11).
Intake Average
(NTU) Minimum
(NTU) Maximum
(NTU) Guideline
(NTU) Number of
Exceedances Number of
Tests in 2019
Poplar Point 0.318 0.177 0.643 <1.0 0 173
Eldorado 0.735 0.415 1.02 <1.0 1 11
Cedar Creek 0.458 0.242 0.933 <1.0 0 42
Swick 0.347 0.181 0.605 <1.0 0 90
Table 13. Source Water Turbidity annual summary
Figure 10. Monthly Turbidity average at Intake source
0
0.1
0.2
0.3
0.4
0.5
0.6
0.7
0.8
0.9
1
Jan Feb Mar Apr May Jun Jul Aug Sep Oct Nov Dec
Turb
idit
y (N
TU)
Monthly Average Source Water Turbidity
Poplar Point Cedar Creek Swick Eldorado
CDWQG

City of Kelowna 2019 Annual Drinking Water and Filtration Exclusion Report
Page | 37
Figure 11. 5-Year Turbidity trend in Source Water
Total Coliform
The coliform group consists of several genera of bacteria belonging to the Enterobacteriaceae family. The detection of these bacteria can be determined with a variety of analytical techniques including membrane filtration and lactose fermentation. The COK utilizes the Quanti-tray method which is based on the fermentation technique which involves a reaction with an enzymatic substrate. The water sample reacts with the enzymes in multiple wells or tubes over 18-24 hours and generates a detectable yellow color for positive Total Coliform. The replicate wells are reported in terms of the Most Probable Number (MPN) which is statistically derived number to determine the presence of the coliform.
The average coliform concentrations over the course of 2019 was higher than 2018, but the maximum counts and number of counts >100 MPN/100mL decreased at all intake locations (Table 14). The significant yearly increase noted at the Eldorado seasonal intake can be attributed to one month (August) of elevated counts (Figure 13).
Intake Average
(MPN/100ml) Minimum
(MPN/100ml) Maximum
(MPN/100ml)
Number of Tests in 2019
# of Tests >100 MPN
2019 % of Tests
>100MPN
2018 % of Tests
>100MPN
Poplar Point 40 0 410.6 173 27 16 24
Eldorado 300 0 2489 11 2 18 39
Cedar Creek 69 0 547.5 42 8 19 22
Swick 80 0 1413.6 90 15 16 19
Table 14. Source Water Total Coliform annual summary
0
0.2
0.4
0.6
0.8
1
1.2
2015 2016 2017 2018 2019
Turb
idit
y (N
TU)
5-Year Turbidity Trend in Source Water
Poplar Point Cedar Creek Swick Eldorado
CDWQG

City of Kelowna 2019 Annual Drinking Water and Filtration Exclusion Report
Page | 38
Figure 12. Monthly Total Coliform average at Intake source
Figure 13. 5-Year Total Coliform trend in Source Water
0
200
400
600
800
1000
1200
1400
Jan Feb Mar Apr May Jun Jul Aug Sep Oct Nov Dec
Tota
l Co
lifo
rm (
MP
N/1
00
mL)
Monthly Average Source Water Total Coliform
Poplar Point Cedar Creek Swick Eldorado
0
50
100
150
200
250
300
350
2015 2016 2017 2018 2019
Tota
l Co
lifo
rm (
MP
N/1
00
mL)
5-Year Total Coliform Trend in Source Water
Poplar Point Cedar Creek Swick Eldorado

City of Kelowna 2019 Annual Drinking Water and Filtration Exclusion Report
Page | 39
E. Coli.
Escherichia coli (E. Coli.) is a sub-category within the coliform family and is used as a high risk indicator of harmful pathogens derived from human or animal fecal matter. The principle behind the methodology to detect E. Coli. is identical to the Total Coliform method in that an enzymatic reaction and subsequent fermentation is used to produce a detectable presence of the pathogen. The unique characteristic of E. Coli. using this technique is that in the presence of a long wave UV lamp (365nm), the resulting sample wells fluoresce. The number of wells that fluoresce are counted and calculated and reported as MPN values.
Similar to Total Coliform, the levels of E. Coli. dropped or remained consistent relative to previous years and were all within the filtration exclusion guideline of no more than 10% of E. coli. counts to exceed 20 MPN/100mL (Table 15, Figure 14-15). With the exception of Swick, the yearly average is E. coli count is well below 1 MPN/100mL.
Intake Average
(MPN/100ml) Minimum
(MPN/100ml) Maximum
(MPN/100ml)
Number of Tests in 2019
2019 # of Tests >20 MPN
2018 # of Tests >20MPN
Poplar Point 0.1 0 3.1 173 0 0
Eldorado 0.7 0 1 11 0 0
Cedar Creek 0.6 0 5.2 42 0 0
Swick 1.3 0 25.9 90 1 1
Table 15. Source Water E. Coli.
Figure 14. Monthly E. Coli. average at Intake source
0
2
4
6
8
10
12
14
16
18
20
22
Jan Feb Mar Apr May Jun Jul Aug Sep Oct Nov Dec
E. C
oli
(MP
N/1
00
mL)
Monthly Average Source Water E. Coli
Poplar Point Cedar Creek Swick Eldorado

City of Kelowna 2019 Annual Drinking Water and Filtration Exclusion Report
Page | 40
Figure 15. 5-Year E. Coli. trend in Source Water
pH
Measurement of pH is one of the most import and frequently used tests in water chemistry. Practically every aspect of water supply and treatment is pH dependent such as acid-base neutralization, water softening, precipitation, coagulation, disinfection, and corrosion control. At a given temperature, the intensity of the acidic or basic character of a solution is indicated by pH or hydrogen ion activity. Natural waters tend to have a pH value in the range of 4-9, and most are slightly basic (7.5-9) due to the presence of bicarbonates and carbonates of the alkali and alkaline earth metals in the environment. The pH remained firmly alkaline for each of the intakes and within the objective range of 7.5-10 with no instances of exceedance (Table 16). The yearly and 5-year trend indicate that the pH has returned to historical averages in contrast to the lower pH as a result of the 2017-2018 flooding events (Figure 17).
Intake Average Minimum Maximum Guideline Number of
Exceedances Number of
Tests in 2019
Poplar Point 7.96 7.24 8.62 7.0 - 10.5 0 172
Eldorado 8.45 8.23 8.65 7.0 - 10.5 0 11
Cedar Creek 8.08 7.52 8.54 7.0 - 10.5 0 42
Swick 8.06 7.29 8.65 7.0 - 10.5 0 90
Table 16. Source Water pH annual summary
0.0
0.2
0.4
0.6
0.8
1.0
1.2
1.4
2015 2016 2017 2018 2019
Ave
rage
E.
Co
li. (
MP
N/1
00
mL)
5-Year E. Coli. Trend in Source Water
Poplar Point Cedar Creek Swick Eldorado

City of Kelowna 2019 Annual Drinking Water and Filtration Exclusion Report
Page | 41
Figure 16. Monthly pH average at Intake source
Figure 17. 5-Year pH trend in Source Water
6.00
6.50
7.00
7.50
8.00
8.50
9.00
9.50
10.00
10.50
Jan Feb Mar Apr May Jun Jul Aug Sep Oct Nov Dec
pH
Monthly Average Source Water pH
Poplar Point Cedar Creek Swick Eldorado
CDWQG for pH 7.0-10.5
7.2
7.4
7.6
7.8
8
8.2
8.4
8.6
2015 2016 2017 2018 2019
pH
5-Year pH Trend in Source Water
Poplar Point Cedar Creek Swick Eldorado

City of Kelowna 2019 Annual Drinking Water and Filtration Exclusion Report
Page | 42
Color
Color in surface waters result primarily from the presence of natural organic humic matter. Humic matter consists of humic and fulvic acids; both of which cause a yellow-brown color that can be measured by spectrophotometer wavelength. Color is preferred to be kept to a minimum as those compounds are considered precursors in the formation of chlorine disinfection byproducts such as chloroform. Assessment of color data is primarily gauged against an aesthetic objective of 15 color units.
With the exception of Cedar Creek, color remained consistent or below historical averages with minimal exceedances of the Aesthetic objective of 15 ACU (Table 17, Figure 18, 19). This may be attributed to lower freshet volumes and sediment erosion entering the lake.
Intake Average
(ACU) Minimum
(ACU) Maximum
(ACU) Guideline
(ACU) Number of
Exceedances Number of
Tests in 2019
Poplar Point 8 5 13 AO:<15 0 173
Eldorado 13 10 18 AO: <15 1 11
Cedar Creek 10 7 18 AO:<15 5 42
Swick 8 4 14 AO:<15 0 90
Table 17. Source Water Color annual summary
Figure 18. Monthly Apparent Color average at Intake source
0.0
2.0
4.0
6.0
8.0
10.0
12.0
14.0
16.0
Jan Feb Mar Apr May Jun Jul Aug Sep Oct Nov Dec
Co
lor
(AC
U)
Monthly Average Source Water Color
Poplar Point Cedar Creek Swick Eldorado
CDWG AO <15.0

City of Kelowna 2019 Annual Drinking Water and Filtration Exclusion Report
Page | 43
Figure 19. 5-Year Apparent Color trend in Source Water
Temperature
Temperature is an important factor to consider in water quality as it has influences on several other parameters and can alter the physical and chemical properties of water. Water temperature is considered when determining:
o Metabolic rates of aquatic life o Dissolved Oxygen o Conductivity and Salinity o pH o Water Density
Temperature fluctuations also plays an important role in the lake limnology which can transport nutrients and potential contaminants to the water intake sources. The COK operational objective is to consistently draw from water source at <15oC, which was maintained 98% of the time at the intake sites (Table 18). Over trend indicated a marginal 0.1-0.6oC increase at the intakes above 2018 (Figure 21).
Intake Average (oC) Minimum (oC) Maximum (oC) Guideline
(oC) Number of
Exceedances Number of
Tests in 2019
Poplar Point 5.3 3.0 11.5 AO:<15 0 173
Eldorado 13.5 7.0 22 AO:<15 4 11
Cedar Creek 6.8 3.5 13.5 AO:<15 0 42
Swick 9.4 3.0 20.5 AO:<15 10 90
Table 18. Source Water Temperature annual summary
0
2
4
6
8
10
12
14
16
18
20
2015 2016 2017 2018 2019
Co
lor
(AC
U)
5-Year Color Trend in Source Water
Poplar Point Cedar Creek Swick Eldorado
CDWQG AO

City of Kelowna 2019 Annual Drinking Water and Filtration Exclusion Report
Page | 44
Figure 20. Monthly Water Temperature average at Intake source
Figure 21. 5-Year Temperature trend in Source Water
0
2
4
6
8
10
12
14
16
18
20
Jan Feb Mar Apr May Jun Jul Aug Sep Oct Nov Dec
Tem
pe
ratu
re (
0 C)
Monthly Average Source Water Temperature
Poplar Point Cedar Creek Swick Eldorado
CDWG AO <15.0
0.0
2.0
4.0
6.0
8.0
10.0
12.0
14.0
16.0
18.0
2015 2016 2017 2018 2019
Tem
pe
ratu
re (
oC
)
5-Year Temperature Trend in Source Water
Poplar Point Cedar Creek Swick Eldorado

City of Kelowna 2019 Annual Drinking Water and Filtration Exclusion Report
Page | 45
UV Transmittance
Ultra Violet transmittance (UVT) represents the amount of light transmitted through water and is used to gauge the effectiveness of the UV light will be on the disinfection of the drinking water. The higher the Transmittance, the less UV dosing, in theory, is required to treat the sample. It is important to note that both solid and dissolved compounds have the ability to absorb UV light, which in turn has a negative impact on UVT.
UVT is measured on unfiltered samples (representative of treatment type) at a wavelength of 254nm and reported as a percentage. All source water samples remained above the UVT operational >80% objective with improved water clarity over 2018, particularly at Eldorado (Table 19, Figure 23).
Intake Average
(%T) Minimum
(%T) Maximum
(%T) Objective
(%T) Number of
Exceedances Number of
Tests in 2019
Poplar Point 85.8 84.0 90.0 >80 0 173
Eldorado 84.2 83.3 86.8 >80 0 11
Cedar Creek 85.3 83.4 87.2 >80 0 42
Swick 85.8 83.7 88.7 >80 0 90
Table 19. Source Water UV Transmittance annual summary
Figure 22. Monthly UVT average at Intake source
75
80
85
90
95
Jan Feb Mar Apr May Jun Jul Aug Sep Oct Nov Dec
% U
V T
ran
smit
tan
ce
Monthly Average Source Water UVT Transmittance
Poplar Point Cedar Creek Swick Eldorado
Minimum Operational Objective

City of Kelowna 2019 Annual Drinking Water and Filtration Exclusion Report
Page | 46
Figure 23. 5-Year UVT trend in Source Water
Algae
The number and types of algae present in Okanagan Lake provide excellent water quality for most of the year. In the surface water, peak algae growth follows the spring overturn, followed by a lull during late July and August as key nutrients and vitamins are exhausted, and finally a smaller peak in cyanobacteria (blue-green algae) near the fall overturn. Cyanobacteria counts in intake samples often include species that inhabit deep water or grow along the substrate. Cyanobacteria are a problematic group of organisms in which some types can generate toxins, and all types contain BMAA, and they readily form THM’s (Trihalomethanes) after disinfection with chlorine. Okanagan Lake has been dominated by cyanobacteria for at least 70 years. Since 2006, the COK has contracted Larratt Aquatic Environmental consultants to conduct quarterly Microcystin sampling and analysis to determine concentrations of Cyanobacteria and general Algal biomass that would have an impact on water quality at the intake systems.
With increasing eutrophication (excess of nutrients) and climate change, the frequency of potentially toxic blooms is increasing across Canada. To date, City of Kelowna intake samples have not contained toxic concentrations of cyanobacteria as they have rarely exceeded 2000 cells/mL and never exceeded 4000 cells/mL in any year sampled so far and puts the water source at an Alert Level 2 out of 4 (highest) on the AWWA cyanobacteria alert scale.
76
78
80
82
84
86
88
90
2015 2016 2017 2018 2019
% U
V T
ran
smit
tan
ce
5-Year UVT Trend in Source Water
Poplar Point Cedar Creek Swick Eldorado
Operational Objective
City of Kelowna 2019 Annual Drinking Water and Filtration Exclusion Report
Page | 47
Overall, the COK 2019 alage counts were high for Okanagan Lake, but met all published criteria for drinking water; an increase attributed to the large freshets and flooding events during 2017-2018. There has been no increasing trend in cyanobacteria density or health concerns anticipated without a significant increase in nutrient loads or water temperature in the lake.

City of Kelowna 2019 Annual Drinking Water and Filtration Exclusion Report
Page | 48
Appendix C Treated Water Quality Monitoring Parameters

City of Kelowna 2019 Annual Drinking Water and Filtration Exclusion Report
Page | 49
Treated Water Quality Parameters
Turbidity
The primary function of monitoring the Turbidity post treatment is to ensure that the chlorination and UV dosing has not detrimentally affected the water quality and meets operational objective targets. Relative to the source water Turbidity, the level of treated water concentrations and exceedances remained relatively consistent (Table 20). Overall Turbidity trend for 2019 indicated a decrease of 0.03-0.10 NTU over 2018 and in-line with non-flooding years (Figure 25). The 5 year trend indicates a minor upward trend and has been primarily impacted by the flooding events of 2017-2018.
Intake Average
(NTU) Minimum
(NTU) Maximum
(NTU) Guideline
(NTU) Number of
Exceedances Number of
Tests in 2019
Poplar Point 0.332 0.201 0.685 <1.0 0 174
Eldorado 0.685 0.341 1.16 <1.0 1 29
Cedar Creek 0.426 0.218 0.755 <1.0 0 94
Swick 0.386 0.210 0.770 <1.0 0 91
Table 20. Annual Treated Water Turbidity summary
Figure 24. Monthly average Turbidity of Treated Water
0
0.1
0.2
0.3
0.4
0.5
0.6
0.7
0.8
0.9
1
1.1
1.2
Jan Feb Mar Apr May Jun Jul Aug Sep Oct Nov Dec
Turb
idit
y (N
TU)
Monthly Average Treated Water Turbidity
Poplar Point Cedar Creek Swick Eldorado
CDWQG: <1.0 NTU

City of Kelowna 2019 Annual Drinking Water and Filtration Exclusion Report
Page | 50
Figure 25. 5-Year Turbidity trend in Treated Water
Chlorine – Free
Chlorine is introduced to source water at each pump house through exposure and mixing with either chlorine gas or commercial hypochlorite at set time levels and concentrations that meet the criteria of 3 and 4-log reduction of bacteria and pathogens. Both Total and Free Chlorine are measured to ensure that the initial chlorine demand does not exceed the dosing applied and is at appropriate levels to maintain a residual throughout the entire length of the distribution system. Free Chlorine is primarily monitored as that is the form of chlorine available to neutralize pathogens beyond the initial dosing point. The average Free Chlorine value at each intake immediately post treatment met the operational objectives in 2019 (Table 21, Figure 26). There has been a marginal increase in the overall yearly average Free Chlorine in the 5-year trend (Figure 27).
Intake Average (mg/L)
Minimum (mg/L)
Maximum (mg/L)
Objective (mg/L)
Number of Tests in 2019
Poplar Point 1.54 0.59 2.00 0.20 173
Eldorado 1.46 0.89 1.82 0.20 28
Cedar Creek 1.33 0.98 1.64 0.20 94
Swick 1.00 0.45 1.70 0.20 90
Table 21. Treated Water Free Chlorine annual summary
0.000
0.200
0.400
0.600
0.800
1.000
2015 2016 2017 2018 2019
Turb
idit
y (N
TU)
5-Year Turbidity Trend in Treated Water
Poplar Point Cedar Creek Swick Eldorado Linear (Poplar Point )
CDWQG

City of Kelowna 2019 Annual Drinking Water and Filtration Exclusion Report
Page | 51
Figure 26. Monthly average Free Chlorine of Treated Water
Figure 27. 5-Year Free Chlorine trend in Treated Water
0.00
0.20
0.40
0.60
0.80
1.00
1.20
1.40
1.60
1.80
2.00
Jan Feb Mar Apr May Jun Jul Aug Sep Oct Nov Dec
Fre
e C
hlo
rin
e m
g/L
Monthly Average Treated Water Free Chlorine
Poplar Point Cedar Creek Swick Eldorado
Minimum Operational Objective
0.00
0.20
0.40
0.60
0.80
1.00
1.20
1.40
1.60
1.80
2015 2016 2017 2018 2019
Fre
e C
hlo
rin
e (
mg/
mL)
5-Year Free Chlorine Trend in Treated Water
Poplar Point Cedar Creek Swick Eldorado Linear (Poplar Point )

City of Kelowna 2019 Annual Drinking Water and Filtration Exclusion Report
Page | 52
Total Coliform
Effectiveness of water treatment is measured by the viable presence of both Total Coliform and E. Coli. bacteria. At no point throughout 2019 was there any positive Total Coliform detected immediately post treatment. This is in line with the 5-year
trend and the CDWQ guideline requirement of <1 MPN/100mL. (Table 22). Important to note that the reporting requirement of the MPN Quanti-tray method produces a minimum value of <1 MPN/100mL, which is essentially equivalent to the CDWQ guideline of 0 CFU/100mL.
Intake Average
(MPN/100ml) Minimum
(MPN/100ml) Maximum
(MPN/100ml) Guideline
(MPN/100ml) Number of
Exceedances Number of
Tests in 2019
Poplar Point <1.0 <1.0 <1.0 <1.0 0 172
Eldorado <1.0 <1.0 <1.0 <1.0 0 28
Cedar Creek <1.0 <1.0 <1.0 <1.0 0 94
Swick <1.0 <1.0 <1.0 <1.0 0 90
Table 22. Total Coliform in Treated Water annual summary
E. Coli.
The guideline objective for E. Coli. are identical to that of Total Coliform in that all viable bacteria related to Fecal matter requires complete and full inactivation (<1 MPN/100mL). The objective was achieved at all treatment points throughout 2019 (Table 23) with no requirement for the issue of any Boil Water Notices (BWN).
Intake Average
(MPN/100ml) Minimum
(MPN/100ml) Maximum
(MPN/100ml) Guideline
(MPN/100ml) Number of
Exceedances Number of
Tests in 2019
Poplar Point <1.0 <1.0 <1.0 <1.0 0 172
Eldorado <1.0 <1.0 <1.0 <1.0 0 28
Cedar Creek <1.0 <1.0 <1.0 <1.0 0 94
Swick <1.0 <1.0 <1.0 <1.0 0 90
Table 23. Treated Water E. Coli. annual summary

City of Kelowna 2019 Annual Drinking Water and Filtration Exclusion Report
Page | 53
pH
The pH level of the water has a direct influence on the effectiveness and efficiency of the chlorine treatment applied as well as impact on the rate of infrastructure corrosion. Ideal range of pH for maximum chlorine disinfection (Hypochlorous acid) is between 6-7, but corrosion is a concern at levels <7.5. The pH of treated water is similar to the source water and is not significantly altered in any fashion. Levels were consistently within the target guideline range at all treatment points (Table 24). The 5-year trend indicates a downward trend, but a rebound of recent pH values to a more alkaline condition in the lake (Figure 29).
Intake Average Minimum Maximum Guideline
(AO) Number of
Exceedances Number of
Tests in 2019
Poplar Point 7.66 7.06 8.09 7.0 - 10.5 0 174
Eldorado 8.16 7.76 8.43 7.0 - 10.5 0 27
Cedar Creek 8.07 7.48 8.60 7.0 - 10.5 0 95
Swick 8.14 7.47 8.70 7.0 - 10.5 0 91
Table 24. Treated Water pH annual summary
Figure 28. Monthly average pH of Treated Water
6.00
6.50
7.00
7.50
8.00
8.50
9.00
9.50
10.00
10.50
Jan Feb Mar Apr May Jun Jul Aug Sep Oct Nov Dec
pH
Monthly Average Treated Water pH
Poplar Point Cedar Creek Swick Eldorado
CDWQG for pH 7.0 - 10.5

City of Kelowna 2019 Annual Drinking Water and Filtration Exclusion Report
Page | 54
Figure 29. 5-Year pH trend in Treated Water
Color
Drinking water color below 15 Apparent Color Units (ACU) is typically undistinguishable to the average person. Elevated levels of color post treatment can have a direct connection to the concentration levels of chlorination byproducts such as THM’s and HAA’s. As with previous year data, chlorination and UVT treatment resulted in a 2-3 color unit drop in the treated water and only 1 exceedance above the Aesthetic objective of 15 ACU at all sites (Table 25). There was a marginal increase in the overall Color intensity relative to the 5-year average (Figure 31), which is primarily a result of the exceptionally high flows over 2017-2018.
Intake Average
(ACU) Minimum
(ACU) Maximum
(ACU) Objective
(ACU) Number of
Exceedances Number of
Tests in 2019
Poplar Point 6 3 10 AO:<15 0 173
Eldorado 11 7 16 AO:<15 1 28
Cedar Creek 7 3 13 AO:<15 0 94
Swick 7 0 14 AO:<15 0 90
Table 25. Treated Water Color annual summary
6.00
6.50
7.00
7.50
8.00
8.50
2015 2016 2017 2018 2019
pH
5-Year pH Trend in Treated Water
Poplar Point Cedar Creek Swick Eldorado Linear (Poplar Point )

City of Kelowna 2019 Annual Drinking Water and Filtration Exclusion Report
Page | 55
Figure 30. Monthly average Color for Treated Water
Figure 31. 5-Year Color trend in Treated Water
0
2
4
6
8
10
12
14
16
18
20
Jan Feb Mar Apr May Jun Jul Aug Sep Oct Nov Dec
Co
lor
(AC
U)
Monthly Treated Water Color
Poplar Point Cedar Creek Swick Eldorado
CDWQG AO <15
0
2
4
6
8
10
12
2015 2016 2017 2018 2019
Co
lor
(AC
U)
5-Year Color Trend in Treated Water
Poplar Point Cedar Creek Swick Eldorado Linear (Poplar Point )

City of Kelowna 2019 Annual Drinking Water and Filtration Exclusion Report
Page | 56
Temperature
The water temperature levels post treatment is not significantly different that the source water temperature as there is little heating or chilling applied during the treatment process. Elevated temperatures in treated water have been proven to enhance THM byproduct formation and therefore are preferred to be within objective limits. Minor objective exceedances were observed for both source and treated water during summer season, particularly at the shallower intakes at Eldorado and Swick (Table 26). There is a general downward trend in the 5-year average temperature (Figure 33).
Intake Average
(oC) Minimum
(oC) Maximum
(oC) Objective (oC) Number of
Exceedances Number of
Tests in 2019
Poplar Point 5.6 3.0 12.0 AO:<15 0 173
Eldorado 14.1 7.5 22.0 AO:<15 17 28
Cedar Creek 7.3 3.0 14.0 AO:<15 0 94
Swick 9.9 3.0 19.0 AO:<15 13 90
Table 26. Treated Water Temperature annual summary
Figure 32. Monthly average Temperature of Treated Water
0
2
4
6
8
10
12
14
16
18
20
Jan Feb Mar Apr May Jun Jul Aug Sep Oct Nov Dec
Tem
per
atu
re(o
C)
Monthly Treated Water Temperature
Poplar Point Cedar Creek Swick Eldorado Poly. (Swick )
CDWQG AO <15.0 oC

City of Kelowna 2019 Annual Drinking Water and Filtration Exclusion Report
Page | 57
Figure 33. 5-Year Temperature trend in Treated Water
UV Transmittance
After dosing thought the UV reactor cells, the transmittance of the treated water is increased by an average of 2% over the UV transmittance of the source water for all sites. All test results met the objective of >80% transmittance throughout 2019 and similar to the raw water, there was a noticeable increase in water clarity all intakes after treatment (Table 27). There was a minor decreasing trend in UVT over the past 5 years (Figure 35).
Intake Average
(%T) Minimum
(%T) Maximum
(%T) Objective
(%T) Number of
Exceedances Number of
Tests in 2019
Poplar Point 88.9 85.4 91.2 >80 0 173
Eldorado 86.7 85.9 88.3 >80 0 28
Cedar Creek 88.9 87.2 91.1 >80 0 94
Swick 87.5 84.7 90.6 >80 0 90
Table 27. Treated Water UV Transmittance annual summary
0.0
2.0
4.0
6.0
8.0
10.0
12.0
14.0
16.0
18.0
2015 2016 2017 2018 2019
Tem
pe
ratu
re (
oC
)
5-Year Temperature Trend in Treated Water
Poplar Point Cedar Creek Swick Eldorado Linear (Poplar Point )

City of Kelowna 2019 Annual Drinking Water and Filtration Exclusion Report
Page | 58
Figure 34. Monthly average % UVT for Treated Water
Figure 35. 5-Year %UVT trend in Treated Water
78.0
80.0
82.0
84.0
86.0
88.0
90.0
92.0
Jan Feb Mar Apr May Jun Jul Aug Sep Oct Nov Dec
% U
V T
ran
smit
tan
ce
Monthly Treated Water % UV Transmittance
Poplar Point Cedar Creek Swick Eldorado
Operational Objective
83.0
84.0
85.0
86.0
87.0
88.0
89.0
90.0
2015 2016 2017 2018 2019
% U
V T
ran
smit
tan
ce
5-Year %UV Trend in Treated Water
Poplar Point Cedar Creek Swick Eldorado Linear (Poplar Point )

City of Kelowna 2019 Annual Drinking Water and Filtration Exclusion Report
Page | 59
Annual Physical, Chemical and Biological Analysis
Comprehensive water analysis is conducted annually at each intake and compared to a variety of health and aesthetic objectives. There were no guideline exceedances for any of the parameters as per CDWQ guidelines (Table 28).
CARO Analytical Services POPLAR POINT
TREATED ELDORADO TREATED
KVR TREATED SWICK ROAD
TREATED
Date Sampled 29-Jul-2019 29-Jul-2019 29-Jul-2019 29-Jul-2019
Physical Tests (Water) Units CDWQG Water Water Water Water
Color, True CU AO=15 <5.0 <5.0 <5.0 <5.0
Conductivity uS/cm 278 276 294 283
Hardness (as CaCO3) mg/L 119 116 117 117
pH pH 7.5-10 8.00 8.08 8.08 8.12
Total Dissolved Solids mg/L AO=500 174 172 196 188
Turbidity NTU MAC=1 0.27 0.98 0.33 0.77
Anions and Nutrients (Water)
Ammonia, Total (as N) mg/L <0.005 <0.005 <0.005 <0.005
Chloride (Cl) mg/L AO=250 6.57 7.07 10.30 7.39
Cyanide, total mg/L MAC=0.2 <0.0020 <0.0020 <0.0020 <0.0020
Fluoride (F) mg/L MAC=1.5 0.240 0.200 0.240 0.240
Nitrate (as N) mg/L MAC=10 0.0940 <0.010 0.0870 0.0300
Nitrite (as N) mg/L MAC=1 <0.010 <0.010 0.038 0.018
Sulfate (SO4) mg/L AO=500 30.4 30.2 30.2 30.1
Sulphide as S mg/L <0.020 <0.020 <0.020 <0.020

City of Kelowna 2019 Annual Drinking Water and Filtration Exclusion Report
Page | 60
CARO Analytical Services POPLAR POINT
TREATED ELDORADO TREATED
KVR TREATED SWICK ROAD
TREATED
Date Sampled 29-Jul-2019 29-Jul-2019 29-Jul-2019 29-Jul-2019
Total Metals (Water)
Aluminum (Al)-Total mg/L AO=0.1 0.006 0.027 0.0114 0.0089
Antimony (Sb)-Total mg/L MAC=0.006 <0.00020 <0.00020 <0.00020 <0.00020
Arsenic (As)-Total mg/L MAC=0.01 0.00058 0.00060 0.00052 0.00056
Barium (Ba)-Total mg/L MAC=1 0.0221 0.0225 0.0219 0.0216
Boron (B)-Total mg/L MAC=5 0.0182 0.0156 0.0161 0.0162
Cadmium (Cd)-Total mg/L MAC=0.005 <0.000010 <0.000010 <0.000010 <0.000010
Calcium (Ca)-Total mg/L 32.0 31.5 31.6 31.9
Chromium (Cr)-Total mg/L MAC=0.05 <0.00050 <0.00050 <0.00050 <0.00050
Copper (Cu)-Total mg/L AO=15 0.0015 0.0328 0.00128 0.00342
Iron (Fe)-Total mg/L AO=0.3 <0.010 0.039 <0.010 0.013
Lead (Pb)-Total mg/L MAC=0.01 <0.00020 0.00025 <0.00020 <0.00020
Magnesium (Mg)-Total mg/L 9.37 9.08 9.12 9.16
Manganese (Mn)-Total mg/L AO=0.05 0.00119 0.00176 0.00091 0.00115
Mercury (Hg)-Total mg/L MAC=0.001 <0.000010 <0.000010 <0.000010 <0.000010
Potassium (K)-Total mg/L 2.36 2.29 2.28 2.31
Selenium (Se)-Total mg/L MAC=0.05 0.00051 <0.00050 <0.00050 <0.00050
Sodium (Na)-Total mg/L AO=200 11.6 11.3 14.9 12.9
Uranium (U)-Total mg/L MAC=0.02 0.00257 0.00260 0.00253 0.00249
Zinc (Zn)-Total mg/L AO=5 <0.0040 0.007 <0.0040 <0.0040
MAC= Maximum Acceptable Concentration related to Health Concerns
AO = Aesthetic Objective related to Taste, Odor, Appearance
Table 28. Treated Water comprehensive analysis summary

City of Kelowna 2019 Annual Drinking Water and Filtration Exclusion Report
Page | 61
Pesticides and Herbicides
The scan presented here includes historically applied compounds as well as newly formulated spray compounds. As of July 2017, none of the listed Pesticides or Herbicides have been identified in the Kelowna water distribution system at appreciable levels (Table 29). Next round of testing for these parameters will be in 2021.
ALS Environmental Services POPLAR POINT
TREATED ELDORADO TREATED KVR TREATED
SWICK ROAD TREATED
Date Sampled 27-Jul-2017 27-Jul-2017 27-Jul-2017 27-Jul-2017
Parameter Units Water Water Water Water
Organochlorine Pesticides
alpha-Chlordane ug/L <0.10 <0.10 <0.10 <0.10
gamma-Chlordane ug/L <0.10 <0.10 <0.10 <0.10
p,p-DDD ug/L <0.10 <0.10 <0.10 <0.10
p,p-DDE ug/L <0.10 <0.10 <0.10 <0.10
o,p-DDT ug/L <0.10 <0.10 <0.10 <0.10
p,p-DDT ug/L <0.10 <0.10 <0.10 <0.10
Oxychlordane ug/L <0.10 <0.10 <0.10 <0.10
d14-Terphenyl % 82.5 85.1 87.6 89.4
Herbicides
Bromoxynil ug/L <0.20 <0.20 <0.20 <0.20
2,4-D ug/L <0.20 <0.20 <0.20 <0.20
Dicamba ug/L <0.20 <0.20 <0.20 <0.20
Glyphosate ug/L <50.0 <50.0 <50.0 <5.0
MCPA ug/L <0.20 <0.20 <0.20 <0.20
Picloram ug/L <0.20 <0.20 <0.20 <0.20
2,4-Dichlorophenylacetic Acid % 96.3 95.1 97.1 98.1

City of Kelowna 2019 Annual Drinking Water and Filtration Exclusion Report
Page | 62
Pesticides Cont. POPLAR POINT
TREATED ELDORADO TREATED KVR TREATED
SWICK ROAD TREATED
Date Sampled 27-Jul-2017 27-Jul-2017 27-Jul-2017 27-Jul-2017
Pesticides
Alachlor ug/L <0.10 <0.10 <0.10 <0.10
Atrazine ug/L <0.10 <0.10 <0.10 <0.10
Atrazine & Metabolites ug/L <0.20 <0.20 <0.20 <0.20
Azinphos-methyl ug/L <0.10 <0.10 <0.10 <0.10
Benzo(a)pyrene ug/L <0.010 <0.010 <0.010 <0.010
Carbaryl ug/L <0.20 <0.20 <0.20 <0.20
Carbofuran ug/L <0.20 <0.20 <0.20 <0.20
Chlorpyrifos ug/L <0.10 <0.10 <0.10 <0.10
Diazinon ug/L <0.10 <0.10 <0.10 <0.10
Dimethoate ug/L <0.10 <0.10 <0.10 <0.10
Diquat ug/L <1.0 <1.0 <1.0 <1.0
Atrazine Desethyl ug/L <0.10 <0.10 <0.10 <0.10
Malathion ug/L <0.10 <0.10 <0.10 <0.10
Diclofop-methyl ug/L <0.20 <0.20 <0.20 <0.20
Metolachlor ug/L <0.10 <0.10 <0.10 <0.10
Metribuzin ug/L <0.10 <0.10 <0.10 <0.10
Paraquat ug/L <1.0 <1.0 <1.0 <1.0
Phorate ug/L <0.10 <0.10 <0.10 <0.10
Prometryne ug/L <0.10 <0.10 <0.10 <0.10
Simazine ug/L <0.10 <0.10 <0.10 <0.10
Terbufos ug/L <0.20 <0.20 <0.20 <0.20
Triallate ug/L <0.10 <0.10 <0.10 <0.10
Trifluralin ug/L <0.10 <0.10 <0.10 <0.10
2-Fluorobiphenyl % 78.7 76.6 79.6 79.4
Table 29. Pesticide and Herbicide scans of treated water

City of Kelowna 2019 Annual Drinking Water and Filtration Exclusion Report
Page | 63
Radiological Parameters
There were minor detectable levels of Gross Alpha compounds (naturally occurring) and minor concentrations of Gross Beta compounds (artificially occurring) in 2018 - well below CDWQ guidelines (Table 30). Next round of testing for this parameter will be in 2022.
SRC Analytical Services POPLAR POINT
TREATED ELDORADO TREATED
CEDAR CREEK TREATED
SWICK ROAD TREATED
Date Sampled 26-Jul-2018 26-Jul-2018 26-Jul-2018 26-Jul-2018
Parameter CDWQG Units Water Water Water Water
Radiological
Gross Alpha <1 Bq/L <0.09 <0.09 0.08 <0.08
Gross Beta <1 Bq/L 0.15 <0.07 0.19 0.15
Table 30. Radiological scans of treated water

City of Kelowna 2019 Annual Drinking Water and Filtration Exclusion Report
Page | 64
Appendix D Water Distribution Water Quality Monitoring Parameters

City of Kelowna 2019 Annual Drinking Water and Filtration Exclusion Report
Page | 65
Distribution Water Quality Parameters
Chlorine – Free
In order to maintain free chlorine residual throughout the distribution system, booster stations are equipped to inject additional sodium hypochlorite at strategic intervals and are sampled from point of source through to end of pipe in order to maintain an operational target of 0.2 mg/mL free chlorine residual throughout. These sites are monitored weekly and reported to IHA on a monthly basis. All minimal operating Chlorine residual concentrations were maintained in the distribution system in 2019 (Figure 36). The 5-year trend indicates fairly consistent, but increasing Chlorine residuals throughout the distribution and within CDWQG (Figure 37).
Average (mg/L)
Operational Objective (mg/L)
Maximum (mg/L)
Number of Tests in 2019
City System 0.78 0.20 2.2 795
Swick 0.44 0.20 1.24 78
Airport 1.04 0.20 1.67 112
Table 31. Free Chlorine in distribution water system summary
Figure 36. Monthly average Free Chlorine in Distribution System
0.00
0.20
0.40
0.60
0.80
1.00
1.20
1.40
1.60
Jan Feb Mar Apr May Jun Jul Aug Sep Oct Nov Dec
Fre
e C
hlo
rin
e (
mg/
L)
Monthly Average Distribution Free Chlorine
City System Swick System Airport System
Operational Objective

City of Kelowna 2019 Annual Drinking Water and Filtration Exclusion Report
Page | 66
Figure 37. 5-Year Average Free Chlorine in Distribution System
Total Coliform
Total Coliform and E. Coli. bacteria are monitored routinely at various points along the distribution system to ensure that no bacterial re-growth has occurred and that new bacteria has not been introduced through leaks or line breaks. To date, there has been no indication that there were detectable levels of Total Coliform or E. Coli. at any of the distribution sampling sites (Table 32 and 33).
Average
(MPN/100ml) Minimum
(MPN/100ml) Maximum
(MPN/100ml) Guideline
(MPN/100ml) Number of
Exceedances Number of
Tests in 2019
City System <1.0 <1.0 <1.0 <1.0 <1.0 793
Swick <1.0 <1.0 <1.0 <1.0 <1.0 77
Airport <1.0 <1.0 <1.0 <1.0 <1.0 112
Table 32. Total Coliform in distribution water system summary
E. Coli.
Average
(MPN/100ml) Minimum
(MPN/100ml) Maximum
(MPN/100ml) Guideline
(MPN/100ml) Number of
Exceedances Number of
Tests in 2019
City System <1.0 <1.0 <1.0 <1.0 <1.0 793
Swick <1.0 <1.0 <1.0 <1.0 <1.0 77
Airport <1.0 <1.0 <1.0 <1.0 <1.0 112
Table 33. E. Coli. in distribution water system summary
0.00
0.20
0.40
0.60
0.80
1.00
1.20
1.40
1.60
2015 2016 2017 2018 2019
Fre
e C
hlo
rin
e (
mg/
L)
5-Year Free Chlorine Distribution System Trend
City System Swick System Airport System Linear (City System)

City of Kelowna 2019 Annual Drinking Water and Filtration Exclusion Report
Page | 67
Trihalomethanes
Trihalomethanes (THM) and Haloacetic acids (HAA) are produced during the relatively slow organic reaction that occur between free chlorine and naturally occurring organic precursors such as humic and fulvic acids. Samples are tested quarterly (Figure 38) and also reported as an annual average to demonstrate compliance with the 0.10 mg/L Canadian Drinking Water guideline requirements. City system has shown a marginal increase over the past 5 years while the airport system remains the highest level of THM of the 3 water systems (Figure 39).
Average (mg/L)
Minimum (mg/L)
Maximum (mg/L)
CDWQ Guideline
(mg/L) Number of
Exceedances Number of
Tests in 2019
City System 0.0650 0.0461 0.0902 <0.1 0 24
Swick 0.0720 0.0526 0.120 <0.1 2 6
Airport 0.082 0.0652 0.111 <0.1 1 4
Table 34. Summary of THM concentrations in the distribution water system
Figure 38. Quarterly TTHM in Distribution system
0.000
0.020
0.040
0.060
0.080
0.100
0.120
March June September December
Tota
l Tri
hal
om
eth
ane
(m
g/L)
Quarterly Distribution System TTHM
City System Swick System Airport System
CDQWG TTHM Annual Running Average

City of Kelowna 2019 Annual Drinking Water and Filtration Exclusion Report
Page | 68
Figure 39. 5-year THM trend in Distribution Systems
Haloacetic Acids
Similar to the THM concentrations, HAA’s have been found to be highest at the Airport water system relative to the organic precursor concentrations. There were no guideline exceedances of any of the concentrations throughout 2019 (Table 35).The 5-year trend indicates a marginally increasing concentration of HAA’s in the City system, but has been notably decreasing over the last 3 years (Figure 41).
Average (mg/L)
Minimum (mg/L)
Maximum (mg/L)
CDWQ Guideline
(mg/L) Number of
Exceedances Number of
Tests in 2019
City System 0.0390 0.0241 0.0553 <0.08 0 24
Swick 0.0290 0.0221 0.0368 <0.08 0 6
Airport 0.0530 0.0463 0.067 <0.08 0 4
Table 35. Summary of HAA concentrations in the distribution water system
0.000
0.020
0.040
0.060
0.080
0.100
0.120
2015 2016 2017 2018 2019
Tota
l Tri
hal
om
eth
on
e (
mg/
L)
5-Year TTHM Trend in Distribution System
City System Swick System Airport System Linear (City System)
CDWG TTHM Annual running Average

City of Kelowna 2019 Annual Drinking Water and Filtration Exclusion Report
Page | 69
Figure 40. Quarterly Haloacetic Acids in Distribution Systems
Figure 41. 5-year Haloacetic Acid trends in Distribution Systems
0.000
0.010
0.020
0.030
0.040
0.050
0.060
0.070
0.080
0.090
0.100
March June September December
Hal
oac
eti
c A
cid
s (m
g/L)
Quarterly Distribution System HAA
City System Swick System Airport System
CDWQG HAA5 Annual Running Average
0.000
0.010
0.020
0.030
0.040
0.050
0.060
0.070
0.080
0.090
0.100
2015 2016 2017 2018 2019
Tota
l Hal
oac
eti
c A
cid
(m
g/L)
5-Year HAA5 Trend in Distribution System
City System Swick System Airport System Linear (City System)
CDWG HAA5 Annual running Average

City of Kelowna 2019 Annual Drinking Water and Filtration Exclusion Report
Page | 70
Appendix E
Drainage and Beaches

City of Kelowna 2019 Annual Drinking Water and Filtration Exclusion Report
Page | 71
Drainage and Beaches
Introduction
One of the largest water quality impacts to Okanagan Lake stems from upland water sources and storm water outfall discharges. The principal stormwater scenario is that the stormwater flows develop in response to local precipitation and carry a wide variety of pollutants such as sand, silt, dissolved metals, pesticides, nutrients and fecal material. Additionally, exceptional events can occur in which a fuel or chemical spill enters the stormwater system. In order to understand the relationship that these water sources have to the water quality at the City intakes, the COK has been comparing and overlaying water quality parameters from impactful creeks identified in the Source Water Assessment with the intake water quality. These insights help shape environmental planning and action in the event that trends or threats are identified. The monitoring consists of routine creek sampling, supplemental creek monitoring in the event of elevated Turbidity at intakes to determine if a connection in events exist. Monitoring is also increased during substantial rain events, first flush storm system events in spring, and beach sampling for E. Coli. during the summer months.
Creek Monthly Monitoring
The mouths of Brandt’s, Mill, and Mission Creek are sampled a minimum of 5 times in one month (5/30) throughout the year, weather and conditions permitting. Turbidity and Bacterial trends are noted and communicated to the respective Utility groups to allow for operational adjustments or investigate possible storm-sanitary interconnect contamination. Creek testing parameters include ammonia, chloride, true color, conductivity, dissolved oxygen, E. coli, pH, total suspended solids, temperature, and Turbidity and are graphically presented relative to the CDWQ. Specific sampling sites listed in the figures can be found in the Sampling Site section of this Appendix.

City of Kelowna 2019 Annual Drinking Water and Filtration Exclusion Report
Page | 72
Ammonia Presence of high concentrations of Ammonia can indicate that sewage contamination may be present and coming from septic or sanitary leakage. Mill creek Ammonia increased during freshet while Brandt’s increased once the flows began to drop from August through the end of the year. For all creeks, the concentrations were below calculated CCME guidelines for freshwater and did not indicate any significant sewage influence. Similarly, the 5-year trend showed a marginal increase in mill and mission creek while Brandt’s is trending downward (Figure 43).
Figure 42. Monthly Ammonia average for creek samples
Figure 43. 5-Year Ammonia average for creek samples
0.00
0.10
0.20
0.30
0.40
0.50
0.60
0.70
Am
mo
nia
(m
g/l)
5 In 30 Ammonia Monthly Averages
Brandt's Mill Mission CCME Ave Limit
Start of Freshet
0.00
0.02
0.04
0.06
0.08
0.10
0.12
0.14
0.16
0.18
0.20
2015 2016 2017 2018 2019
Am
mo
nia
(m
g/l)
Ammonia Yearly Average 5 Year Trend
Brandt's Mill Mission

City of Kelowna 2019 Annual Drinking Water and Filtration Exclusion Report
Page | 73
Chloride
Presence of elevated Chloride concentrations is a potential indicator that dissolved road salt is contributing to discharge into creeks. Monthly data indicated a relatively consistent chloride concentration that started and ended at similar levels, but all well within Aesthetic objectives. The 5-year trend indicated that the flooding events of 2017 and 2018 had an increasing effect on chloride concentrations relative to non-flooding years (Figure 45).
Figure 44. Monthly Chloride average for creek samples
0
50
100
150
200
250
300
Ch
lori
de
(m
g/l)
5 In 30 Chloride Monthly Averages
Brandt's Mill Mission CDWG AO
0
10
20
30
40
50
60
70
80
90
2015 2016 2017 2018 2019
Ch
lori
de
(m
g/l)
Chloride 5 Year Trend
Brandt's Mill Mission

City of Kelowna 2019 Annual Drinking Water and Filtration Exclusion Report
Page | 74
Figure 46. Monthly Color averages for creek samples
Figure 47. 5-Year Color average for creek samples
Conductivity Conductivity concentrations in all creeks trended downwards throughout 2019 with little evidence of impact of road salt application (Figure 48). The 5-year trend indicated that conductivity is increasing in Mill and Brandt’s while Mission remains consistent (Figure 49).
0
20
40
60
80
100
120
140
160
Tru
e C
olo
ur
(TC
U)
5 In 30 True Colour Monthly Averages
Brandt's Mill Mission CDWG AO
00
20
40
60
80
100
120
2015 2016 2017 2018 2019
Tru
e C
olo
ur
(TC
U)
True Colour 5 Year Trend
Brandt's Mill Mission

City of Kelowna 2019 Annual Drinking Water and Filtration Exclusion Report
Page | 75
Figure 48. Monthly Conductivity averages for creek samples
Figure 49. 5-Year Conductivity average for creek samples
Dissolved Oxygen Dissolved Oxygen- For all the of the creeks the monthly average for dissolved oxygen never went below the CCME lower range limit. All of the creeks have a decrease in dissolved oxygen in the summer months (Figure 50). There is no indication of a longer term trend in the tributaries over the past 5 years (Figure 51).
0
500
1000
1500
2000
2500
3000
Co
nd
uct
ivit
y (µ
s/cm
²)
5 In 30 Conductivity Monthly Averages
Brandt's Mill Mission
0
200
400
600
800
1000
1200
1400
1600
1800
2015 2016 2017 2018 2019
Co
nd
uct
ivit
y (µ
s/cm
²)
Conductivity 5 Year Trend
Brandt's Mill Mission

City of Kelowna 2019 Annual Drinking Water and Filtration Exclusion Report
Page | 76
Figure 50. Monthly Dissolved Oxygen average for creek samples
Figure 51. 5-Year Dissolved Oxygen average for creek samples
E.coli. The E. coli for Brandt’s Creek increased during the fall and winter due to lower flow and an increase in waterfowl; this is because most other water bodies freeze during the winter whereas Brandt’s Creek rarely freezes. Mill Creek’s E. coli increases over the summer months as the temperature increases while Mission Creek may have a slight increase in the summer months. Mission Creek’s E. coli remained below the recreational WQ (GCRWQ) geomean limit for primary contact. Longer term trend
2
4
6
8
10
12
14
Dis
solv
ed
Oxy
gen
(m
g/l)
5 In 30 Dissolved Oxygen Monthly Averages
Brandt's Mill Mission CCME Lower Range Limit CCME Upper Range Limit
4
5
6
7
8
9
10
11
12
13
14
2015 2016 2017 2018 2019
Dis
solv
ed
Oxy
gen
(m
g/l)
Dissolved Oxygen 5 Year Trend
Brandt's Mill Mission

City of Kelowna 2019 Annual Drinking Water and Filtration Exclusion Report
Page | 77
has seen an uptick in Brandt’s and most recently in 2019, in Mill Creek(Figure 53) .
Figure 52. Monthly E. coli averages in creek samples
Figure 53. 5-Year E.coli. average for creek samples
0
1000
2000
3000
4000
5000
6000
7000
E. c
oli
(MP
N/1
00
ml)
5 In 30 E. coli Monthly Geomean
Brandt's Mill Mission GCRWQ Geomean Limit
0
200
400
600
800
1000
1200
1400
1600
1800
2015 2016 2017 2018 2019
E. c
oli
(MP
N/1
00
ml)
E. coli Geomean 5 Year Trend
Brandt's Mill Mission

City of Kelowna 2019 Annual Drinking Water and Filtration Exclusion Report
Page | 78
Figure 54. Monthly pH averages for creek samples
Figure 55. 5-Year pH average for creek samples
Total Suspended Solids (TSS) As with Color and Turbidity, Total Suspended Material increased during the intense freshet and rain events that flushed sediment through the tributaries (Figure 56). The overall trend saw a significant decrease in TSS concentrations over the flooding years of 2017 and 2018 (Figure 57).
5
6
7
8
9
10
11
12
pH
5 In 30 pH Monthly Averages
Brandt's Mill Mission CDWG Lower Range Limit CDWG Upper Range Limit
7.0
7.2
7.4
7.6
7.8
8.0
8.2
8.4
2015 2016 2017 2018 2019
pH
pH 5 Year Trend
Brandt's Mill Mission

City of Kelowna 2019 Annual Drinking Water and Filtration Exclusion Report
Page | 79
Figure 56. Monthly TSS averages for creek samples
Figure 57. 5-Year TSS average for creek samples
Turbidity As expected, similar trends in Turbidity were observed throughout 2019 relative to the concentration of Total Suspended Solids (Figure 58). The overall trend saw a significant decrease in Turbidity concentrations in the past year in all of the major tributaries (Figure 59).
0
10
20
30
40
50
60
TSS
(mg/
l)
5 In 30 Total Suspended Solids Monthly Averages
Brandt's Mill Mission
0
10
20
30
40
50
60
2015 2016 2017 2018 2019
TSS
(mg/
l)
Total Suspended Solids 5 Year Trend
Brandt's Mill Mission

City of Kelowna 2019 Annual Drinking Water and Filtration Exclusion Report
Page | 80
Figure 60. Monthly Temperature average for creek samples
0.0
5.0
10.0
15.0
20.0
25.0
30.0
35.0
40.0
Turb
idit
y (N
TU)
5 In 30 Turbidity Monthly Averages
Brandt's Mill Mission CDWG MAC
0.0
5.0
10.0
15.0
20.0
25.0
Tem
p (
°C)
5 In 30 Temperature Monthly Averages
Brandt's Mill Mission CDWG AO

City of Kelowna 2019 Annual Drinking Water and Filtration Exclusion Report
Page | 81
Figure 61. Monthly Temperature average for creek samples
Nitrates and Phosphates Soluble nutrients and minerals carried through tributaries are one of the largest, consistent contributors of Nitrates and Phosphorus concentrations in OK lake. Monthly measurements do not indicate any elevated levels of nitrogen coinciding with freshet (Figure 62), but has been observed in a phosphorus spike in Brandt’s (Figure 63). As this is the first year of monitoring, longer term trends will be tracked moving forward.
Figure 62. Monthly Nitrate concentrations for creek samples
6
7
8
9
10
11
12
13
14
15
2015 2016 2017 2018 2019
Tem
pe
ratu
re (
°C)
Temperature 5 Year Trend
Brandt's Mill Mission
0.0
2.0
4.0
6.0
8.0
10.0
12.0
Nit
rate
(m
g/l a
s N
O3
)
5 In 30 Nitrate Monthly Averages
Brandt's Mill Mission CDWG MAC

City of Kelowna 2019 Annual Drinking Water and Filtration Exclusion Report
Page | 82
Figure 63. Monthly Phosphate concentrations for creek samples
Creek Testing during elevated Turbidity at Intakes
The mouths of Brandt’s Creek, Mill Creek, and Mission Creek are sampled when there is increased Turbidity in raw water quality. Turbidity concentrations at the drinking water intakes are typically 0.5 NTU or below, but increases in the spring when freshet occurs and the lake is mixing. The intent of this tracking is to potentially correlate the contribution of creek Turbidity and E. coli concentrations to Turbidity at the Intakes and subsequent natural asset planning and restoration that could take place in the future to minimize these impacts. It also provides a predictive model to assess elevated risk and allow for operational treatment adjustments in preparation for such impacts.
Poplar Point Intake Although Brandt’s Creek has the closest proximity to the Poplar Point intake, it’s relatively low flow and drainage into a designated wetland before entering the lake prevents it from having a significant impact. In past years, Mill and Mission Creeks have proven to be water quality influencers when wind and current direction move northward, but Turbidity and E. coli measurements do not indicate that to be an issue in 2019 (Figure 64, 65). Bear also did not appear to have a significant contribution to elevated counts during freshet.
0.0
0.1
0.2
0.3
0.4
0.5
0.6
Ph
osp
hat
e (
mg/
l as
PO
4)
5 In 30 Phophate Monthly Averages
Brandt's Mill Mission

City of Kelowna 2019 Annual Drinking Water and Filtration Exclusion Report
Page | 83
Figure 64. Poplar Point Intake Turbidity relative to surrounding Tributary Turbidities during freshet
Figure 65. Poplar Point Intake E. coli relative to surrounding Tributary E. coli during freshet
Cedar Creek Intake Historically, Mission Creek has proven to have the highest impact to water quality at the Cedar Creek intake due to the high volume of water and proximity, but is very much dependent on wind and current direction. There
0
10
20
30
40
50
60
70
0
0.2
0.4
0.6
0.8
1
1.2
Cre
ek
NTU
Inta
ke N
TU
Poplar Point Intake and Creek Turbidity Comparison During Freshet
Poplar Point Intake CDWG Bear Creek Brandt's Creek Mill Creek Mission Creek
0
500
1000
1500
2000
2500
3000
3500
0
0.5
1
1.5
2
2.5
3
3.5
Cre
ek
E. c
oli
Inta
ke E
. co
li
Poplar Point Intake and Creek E. coli Comparison During Freshet
Poplar Point Intake Bear Creek Brandt's Creek Mill Creek Mission Creek

City of Kelowna 2019 Annual Drinking Water and Filtration Exclusion Report
Page | 84
appeared to be only a minimal connection between Mission and Cedar Turbidity as well as between Bellevue Creek E. coli and Cedar E. coil (Figure 66, 67).
Figure 66. Cedar Creek Intake Turbidity relative to surrounding Tributary Turbidities during freshet
Figure 67. Cedar Creek Intake E. coli relative to surrounding Tributary E. coli during freshet
Eldorado Intake Due to the relatively shallower depth, Eldorado has typically seen the highest impact from tributary water quality. Both Mission and Mill creeks have historically had the greatest influence, but 2019 measurements only indicated a marginal impact and did not appear to have a significant impact to the 1 NTU Turbidity excursion in early August (Figure 68). E.coli counts remained low through the seasonal use of the intake, similar to the creeks (Figure 69).
0
2
4
6
8
10
12
14
16
0
0.2
0.4
0.6
0.8
1
1.2
Cre
ek
NTU
Inta
ke N
TU
Cedar Creek Intake and Creek Turbidity Comparison During Freshet
Cedar Intake CDWG Bellevue Creek Lebanon Creek Mission Creek
0
50
100
150
200
250
0
0.5
1
1.5
2
2.5
Cre
ek
E. c
oli
Inta
ke E
. co
li
Cedar Creek Intake and Creek E. coli Comparison During Freshet
Cedar Intake Bellevue Creek Lebanon Creek Mission Creek

City of Kelowna 2019 Annual Drinking Water and Filtration Exclusion Report
Page | 85
Figure 68. Eldorado Intake Turbidity relative to surrounding Tributary Turbidities during freshet
Figure 69. Eldorado Intake E. coli relative to surrounding Tributary E. coli during freshet
Swick Intake Varty creek has the closest proximity in relation to Swick, but the impact varies dramatically based on the overall volume and time span of the snowmelt in the lower snow shed. Other creeks in the area are considered seasonal as well and did not appear to have any significant impact to the observed Turbidity or E.coli counts at the Swick intake (Figure 70, 71).
0
2
4
6
8
10
12
14
16
18
0
0.2
0.4
0.6
0.8
1
1.2
1.4
Cre
ek
NTU
Inta
ke N
TU
Eldorado Intake and Creek Turbidity Comparison During Freshet
Eldorado Intake CDWG Mill Creek Mission Creek Bellevue Creek
0
500
1000
1500
2000
2500
3000
0
0.2
0.4
0.6
0.8
1
1.2
Cre
ek
E. c
oli
Inta
ke E
. co
li
Eldorado Intake and Creek E. coli Comparison During Freshet
Eldorado Intake Mill Creek Mission Creek Bellevue Creek

City of Kelowna 2019 Annual Drinking Water and Filtration Exclusion Report
Page | 86
Figure 70. Swick Intake Turbidity relative to surrounding Tributary Turbidities during freshet
Figure 71. Swick Intake E. coli relative to surrounding Tributary E. coli during freshet
First Flush and Rain Event Monitoring at Outfalls
First flush is defined as the first major rain or snow melt that would push significant material through the storm water system and eventually into Okanagan lake. Brandt’s Creek and Mill Creek outfalls were monitored during the first flush and rain events of more than 5mm during March-April (Table 36-37). As expected, there was consistent
0
0.5
1
1.5
2
2.5
3
3.5
4
4.5
5
0
0.2
0.4
0.6
0.8
1
1.2
Cre
ek
NTU
Inta
ke N
TU
Swick Intake and Creek Turbidity Comparison During Freshet
Swick Intake CDWG Varty Creek Lebanon Creek Bellevue Creek
0
50
100
150
200
250
0
0.2
0.4
0.6
0.8
1
1.2
Cre
ek
E. c
oli
Inta
ke E
. co
li
Swick Intake and Creek E. coli Comparison During Freshet
Swick Intake Varty Creek Lebanon Creek Bellevue Creek

City of Kelowna 2019 Annual Drinking Water and Filtration Exclusion Report
Page | 87
trend of First Flush depositing the highest amount of Suspended Solids, Color, E. coli and Turbidity into the creeks relative to subsequent rain events. Conductivity, Chloride, and pH all tended to drop as a result of a dilution and buffering and acidity effect of the snow / rain water – which is consistent with previous years’ trend.
Brandt's Creek Outfall
Parameter Brandt's Creek at Brant Ave Apr 30, 2019 Pre-Rainfall
First Flush ~7.5mm,
May 17, 2019
Brandt's Creek at Brant Ave
June 26, 2019 Pre-Rainfall
Rain Event ~16.4mm,
June 28, 2019
Brandt's Creek at Brant Ave Aug 29, 2019 Pre-Rainfall
Rain Event ~7mm,
Sept 11, 2019
Ammonia (mg/l) 0.02 0.01 0.09 0.04 0.22 0.04
Chloride (mg/l) 96 16 65 28 60 41
True Color (Pt-Co Units) 143 421 98 853 70 124
Conductivity (µs/cm²) 2798 198 1799 853 1826 768
Dissolved Oxygen (mg/l) 9.78 5.77 7.18 7.71 7.83 6.38
Nitrate as NO3 (mg/L) 1.70 0.05 1.59 0.73 1.47 0.96
pH 8.34 6.67 8.08 7.59 8.32 7.58
Total Suspended Solids (mg/l) 57 122 21 79 43 17
Temperature (°C) 11.8 16.9 17.8 17.5 18.6 20.5
Total Phosphate (mg/L) 0.24 0.70 0.36 0.27 0.28 0.41
Turbidity (NTU) 39.1 90.2 14.5 41.5 27.0 16.4
Table 36. Water Quality at Brandt’s creek during rainfall events
Table 37. Water quality at Mill creek during rainfall events
Fascieux Creek Rain Event Sampling
Fascieux Creek is a typical storm collection creek within the Utility boundary that is monitored at multiple locations during rain events to potentially identify contamination connected with raw sewage. Along with various chemical parameters, E. coli. is the primary indicator for storm / sanitary interconnection as it is not naturally occurring and carries a significant health risk. Further investigation is required in the event that E. Coli. counts are in excess of 25,000 MPN/100mL. Chemical and Biological profiles and trends recorded were similar to that noted at the
Mill Creek Outfall
Parameter Mill Creek at Hardy Street May 15, 2019 Pre-Rainfall
Rain Event ~7.5mm,
May 17, 2019
Mill Creek at Hardy Street June 18, 2019 Pre-Rainfall
Rain Event ~16.4mm,
June 28, 2019
Mill Creek at Hardy Street Aug 20, 2019 Pre-Rainfall
Rain Event ~7mm,
Sept 11, 2019
Ammonia (mg/l) 0.08 0.01 0.12 0.04 0.02 0.03
Chloride (mg/l) 20 16 40 21 35 27
True Color (Pt-Co Units) 143 450 37 110 39 115
Conductivity (µs/cm²) 389 147 713 419 623 498
Dissolved Oxygen (mg/l) 9.62 9.62 8.34 8.34 9.39 9.39
E. coli (MPN/100mL) 548 2420 1120 1935 548 1120
Nitrate as NO3 (mg/L) 0.67 0.31 1.62 0.94 1.31 0.85
pH 7.93 6.65 8.14 7.22 8.06 7.49
Total Suspended Solids (mg/l)
22 165 9 42 8 50
Temperature (°C) 14.0 16.0 20.0 15.5 16.9 17.8
Total Phosphate (mg/L) 0.10 0.11 0.12 0.11 0.14 0.21
Turbidity (NTU) 11.0 122.0 6.2 24.5 3.6 22.2

City of Kelowna 2019 Annual Drinking Water and Filtration Exclusion Report
Page | 88
Brandt’s and Mill Creek outfalls (Tables 36-37). The tested samples did not indicate any significant increase in E. coli. concentrations, which indicates that there are no current interconnection issues with sanitary for this outfall system.
Fascieux Creek at Gordon Drive
Parameter Rain Event ~16.4mm,
June 28, 2019
Rain Event ~7mm,
Sept 11, 2019
Rain Event ~9.4mm,
Sept 16, 2019
Rain Event ~6.4mm, Nov
19, 2019
2019 Average
Ammonia (mg/l) 0.26 0.02 0.04 0.10 0.11
Chloride (mg/l) 14 10 10 18 13
True Color (Pt-Co Units) 132 48 57 111 87
Conductivity (µs/cm²) 196 401 212 324 283
Dissolved Oxygen (mg/l) 6.56 5.55 6.33 7.10 6.39
E. coli (MPN/100mL) 3076 1120 1733 175 1526
Nitrate as NO3 (mg/L) 0.30 0.29 0.19 0.35 0.28
pH 6.94 7.00 6.85 7.40 7.05
Total Suspended Solids (mg/l) 10 1 4 7 6
Temperature (°C) 14.5 18.0 15.4 9.8 14.4
Total Phosphate (mg/L) 0.33 0.1 0.23 0.12 0.20
Turbidity (NTU) 10.1 2.2 3.1 11.6 6.8
Table 38. Water quality test results of Fascieux Creek at Gordon during rain events
Fascieux Creek at Gosnell Road
Parameter Rain Event ~16.4mm,
June 28, 2019
Rain Event ~7mm,
Sept 11, 2019
Rain Event ~9.4mm,
Sept 16, 2019
Rain Event ~6.4mm,
Nov 19, 2019
2019 Average
Ammonia (mg/l) 0.17 0.05 0.07 0.08 0.09
Chloride (mg/l) 14 17 17 23 18
True Color (Pt-Co Units) 93 40 41 47 55
Conductivity (µs/cm²) 296 383 423 546 405
Dissolved Oxygen (mg/l) 7.20 4.96 4.94 7.39 6.12
E. coli (MPN/100mL) 2733 1120 866 11199 3977
Nitrate as NO3 (mg/L) 0.14 0.18 0.21 0.22 0.19
pH 7.14 7.13 7.08 7.40 7.19
Total Suspended Solids (mg/l) 108 6 6 4 31
Temperature (°C) 14.5 17.5 15.4 9.8 14.3
Total Phosphate (mg/L) 0.22 0.16 0.18 0.19 0.19
Turbidity (NTU) 27.4 3.7 2.5 5.2 9.7
Table 39. Water quality test results of Fascieux Creek at Gosnell during rain events
Fascieux Creek at Watt Road
Parameter Rain Event ~16.4mm,
June 28, 2019
Rain Event ~7mm,
Sept 11, 2019
Rain Event ~9.4mm,
Sept 16, 2019
Rain Event ~6.4mm,
Nov 19, 2019
2019 Average
Ammonia (mg/l) 0.20 0.15 0.17 0.12 0.16
Chloride (mg/l) 18 24 24 27 23
True Color (Pt-Co Units) 99 61 52 65 69
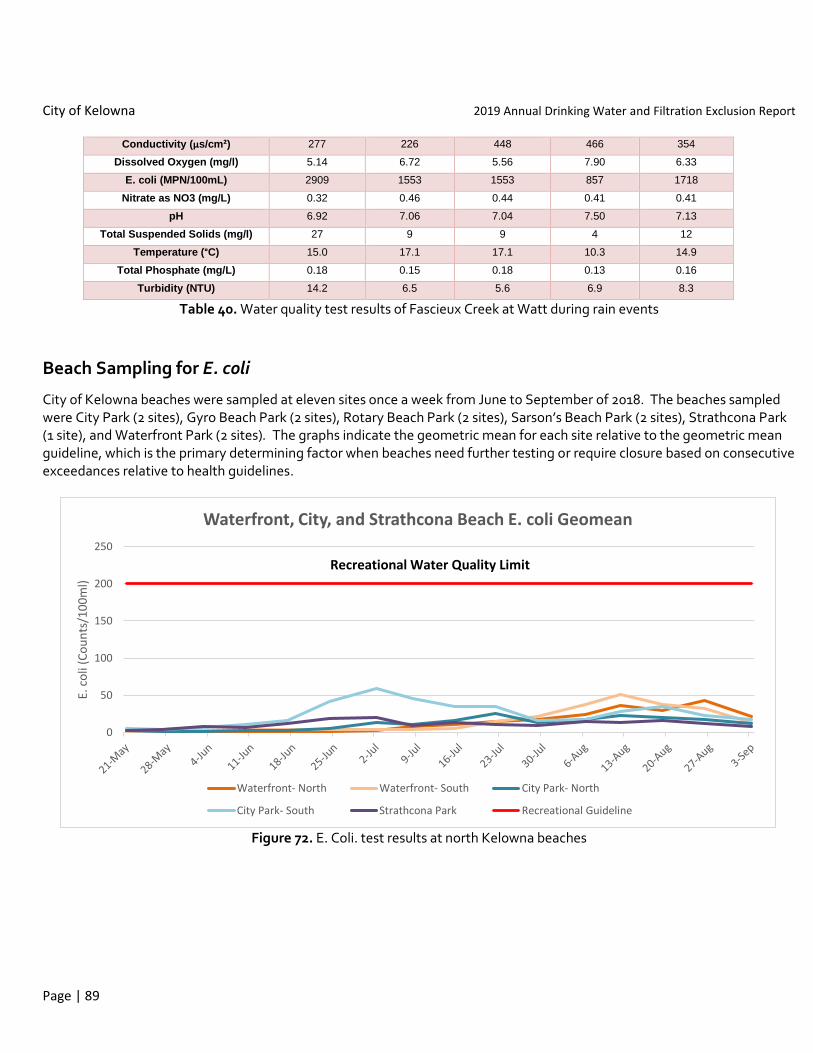
City of Kelowna 2019 Annual Drinking Water and Filtration Exclusion Report
Page | 89
Conductivity (µs/cm²) 277 226 448 466 354
Dissolved Oxygen (mg/l) 5.14 6.72 5.56 7.90 6.33
E. coli (MPN/100mL) 2909 1553 1553 857 1718
Nitrate as NO3 (mg/L) 0.32 0.46 0.44 0.41 0.41
pH 6.92 7.06 7.04 7.50 7.13
Total Suspended Solids (mg/l) 27 9 9 4 12
Temperature (°C) 15.0 17.1 17.1 10.3 14.9
Total Phosphate (mg/L) 0.18 0.15 0.18 0.13 0.16
Turbidity (NTU) 14.2 6.5 5.6 6.9 8.3
Table 40. Water quality test results of Fascieux Creek at Watt during rain events
Beach Sampling for E. coli
City of Kelowna beaches were sampled at eleven sites once a week from June to September of 2018. The beaches sampled were City Park (2 sites), Gyro Beach Park (2 sites), Rotary Beach Park (2 sites), Sarson’s Beach Park (2 sites), Strathcona Park (1 site), and Waterfront Park (2 sites). The graphs indicate the geometric mean for each site relative to the geometric mean guideline, which is the primary determining factor when beaches need further testing or require closure based on consecutive exceedances relative to health guidelines.
Figure 72. E. Coli. test results at north Kelowna beaches
0
50
100
150
200
250
E. c
oli
(Co
un
ts/1
00
ml)
Waterfront, City, and Strathcona Beach E. coli Geomean
Waterfront- North Waterfront- South City Park- North
City Park- South Strathcona Park Recreational Guideline
Recreational Water Quality Limit

City of Kelowna 2019 Annual Drinking Water and Filtration Exclusion Report
Page | 90
Figure 73. E. Coli. test results at south Kelowna beaches
Sampling Sites The creeks sampled are Brandt’s Creek, Mill Creek, Mission Creek, and Fascieux Creek. The main sample site on Brandt’s Creek is near the mouth of Brandt’s Creek located in Rotary Marsh Wetland on Sunset Drive (Figure 62). The other sample site on Brandt’s Creek is a 750mm outfall pipe located on Gordon Drive and Weddell Place which is sampled for first flush as well as during rain events of 7mm or more. The main sample site on Mill Creek is located near the mouth at the end of Lake Avenue (Figure 62). The other sample site on Mill Creek is a 1075mm outfall pipe located on Enterprise Way and Hardy Street which is sampled for first flush as well as during rain events of 7mm or more. The main sample site located on Mission Creek is near the mouth and is accessed by Bluebird Road (Figure 62). Fascieux Creek has three sampling site locations: Gordon Drive between KLO Road and Bothe Road, Gosnell Road and Quesnel Road, and at the end of Watt Road. Beach sites are located between lower Mission and Knox mountain foreshore.
0
50
100
150
200
250
E. c
oli
(Co
un
ts/1
00
ml)
Gyro, Rotary, and Sarsons Beach E. coli Geomean
Gyro- North Gyro- South Rotary- North Rotary- South
Sarsons- North Sarsons- South Recreational Guideline

City of Kelowna 2019 Annual Drinking Water and Filtration Exclusion Report
Page | 91
Figure 74. Kelowna Beach and Creek sample sites