
2018 Standard for Performance Rating of Water-chilling and Heat...
115
2018 Standard for Performance Rating of Water-chilling and Heat Pump Water-heating Packages Using the Vapor Compression Cycle AHRI Standard 550/590 (I-P)
Transcript of 2018 Standard for Performance Rating of Water-chilling and Heat...

2018 Standard for
Performance Rating of Water-chilling and Heat Pump Water-heating Packages Using the Vapor Compression Cycle
AHRI Standard 550/590 (I-P)

Price $10.00 (M) $20.00 (NM) © Copyright 2018, by Air-Conditioning, Heating, and Refrigeration Institute Printed in U.S.A. Registered United States Patent and Trademark Office
IMPORTANT
SAFETY DISCLAIMER
AHRI does not set safety standards and does not certify or guarantee the safety of any products, components or systems
designed, tested, rated, installed or operated in accordance with this standard/guideline. It is strongly recommended
that products be designed, constructed, assembled, installed and operated in accordance with nationally recognized
safety standards and code requirements appropriate for products covered by this standard/guideline.
AHRI uses its best efforts to develop standards/guidelines employing state-of-the-art and accepted industry practices.
AHRI does not certify or guarantee that any tests conducted under its standards/guidelines will be non-hazardous or
free from risk.
Note:
This 2018 standard supersedes AHRI Standard 550/590 (I-P)-2015 with Addendum 1.
For SI ratings, see AHRI Standard 551/591 (SI)-2018.
Accompanying this standard is an Excel Spreadsheet for the Computation of the Water Pressure Drop Adjustment Factors and
an Excel spreadsheet for Calibration (http://www.ahrinet.org/site/686/Standards/HVACR-Industry-Standards/Search-
Standards).
AHRI CERTIFICATION PROGRAM PROVISIONS
The current scope of the Air-cooled Chiller (ACCL) and Water-cooled Chiller (WCCL) Certification Programs can be found
on AHRI website www.ahrinet.org. The scope of the Certification Programs should not be confused with the scope of the
standard, as the standard also includes ratings for products that are not covered by a certification program.

TABLE OF CONTENTS
SECTION PAGE
Section 1. Purpose ..............................................................................................................................1
Section 2. Scope .................................................................................................................................1
Section 3. Definitions .........................................................................................................................1
Section 4. Test Requirements .............................................................................................................4
Section 5. Rating Requirements .........................................................................................................6
Section 6. Minimum Data Requirements for Published Ratings ......................................................31
Section 7. Conversions and Calculations .........................................................................................37
Section 8. Symbols and Subscripts ...................................................................................................39
Section 9. Marking and Nameplate Data ..........................................................................................46
Section 10. Conformance Conditions .................................................................................................46
Section 11. Operating Requirements ..................................................................................................46
TABLES
Table 1. Standard Rating Conditions ...............................................................................................8
Table 2. Full and Part-load Application Rating Conditions ............................................................9
Table 3. Part-load Conditions for Rating .......................................................................................11
Table 4A. Chiller Performance – IPLV.IP for Example 1 Test Results ...........................................16
Table 4B. Example 1 IPLV.IP Calculations ....................................................................................16
Table 5A. Chiller Performance – NPLV.IP for Example 2 Test Results .........................................17
Table 5B. Example 2 NPLV.IP Calculations ...................................................................................17
Table 6A. Chiller Performance – IPLV.IP for Example 3 Test Results ...........................................18
Table 6B. Example 3 IPLV.IP Calculations ....................................................................................19
Table 7A. Chiller Performance - IPLV.IP for Example 4 Test Results ...........................................20
Table 7B. Example 4 IPLV.IP Calculations ...................................................................................20

TABLE OF CONTENTS (Continued)
Table 8A. Chiller Performance – IPLV.IP for Example 5 Test Results ...........................................21
Table 8B. Example 5 IPLV.IP Calculations ....................................................................................21
Table 9A. Chiller Performance – IPLV.IP for Example 6 Test Results ...........................................21
Table 9B. Example 6 IPLV.IP Calculations ....................................................................................22
Table 10A. Chiller Performance – IPLV.IP for Example 7 Test Results ...........................................22
Table 10B. Example 7 IPLV.IP Calculations ....................................................................................23
Table 11. Definition of Tolerances ..................................................................................................25
Table 12. Definition of Operating Condition Tolerances and Stability Criteria .............................27
Table 13. Definition of Validity Tolerances ....................................................................................29
Table 14. Published Values .............................................................................................................35
Table 15. Conversion Factors ..........................................................................................................37
Table 16. Symbols and Subscripts ...................................................................................................39
FIGURES
Figure 1. Part-load Condenser Temperature for IPLV.IP ...............................................................12
Figure 2. Rating Point Interpolation ...............................................................................................19
Figure 3. Allowable Tolerance (Tol1) Curves for Full and Part-load Points ..................................26
Figure 4. IPLV.IP and NPLV.IP Tolerance (Tol2) Curve ...............................................................26
Figure 5. Energy Balance Tolerance (Tol4) Curve .........................................................................29
EQUATIONS
Equation 1. Cooling Coefficient of Performance .................................................................................6
Equation 2. Energy Efficiency Ratio ....................................................................................................6
Equation 3. Power Input per Capacity ..................................................................................................6
Equation 4. Heating Coefficient of Performance ..................................................................................6

TABLE OF CONTENTS (Continued)
Equation 5. Heat Recovery Coefficient of Performance ......................................................................6
Equation 6. Simultaneous Heating and Cooling Coefficient of Performance ......................................6
Equation 7. Net Refrigerating Capacity ................................................................................................6
Equation 8. Volumetric Flow Rate .......................................................................................................7
Equation 9. Net Heating Capacity, Standard Condenser ......................................................................7
Equation 10. Net Heating Capacity, Heat Recovery Condenser ............................................................7
Equation 11. Integrated or Non-standard Part-load Value, IPLV.IP or NPLV.IP,
based on COPR or EER ..................................................................................................10
Equation 12. Integrated or Non-standard Part-load Value, IPLV.IP or NPLV.IP,
based on Power Input per Capacity ................................................................................10
Equation 13. Entering Air Dry-bulb Temperature ................................................................................12
Equation 14. Entering Water Temperature ...........................................................................................12
Equation 15. Entering Air Wet-bulb Temperature ...............................................................................12
Equation 16. Saturated Discharge Temperature, Air-cooled ................................................................13
Equation 17a. Saturated Discharge Temperature, Water-cooled ............................................................13
Equation 17b. Saturated Discharge Temperature, Evaporatively-cooled ...............................................13
Equation 18. Energy Efficiency Ratio, Degraded .................................................................................13
Equation 19. Cooling Coefficient of Performance, Degraded ..............................................................13
Equation 20. Power Input per Capacity, Degraded ...............................................................................13
Equation 21. Degradation Factor ..........................................................................................................13
Equation 22. Load Factor ......................................................................................................................13
Equation 23. Tolerance 1 ......................................................................................................................25
Equation 24. Tolerance 2 ......................................................................................................................25
Equation 25. Tolerance 3 ......................................................................................................................25
Equation 26. Tolerance 4 ......................................................................................................................29

TABLE OF CONTENTS (Continued)
Equation 27. Density of Water ..............................................................................................................37
Equation 28. Specific Heat of Water ....................................................................................................37
Equation 29. Atmospheric Pressure ......................................................................................................38
APPENDICES
Appendix A. References – Normative ..................................................................................................47
Appendix B. References – Informative ................................................................................................49
Appendix C. Method of Testing Water-chilling and Water-heating Packages Using the
Vapor Compression Cycle – Normative ..........................................................................50
Appendix D. Derivation of Integrated Part-load Value (IPLV.IP) – Informative ................................69
Appendix E. Chiller Condenser Entering Air Temperature Measurement – Normative .....................77
Appendix F. Atmospheric Pressure Adjustment – Normative .............................................................85
Appendix G. Water Pressure Drop Measurement Procedure – Normative ..........................................88
Appendix H. Heating Capacity Test Procedure – Normative ...............................................................92
Appendix I. Averaging – Informative .................................................................................................96
TABLES FOR APPENDICES
Table C1. Requirements for Test Instrumentation ...........................................................................56
Table C2. Prediction Interval to Determine Range of Acceptable Accuracy ..................................58
Table C3. Data to be Recorded During the Test ..............................................................................66
Table C4. Auxiliary Data to be Recorded .......................................................................................66
Table C5. Optional Auxiliary Data to be Recorded .........................................................................67
Table C6. Results to be Reported .....................................................................................................68
Table D1. Group 1 Air-cooled IPLV.IP Data and Calculation ........................................................74
Table D2. Group 1 Water-cooled IPLV.IP Data and Calculation ....................................................75
Table D3. Group 1 – 4 IPLV.IP Summary .......................................................................................76

TABLE OF CONTENTS (Continued)
Table E1. Temperature Measurement Requirements .......................................................................78
Table E2. Criteria for Air Distribution and Control of Air Temperature ........................................79
Table F1. Correction Factor (CF) Coefficients ................................................................................86
Table G1. Straight Length in Flow Path ...........................................................................................88
Table G2. K Factors for Elbow Arrangements .................................................................................90
Table G3. Angle for Expansion and Reduction Fittings ..................................................................90
Table G4. Resistance Coefficient for Expansion and Reduction Fittings ........................................91
Table I1.1. Summary of Example #1 .................................................................................................96
Table I1.2. Data for Example #1 ........................................................................................................97
Table I2.1. Summary of Example #2 ...............................................................................................101
Table I2.2. Data for Example #2 .....................................................................................................102
FIGURES FOR APPENDICES
Figure C1. Sample of Relative Calibration Evaluation Data (Percent of Reading) ..........................59
Figure C2. Sample of Absolute Calibration Evaluation Data ...........................................................60
Figure D1. TonR-Hour Distribution Categories .................................................................................71
Figure D2. Bin Groupings – TonR-Hours ..........................................................................................72
Figure D3. Group 1 TonR-Hour Distribution Categories ...................................................................72
Figure D4. Group 2 TonR-Hour Distribution Categories ...................................................................73
Figure E1. Typical Air Sampling Tree ..............................................................................................80
Figure E2. Aspirating Psychrometer .................................................................................................81
Figure E3. Air Sampling Array .........................................................................................................82
Figure E4. Required Number of Air Sampling Trees or Air Sampling Arrays .................................83
Figure E5. Typical Test Setup Configurations ..................................................................................84
Figure G1. Examples of Piezometer Ring/Manifold .........................................................................89
TABLE OF CONTENTS (Continued)
Figure G2. Example of Triple-tee Piezometer Ring/Manifold ..........................................................89
Figure G3. Correction Term for Included Angle for Expansion/Contraction Fittings ......................91
Figure I1. Example #1 Charts ........................................................................................................100
Figure I2. Example #2 Charts ........................................................................................................105
EQUATIONS FOR APPENDICES
Equation C1. Mean of Data Points ........................................................................................................50
Equation C2. Standard Deviation of Data Points ..................................................................................50
Equation C3. Gross Refrigerating Capacity ..........................................................................................50
Equation C4. Gross Heating Capacity, Standard Condenser .................................................................51
Equation C5. Gross Heating Capacity, Heat Recovery Condenser .......................................................51
Equation C6. Mass Flow Rate ...............................................................................................................51
Equation C7 Total Input Power ............................................................................................................51
Equation C8. Total Input Power, Refrigerant Circuit ............................................................................51
Equation C9. Temperature Range .........................................................................................................51
Equation C10. Small Temperature Difference ........................................................................................52
Equation C11. Log Mean Temperature Difference .................................................................................52
Equation C12. Incremental Log Mean Temperature Difference .............................................................52
Equation C13. Intermediate Calculation Z ..............................................................................................52
Equation C14. Small Temperature Difference, Clean .............................................................................52
Equation C15. Water Temperature Adjustment ......................................................................................52
Equation C16. Water Temperature Adjustment, Weighted Average ......................................................52
Equation C17. Derivation of Log Mean Temperature Difference ...........................................................53
Equation C18. Corrected Water Pressure Drop .......................................................................................53
Equation C19. Energy In .........................................................................................................................54

TABLE OF CONTENTS (Continued)
Equation C20. Energy Out .......................................................................................................................54
Equation C21. Energy Balance ................................................................................................................54
Equation C22. Voltage Balance ...............................................................................................................55
Equation C23. Average Voltage ..............................................................................................................55
Equation C24. Prediction Interval ...........................................................................................................58
Equation C25. Mean of all Measurement Values ....................................................................................58
Equation C26. Sum of Squares ................................................................................................................58
Equation C27. Standard Error of Estimate ..............................................................................................58
Equation C28. Slope of Regression Line .................................................................................................58
Equation C29. Intercept ...........................................................................................................................59
Equation C30. Linear Regression Curve Fit ............................................................................................59
Equation C31. Average Mean .................................................................................................................64
Equation C32. Standard Deviation ..........................................................................................................64
Equation D1. Integrated or Non-standard Part-load Value, IPLV.IP or NPLV.IP,
based on COPR or EER ....................................................................................................69
Equation D2. Integrated or Non-standard Part-load Value, IPLV.IP or NPLV.IP,
based on Power Input per Capacity .................................................................................70
Equation D3. Energy Efficiency Ratio, Degraded .................................................................................70
Equation D4. Degradation Factor ..........................................................................................................70
Equation D5. Load Factor ......................................................................................................................70
Equation F1. Intermediate Capacity Correction Factor D ....................................................................85
Equation F2. Intermediate Efficiency Correction Factor D ..................................................................85
Equation F3. Capacity Correction Factor ..............................................................................................85
Equation F4. Efficiency Correction Factor ...........................................................................................85
TABLE OF CONTENTS (Continued)
Equation F5. Capacity, Corrected at Standard Rating Conditions ........................................................85
Equation F6. Efficiency, Corrected at Standard Rating Conditions .....................................................85
Equation F7. Capacity, Corrected at Application Rating Conditions ...................................................87
Equation F8. Efficiency, Corrected at Application Rating Conditions .................................................87
Equation G1. Friction Factor .................................................................................................................89
Equation G2. Pressure Drop, Straight Pipe ............................................................................................90
Equation G3. Pressure Drop, Elbows and Expansions/Contractions .....................................................90
Equation G4. Pressure Adjustment ........................................................................................................90
Equation H1. Frosting Capacity Degradation Ratio ..............................................................................92
Equation H2. Average Condenser Capacity ..........................................................................................95
Equation H3. Average Power Input .......................................................................................................95
Equation H4. Average Heating Coefficient of Performance .................................................................95

AHRI STANDARD 550/590 (I-P)-2018
1
PERFORMANCE RATING OF WATER-CHILLING AND HEAT PUMP WATER-HEATING PACKAGES USING THE
VAPOR COMPRESSION CYCLE
Section 1. Purpose
1.1 Purpose. The purpose of this standard is to establish for Water-chilling and Heat Pump Water-heating Packages using
the vapor compression cycle: definitions; test requirements; rating requirements; minimum data requirements for Published
Ratings; marking and nameplate data; conversions and calculations; nomenclature; and conformance conditions.
1.1.1 Intent. This standard is intended for the guidance of the industry, including manufacturers, engineers, installers,
efficiency regulators, contractors and users.
1.1.2 Review and Amendment. This standard is subject to review and amendment as technology advances.
Section 2. Scope
2.1 Scope. This standard applies to factory-made vapor compression refrigeration Water-chilling and Water-heating
Packages including one or more compressors. These Water-chilling and Water-heating Packages include:
2.1.1 Water-cooled, Air-cooled, or Evaporatively-cooled Condensers
2.1.2 Water-cooled heat recovery Condensers
2.1.3 Air-to-water heat pumps
2.1.4 Water-to-water heat pumps with a Capacity greater or equal to 135,000 Btu/h.
2.2 Exclusions. Water-to-water heat pumps with a Capacity less than 135,000 Btu/h are covered by the latest edition of
ASHRAE/ANSI/AHRI/ISO Standard 13256-2.
Section 3. Definitions
All terms in this document follow the standard industry definitions in the ASHRAE Terminology website
(https://www.ashrae.org/resources--publications/free-resources/ashrae-terminology) unless otherwise defined in this section.
3.1 Auxiliary Power. Power provided to devices that are not integral to the operation of the vapor compression cycle such
as, but not limited to: oil pumps, refrigerant pumps, control power, fans and heaters.
3.2 Bubble Point. Refrigerant liquid saturation temperature at a specified pressure.
3.3 Capacity. A measurable physical quantity that characterizes the water side heat flow rate. Capacity is the product of the
water mass flow rate and the change in water enthalpy entering and leaving the heat exchanger, measured at the point of the
field connection. For this standard, the enthalpy change is approximated as the sensible heat transfer using specific heat and
temperature difference, and in some calculations also the energy associated with water-side pressure losses.
3.3.1 Gross Heating Capacity. The Capacity of the Water-cooled Condenser as measured by the heat transfer from
the refrigerant in the Condenser. This value includes both the sensible heat transfer and the pressure drop effects of the
water flow through the Condenser. This value is used to calculate the energy balance during testing. (Refer to Equations
C4 and C5).
3.3.2 Gross Refrigerating Capacity. The Capacity of the water-cooled evaporator as measured by the heat transfer
to the refrigerant in the evaporator. This value includes both the sensible heat transfer and the pressure drop effects of
the water flow through the evaporator. This value is used to calculate the energy balance during testing. (Refer to
Equation C3).
3.3.3 Net Heating Capacity. The Capacity of the heating Condenser available for useful heating of the thermal load

AHRI STANDARD 550/590 (I-P)-2018
2
external to the Water-heating Package and is calculated using only the sensible heat transfer.
(Refer to Equations 9 and 10).
3.3.4 Net Refrigerating Capacity. The Capacity of the evaporator available for cooling of the thermal load external
to the Water-chilling Package and it is calculated using only the sensible heat transfer. (Refer to Equation 7).
3.4 Compressor Saturated Discharge Temperature. For single component and azeotrope refrigerants, it is the saturated
temperature corresponding to the refrigerant pressure at the compressor discharge including any refrigerant circuit components
like mufflers, oil separators and discharge valves at the point of field connection. For zeotropic refrigerants, it is the arithmetic
average of the Dew Point and Bubble Point temperatures corresponding to refrigerant pressure at the compressor discharge. It
is usually taken at or immediately downstream of the compressor discharge service valve (in either case on the downstream
side of the valve seat), where discharge valves are used.
3.5 Condenser. A refrigeration system component which condenses refrigerant vapor. Desuperheating and sub-cooling of
the refrigerant may occur as well.
3.5.1 Air-cooled Condenser. A component which condenses refrigerant vapor by rejecting heat to air mechanically
circulated over its heat transfer surface causing a rise in the air temperature.
3.5.2 Evaporatively-cooled Condenser. A component which condenses refrigerant vapor by rejecting heat to a water
and air mixture mechanically circulated over its heat transfer surface, causing evaporation of the water and an increase
in the enthalpy of the air.
3.5.3 Water-cooled Condenser. A component which utilizes refrigerant-to-water heat transfer means, causing the
refrigerant to condense and the water to be heated.
3.5.4 Water-cooled Heat Recovery Condenser. A component or components which utilizes refrigerant-to-water heat
transfer means, causing the refrigerant to condense and the water to be heated. This Condenser may be a separate
Condenser, the same as, or a portion of the Water-Cooled Condenser. The heat rejected can be done through a single or
multiple heat exchangers, including desuperheaters as defined in ANSI/AHRI Standard 470.
3.6 Dew Point. Refrigerant vapor saturation temperature at a specified pressure.
3.7 Energy Efficiency.
3.7.1 Cooling Energy Efficiency.
3.7.1.1 Cooling Coefficient of Performance (COPR). A ratio of the Net Refrigerating Capacity to the Total
Input Power at any given set of Rating Conditions. (Refer to Equation 1).
3.7.1.2 Energy Efficiency Ratio (EER). A ratio of the Net Refrigerating Capacity to the Total Input Power
at any given set of Rating Conditions. (Refer to Equation 2)
3.7.1.3 Power Input per Capacity (kw/tonR). A ratio of the Total Input Power to the Net Refrigerating
Capacity at any given set of Rating Conditions. (Refer to Equation 3).
3.7.2 Heating Energy Efficiency.
3.7.2.1 Heating Coefficient of Performance (COPH). A ratio of the Net Heating Capacity to the Total Input
Power at any given set of Rating Conditions. (Refer to Equation 4).
3.7.3 Simultaneous Cooling and Heating Energy Efficiency.
3.7.3.1 Heat Recovery Coefficient of Performance (COPHR). A ratio of the Net Heat Recovery Capacity plus
the Net Refrigerating Capacity to the Total Input Power at any given set of Rating Conditions. COPHR applies
to units that are operating in a manner that uses either all or only a portion of heat generated during chiller
operation, Qhrc, to heat the occupied space, while the remaining heat, Qcd, if any, is rejected to the outdoor

AHRI STANDARD 550/590 (I-P)-2018
3
ambient. COPHR takes into account the beneficial cooling Capacity, Qev, as well as the Heat Recovery Capacity,
Qhrc (Refer to Equation 5).
3.7.3.2 Simultaneous Heating and Cooling Coefficient of Performance (COPSHC). A ratio of the Net
Heating Capacity plus the Net Refrigerating Capacity to the Total Input Power at any given set of Rating
Conditions. COPSHC applies to units that are operating in a manner that uses both the net heating and
refrigerating capacities generated during operation. COPSHC takes into account the beneficial Capacity, Qev,
as well as the heating Capacity, Qcd, (Refer to Equation 6).
3.8 Fouling Factor (Rfoul). The thermal resistance due to fouling accumulated on the water side or air side heat transfer
surface.
3.8.1 Fouling Factor Allowance (Rfoul,sp). A specified value for Published Ratings as a provision for anticipated
thermal resistance due to water side or air side fouling during use, expressed in hft2ºF/Btu.
3.9 Liquid Refrigerant Temperature. The temperature of the refrigerant liquid leaving the Condenser but prior to the
expansion device.
3.10 Part-load Value (PLV). A single number figure of merit expressing part-load efficiency for equipment on the basis of
weighted operation at various partial load capacities for the equipment. (Refer to Appendix D for information regarding the
use of IPLV.IP and NPLV.IP.)
3.10.1 Integrated Part-Load Value (IPLV.IP). A single number part-load efficiency figure of merit calculated per the
method described in this standard at Standard Rating Conditions.
3.10.2 Non-Standard Part-Load Value (NPLV.IP). A single number part-load efficiency figure of merit calculated
per the method described in this standard referenced to conditions other than IPLV.IP conditions. (i.e. For units with
Water-Cooled Condensers that are not designed to operate at Standard Rating Conditions but is not used for Air-cooled
and evaporatively-cooled chillers.)
3.11 Percent Load (%Load). The ratio of the part-load net Capacity to the full-load rated net Capacity at the full-load rating
conditions, stated in decimal format. (e.g.100% = 1.0). The full load rating conditions, corresponding to 100% Load, shall be
at Standard Rating Conditions. Exception: Configurable Units shall use Application Rating Conditions.
3.12 Published Ratings. A statement of the assigned values of those performance characteristics, under stated Rating
Conditions, by which a unit may be chosen to fit its application. These values apply to all units of like nominal size and type
(identification) produced by the same manufacturer. The term Published Rating includes the rating of all performance
characteristics shown on the unit or published in specifications, advertising or other literature controlled by the manufacturer,
at stated Rating Conditions.
3.12.1 Application Rating. A rating based on tests performed at Application Rating Conditions (other than Standard
Rating Conditions).
3.12.2 Standard Rating. A rating based on tests performed at Standard Rating Conditions.
3.13 Rating Conditions. Any set of operating conditions under which a single level of performance results and which causes
only that level of performance to occur.
3.13.1 Standard Rating Conditions. Rating Conditions used as the basis of comparison for performance characteristics.
3.14 Significant Figure. Each of the digits of a number that are used to express it to the required degree of accuracy, starting
from the first nonzero digit (Refer to Sections 4.3 and 6.2).
3.15 “Shall” or “Should”. “Shall” or “should” shall be interpreted as follows:
3.15.1 Shall. Where “shall” or “shall not” is used for a provision specified, that provision is mandatory if compliance
with the standard is claimed.
AHRI STANDARD 550/590 (I-P)-2018
4
3.15.2 Should, “Should” is used to indicate provisions which are not mandatory but which are desirable as good
practice.
3.16 Total Input Power (Winput). Combined power input of all components of the unit, including Auxiliary Power and
excluding integral pumps.
3.17 Turn Down Ratio. The ratio of the maximum to the minimum instrument measurement value in the range over which
the measurement system meets the specified accuracy. Applicable only to measurements using a scale with an absolute zero
value (negative values not allowed).
3.18 Unit Type.
3.18.1 Configurable Unit. A chiller that has been selected to run at a full load point less than its maximum possible
Capacity
3.18.2 Packaged Unit. A chiller that has been selected to run at full load at its maximum Capacity.
3.19 Water-chilling or Water-heating Package. A factory-made and prefabricated assembly (not necessarily shipped as one
package) of one or more compressors, Condensers and evaporators, with interconnections and accessories designed for the
purpose of cooling or heating water. It is a machine specifically designed to make use of a vapor compression refrigeration
cycle to remove heat from water and reject the heat to a cooling medium, usually air or water. The refrigerant Condenser may
or may not be an integral part of the package.
3.19.1 Heat Recovery Water-chilling Package. A factory-made package, designed for the purpose of chilling water
and containing a Condenser for recovering heat. Where such equipment is provided in more than one assembly, the
separate assemblies are to be designed to be used together, and the requirements of rating outlined in this standard are
based upon the use of matched assemblies. It is a package specifically designed to make use of the refrigerant cycle to
remove heat from the water source and to reject the heat to another fluid for heating use. Any excess heat may be
rejected to another medium, usually air or water.
3.19.2 Heat Pump Water-heating Package. A factory-made package, designed for the purpose of heating water.
Where such equipment is provided in more than one assembly, the separate assemblies are to be designed to be used
together, and the requirements of rating outlined in this standard are based upon the use of matched assemblies. It is a
package specifically designed to make use of the refrigerant cycle to remove heat from an air or water source and to
reject the heat to water for heating use. This unit can include valves to allow for reverse-cycle (cooling) operation.
3.19.3 Modular Chiller Package. A modular chiller is a package that is made up of multiple water-chilling units that
can function individually or as a single unit.
3.19.4 Condenserless Chiller. A factory-made package designed for the purpose of chilling water but is not supplied
with a Condenser. A separate air, water or evaporatively cooled Condenser will be supplied to interface with the
Condenserless Chiller.
3.20 Water Pressure Drop. The reduction in static water pressure associated with the flow through a water-type heat
exchanger.
Section 4. Test Requirements
4.1 Test Requirements. Ratings shall be established at the Rating Conditions specified in Section 5. All ratings shall be
based on tests conducted in accordance with the test method and procedures described in Appendix C.
4.2 Tests shall report measurement values and calculated results in accordance with methods and procedures described in
Appendix C.
4.3 Calculations shall use measurement values without rounding as defined below. Reported values on test reports shall
round values of measurements and calculated results to a number of Significant Figures per Table 14.

AHRI STANDARD 550/590 (I-P)-2018
5
4.3.1 Numerical data are often obtained (or at least calculations can be made) with more digits than are justified by
their accuracy or precision. In order not to be misleading, such data shall be rounded to the number of figures consistent
with the confidence that can be placed in them when reported in final form. However, more digits shall be retained at
intermediate stages of calculation to avoid compounding of rounding errors; retain no less than two additional Significant
Figures than the final reported value, or as many digits as possible. The number of Significant Figures is the number of
digits remaining when the data are rounded.
4.3.2 The rules for identifying Significant Figures when writing or interpreting numbers are as follows:
4.3.2.1 All non-zero digits are considered significant. For example, 91 has two Significant Figures (9 and
1), while 123.45 has five Significant Figures (1, 2, 3, 4 and 5).
4.3.2.2 Zeroes appearing anywhere between two non-zero digits are significant. Example: 101.1203 has
seven Significant Figures: 1, 0, 1, 1, 2, 0 and 3.
4.3.2.3 Leading zeroes are not significant. For example, 0.00052 has two Significant Figures: 5 and 2.
4.3.2.4 Trailing zeroes in a number containing a decimal point are significant. For example, 12.2300 has
six Significant Figures: 1, 2, 2, 3, 0 and 0. The number 0.000122300 still has only six Significant Figures (the
zeros before the 1 are not significant). In addition, 120.00 has five Significant Figures since it has three trailing
zeros. This convention clarifies the precision of such numbers; for example, if a measurement precise to four
decimal places (0.0001) is given as 12.23 then it might be misunderstood that only two decimal places of
precision are available. Stating the result as 12.2300 makes clear that it is precise to four decimal places (in this
case, six Significant Figures).
4.3.2.5 The significance of trailing zeroes in a number not containing a decimal point can be ambiguous.
For example, it is not always clear if a number like 1300 is precise to the nearest unit (and just happens
coincidentally to be an exact multiple of a hundred) or if it is only shown to the nearest hundred due to rounding
or uncertainty. One of the following conventions shall be used to address this issue:
4.3.2.5.1 Place a bar over the last Significant Figure; any trailing zeros following this are
insignificant. For example, 1300 has three Significant Figures (and hence indicates that the number
is precise to the nearest ten).
4.3.2.5.2 Underline the last Significant Figure of a number; for example, "2000" has two
Significant Figures.
4.3.2.5.3 Place a decimal point after the number; for example, "100." indicates specifically that
three Significant Figures are meant.
4.3.2.5.4 In the combination of a number and a unit of measurement, choose a suitable unit
prefix. For example, the number of Significant Figures in a power measurement specified as 1300
W is ambiguous, while a power of 1.30 kW is not.
4.3.2.5.5 Use scientific notation or exponential notation; for example, 1.3010³ W.
4.3.2.6 In multiplication and division, the operation with the least number of Significant Figures determines
the numbers to be reported in the result. For example, the product 1256 x 12.2 = 15323.2 is reported as
15300. In addition and subtraction, the least number of figures to either the right or the left of the decimal point
determines the number of Significant Figures to be reported. Thus, the sum of 120.05 + 10.1 + 56.323 = 156.473
is reported as 156.5 because 10.1 defines the reporting level. In complex calculations involving multiplications
and additions, for example, the operation is done serially, and the final result is rounded according to the least
number of Significant Figures involved. Thus: (1256 x 12.2) + 125 = 15323.2 + 125 =15400.
4.3.3 The following rules shall be used in rounding values:
4.3.3.1 When the digit next beyond the one to be retained is less than five, the retained figure is kept
unchanged. For example: 2.541 becomes 2.5 to two Significant Figures.
AHRI STANDARD 550/590 (I-P)-2018
6
4.3.3.2 When the digit next beyond the one to be retained is greater than or equal to five, the retained figure
is increased by one. For example; 2.453 becomes 2.5 to two Significant Figures.
4.3.3.3 When two or more figures are to the right of the last figure to be retained, they are to be considered
as a group in rounding decisions. Thus in 2.4(501), the group (501) is considered to be >5 while for 2.5(499),
(499) is considered to be <5.
Section 5. Rating Requirements
5.1 Standard Rating Metrics.
5.1.1 Cooling Energy Efficiency. The general forms of the Cooling Energy Efficiency terms are listed as Equations
1 through 3. These terms are calculated at both design point and at part load conditions.
Note: Refer to Section 5.4.5.5 for part load degradation factor adjustment and Appendix F for atmospheric pressure
adjustment.
5.1.1.1 The Cooling Coefficient of Performance (COPR), kW/kW, shall be calculated as follows:
COPR = Qev
K3∙Winput 1
5.1.1.2 The Energy Efficiency Ratio (EER), Btu/(W·h), shall be calculated as follows:
EER = Qev
K7∙Winput 2
5.1.1.3 The Power Input per Capacity, kW/tonR, shall be calculated as follows:
kW/tonR = K5∙Winput
Qev 3
5.1.2 Heating Energy Efficiency.
5.1.2.1 The Heating Coefficient of Performance (COPH), kW/kW, shall be calculated as follows:
COPH = Qcd
K3∙Winput 4
5.1.2.2 The Heat Recovery Coefficient of Performance (COPHR), kW/kW shall be calculated as follows:
COPHR = Qev + Qhrc
K3∙Winput 5
5.1.2.3 The Simultaneous Heating and Cooling Coefficient of Performance (COPSHC), kW/kW, shall be
calculated as follows:
COPSHC = Qcd + Qev
K3∙Winput 6
5.1.3 Net Refrigerating Capacity. The Net Refrigerating Capacity, Btu/h, for the evaporator shall use the water
temperatures, water mass flow rate and water properties at the evaporator entering and leaving conditions and be
calculated as follows:
Qev = m𝑤 ∙ cp ∙ (Tin − Tout) 7
AHRI STANDARD 550/590 (I-P)-2018
7
Specific heat cp is taken at the average of entering and leaving water temperatures. When expressing water flow rate in
volumetric terms for ratings, the conversion from mass flow rate shall use water density corresponding to entering water
temperature (Refer to Equation 27). The volumetric flow rate shall be calculated as follows:
V𝑤 = 𝑚𝑤
𝜌𝑖𝑛∙ K10 8
5.1.4 Net Heating Capacity. The Net Heating Capacity, Btu/h, for either a standard or heat recovery Condenser shall
use the water temperatures, water flow rate, and water properties at the entering and leaving conditions and be calculated
as follows:
Qcd = m𝑤 ∙ cp ∙ (Tout − Tin) 9
Qhrc = m𝑤 ∙ cp ∙ (Tout − Tin) 10
Specific heat cp is taken at the average of entering and leaving water temperatures. When expressing water flow rate in
volumetric terms for ratings, the conversion from mass flow rate shall use water density corresponding to entering water
temperature (Refer to Equations 8 and 27).
5.1.5 Water Pressure Drop. For this standard, the Water Pressure Drop shall include pressure losses due to nozzles,
piping, or other interconnections included with the Water-chilling or Water-heating Package and shall include all
pressure losses across the external unit connection points for water inlet and water outlet. For Published Ratings, this
value is expressed in feet H2O at a reference water temperature of 60 °F. For test measurements, this is a differential
pressure expressed in psid. (Refer to Section 7 for converting units of measure). For the calculation of Water Pressure
Drop, Refer to Equation C18 and Appendix G.
5.2 Standard Ratings and Conditions. Standard Ratings for all Water-chilling Packages shall be established at the Standard
Rating Conditions. These packages shall be rated for cooling, heat recovery, or heating performance at conditions specified in
Table 1. Standard Ratings shall include a water-side Fouling Factor Allowance as specified in the notes section of Table 1.
Modular Chiller Packages consisting of multiple units and rated as a single package shall be tested as rated.

AHRI STANDARD 550/590 (I-P)-2018
8
Table 1. Standard Rating Conditions
Operating
Category Conditions
Cooling Mode Evaporator2
Cooling Mode Heat Rejection Heat Exchanger
Tower (Water Conditions)3 Heat/Recovery
(Water Conditions)4
Evaporatively-cooled
Entering Temperature5, 8
Air-cooled
(AC)
Entering Temperature6, 8
Without Condenser
Air-cooled
Refrigerant
Temp.
Water &
Evaporatively
Cooled Refrigerant
Temp.
Entering Temper
ature,
Leaving Tempera
ture,
Flow Rate,
Entering Tempera
ture,
Leaving Temper
ature,
Flow Rate,
Entering Tempera
ture,
Leaving Tempera
ture,
Dry-Bulb,
Wet-
Bulb,
Dry-Bulb,
Wet-Bulb,
SDT,
LIQ,
SDT,
LIQ,
ºF ºF gpm/tonR ºF ºF gpm/tonR ºF ºF ºF ºF ºF ºF ºF ºF ºF ºF
All Cooling
Standard 54.00 44.00 2.49 85.00 94.30 Note - 10 -- -- 95.00 75.00 95.00 -- 125.00 105.00 105.00 98.00
AC Heat
Pump High Heating7
Low -- 105.00 Note - 1 -- -- -- -- -- -- -- 47.00 43.00 -- -- -- --
Medium -- 120.00 Note - 1 -- -- -- -- -- -- -- 47.00 43.00 -- -- -- -- High -- 140.00 Note - 1 -- -- -- -- -- -- -- 47.00 43.00 -- -- -- --
AC Heat
Pump Low
Heating7
Low -- 105.00 Note - 1 -- -- -- -- -- -- -- 17.00 15.00 -- -- -- --
Medium -- 120.00 Note - 1 -- -- -- -- -- -- -- 17.00 15.00 -- -- -- --
High -- 140.00 Note - 1 -- -- -- -- -- -- -- 17.00 15.00 -- -- -- --
Water
Cooled
Heating
Low 54.00 44.00 2.49 -- -- -- 95.00 105.00 -- -- -- -- -- -- -- --
Medium 54.00 44.00 2.49 -- -- -- 105.00 120.00 -- -- -- -- -- -- -- -- High 54.00 44.00 2.49 -- -- -- 120.00 140.00 -- -- -- -- -- -- -- --
Boost 75.00 65.00 2.49 -- -- -- 120.00 140.00 -- -- -- -- -- -- -- --
Heat Recovery
Low 54.00 44.00 2.49 75.00 -- Note - 10 95.00 105.00 40.00 38.00 40.00 38.00 -- -- -- --
Medium 54.00 44.00 2.49 75.00 -- Note - 10 105.00 120.00 40.00 38.00 40.00 38.00 -- -- -- --
Hot Water 1 54.00 44.00 2.49 75.00 -- Note - 10 90.00 140.00 40.00 38.00 40.00 38.00
Hot Water 2 54.00 44.00 2.49 75.00 -- Note - 10 120.00 140.00 40.00 38.00 40.00 38.00 -- -- -- --
Notes:
1.
2.
3.
4.
5.
6.
7.
8.
9.
10.
The water flow rate used for the heating tests of reverse cycle air to water heat pumps shall be the flow rate determined during the cooling test.
The rating Fouling Factor Allowance for the cooling mode evaporator or the heating Condenser for AC reversible cycles shall be Rfoul = 0.000100 h·ft2·ºF/Btu.
The rating Fouling Factor Allowance for tower heat exchangers shall be Rfoul = 0.000250 h·ft2·ºF/Btu.
The rating Fouling Factor Allowance for heating and heat recovery heat exchangers shall be Rfoul = 0.000100 h·ft2·ºF/Btu for closed loop and Rfoul = 0.000250 h·ft2·ºF/Btu for open loop systems.
Evaporatively cooled Condensers shall be rated with a Fouling Factor Allowance of zero, Rfoul 0.000 h·ft2·ºF/Btu.
Air-Cooled Condensers shall be rated with a Fouling Factor Allowance of zero, Rfoul = 0.000 h·ft2·ºF/Btu.
A reversible cycle is assumed where the cooling mode evaporator becomes the condenser circuit in the heating mode.
Air-cooled & evaporatively-cooled unit ratings are at standard atmospheric condition (sea level). Measured test data will be corrected to an atmospheric pressure of 14.696 psia per Appendix F.
Rated water flow is determined by the water temperatures at the rated Capacity. The normalized flow rate shown, per unit of evaporator Capacity, is for reference only at Standard Rating Conditions.
Rated water flow is determined by the water temperatures at the rated Capacity and rated efficiency.

AHRI STANDARD 550/590 (I-P)-2018
9
5.3 Application Rating Conditions. Full and part-load Application Ratings shall include the range of Rating Conditions
listed in Table 2 or be within the operating limits of the equipment. For guidance to the industry, designing to large Fouling
Factors significantly impacts the performance of the chiller. It is best to maintain heat transfer surfaces by cleaning or
maintaining proper water treatment to avoid highly fouled conditions and the associated efficiency loss. From a test
perspective, highly fouled conditions are simulated with clean tubes by testing at decreased evaporator water temperatures and
increased condenser water temperatures. High Fouling Factors can increase or decrease these temperatures to conditions
outside test loop or equipment capabilities. For this test standard, the application range for the water side fouling shall be
between clean (0.000) and 0.001000 h·ft2·°F/Btu. Fouling factors above these values are outside of the scope of this standard
and shall be noted as such.
Table 2. Full and Part-load Application Rating Conditions
Evaporator Condenser
Cooling
Water Cooled Water Cooled
Leaving
Temperature1,
°F
Temperature
Difference
Across Heat
Exchanger5,
°F
Fouling
Factor
Allowance, h·ft2·ºF/Btu
Entering
Temperature2,
°F
Flow Rate,
gpm/tonR 5, 7
Fouling
Factor
Allowance, h·ft2·ºF/Btu
36.00 to
70.00
5.00 to
20.00
0.000 to
0.00100
55.00 to
105.00 1.0 to 6.0
0.000 to
0.00100
Air-Cooled
Entering Air Dry Bulb3, 6, 8, °F
55.0 to 125.6
Evaporatively Cooled
Entering Air Wet Bulb4, 6, °F
50.0 to 80.0
Heating
Water Source Evaporator Water Cooled Condenser
Entering Water Temperature1,
°F
Fouling
Factor
Allowance, h·ft2·ºF/Btu
Leaving Water
Temperature2,
°F
Temperature
Difference
Across Heat
Exchanger5,
°F
Fouling Factor
Allowance, h·ft2·ºF/Btu
40.00 to 80.00
0.000 to
0.00100
105.00 to
160.00
5.00 to
20.00
0.000 to
0.00100
Air Source Evaporator
Entering Air Temperature6, °F
15.00 to 60.00
Notes:
1. Evaporator water temperatures shall be published in rating increments of no more than 4.00°F.
2. Condenser water temperatures shall be published in rating increments of no more than 5.00°F.
3. Entering air temperatures shall be published in rating increments of no more than 10.00°F.
4. Air wet bulb temperatures shall be published in rating increments of no more than 2.50°F.
5. Applies to design point only, not part-load points.
6. Atmospheric pressure in the range of 11.56 to 15.20 psia, rated altitude not exceeding 6500 ft. Measured test
data will be corrected per Appendix F to the application rating atmospheric pressure.
7. The normalized flow rate is per unit of evaporator Capacity.
8. See Section 11 for ratings with entering air temperature of 125.6 °F.

AHRI STANDARD 550/590 (I-P)-2018
10
5.3.1 For the purpose of this standard, published Application Ratings shall use a standardized relationship between
rated geometric altitude (ZH) above mean sea level and atmospheric pressure (patm). The intent is to allow chiller
Application Ratings to be published based on the nominal altitude at the installation location without consideration of
local weather variations on atmospheric pressure. Test data however shall be corrected on the basis of atmospheric
pressure at the time of the test. See Section 7 and Appendix F.
5.4 Part-load Ratings. Water-chilling Packages shall be rated at 100%, 75%, 50%, and 25% load relative to the full-load
rating Net Refrigerating Capacity at the conditions defined in Table 3. For chillers capable of operating in multiple modes
(cooling, heating, and /or heat recovery), part-load ratings are only required for cooling mode operation.
Cooling mode Part-load rating points shall be presented in one or more of the following four ways:
a. IPLV.IP. Based on the conditions defined in Table 3 and method defined in Section 5.4.1.
b. NPLV.IP. Water-cooled Condenser only. Based on the conditions defined in Table 3 and method defined in
Section 5.4.1.
c. Individual part-load data point(s) suitable for calculating IPLV.IP or NPLV.IP as defined in Table 3.
d. Other part-load points, within the application rating limits of Table 2 and method defined in Section 5.4.2, that
do not meet the requirements of Footnotes (3) and (4) in Table 3 (i.e. variable water flow rates or other entering condenser
water temperatures). Neither IPLV.IP nor NPLV.IP shall be calculated for such points.
Note: Optionally, Heat Pump Water-heating Packages and Heat Recovery Water-chilling Packages are permitted to be rated at
individual part load points. Neither IPLV.IP nor NPLV.IP shall be calculated for such points.
5.4.1 Determination of Part-load Performance. For Water-chilling Packages covered by this standard, the IPLV.IP
or NPLV.IP shall be calculated as follows:
a. Determine the Part-load energy efficiency at 100%, 75%, 50%, and 25% load points at the conditions
specified in Table 3.
b. Use the following equation to calculate the IPLV.IP or NPLV.IP for units rated with COPR and EER.
IPLV.IP or NPLV.IP = 0.01·A + 0.42·B + 0.45·C + 0.12·D 11
For COPR and EER:
Where:
A = COPR or EER at 100% load
B = COPR or EER at 75% load
C = COPR or EER at 50% load
D = COPR or EER at 25% load
c. Use the following equation to calculate the IPLV.IP or NPLV.IP for units rated with kW/tonR:
IPLV. IP or NPLV. IP = 1
0.01
A+
0.42
B +
0.45
C +
0.12
D
12
Where:
A = Power Input per Capacity, kW/tonR at 100% load
B = Power Input per Capacity, kW/tonR at 75% load
C = Power Input per Capacity, kW/tonR at 50% load
D = Power Input per Capacity, kW/tonR at 25% load
5.4.1.1 For a derivation of Equations 11 and 12, and an example of an IPLV.IP or NPLV.IP calculation, see
Appendix D. The weighting factors have been based on the weighted average of the most common building
types and operations using average weather in 29 U.S. cities, with and without airside economizers.
AHRI STANDARD 550/590 (I-P)-2018
11
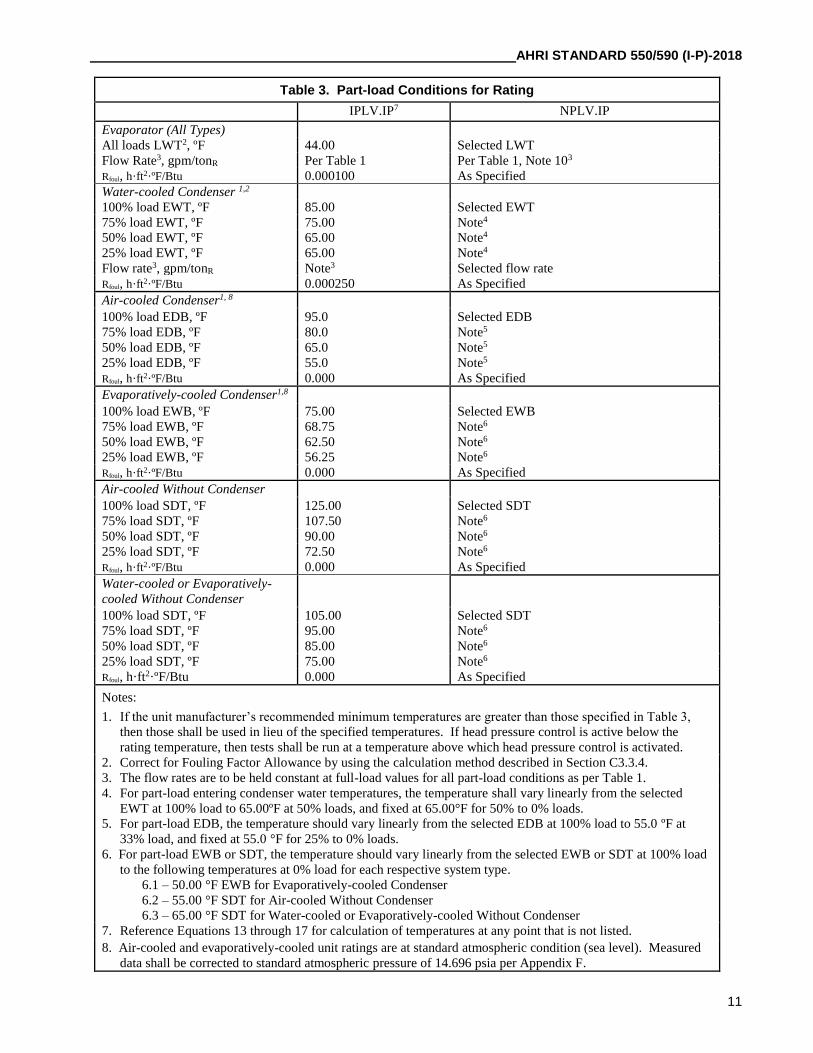
Table 3. Part-load Conditions for Rating
IPLV.IP7 NPLV.IP
Evaporator (All Types)
All loads LWT2, ºF 44.00 Selected LWT
Flow Rate3, gpm/tonR Per Table 1 Per Table 1, Note 103
Rfoul, h·ft2·ºF/Btu 0.000100 As Specified
Water-cooled Condenser 1,2
100% load EWT, ºF 85.00 Selected EWT
75% load EWT, ºF 75.00 Note4
50% load EWT, ºF 65.00 Note4
25% load EWT, ºF 65.00 Note4
Flow rate3, gpm/tonR Note3 Selected flow rate
Rfoul, h·ft2·ºF/Btu 0.000250 As Specified
Air-cooled Condenser1, 8
Selected EDB
Note5
Note5
Note5
As Specified
100% load EDB, ºF 95.0
75% load EDB, ºF 80.0
50% load EDB, ºF 65.0
25% load EDB, ºF 55.0
Rfoul, h·ft2·ºF/Btu 0.000
Evaporatively-cooled Condenser1,8
Selected EWB
Note6
Note6
Note6
As Specified
100% load EWB, ºF 75.00
75% load EWB, ºF 68.75
50% load EWB, ºF 62.50
25% load EWB, ºF 56.25
Rfoul, h·ft2·ºF/Btu 0.000
Air-cooled Without Condenser
Selected SDT
Note6
Note6
Note6
As Specified
100% load SDT, ºF 125.00
75% load SDT, ºF 107.50
50% load SDT, ºF 90.00
25% load SDT, ºF 72.50
Rfoul, h·ft2·ºF/Btu 0.000
Water-cooled or Evaporatively-
cooled Without Condenser
Selected SDT
Note6
Note6
Note6
As Specified
100% load SDT, ºF 105.00
75% load SDT, ºF 95.00
50% load SDT, ºF 85.00
25% load SDT, ºF 75.00
Rfoul, h·ft2·ºF/Btu 0.000
Notes:
1. If the unit manufacturer’s recommended minimum temperatures are greater than those specified in Table 3,
then those shall be used in lieu of the specified temperatures. If head pressure control is active below the
rating temperature, then tests shall be run at a temperature above which head pressure control is activated.
2. Correct for Fouling Factor Allowance by using the calculation method described in Section C3.3.4.
3. The flow rates are to be held constant at full-load values for all part-load conditions as per Table 1.
4. For part-load entering condenser water temperatures, the temperature shall vary linearly from the selected
EWT at 100% load to 65.00ºF at 50% loads, and fixed at 65.00°F for 50% to 0% loads.
5. For part-load EDB, the temperature should vary linearly from the selected EDB at 100% load to 55.0 ºF at
33% load, and fixed at 55.0 °F for 25% to 0% loads.
6. For part-load EWB or SDT, the temperature should vary linearly from the selected EWB or SDT at 100% load
to the following temperatures at 0% load for each respective system type.
6.1 – 50.00 °F EWB for Evaporatively-cooled Condenser
6.2 – 55.00 °F SDT for Air-cooled Without Condenser
6.3 – 65.00 °F SDT for Water-cooled or Evaporatively-cooled Without Condenser
7. Reference Equations 13 through 17 for calculation of temperatures at any point that is not listed.
8. Air-cooled and evaporatively-cooled unit ratings are at standard atmospheric condition (sea level). Measured
data shall be corrected to standard atmospheric pressure of 14.696 psia per Appendix F.

AHRI STANDARD 550/590 (I-P)-2018
12
5.4.1.2 The IPLV.IP or NPLV.IP rating requires that the unit efficiency be determined at 100%, 75%, 50%
and 25% at the conditions as specified in Table 3. If the unit, due to its capacity control logic cannot be operated
at 75%, 50%, or 25% Capacity then the unit shall be operated at other load points and the 75%, 50%, or 25%
capacity efficiencies shall be determined by plotting the efficiency versus the % load using straight line segments
to connect the actual performance points. The 75%, 50%, or 25% load efficiencies shall then be determined from
the curve. Extrapolation of data shall not be used. An actual chiller capacity point, equal to, or less than the
required rating point, shall be used to plot the data. The capacity points as close as possible to the rating load shall
be used. For example, if the minimum actual Capacity is 33% then the curve can be used to determine the 50%
capacity point, but not the 25% capacity point. For test points that are not run at the 75%, 50%, and 25% rating
points, the condenser temperature for determination of IPLV.IP shall be based on the measured part-load
percentage for the actual test point using the Equations 13 through 17. For example, for an air-cooled chiller test
point run at 83% Capacity, the entering air temperature for the test shall be 84.80 ºF (60·0.83 + 35).
Figure 1. Part-load Condenser Temperature for IPLV.IP
5.4.1.2.1 Entering air dry-bulb temperature (EDB), °F, for an Air-cooled Condenser at IPLV.IP
part load conditions (refer to Figure 1) shall use Equation 13:
EDB = | 60∙% Load+35 for Load >33%55 for Load ≤33%
13
Note: In the case of an Air-cooled Chiller, the Load term used to calculate the EDB temperature is
based on the adjusted Capacity after using the atmospheric pressure correction.
5.4.1.2.2 Entering water temperature (EWT), °F, for a Water-cooled Condenser at IPLV.IP part
load conditions (refer to Figure 1) shall use Equation 14:
EWT = | 40∙% Load+45 for Load >50%65 for Load ≤50%
14
5.4.1.2.3 Entering air wet-bulb temperature (EWB), °F, for an Evaporatively-cooled
Condenser at IPLV.IP part load conditions (refer to Figure 1) shall use Equation 15:
EWB = 25 ∙ %Load + 50 15
50
60
70
80
90
100
110
120
130
0% 10% 20% 30% 40% 50% 60% 70% 80% 90% 100%
Co
nd
en
ser
Tem
pera
ture
(°F
)
Percent Load

AHRI STANDARD 550/590 (I-P)-2018
13
5.4.1.2.4 Saturated discharge temperature (SDT), °F, for an air-cooled unit without Condenser at
IPLV.IP part load conditions (refer to Figure 1) shall use Equation 16:
AC SDT = 70 ∙ %Load + 55 16
5.4.1.2.5 Saturated discharge temperature (SDT), °F, for a water-cooled (WC) or evaporatively-
cooled (EC) unit without Condenser at IPLV.IP part load conditions (refer to Figure 1) shall use
Equation 17a or 17b:
WC SDT = 40 ∙ %Load + 65 17a
EC SDT = 40 ∙ %Load + 65 17b
5.4.1.2.6 If a unit cannot be unloaded to the 25%, 50%, or 75% capacity point, then the unit
shall be run at the minimum step of unloading at the condenser entering water or air temperature
based on Table 3 for 25%, 50% or 75% capacity points as required. The efficiency shall then be
determined by using one of the following three equations:
𝐸𝐸𝑅𝐶𝐷 = EERTest
CD 18
COPR,CD = COPTest
CD 19
(kW
tonR)
𝐶𝐷= (
kW
tonR)
𝑇𝑒𝑠𝑡∙ CD 20
5.4.1.2.7 EERTest, COPTest, and kW/tonRTest are the efficiency at the test conditions (after
atmospheric pressure adjustment as per Appendix F, as applicable) and CD is a degradation factor
to account for cycling of the compressor for capacities less than the minimum step of Capacity.
CD shall be calculated using the following equation:
CD = (0.13 ∙ LF) + 1.13 21
Where LF is the load factor calculated using the following equation:
LF =(%Load) (Qev 100%)
(Qev min%Load) 22
Part-load unit Capacity is the measured or calculated unit Capacity from which Standard Rating points
are determined using the method above.
5.4.1.3 Procedures for Testing and Calculation of IPLV/NPLV for Continuous Capacity Control Units.
For fully continuous capacity controlled units or units with a combination of staged Capacity and continuous
Capacity covered by this standard, the IPLV.IP/NPLV.IP shall be calculated using test data and or rating data
using the following procedures.
For test purposes, units shall be provided with manual means to adjust the unit refrigeration Capacity by
adjusting variable capacity compressor(s) Capacity and or the stages of refrigeration Capacity as defined by the
manufacturer’s instructions.
The following sequential steps shall be followed:
5.4.1.3.1 Step 1. The unit shall be configured per the manufacturer’s instructions, including
setting of stages of refrigeration and variable capacity compressor loading percent for each of the 4
rating percent load rating points of 100%, 75%, 50%, and 25%.
AHRI STANDARD 550/590 (I-P)-2018
14
The condenser entering temperature shall be adjusted per the requirements of Table 3 as determined
by the rating Percent Load of 100%, 75%, 50% and 25% and be within the required temperature
limits per Table 12 for the 100% rating point and for the 75%, 50% and 25% points if the adjusted
Capacity is within 2% of the rating percent load. If the adjusted measured percent load difference
is outside the 2% tolerance, then the actual adjusted measured Percent Load shall be used to
determine the condenser temperature using equations in Section 5.4.5.5 depending on the condenser
type. If the unit would operate with head pressure control active during the test at the specified
condenser temperature which would cause cycling and stable test conditions cannot be maintained,
then the condenser temperature should be increased to a condition where the cycling will not occur.
If the unit is an air-cooled chiller or evaporatively-cooled, then the measured Capacity and efficiency
shall be adjusted for atmospheric pressure using the procedures of Appendix F. No adjustment is
required for water-cooled units.
If the unit is a Packaged Unit, the adjusted full load Capacity shall be greater than the tolerance
defined in Table 11. If the unit is a Configurable Unit, then the Capacity shall be within the tolerance
range defined by Table 11. If the Capacity is not in compliance with the requirements, the test shall
be repeated.
If the adjusted part load test Capacity is within ±2% of the target Percent Load of 75%, 50% and
25% then the adjusted efficiency can be used directly to calculate the IPLV.IP/NPLV.IP. If the
adjusted Capacity of any point is not within the ±2% tolerance, then the test shall be repeated or
move to Step2 or Step 3.
5.4.1.3.2 Step 2. If the unit, due to its capacity control logic cannot be operated at the rating
75%, 50%, or 25% percent load point within ±2%, then additional test points for use in linear
interpolation are required. Capacity staging and variable Capacity shall be selected to have one test
as close as possible to the desired rating point with an adjusted Capacity above the desired rating
percent load rating point of 75%, 50% and 25% and a second test as close as possible to the desired
rating Percent Load with an adjusted Capacity below the desired rating Percent Load of 75%, 50%,
and 25%.
The condenser entering temperature shall be adjusted per the requirements of Table 3 using the test
point adjusted Percent Load and be within the required temperature limits per Table 12.
The test Capacity and efficiency for air and evaporatively-cooled chillers shall then be adjusted for
atmospheric pressure using the procedures of Appendix F. No adjustment is required for water-
cooled units.
Linear interpolation between the two adjusted capacity points shall then be used to determine the
efficiency at the rating 75%, 50% or 25% percent load point, using the entering condenser
temperature per Table 3 at the tested Capacity. Extrapolation of the data is not allowed and there
shall be a test point above and below the rating percent load point.
5.4.1.3.3 Step 3. If the unit cannot be unloaded to any of the 75%, 50%, or 25% rating points
at the minimum stage of unloading then the unit shall be run at the minimum stage of Capacity for
each of the test points where appropriate.
The condenser entering temperature shall be adjusted per the requirements of Table 3 using the
rating Percent Load of 75%, 50%, or 25% and be within the required temperature limits per Table
12. If the unit would operate with head pressure control active during the test at a specified condenser
temperature which would cause cycling and stable test conditions cannot be maintained, then the
condenser temperature should be increased to a condition where the cycling will not occur.
The Capacity and efficiency for air and evaporatively-cooled chillers shall then be adjusted for
atmospheric pressure using the procedures of Appendix F. No adjustment is required for Water-
cooled chillers.
AHRI STANDARD 550/590 (I-P)-2018
15
If the data for the lowest stage of Capacity is above the desired rating point load with allowance for
the 2% tolerance then the efficiency shall then be adjusted for cyclic degradation using the Equation
18, 19, or 20.
5.4.1.3.4 Step 4. Once the adjusted efficiency for each of the 100%, 75%, 50% and 25% rating
percent load rating points is determined using Steps 1, 2, or 3 as appropriate, then the
IPLV.IP/NPLV.IP shall be calculated using Equation 11 or 12.
5.4.1.4 Procedures for Testing and Calculation of IPLV/NPLV for Discrete Capacity Step Controlled Units.
For discrete capacity step controlled units, including units with only a single stage of Capacity, the
IPLV.IP/NPLV.IP shall be calculated using test data and or rating data obtained using the following procedures.
For test purposes, units shall be provided with manual means to adjust the unit refrigeration Capacity by
adjusting the stages of refrigeration Capacity as defined by the manufacturer’s instructions.
The following sequential steps shall be followed:
5.4.1.4.1 Step 1. The unit shall be configured per the manufacturer’s instructions, including setting of
stages of refrigeration for each of the 4 rating percent load rating points of 100%, 75%, 50%, and 25%.
The condenser entering temperature shall be adjusted per the requirements of Table 3 as determined
by the rating Percent Load of 100%, 50%, 75% and 25% and be within the required temperature limits
per Table 12. If the unit would operate with head pressure control active during the test at the specified
condenser temperature which would cause cycling and stable test conditions cannot be maintained,
then the condenser temperature should be increased to a condition where the cycling would not occur.
If the unit is an air-cooled chiller, then the measured Capacity and efficiency shall be adjusted for
atmospheric pressure using the procedures of Appendix F. No adjustment is required for Water-cooled
and evaporatively-cooled units.
If the adjusted part load test Capacity is within 2% of the target percent load of 75%, 50% and 25%
then the adjusted efficiency can be used directly to calculate the IPLV.IP/NPLV.IP. If the adjusted
Capacity of any point is not within the 2% tolerance, then move to Step 2 or 3.
5.4.1.4.2 Step 2. If the unit, due to its capacity control logic cannot be operated at the rating 75%,
50%, or 25% percent load point within 2%, then additional test points for use in linear interpolation
are required. Capacity staging shall be selected to have one test as close as possible to the desired
rating point with an adjusted Capacity above the desired rating percent load rating point of 75%, 50%
and 25% and a second test as close as possible to the desired rating Percent Load with an adjusted
Capacity below the desired rating Percent Load of 75%, 50%, and 25%. Capacity staging with a
Capacity greater or less than the capacity staging closest to the desired rating point shall not be used.
The condenser entering temperature shall be adjusted per the requirements of Table 3 using the test
point corrected Percent Load and be within the required temperature limits per Table 12.
The test Capacity and efficiency shall then be adjusted for atmospheric pressure using the procedures
of Appendix F.
Linear interpolation between the two adjusted capacity points shall then be used to determine the
efficiency at the rating 75%, 50% or 25% percent load point. Extrapolation of the data is not allowed
and there shall be a test point above and below the rating percent load point.
5.4.1.4.3 Step 3 If the unit cannot be unloaded to any of the 75%, 50%, or 25% rating points at the
minimum stage of unloading then the unit shall be run at the minimum stage of Capacity for each of
the test points where appropriate.
The condenser entering temperature shall be adjusted per the requirements of Table 3 using the rating

AHRI STANDARD 550/590 (I-P)-2018
16
Percent Load of 75%, 50%, or 25% and be within the required temperature limits per Table 12. If the
unit would operate with head pressure control active during the test at the specified condenser
temperature which would cause cycling and stable test conditions cannot be maintained, then the
condenser temperature should be increased to a condition where the cycling would not occur.
The Capacity and efficiency shall then be adjusted for atmospheric pressure for air and evaporatively-
cooled chillers using the procedures of Appendix F.
The efficiency shall then be adjusted for cyclic degradation using the Equations 18, 19, or 20.
5.4.1.4.4 Step 4. Once the adjusted efficiency for each of the 100%, 75%, 50% and 25% rating percent
load rating points is determined using step 1, 2, or 3 as appropriate, then the IPLV.IP/NPLV.IP shall
be calculated using Equations 11 or 12.
5.4.1.5 Sample Calculations. The following are examples of the IPLV.IP/NPLV.IP calculations:
5.4.1.5.1 Example 1.
The chiller is a Water-cooled centrifugal chiller that has proportional capacity control and can be
unloaded to less than 25%. The chiller has a full-load rated capacity of 500 tonR and a full-load
rated efficiency of 0.600 kW/tonR. The unit can be run at the required conditions in Table 3 for
IPLV.IP calculation. Table 4A shows the test results obtained. Because this is a water-cooled unit
no corrections need to be made for atmospheric pressure.
Table 4A. Chiller Performance - IPLV.IP for Example 1 Test Results
Test
No
Target
Rating
% Load,
%
Target
Capacity,
tonR
Measured
Net
Capacity,
tonR
Measured
% Load, %
Different
from Target
Capacity, %
Target
Condenser
EWT,
ºF
Measured
Power,
kW
Efficiency,
kw/tonR
1 100.0 500.0 515.0 103.0 3.00 85.00 296.6 0.5760
2 75.0 375.0 381.0 76.20 1.20 75.00 196.6 0.5160
3 50.0 250.0 266.0 53.20 3.20 66.28 140.7 0.5289
4 50.0 250.0 239.0 47.80 -2.20 65.00 131.1 0.5487
5 25.0 125.0 130.0 26.00 1.00 65.00 97.50 0.7500
Test 1 can be used for the full load IPLV.IP rating point A directly as the Capacity is within 3% of
the target and as per Table 11 where a tolerance of ±5% is allowed. Test 2 can also be used for the
IPLV.IP rating point B because it is within 2% of the target Capacity as required by Section 5.4.2.
Test 3 cannot be used directly for the IPLV.IP rating point C because the Capacity is 3.2% greater
than the required load of 50%. Another test could be run to try to get the Capacity within 2%, but
for this case it was chosen to run a lower capacity test for and then use interpolation. Test 5 can be
used directly for the IPLV.IP rating point D as the Capacity is within 1% of the target Capacity for
25% load. In the following Table 4B you will find the IPLV.IP rating point data that can then be
used to calculate the IPLV.IP.
Table 4B. Example 1 IPLV.IP Calculations
Rating
Point
Target
Rating %
Load, %
Measured Net
Capacity, tonR
Measured
Power, tonR
Efficiency,
kw/tonR Comment
A 100.0 515.0 296.6 0.5760 Use test point 1 directly.
B 75.0 381.0 196.6 0.5160 Use test point 2 directly.
C 50.0 - - 0.5406 Interpolate Test 3 and 4.
D 25.0 130.0 97.50 0.7592 Use test point 5 directly.
The IPLV.IP calculations are shown below using the rating data for IPLV.IP ratings points A, B, C
and D. Because the ratings are in kw/ton Equation 12 should be used.

AHRI STANDARD 550/590 (I-P)-2018
17
IPLV. IP = 1
0.01
0.5760 +
0.42
0.5160 +
0.45
0.5406 +
0.12
0.7592
= 0.5489
5.4.1.5.2 Example 2.
The chiller is a Water-cooled centrifugal chiller that has proportional capacity control. The unit can
be run at the 100%, 75%, and 50% part load rating points, but it can only unload to 27.7% and the
required test point D cannot be run. The chiller has a full-load rated Capacity of 800 tonR and a full-
load efficiency of 0.632 kW/tonR. The full load design conditions for the evaporator have a 42.00
ºF leaving water with a 50.00 ºF entering temperature. The condenser conditions at full load design
are 89.00 ºF entering water temperature with a 98 ºF leaving water temperature. Because this unit
is a Configurable Unit and was selected for the lift associated with these non-standard operating
conditions the IPLV.IP rating metric should not be used and instead the NPLV.IP metric used with
the NPLV.IP conditions and requirements of Table 3. Note that for an NPLV.IP test the condenser
temperature should very from the rated full load condition of 89.00 ºF down to 65.00 °F and then
remain constant. Because this is a Water-cooled machine no atmospheric pressure corrections are
required. Shown below in Table 5A is the test data that was obtained as part of a verification test.
Table 5A. Chiller Performance - NPLV.IP for Example 2 Test Results
Test
No
Target
Rating
% Load,
%
Target
Capacity,
tonR
Measured Net
Capacity, tonR
Measured
% Load,
%
Different
from Target
Capacity, %
Target
Condenser
EWT,
ºF
Measured
Power,
kW
Efficiency,
kw/tonR
1 100.0 800.0 803.7 100.5 0.5 89.0 507.9 0.6320
2 75.00 600.0 608.2 76.0 1.0 77.0 316.9 0.5210
3 50.00 400.0 398.5 49.8 -0.2 65.0 183.3 0.4600
4 25.00 200.0 221.5 27.7 2.7 65.0 125.2 0.5652
Test 1 was within 0.5% of the rated full load rated Capacity so it is within the allowable tolerance
as defined in Table 11 so the test data can be used directly in the NPLV.IP calculations for rating
point A. Test 2 is within 1% of the 75% load point Capacity so it can also be used to directly for the
NPLV.IP rating point B. Test 3 is also within -0.2% of the 50% load point capacity point so it can
be used directly for the NPLV.IP rating point C. Test 4 was run at the lowest Capacity unloading
capability of the chiller and the capacity load of 27.7% is greater than 2% above the required rating
point of 25% so it cannot be used directly. Because this is the lowest capacity point it is not
acceptable to use interpolation where a rating point above and below the 25% would be required.
Extrapolation is not allowed by the standard. Therefore, for NPLV.IP rating point D determination
a degradation factor needs to be applied to the measured efficiency to reflect that the unit will be
cycling at a 25% load point. The calculations for the NPLV.IP are shown below.
Table 5B. Example 2 NPLV.IP Calculations
Rating
Point
Target
Rating %
Load,
%
Measured Net
Capacity,
tonR
Measured
Power,
kW
LF CD Efficiency,
kw/tonR Comment
A 100.0 803.7 507.9 - - 0.6320 Use Test 1 directly.
B 75.00 608.2 316.9 - - 0.5210 Use Test 2 directly.
C 50.00 398.5 183.3 - - 0.4600 Use Test 3 directly.
D 25.00 - - 0.902935 1.012619 0.5724 Use Test 4 with CD.
The following is a summary of the calculations for the degradation of rating Test 4:
LF = 0.25 ∙ 800
221.5 = 0.9029

AHRI STANDARD 550/590 (I-P)-2018
18
𝐶𝐷 = (−0.13 ∙ 0.9029) + 1.13 = 1.0126
kW/tonR25%,CD = 1.0126 ∙ 0.5652 = 0.5724
With the data for the 4 NPLV.IP rating points A, B, C, and D the NPLV.IP can then be calculated
using Equation 12
NPLV. IP = 1
0.01
0.6320 +
0.42
0.5210 +
0.45
0.4600 +
0.12
0.5724
= 0.4975
5.4.1.5.3 Example 3.
The chiller is an air-cooled chiller rated at 150 tonR. The test data was run when the atmospheric
pressure was 14.420 psia. The full-load measured Capacity is 148.2 tonR with an EER of 10.44.
After atmospheric adjustment to sea level conditions, the adjusted Capacity is 148.4 tonR with a full-
load adjusted EER of 10.48. The unit has 10 stages of capacity control and can unload down to a
minimum of 15% of rated load. Only 7 stages of capacity control are needed for the computation
of rating point data for the IPLV.IP calculations. The standard procedures require that for
interpolation capacity points closest to the desired ratings point shall be used. Larger or smaller
capacity points from other stages cannot be used. Shown below is the test data that was obtained for
the 7 points that will be used for interpolation and calculation of the IPLV.IP. Because this is an air
cooled chiller the test performance shall be corrected to standard atmospheric pressure of 14.696
using the procedures in Appendix F. Shown in Table 6A are the test data and the corrections for
atmospheric pressure.
Table 6A. Chiller Performance - IPLV.IP for Example 3 Test Results
Test
No
Target
Rating
% Load,
%
Target
Capacity, tonR
Measured Net
Capacity,
tonR
Measured Total
Power,
kW
Measured
Efficiency, Btu/ W∙h
Capacity
Correction Factor
Efficiency
Correction Factor
Corrected
Capacity, tonR
Corrected
Efficiency, Btu/ W∙h
Corrected Measured
% Load,
%
Different
from
target capacity,
%
Target
EDB, ºF
1 100.0 150.0 148.2 170.3 10.44 1.0017 1.0039 148.4 10.48 98.97 -1.03 95.00
2 75.0 112.5 124.5 125.8 11.88 1.0014 1.0032 124.7 11.91 83.12 8.12 84.87
3 75.0 112.5 105.7 93.8 13.52 1.0012 1.0028 105.8 13.56 70.55 -4.45 77.33
4 50.0 75.0 82.4 66.82 14.80 1.0009 1.0021 82.48 14.83 54.98 4.98 67.99
5 50.0 75.0 62.8 49.52 15.22 1.0007 1.0016 62.84 15.24 41.90 -8.10 60.14
6 25.0 37.5 45.2 36.23 14.97 1.0005 1.0012 45.22 14.99 30.15 5.15 55.00
7 25.0 37.5 22.5 19.01 14.20 1.0003 1.0006 22.51 14.21 15.00 -10.00 55.00
Before using the test data to calculate the IPLV.IP the data shall be corrected for the atmospheric
pressure of 14.420 psia using Appendix F. The calculations for test point 2 are shown below as an
example of the atmospheric correction calculations.
Capacity Qev75%Load = 124.5 tonR
Capacity Q ev100%Load = 148.2 tonR
Efficiency ƞtested FL = 10.44 EER
Efficiency ƞtest = 11.88 EER
Atmospheric pressure patm = 14.42 psia
Correction factor DQ = 0.0011273∙14.42² –0.041272∙14.42 + 1.36304 = 1.0023
Correction factor Dη = 0.0024308∙14.42²–0.090075∙14.42 + 1.79872 = 1.0053
Correction Factor CFQ = 1 + (124.5/148.2) · (1.0023-1) ·exp[-0.35· (1.0053·10.44-9.6)] = 1.0014
Correction Factor CFƞ = 1+ (124.5/148.2) · (1.0053-1) ·exp[-0.35· (1.0053·10.44-9.6)] = 1.0032

AHRI STANDARD 550/590 (I-P)-2018
19
Corrected Capacity Qcorrected = 124.5·1.0014 = 124.7 tonR
Corrected efficiency ƞcorrected = 11.88·1.0032 = 11.91 EER
Once the corrections are made then the following Table 6B shows the calculations that are done to
determine the IPLV.IP rating points.
Table 6B. Example 3 IPLV.IP Calculations
Rating
Point
Target Rating
% Load,
%
Measured Net
Capacity,
kW
Measured
Power,
kW
LF CD Efficiency,
Btu/W Comment
A 100.0 148.2 170.3 - - 10.48 Use Test 1 directly.
B 75.00 - - - - 12.98 Interpolate Test 2 and 3.
C 50.00 - - - - 14.99 Interpolate Test 4 and 5.
D 25.00 - - - - 14.72 Interpolate Test 6 and 7.
For the IPLV.IP rating point A then Test 1 can be used. It is within the required tolerance of -5% on
Capacity so the corrected efficiency can be used for the point A rating efficiency. For rating points B,
C, and D the measure capacity is greater or less than the required load ±2% so interpolation shall be
used. There are stages of Capacity to either side of the 75%, 50%, and 25% rating points that allow
for interpolation. The capacity stages closest to the rating points are used (Figure 2). Due to the fact
that the chiller cannot run at the desired rating points, use Equation 13 to determine the target entering
dry-bulb temperature (EDB) using the corrected measured percent load. Use these target outdoor air
temperatures when evaluating tolerance criteria in Table E2. So, for rating point B linear interpolation
is used using corrected Test 2 and 3 and similar linear interpolation for rating point C and D.
Figure 2. Rating Point Interpolation
An example of the linear interpolation is shown below for the 25% point D calculation.
EER25% = (25% − 15.00%
30.15% − 15.00%) (14.99 − 14.21) + 14.21 = 14.72
The IPLV.IP can then be calculated using the efficiencies determined from the interpolation for the
IPLV.IP rating point A, B, C and D. Note: because the ratings are in EER, Equation 11 is used.
IPLV. IP = (0.01 ∙ 10.48) + (0.42 ∙ 12.98) + (0.45 ∙ 14.99) + (0.12 ∙ 14.72) = 14.07
5.4.1.5.4 Example 4.
For this example, we have an air-cooled chiller rated at 110 tonR. The full-load measured Capacity
is 110.2 tonR with an EER of 9.558. After atmospheric adjustment to sea level conditions for a
8.00
9.00
10.00
11.00
12.00
13.00
14.00
15.00
16.00
0.00 25.00 50.00 75.00 100.00
EER
% Load
Test Data
Ratings

AHRI STANDARD 550/590 (I-P)-2018
20
measured atmospheric pressure of 14.200, the Capacity is 110.7 tonR with a full-load EER of 9.667.
The unit has 3 stages of Capacity with the last stage of Capacity greater than the required 25% rating
point. The tests run for verification of the IPLV.IP are shown in Table 7A. In the table, it also
shows the corrections for atmospheric pressure which is required because the unit is an air-cooled
chiller.
Table 7A. Chiller Performance - IPLV.IP for Example 4 Test Results
Test
No
Target
Rating
% Load
Target
Capacity,
tonR
Measured
Net
Capacity,
tonR
Measured
Total
Power,
kW
Measured
Efficiency,
Btu/W∙h
Capacity
Correction
Factor
Efficiency
Correction
Factor
Corrected
Capacity,
tonR
Corrected
Efficiency,
Btu/W∙h
Measured
% Load,
%
Difference
from
target
capacity,
%
Target
EDB,
ºF
1 100.0 110.0 110.2 138.1 9.576 1.0042 1.0096 110.7 9.667 100.60 0.60 95.00
2 75.0 82.50 79.30 77.70 12.25 1.0030 1.0069 79.5 12.33 72.31 -2.69 78.38
3 50.0 55.00 45.40 39.00 13.97 1.0017 1.0039 45.5 14.02 41.34 -8.66 59.81
4 25.0 27.50 46.50 40.90 13.64 1.0018 1.0040 46.6 13.70 42.35 17.35 55.00
Test 1 is an acceptable test for the full load IPLV.IP rating point A because the corrected Capacity
is within 0.6% of the rated Capacity and above the -5.0% tolerance as defined in Table 11. Tests 2
and 3 are not within the 2% acceptable tolerance for part load points so interpolation will be required.
Because the unit cannot unload to 25% and because the Test 3 at minimum unloading was run at the
required 59.81°F target ambient temperature an additional test has been run at the 25% ambient
temperature of 55.00°F and this point will then be used along with a degradation factor to calculate
the 25% point D rating point. Shown below in Table 7B is the calculations for the IPLV.IP.
Table 7B. Example 4 IPLV.IP Calculations
Rating
Point
Target Rating
% Load, %
Measured Net
Capacity, kW
Measured
Power,
kW
LF CD Efficiency,
Btu/W∙h Comment
A 100.0 110.2 138.1 - - 9.667 Use Test 1 directly.
B 75.00 - - - - 12.08 Interpolate Test 1 and 2.
C 50.00 - - - - 13.55 Interpolate Test 2 and 3.
D 25.00 - - 0.590356 1.053254 13.01 Use Test 4 with CD.
Test 1 is used directly for the IPLV.IP rating point A. Test 1 and 2 are used for the IPLV.IP rating
point B interpolation and Test 2 and 3 are used to interpolate the C rating point. For the IPLV.IP
rating point D the degradation factor is applied to the Test 4 corrected efficiency to account for the
cycling of the last stage of Capacity.
The IPLV.IP can then be calculated using the efficiencies determined from the interpolation for the
IPLV.IP rating point A, B, C and D. Note: because the ratings are in EER, Equation 11 is used.
IPLV. IP = (0.01 ∙ 9.667) + (0.42 ∙ 12.08) + (0.45 ∙ 13.55) + (0.12 ∙ 13.01) = 12.83
5.4.1.5.5 Example 5.
For this example, the chiller is a water-cooled 15 tonR positive displacement chiller with a full-load
efficiency of 0.780 kW/tonR. It only has 1 stage of Capacity so the CD degradation factor shall be
used to generate the rating data for the 75%, 50%, and 25% IPLV.IP rating points. The units can
only run at full-load, thus additional performance information is required with the unit running at
the 75.00 ºF entering condenser water temperature for the B rating point and at 65.00 ºF condenser
entering water for the C and D rating point. The condenser water temperature is 65.00 ºF for both
the 50% and 25% rating points because the load is equal to or less than 50%, thus only 3 test points
are required to generate the IPLV.IP rating data. The chiller has the following test information as

AHRI STANDARD 550/590 (I-P)-2018
21
shown in in Table 8A. Note that because this is a water-cooled unit no atmospheric pressure
corrections are required.
Table 8A. Chiller Performance - IPLV.IP for Example 5 Test Results
Test No
Target
Rating %
Load, %
Target
Capacity,
tonR
Measured
Net
Capacity,
tonR
Measured
% Load
Different
from Target
Capacity
Target
Condenser
EWT,
ºF
Measured
Power,
kW
Efficiency,
kw/tonR
1 100.0 15.00 15.30 102.0 2.00 85.00 11.90 0.7778
2 75.0 11.25 17.30 115.33 40.33 75.00 10.60 0.6127
3 50.0 7.500 19.80 132.00 82.00 65.00 11.30 0.5707
The test point 1 can be used for the A rating point because it has a Capacity greater than the capacity
tolerance defined in Table 11. For the B, C, and D rating points degradation factors need to be
applied to the ratings test results. The IPLV.IP rating point data is shown in Table 8B.
Table 8B. Example 5 IPLV.IP Calculations
Rating
Point
Target
Rating %
Load,
%
Measured
Net
Capacity,
tonR
Measured
Power,
kW
LF CD Efficiency,
kw/tonR Comment
A 100.0 15.30 11.90 - - 0.7778 Use Test 1 directly
B 75.00 - - 0.650289 1.045462 0.6406 Use Test 2 with CD
C 50.00 - - 0.378788 1.080758 0.6168 Use Test 3 with CD
D 25.00 - - 0.189394 1.105379 0.6308 Use Test 4 with CD
The IPLV.IP can then be calculated using the efficiencies determined from the interpolation for the
IPLV.IP rating point A, B, C and D. Note: because the ratings are in kW/tonR, Equation 12 is used.
IPLV. IP = 1
0.01
0.778 +
0.42
0.6406 +
0.45
0.6168 +
0.12
0.6308
= 0.6296
5.4.1.5.6 Example 6.
For this example, the chiller is an air-cooled chiller with continuous unloading rated at 200 tonR.
The full-load measured Capacity is 197.2 tonR with an EER of 9.718. After atmospheric adjustment
to sea level conditions, the Capacity is 199.2 tonR with a full-load EER of 9.938. The measured and
adjusted performance, for both full and part-load test points, are shown in Table 9A. The
atmospheric pressure measured during the test was 13.50 psia.
Table 9A. Chiller Performance - IPLV.IP for Example 6 Test Results
Test
No
Target
Rating
% Load,
%
Target
Capacity,
tonR
Measured
Net
Capacity,
tonR
Measured
Total
Power,
kW
Measured
Efficiency,
Btu/W
Capacity
Correction
Factor
Efficiency
Correction
Factor
Corrected
Capacity,
tonR
Corrected
Efficiency,
Btu/W
Measured
% Load,
%
Different
from
Target
Capacity,
%
Target
EDB,
ºF
1 100.0 200.0 197.2 243.5 9.718 1.0099 1.0226 199.2 9.938 99.58 -0.42 95.00
2 75.0 150.0 149.1 146.0 12.25 1.0075 1.0171 150.2 12.46 75.11 0.11 80.00
3 50.0 100.0 100.2 87.00 13.82 1.0051 1.0115 100.7 13.98 50.35 0.35 65.00
4 25.0 50.0 56.50 51.30 13.22 1.0029 1.0065 56.66 13.30 28.33 3.33 55.00
Test number 1 can be used for the full load IPLV.IP rating point A, because the corrected Capacity
is within -0.42% of the rating and the tolerance is -5.0% for a Packaged Unit. Test 2, can be used

AHRI STANDARD 550/590 (I-P)-2018
22
for rating point B as it is within the 2% tolerance for Capacity and the same is true for Test 3 which
can be used for rating point C. Test 4 cannot be used directly because the Capacity is 3.33% above
the required Capacity and because it is the lowest unloading capability of the unit, a degradation
factor has to be applied.
The rating point data calculations are shown in Table 9B.
Table 9B. Example 6 IPLV.IP Calculations
Rating
Point
Target Rating %
Load,
%
Corrected
Capacity,
tonR
Corrected
Efficiency,
Btu/W∙h
LF CD Efficiency,
Btu/W∙h Comment
A 100.0 197.2 9.938 - - 9.938 Use Test 1 directly.
B 75.00 149.1 12.46 - - 12.46 Use Test 2 directly.
C 50.00 100.2 13.98 - - 13.98 Use Test 3 directly.
D 25.00 56.50 13.30 0.882440 1.015283 13.10 Use Test 4 with CD.
The IPLV.IP can be calculated using the efficiencies determined from the IPLV.IP rating point A, B,
C and D. Note: because the ratings are in EER, Equation 11 is used.
IPLV. IP = (0.01 ∙ 9.938) + (0.42 ∙ 12.46) + (0.45 ∙ 13.98) + (0.12 ∙ 13.10) = 13.20
5.4.1.5.7 Example 7.
The unit is an evaporatively-cooled chiller with a rated Capacity of 150 tonR. It has a rated full load
efficiency 14.50. The unit has proportional capacity control, but can only unload to 28.01%. The
atmospheric pressure during the test was 14.100 psia. Because this is an evaporatively-cooled
machine correction for atmospheric pressure need to be made using Appendix F. The test data and
atmospheric correction data are shown in the following Table 10A.
Table 10A. Chiller Performance - IPLV.IP for Example 7 Test Results
Test
No
Target
Rating
% Load,
%
Target
Capacity,
tonR
Measured
Net
Capacity,
tonR
Measured
Total
Power,
kW
Measured
Efficiency,
Btu/W∙h
Capacity
Correction
Factor
Efficiency
Correction
Factor
Corrected
Capacity,
tonR
Corrected
Efficiency,
Btu/W∙h
Measured
% Load,
%
Different
from
Target
Capacity,
%
Target
EWB,
°F
1 100.0 150.0 151.0 125.2 14.47 1.0009 1.0020 151.1 14.50 100.76 0.76 75.00
2 75.0 112.5 114.0 84.55 16.18 1.0007 1.0015 114.1 16.20 76.05 1.05 68.75
3 50.0 75.00 73.50 57.27 15.40 1.0004 1.0010 73.53 15.42 49.02 -0.98 62.50
4 25.0 37.50 42.00 45.82 11.00 1.0002 1.0006 42.01 11.01 28.01 3.01 57.00
Test 1 can be used for the IPLV.IP rating point A because the Capacity is within 0.76% of the rated
Capacity and the tolerance is ± 5 for a configured unit. Test 2 can be used directly for IPLV.IP rating
point B and Test 3 can be used for rating point C as they adjusted capacities within 2% of the target
rating load. Because Test 4 can only unload to 28.01% a degradation correction needs to be made
to Test 4 to determine the IPLV.IP rating point D. The IPLV.IP rating point data is shown in the
Table 10B.
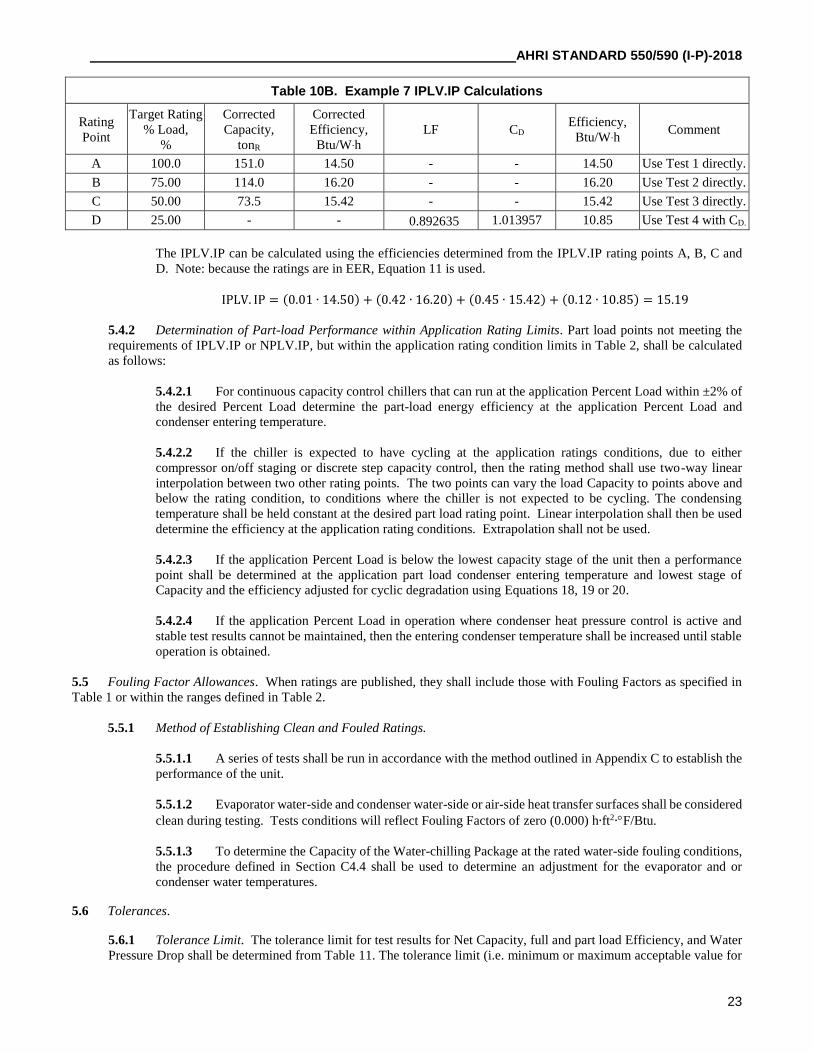
AHRI STANDARD 550/590 (I-P)-2018
23
Table 10B. Example 7 IPLV.IP Calculations
Rating
Point
Target Rating
% Load,
%
Corrected
Capacity,
tonR
Corrected
Efficiency,
Btu/W∙h
LF CD Efficiency,
Btu/W∙h Comment
A 100.0 151.0 14.50 - - 14.50 Use Test 1 directly.
B 75.00 114.0 16.20 - - 16.20 Use Test 2 directly.
C 50.00 73.5 15.42 - - 15.42 Use Test 3 directly.
D 25.00 - - 0.892635 1.013957 10.85 Use Test 4 with CD.
The IPLV.IP can be calculated using the efficiencies determined from the IPLV.IP rating points A, B, C and
D. Note: because the ratings are in EER, Equation 11 is used.
IPLV. IP = (0.01 ∙ 14.50) + (0.42 ∙ 16.20) + (0.45 ∙ 15.42) + (0.12 ∙ 10.85) = 15.19
5.4.2 Determination of Part-load Performance within Application Rating Limits. Part load points not meeting the
requirements of IPLV.IP or NPLV.IP, but within the application rating condition limits in Table 2, shall be calculated
as follows:
5.4.2.1 For continuous capacity control chillers that can run at the application Percent Load within ±2% of
the desired Percent Load determine the part-load energy efficiency at the application Percent Load and
condenser entering temperature.
5.4.2.2 If the chiller is expected to have cycling at the application ratings conditions, due to either
compressor on/off staging or discrete step capacity control, then the rating method shall use two-way linear
interpolation between two other rating points. The two points can vary the load Capacity to points above and
below the rating condition, to conditions where the chiller is not expected to be cycling. The condensing
temperature shall be held constant at the desired part load rating point. Linear interpolation shall then be used
determine the efficiency at the application rating conditions. Extrapolation shall not be used.
5.4.2.3 If the application Percent Load is below the lowest capacity stage of the unit then a performance
point shall be determined at the application part load condenser entering temperature and lowest stage of
Capacity and the efficiency adjusted for cyclic degradation using Equations 18, 19 or 20.
5.4.2.4 If the application Percent Load in operation where condenser heat pressure control is active and
stable test results cannot be maintained, then the entering condenser temperature shall be increased until stable
operation is obtained.
5.5 Fouling Factor Allowances. When ratings are published, they shall include those with Fouling Factors as specified in
Table 1 or within the ranges defined in Table 2.
5.5.1 Method of Establishing Clean and Fouled Ratings.
5.5.1.1 A series of tests shall be run in accordance with the method outlined in Appendix C to establish the
performance of the unit.
5.5.1.2 Evaporator water-side and condenser water-side or air-side heat transfer surfaces shall be considered
clean during testing. Tests conditions will reflect Fouling Factors of zero (0.000) h∙ft2∙F/Btu.
5.5.1.3 To determine the Capacity of the Water-chilling Package at the rated water-side fouling conditions,
the procedure defined in Section C4.4 shall be used to determine an adjustment for the evaporator and or
condenser water temperatures.
5.6 Tolerances.
5.6.1 Tolerance Limit. The tolerance limit for test results for Net Capacity, full and part load Efficiency, and Water
Pressure Drop shall be determined from Table 11. The tolerance limit (i.e. minimum or maximum acceptable value for

AHRI STANDARD 550/590 (I-P)-2018
24
Capacity, Efficiency, or Water Pressure Drop) shall be rounded to the number of Significant Figures in Table 14 prior
to comparison with a test result rounded to the same number of Significant Figures.
The tolerance limits are intended to be used when testing a unit to verify and confirm performance. They take into
consideration the following:
5.6.1.1 Uncertainty of Measurement. When testing a unit, there are variations that result from
instrumentation accuracy and installation affects, as well as test facility stability.
5.6.1.2 Uncertainty of Test Facilities. The tested performance of the same unit tested in multiple facilities
will vary due to setup variations.
5.6.1.3 Uncertainty due to Manufacturing. During the manufacturing of units, there are variations due to
manufacturing production tolerances that will impact the performance from unit to unit.
5.6.1.4 Uncertainty of Performance Prediction Models. Due to the large complexity of options,
manufacturers may use performance prediction models to determine ratings.
To comply with this standard, any test per Section 4.1 to verify published or reported values shall be in accordance with
Table 14.

AHRI STANDARD 550/590 (I-P)-2018
25
Table 11. Definition of Tolerances
Limits Related Tolerance Equations2,3 C
apac
ity
Cooling or heating
Capacity for units
with continuous
unloading1
Full Load minimum:
100%- Tol1
Full Load maximum:
100%+ Tol1
Tol1 = 0.105 − (0.07 ∙ %Load) + (0.15
∆TFL ∙ %Load) 23
See Figure 3 for graphical representation of the Tol1
tolerance.
Cooling or heating
Capacity for units
with discrete
capacity steps
Full Load minimum:
100% - Tol1
Full load maximum: no
limit (Full Load shall be
at the maximum stage of
Capacity)
Eff
icie
ncy
EER
Minimum of:
(rated EER) / (100%+
Tol1)
kW/tonR
Maximum of:
(100%+ Tol1)·(rated
kW/tonR)
COP
Minimum of:
(rated COP) / (100%+
Tol1)
IPLV.IP
NPLV.IP
EER
Minimum of:
(rated EER) / (100%+
Tol2)
Tol2 = 0.065 + (0.35
∆TFL
) 24
See Figure 4 for graphical representation of the Tol2
tolerance.
IPLV.IP
NPLV.IP
kW/tonR
Maximum of:
(100%+ Tol2)·(rated
kW/tonR)
IPLV.IP
NPLV.IP
COPR
Minimum of:
(rated COPR) / (100%+
Tol2)
Water Pressure Drop ∆pcorrected ≤ Tol3 Tol3 = max {1.15 ∙ ∆prated
∆prated + 2 ft H2O 25
Notes:
1. The target set point condenser entering temperatures (Figure 1) for continuous unloading units will be determined
at the target part load test point.
2. For air-cooled units and evaporatively-cooled units, all tolerances are computed for values after the atmospheric
correction is taken into account.
3. %Load, Tol1 and Tol2 are in decimal form.

AHRI STANDARD 550/590 (I-P)-2018
26
Figure 3 is a graphical representation of the related tolerance equation for Capacity and efficiency as noted in Table 11.
Figure 3. Allowable Tolerance (Tol1) Curves for Full and Part-load Points
Figure 4 is a graphical representation of the related tolerance equation for IPLV.IP and NPLV.IP as noted in Table 11. The
PLV line shown can represent either IPLV.IP or NPLV.IP depending on use.
Figure 4. IPLV.IP and NPLV.IP Tolerance (Tol2) Curve
5.6.2 Allowable Operating Condition Tolerances. Tests shall be conducted while maintaining the following
tolerance limits on operating conditions. Measurement values and calculation results shall not deviate from published
rating values more than the operating condition tolerance limits determined from Table 12.
0%
5%
10%
15%
20%
6 8 10 12 14 16 18 20
To
l 2
Evaporator Design ∆T at Full Load, °F

AHRI STANDARD 550/590 (I-P)-2018
27
Table 12. Definition of Operating Condition Tolerances and Stability Criteria
Measurement or Calculation
Result
Applicable
Operating Mode(s)
Values Calculated
from
Data Samples Operating Condition Tolerance Limits Stability Criteria
Mean Standard
Deviation
Net Capacity
(Cooling or Heating)
Cooling,
Heating,
Heat Recovery Q -
Unit with Continuous Unloading: 1
No requirement
Part Load test Capacity shall be within 2% of the target
part-load Capacity 2
|Q − Qtarget
|
Q100%
≤ 2.000%
Units with Discrete Capacity Steps:
Part Load test points shall be taken as close as practical to
the specified part-load rating points as stated in Table 3
Evaporator
Entering Water
Temperature
Cooling T sT
No Requirement
sT ≤ 0.18 °F
Leaving Water
Temperature |T − Ttarget| ≤ 0.50 °F
Condenser
Entering Water
Temperature
Leaving Water
Temperature No Requirement
Condenser
Entering Air
Mean Dry Bulb
Temperature 3 Cooling with fan
cycling T sT |T − Ttarget| ≤ 1.00 °F sT ≤ 0.75 °F
Entering Air
Mean Wet Bulb
Temperature 3
Evaporator
Entering Water
Temperature 3
Heating,
Heat Recovery T sT
Heating portion: No requirement
Defrost portion: |T − Ttarget| ≤ 2.00 °F
Heating portion: sT ≤ 0.18 °F
Defrost portion: sT ≤ 0.50 °F
Leaving Water
Temperature 3 Heating portion: |T − Ttarget| ≤ 0.50 °F
Defrost portion: no requirement
Heating portion: sT ≤ 0.18 °F
Defrost portion: no requirement
Condenser
Leaving Water
Temperature |T − Ttarget| ≤ 0.50 °F
sT ≤ 0.18 °F Entering Water
Temperature No Requirement
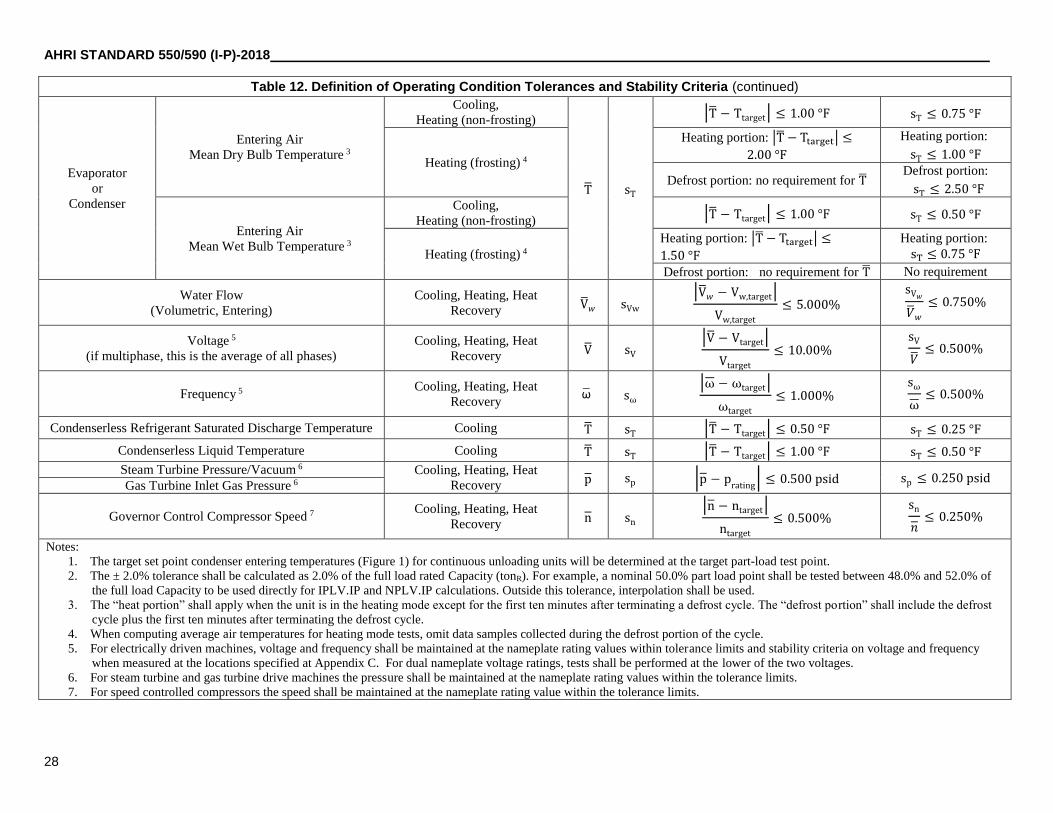
AHRI STANDARD 550/590 (I-P)-2018
28
Table 12. Definition of Operating Condition Tolerances and Stability Criteria (continued)
Evaporator
or
Condenser
Entering Air
Mean Dry Bulb Temperature 3
Cooling,
Heating (non-frosting)
T sT
|T − Ttarget| ≤ 1.00 °F sT ≤ 0.75 °F
Heating (frosting) 4
Heating portion: |T − Ttarget| ≤
2.00 °F
Heating portion:
sT ≤ 1.00 °F
Defrost portion: no requirement for T Defrost portion:
sT ≤ 2.50 °F
Entering Air
Mean Wet Bulb Temperature 3
Cooling,
Heating (non-frosting) |T − Ttarget| ≤ 1.00 °F sT ≤ 0.50 °F
Heating (frosting) 4
Heating portion: |T − Ttarget| ≤
1.50 °F
Heating portion:
sT ≤ 0.75 °F
Defrost portion: no requirement for T No requirement
Water Flow
(Volumetric, Entering)
Cooling, Heating, Heat
Recovery V𝑤 sVw
|V𝑤 − Vw,target|
Vw,target
≤ 5.000%
sV𝑤
��𝑤
≤ 0.750%
Voltage 5
(if multiphase, this is the average of all phases)
Cooling, Heating, Heat
Recovery V sV
|V − Vtarget|
Vtarget
≤ 10.00% sV
��≤ 0.500%
Frequency 5 Cooling, Heating, Heat
Recovery ω sω
|ω − ωtarget|
ωtarget
≤ 1.000% sω
ω≤ 0.500%
Condenserless Refrigerant Saturated Discharge Temperature Cooling T sT |T − Ttarget| ≤ 0.50 °F sT ≤ 0.25 °F
Condenserless Liquid Temperature Cooling T sT |T − Ttarget| ≤ 1.00 °F sT ≤ 0.50 °F
Steam Turbine Pressure/Vacuum 6 Cooling, Heating, Heat
Recovery p sp |p − p
rating| ≤ 0.500 psid sp ≤ 0.250 psid
Gas Turbine Inlet Gas Pressure 6
Governor Control Compressor Speed 7 Cooling, Heating, Heat
Recovery n sn
|n − ntarget|
ntarget
≤ 0.500% sn
��≤ 0.250%
Notes:
1. The target set point condenser entering temperatures (Figure 1) for continuous unloading units will be determined at the target part-load test point.
2. The ± 2.0% tolerance shall be calculated as 2.0% of the full load rated Capacity (tonR). For example, a nominal 50.0% part load point shall be tested between 48.0% and 52.0% of
the full load Capacity to be used directly for IPLV.IP and NPLV.IP calculations. Outside this tolerance, interpolation shall be used.
3. The “heat portion” shall apply when the unit is in the heating mode except for the first ten minutes after terminating a defrost cycle. The “defrost portion” shall include the defrost
cycle plus the first ten minutes after terminating the defrost cycle.
4. When computing average air temperatures for heating mode tests, omit data samples collected during the defrost portion of the cycle.
5. For electrically driven machines, voltage and frequency shall be maintained at the nameplate rating values within tolerance limits and stability criteria on voltage and frequency
when measured at the locations specified at Appendix C. For dual nameplate voltage ratings, tests shall be performed at the lower of the two voltages.
6. For steam turbine and gas turbine drive machines the pressure shall be maintained at the nameplate rating values within the tolerance limits.
7. For speed controlled compressors the speed shall be maintained at the nameplate rating value within the tolerance limits.

AHRI STANDARD 550/590 (I-P)-2018
29
5.6.3 Test Validity Tolerances. Tests shall be conducted while maintaining the following limits. Measurement
values and calculation results shall not deviate more than the validity tolerance limits in Table 13.
Table 13. Definition of Validity Tolerances
Parameter Limits Related Tolerance Equations3
Energy Balance1 |Ebal| ≤ Tol4 × 100% Tol4 = 0.074 − (0.049 ∙ %Load) + (0.105
∆TFL∙%Load) 26
Voltage Balance2 Vbal ≤ 2.000%
Notes:
1. Energy balance where applicable shall be calculated in accordance with Section C3.4.1.
2. Not applicable to single phase units. Voltage unbalance calculated per Section C3.4.2.
3. %Load and Tol4 are in decimal form.
4. ∆TFL = Difference between entering and leaving water temperature at full load for the application, e.g.
evaporator for cooling application.
Figure 5 is a graphical representation of the related tolerance equation for energy balance as noted in Table 13.
Figure 5. Energy Balance Tolerance (Tol4) Curve
5.6.4 Full-load Tolerance Examples. The tolerance limit on full-load Capacity and efficiency shall be determined
from Section 5.6.1.
Full-Load Examples.
5.6.4.1 Full-Load Example in EER.
Rated Full-load Performance:
Rated Capacity= 100.0 tonR
Rated Power = 111.0 kW
Cooling ∆TFL = 10.00ºF
EER =100.0 tonR ∙ K5
111.0 kW ∙ K7= 10.81
Btu
W ∙ h
Tolerance Limit = Tol1 = 0.105 − (0.07 ∙ 1.00) + (0.15
10.00 ∙ 1.00) = 0.05000
Minimum Allowable Capacity(tonR) = (1.00 − 0.05) ∙ 100.0 tonR = 95.00 tonR
0%
2%
4%
6%
8%
10%
12%
0% 10% 20% 30% 40% 50% 60% 70% 80% 90% 100%
To
l 4
Percent Load

AHRI STANDARD 550/590 (I-P)-2018
30
Minimum Allowable EER (Btu
W ∙ h) =
10.81
1.000 + 0.050= 10.30 (
Btu
W ∙ h)
5.6.4.2 Full-load Example in kW/tonR.
Rated Full-load Performance:
Rated Capacity = 100.0 tonR
Rated Power = 70.00 kW
Cooling ∆TFL = 10.00ºF
kW tonR⁄ = 70.00 kW
100.00 tonR
= 0.7000 kW
tonR
Tolerance Limit = Tol1 = 0.105 − (0.07 ∙ 1.00) + (0.15
10.00 ∙ 1.00) = 0.05 = 0.05000
Min. Allowable Capacity = (1.00 − 0.05) ∙ 100.0 tonR = 95.00 tonR
Max. Allowable kW tonR⁄ = (1.00 + 0.05) ∙ 0.7000 kW/tonR = 0.7350 kW/tonR
5.6.4.3 Full-load Example in COP (Heat Pump).
Rated Full-load Performance:
Rated Heating Capacity = 1,500,000 Btu/h
Rated Power = 70.00 kW
Condenser ∆TFL = 10.00ºF
Heating COPH =1,500,000
Btu
h
70 kW ∙ 3,412.14 Btu h⁄ ∙ kW = 6.280
kW
kW
Tolerance Limit = Tol1 = 0.105 − (0.07 ∙ 1.00) + (0.15
10.00 ∙ 1.00) = 0.05 = 0.05000
Min. Allowable Capacity = (1.00 − 0.05) ∙ 1,500,000 Btu h⁄ = 1,425,000 Btu/h
Min. Allowable COPH = 6.280
W
W
1.00 + 0.05= 5.981
W
W
5.6.5 Part-load Tolerance Examples. The tolerance on part-load EER shall be the tolerance as determined from
Section 5.6.1.
5.6.5.1 Part-load Example in EER.
Rated Part-load Performance:
Power at 69.5% Rated Capacity = 59.60 kW
69.5% Rated Capacity = 69.50 tonR
Cooling ∆TFL = 10.00F
EER = 69.50 tonR ∙ 12,000 Btu/(h ∙ tonR)
59.6 kW ∙ 1,000 W/kW= 13.99
Btu
W ∙ h
Tolerance Limit = Tol1 = 0.105 − (0.07 ∙ 0.695) + (0.15
10.00 ∙ 0.695) = 0.07793

AHRI STANDARD 550/590 (I-P)-2018
31
Minimum Allowable EER =13.99
1.00 + 0.07793
Btu
W ∙ h = 12.98
Btu
W ∙ h
5.6.5.2 Part-load Example in kW/tonR.
Rated Part-load Performance:
Power at 50% Rated Capacity = 35.00 kW
50% Rated Capacity = 50.00 tonR
Cooling ∆TFL = 10.00 F
kW/tonR = 35 kW
50 tonR
= 0.7000 kW/tonR
Tolerance Limit = Tol1 = 0.105 − (0.07 ∙ 0.50) + (0.15
10.00 ∙ 0.50) = 0.1000
Maximum Allowable kW/tonR = (1.00 + 0.10) ∙ 0.700 = 0.7700 kW/tonR
5.7 Head Pressure Control. For units that have head pressure control to ensure proper flow of refrigerant through the
expansion valve during low condenser temperature conditions, the head pressure controls shall be enabled and operated in
automatic control mode. The setting shall be set at the factory settings or as defined in the installation instruction.
If during part load testing the head pressure control is engaged by the control logic, then it shall be allowed to control the
operation of the unit, If the unit can be run and stable conditions are obtained as required by Table 12, then a standard test shall
be run. If the head pressure control results in cycling of the condenser fans and unstable conditions as defined in Table 12,
then the following modified test procedure defined in Section 5.7.1 shall be used.
5.7.1 Head Pressure Control Time Average Test Procedure. A series of two tests shall be run. Prior to the first test,
the condenser operating condition, as defined by Table 3, shall be approached from at least a 10 °F higher temperature
until the entering air temperature is within the Operating Condition Tolerance Limits as defined by Table 12. When on
conditions, the test shall be started and measurements shall be taken per the requirements in Section C6.2.1. During the
test, the requirements of Table 12 for Condenser for cooling with fan cycling shall be satisfied. Note that Section C6.2.1
allows for longer test periods with longer time averages for measurements to permit meeting the test validity
requirements in Table 12.
Following the first test completion, the condenser condition shall be reduced at least 5 °F below the desired temperature.
It shall then be gradually increased until the entering air temperature is within the Operating Condition Tolerance Limits
as defined by Table 12. When on conditions, the second test shall be started and measurements shall be taken per the
requirements in Section C6.2.1. During the test, the requirements of Table 12 for Condenser for cooling with fan cycling
shall be satisfied. Note that Section C6.2.1 allows for longer test periods with longer time averages for measurements
to permit meeting the test validity requirements in Table 12.
The test results for both tests shall then be averaged to determine the rated performance for the rating point Capacity and
efficiency.
Section 6. Minimum Data Requirements for Published Ratings
6.1 Minimum Data Requirements for Published Ratings. As a minimum, Published Ratings shall include all Standard
Ratings. Metrics at Standard Rating Conditions shall be per Sections 5.1 and 5.2. Exception: chillers using centrifugal type
compressors shall use application rating conditions per Section 5.3 using the water-side Fouling Factor Allowance as given in
the notes section of Table 1 unless the specified application states that a different Fouling Factor Allowance value shall be
used. Rated Capacity Q100%, tonR, for positive displacement chillers is the net Capacity at full-load AHRI Standard Rating
Conditions per Table 1. Rated Capacity Q100%, tonR, for centrifugal chillers is the net Capacity at full-load AHRI Application
Rating Conditions within the range permitted in Table 2.

AHRI STANDARD 550/590 (I-P)-2018
32
All claims to ratings within the scope of this standard shall include the statement “Rated in accordance with AHRI Standard
550/590 (I-P).” All claims to ratings outside the scope of the standard shall include the statement “Outside the scope of AHRI
Standard 550/590 (I-P).” Wherever Application Ratings are published or printed, they shall include a statement of the
conditions at which the ratings apply.
6.2 Published Ratings. Published Ratings shall be rounded to the number of Significant Figures shown in Table 14, using
the definitions, rounding rules and formats in Section 4.3. Published Ratings and Application Ratings shall state all of the
operating conditions used to establish the ratings and shall include the following.
6.2.1 General.
6.2.1.1 Refrigerant designation in accordance with ANSI/ASHRAE Standard 34
6.2.1.2 Model number designations providing identification of the Water-chilling Packages to which the
ratings shall apply
6.2.1.3 Net Refrigerating Capacity (Equation 7), and/or Net Heating Capacity (Equation 9).
6.2.1.4 Total Input Power to chiller, including all Auxiliary Power.
6.2.1.4.1 Exclude input power to integrated water pumps, when present.
6.2.1.4.2 For electric-drive packages provided with starters, transformers, gearboxes, or
variable speed drives, whether self-contained or remote-mounted (free-standing), the input power
shall include the power losses due to those components.
6.2.1.4.3 For non-electric drive packages, such as turbine or engine drive, the input power shall
include the losses due to the prime mover and other driveline components such as a gearbox.
6.2.1.4.4 When the Water-chilling or Water-heating Package does not include some
components, which are provided by another party independently from the chiller manufacturer, the
input power and any losses associated with those components shall be determined as follows:
For electric-drive packages rated for fixed-speed operation but not including a starter, use the
compressor motor terminal input power when determining the Total Input Power.
For electric-drive packages rated for variable-speed operation but not including a variable speed
drive, assume a variable speed control method and variable speed drive type consistent with the
chiller manufacturer installation requirements, and use the compressor motor terminal input power
when determining the Total Input Power.
When a motor or other non-electric drive is not included with the Water-chilling or Water-heating
Package, assume a speed control method consistent with the chiller manufacturer installation
requirements, and use the compressor shaft input power when determining the Total Input Power.
6.2.1.5 Energy Efficiency, expressed as Energy Efficiency Ratio, Coefficient of Performance, or Power
Input per Capacity, with qualifier to indicate operating mode (Cooling, Heating, Simultaneous Heating and
Cooling, or Heat Recovery).
It is important to note that pump energy associated with Water Pressure Drop through the chiller heat
exchangers is not included in the chiller input power. This is done because any adjustment to the chiller
performance would confuse the overall system analysis for Capacity and efficiency. It is therefore important
for any system analysis to account for the cooling loads associated with the system pump energy and to include
the pump power into the overall equations for system efficiency.
6.2.1.6 Evaporator Fouling Factor, as stated in Table 1 or Table 2

AHRI STANDARD 550/590 (I-P)-2018
33
6.2.1.7 Chilled water entering and leaving temperatures (as stated in Table 1), or leaving water temperature
and temperature difference.
6.2.1.8 Integral Pumps.
6.2.1.8.1 Chillers with an integral pump, Evaporator heat exchanger Water Pressure Drop at
rated water temperatures.
6.2.1.8.2 Chillers without an integral pump, Chilled Water Pressure Drop at rated
water temperatures (customer inlet to customer outlet).
Note: Due to industry typical practice, Water Pressure Drop is often reported in head, ft H2O (at 60ºF);
however, test data is acquired in pressure, psid, for use in calculations.
6.2.1.9 Chilled water flow rate at entering heat exchanger conditions
6.2.1.10 Nominal voltage and frequency for which ratings are valid. For units with a dual nameplate voltage
rating, testing shall be performed at the lower of the two voltages
6.2.1.11 Components that utilize Auxiliary Power shall be listed
6.2.1.12 Part load weighted efficiency metric IPLV.IP/ or NPLV.IP, expressed as Energy Efficiency Ratio,
Coefficient of Performance, or Power Input per Capacity for Cooling operating mode only.
6.2.2 Water-cooled Condenser Packages.
6.2.2.1 Condenser Water Pressure Drop at rated water temperature (inlet to outlet)
6.2.2.2 Condenser water entering and leaving temperatures, as stated in Table 1, or leaving water
temperature and temperature difference.
6.2.2.3 Condenser water flow rate at entering heat exchanger conditions.
6.2.2.4 Condenser Fouling Factor as stated in Table 1 or Table 2
6.2.3 Air-cooled Condenser Packages.
6.2.3.1 Entering air dry-bulb temperature as stated in Table 1
6.2.3.2 Altitude or Atmospheric Pressure (see Note 2 of Table 14) 6.2.3.3 Optional itemization, input power to fan(s) (see Note 5 of Table 14)
6.2.4 Evaporatively-cooled Condenser Packages.
6.2.4.1 Entering air wet-bulb temperature as stated in Table 1 6.2.4.2 Statement of condenser Fouling Factor Allowance on heat exchanger
6.2.4.3 Altitude or Atmospheric Pressure (see Note 2 of Table 14)
6.2.4.4 Optional itemization (see Note 5 of Table 14)
6.2.4.4.1 Input power to fan(s)
6.2.4.4.2 Condenser spray pump power consumption (see Note 5 of Table 14)
6.2.5 Packages without Condenser (for use with Remote Condensers).
6.2.5.1 Compressor Saturated Discharge Temperature (SDT) (refer to definition 3.4) as stated in Table 1
6.2.5.2 Liquid Refrigerant Temperature (LIQ) entering chiller package as stated in Table 1
6.2.5.3 Condenser heat rejection capacity requirements
6.2.6 Heat Recovery Condenser(s).
6.2.6.1 Heat Recovery net Capacity
6.2.6.2 Heat Recovery Water Pressure Drop at rated water temperature (inlet to outlet)
AHRI STANDARD 550/590 (I-P)-2018
34
6.2.6.3 Entering and leaving heat recovery condenser water temperatures as stated in Table 1
6.2.6.4 Heat recovery condenser water flow rate at entering heat exchanger conditions
6.2.6.5 Fouling Factor as stated in Table 1
6.2.7 Water-to-Water Heat Pumps.
6.2.7.1 Net Heating Capacity
6.2.7.2 Condenser Water Pressure Drop at rated water temperature (inlet to outlet) 6.2.7.3 Entering and leaving condenser water temperatures as stated in Table 1
6.2.7.4 Condenser water flow rate at entering heat exchanger conditions
6.2.7.5 Fouling Factor stated in Table 1 or Table 2
6.2.7.6 Any two of the following:
6.2.7.6.1 Entering evaporator water temperature
6.2.7.6.2 Leaving evaporator water temperature
6.2.7.6.3 Water temperature difference through the evaporator
6.2.8 Air-to-Water Heat Pumps.
6.2.8.1 Net Heating Capacity
6.2.8.2 Condenser Water Pressure Drop at rated water temperature (inlet to outlet) 6.2.8.3 Entering and leaving condenser water temperatures as stated in Table 1
6.2.8.4 Condenser water flow rate at entering heat exchanger conditions
6.2.8.5 Fouling Factor as stated in Table 1
6.2.8.6 Entering air dry-bulb temperature as stated in Tables 1 and 2
6.2.8.7 Entering air wet-bulb temperature as stated in Table 1
6.2.8.8 Optional itemization, input power to fan(s) (see Note 5 of Table 14)
6.3 Summary Table of Data to be Published. Table 14 provides a summary of Section 6 items. In case of discrepancy, the
text version shall be followed.

AHRI STANDARD 550/590 (I-P)-2018
35
Table 14. Published Values
Published Values Units
Sig
nif
ican
t
Fig
ure
s 3
Wat
er-C
oo
led
Ch
ille
r (C
oo
lin
g)
Wat
er-C
oo
led
Hea
t
Rec
ov
ery
Ch
ille
r
Ev
apo
rati
vel
y
Co
ole
d C
hil
ler
Air
-Co
ole
d
Ch
ille
r
Co
nd
ense
rles
s
Ch
ille
r
Air
-Co
ole
d H
P
(Co
oli
ng
)
Air
-Co
ole
d H
P
(Hea
tin
g)
Air
Co
ole
d H
eat
Rec
ov
ery
Ch
ille
r
Wat
er t
o W
ater
HP
(Co
oli
ng
)
Wat
er t
o W
ater
HP
(Hea
tin
g)
Sim
ult
aneo
us
Hea
tin
g a
nd
Co
oli
ng
General
Voltage V, kV 3 ■ ■ ■ ■ ■ ■ ■ ■ ■ ■ ■
Frequency Hz 2 ■ ■ ■ ■ ■ ■ ■ ■ ■ ■ ■
Refrigerant Designation - ■ ■ ■ ■ ■ ■ ■ ■ ■ ■ ■
Model Number - ■ ■ ■ ■ ■ ■ ■ ■ ■ ■ ■
Net Capacity
Full Load Refrigerating
Capacity7 tonR, Btu/h 4 ■ ■ ■ ■ ■ ■ ■ ■ ■ ■
Heat Rejection Capacity MBtu/h 4 ■ ■ ■ ■ ■ ■ ■
Heat Recovery Capacity MBtu/h 4 ■ ■
Efficiency
Cooling EER Btu/W∙h 4
■ ■ ■ ■ ■ ■
■ ■ ■ Cooling COP
kW/kW,
W/W 4
Cooling kW/tonR kW/tonR 4
Heating COP kW/kW 4 ■ ■
Simultaneous Heating
and Cooling COP
kW/kW,
W/W 4 ■
Heat Recovery COP kW/kW 4 ■ ■
IPLV.IP/NPLV.IP
Btu/W∙h 4
■ ■ ■ ■ ■ ■ kW/kW 4
kW/tonR 4
Power
Total Input Power kW, W, MW 4 ■ ■ ■ ■ ■ ■ ■ ■ ■ ■ ■
Condenser Spray Pump
Power [optional] kW W, MW Note 5 ■
Fan Power [optional] kW W, MW Note 5 ■ ■ ■ ■ ■
Cooling Mode Evaporator
Entering Water1 ºF Note 4 ■ ■ ■ ■ ■ ■ ■ ■ ■ ■ ■
Leaving Water1 ºF Note 4 ■ ■ ■ ■ ■ ■ ■ ■ ■ ■ ■
Flow gpm 4 ■ ■ ■ ■ ■ ■ ■ ■ ■ ■ ■
Water Pressure Drop ft H2O6, psid 3 ■ ■ ■ ■ ■ ■ ■ ■ ■ ■ ■
Fouling Factor h∙ft2∙ºF/Btu 3 ■ ■ ■ ■ ■ ■ ■ ■ ■ ■ ■
Cooling Mode Heat Rejection Exchanger
Tower Condenser
Entering Water1 ºF Note 4 ■ ■
Leaving Water1 ºF Note 4 ■ ■
Flow gpm 4 ■ ■
Water Pressure Drop ft H2O6, psid 3 ■ ■
Fouling Factor h∙ft2∙ºF/Btu 3 ■ ■

AHRI STANDARD 550/590 (I-P)-2018
36
Table 14. Published Values (continued)
Published Values Units
Sig
nif
ican
t
Fig
ure
s 3
Wat
er-C
oo
led
Ch
ille
r (C
oo
lin
g)
Wat
er-C
oo
led
Hea
t
Rec
ov
ery
Ch
ille
r
Ev
apo
rati
vel
y
Co
ole
d C
hil
ler
Air
-Co
ole
d
Ch
ille
r
Co
nd
ense
rles
s
Ch
ille
r
Air
-Co
ole
d H
P
(Co
oli
ng
)
Air
-Co
ole
d H
P
(Hea
tin
g)
Air
Co
ole
d H
eat
Rec
ov
ery
Ch
ille
r
Wat
er t
o W
ater
HP
(C
ooli
ng
)
Wat
er t
o W
ater
HP
(H
eati
ng
)
Sim
ult
aneo
us
Hea
tin
g a
nd
Co
oli
ng
Heat Recovery Condenser
Entering Water1 ºF Note 4 ■ ■
Leaving Water1 ºF Note 4 ■ ■
Flow gpm 4 ■ ■
Water Pressure Drop ft H2O6, psid 3 ■ ■
Fouling Factor h∙ft2∙ºF/Btu 3 ■ ■
Dry-bulb air ºF Note 4 ■
Heat Rejection Condenser
Entering Water1 ºF Note 4 ■ ■ ■
Leaving Water1 ºF Note 4 ■ ■ ■
Flow gpm 4 ■ ■ ■
Water Pressure Drop ft H2O6, psid 3 ■ ■ ■
Fouling Factor h∙ft2∙ºF/Btu 3 ■ ■ ■
Evaporatively Cooled
Dry-bulb ºF Note 4 ■
Wet-bulb ºF Note 4 ■
Altitude or
Atmospheric Pressure2
ft,
psia Note 2 ■
Air Cooled
Dry-bulb ºF Note 4 ■ ■ ■ ■
Wet-bulb ºF Note 4 ■
Altitude or
Atmospheric Pressure2
ft,
psia Note 2 ■ ■ ■ ■
Without Condenser
Saturated Discharge ºF Note 4 ■
Liquid Temperature or
Subcooling ºF Note 4 ■
Notes:
1. An alternate to providing entering and leaving water temperatures is to provide one of these along with the temperature difference across
the heat exchanger
2. Altitude based on standard atmosphere; refer to Section 5.3.1 and Section 7 for conversion to atmospheric pressure. To provide adequate
Significant Figures for conversion to atmospheric pressure, display altitude as an integer value. If rounding altitude, round to an
increment not exceeding 10 ft. Atmospheric pressure shall be published with four significant digits.
3. Published Ratings and final reported test values shall be rounded to the number of Significant Figures shown in this table.
4. Commonly used units of measure for temperature are not on an absolute scale; however, proper use of Significant Figures requires an
absolute scale. For simplicity, this standard will specify the number of decimal places as follows:
a. Water temperatures round to two decimal places.
b. Refrigerant temperatures (actual or saturated) round to one decimal place.
c. Air temperatures round to one decimal place.
5. When published, auxiliary power values shall be displayed with the same precision as the Total Input Power (same number of decimal
places if using the same unit of measure).
6. ft H2O at 60 °F.
7. Full Load Refrigerating Capacity is the Full Load Net Refrigerating Capacity at the Rating Conditions and shall equal the ‘A’ point
IPLV/NPLV capacity.

AHRI STANDARD 550/590 (I-P)-2018
37
Section 7. Conversions and Calculations
7.1 Conversions. For units that require conversion the following factors in Table 15 shall be utilized:
Table 15. Conversion Factors1, 2
To Convert From Factor Name To Multiply By
1 ft H2O (at 60 ºF) K1 psi 0.43310
inch Hg (at 32 ºF) K2 psia 0.49115
kilowatt (kW) K3 Btu/h 3412.14
watt (W) K4 Btu/h 3.41214
ton of refrigeration (tonR) K5 Btu/h 12,000
ton of refrigeration (tonR) K6 kilowatt (kW) 3.51685
kilowatt (kW) K7 watt (W) 1,000
MBtu/h K8 Btu/h 1,000,000
lbf
in2∙
ft3
lbm
K9 Btu
lbm
0.18505
cubic feet per hour (𝑓𝑡3
ℎ) K10
gallon per
minute (gpm) 0.124675
Notes:
1. For Water Pressure Drop, the conversion from water column “ft H2O” to “psi” is per ASHRAE
Fundamentals Handbook. Note that 60ºF is used as the reference temperature for the density of
water in the manometer.
2. The British thermal unit (Btu) used in this standard is the International Table Btu. The Fifth
International Conference on the Properties of Steam (London, July 1956) defined the calorie
(International Table) as 4.1868 J. Therefore, the exact conversion factor for the Btu (International
Table) is 1.055 055 852 62 kJ.
7.2 Water Side Properties Calculation Methods. One of the following calculation methods shall be utilized. In both cases,
the value of the water temperature or pressure to be used as input is dependent on the context of the calculation using the density
and specific heat terms.
Method 1. Use NIST REFPROP software (version 9.1 or later) to calculate physical properties density and specific
heat, as a function of both pressure and temperature.
Method 2. Use the following polynomial equations to calculate density and specific heat of water as a function of
temperature only.
ρ = (ρ4 · T4) + (ρ3 · T3) + ( ρ2 · T2) + ( ρ1 · T) + ρ0 27
cp = (cp5 · T5) + (cp4 · T4) + (cp3 · T3) + ( cp2 · T2) + ( cp1 · T) + cp0 28
IP (°F)
T 32~212

AHRI STANDARD 550/590 (I-P)-2018
38
IP (lbm/ft³) IP (Btu/lbm·°F)
- cp5 −4.0739 · 10−13
ρ4 −7.4704 · 10−10 cp4 3.1031 · 10−10
ρ3 5.2643 · 10−7 cp3 −9.2501 · 10−8
ρ2 −1.8846 · 10−4 cp2 1.4071 · 10−5
ρ1 1.2164 · 10−2 cp1 −1.0677 · 10−3
ρ0 62.227 cp0 1.0295
Note: Density and specific heat polynomial equations are curve fit from data generated by NIST REFPROP
v9.1 (see Normative Appendix A) at 100 psia and using a temperature range of 32 ºF to 212 ºF. The 100 psia
value used for the water property curve fits was established as a representative value to allow for the
calculation of water side properties as a function of temperature only. This eliminates the complexity of
measuring and calculating water side properties as a function of both temperature and pressure. This
assumption, in conjunction with a formulation for Capacity that does not make explicit use of enthalpy values,
provides a mechanism for computing heat exchanger Capacity for fluids other than pure water where specific
heat data are generally known but enthalpy curves are not available.
7.3 Converting Altitude to Atmospheric Pressure. The relationship is based on the International Standard Atmosphere (ISA)
and represents a mean value of typical weather variations. The ISA is defined by ICAO Document 7488/3. The slight
difference between geometric altitude (ZH) and geopotential altitude (H) is ignored for the purposes of this standard (ZH H).
𝑝𝑎𝑡𝑚 = 𝑝0 ∙ [𝑇0
𝑇0+𝛽1∙(𝑍𝐻−𝑍𝐻0)]
(𝑔0𝛽2
∙𝑀0𝑅∗
)
29
Where:
𝛽1 = −0.00198𝐾
𝑓𝑡
𝛽2 = −0.0065𝐾
𝑚
𝑍𝐻0 = 0𝑓𝑡
𝑔0 = 9.80665 𝑚/𝑠2
𝑀0 = 28.96442 𝑘𝑔/𝑘𝑚𝑜𝑙 𝑅 ∗= 8314.32 𝐽/(𝐾 ∙ 𝑘𝑚𝑜𝑙)
𝑝0 = 14.696 𝑝𝑠𝑖𝑎
𝑇0 = 288.15 𝐾

AHRI STANDARD 550/590 (I-P)-2018
39
Section 8. Symbols and Subscripts
8.1 Symbols and Subscripts. The symbols and subscripts used are as follows:
Table 16. Symbols and Subscripts
Symbol Description Unit Name Unit Symbol
A = Efficiency at 100% load. COP, EER, or kW/tonR depending on use. varies
Aw = Heat transfer surface area used in Fouling Factor adjustment
calculations (water-side), as used in Appendix C. square foot ft2
AQ = Correction factor, Capacity, polynomial equation coefficient dimensionless -
Aη = Correction factor, efficiency, polynomial equation coefficient dimensionless -
B = Efficiency at 75% load. COP, EER, or kW/Ton depending on use. varies
BQ = Correction factor, Capacity, polynomial equation coefficient dimensionless -
Bη = Correction factor, efficiency, polynomial equation coefficient dimensionless -
C = Efficiency at 50% load. COP, EER, or kW/Ton depending on use. varies
c = Y-axis intercept (offset) of the regression line when used in the form
of y=mx+c varies
CD = Degradation factor dimensionless -
CFQ = Atmospheric correction factor for Capacity dimensionless -
CFη = Atmospheric correction factor for efficiency dimensionless -
COPH = Efficiency, coefficient of performance, heating dimensionless -
COPHR = Efficiency, coefficient of performance, heat recovery dimensionless -
COPR = Efficiency, coefficient of performance, cooling dimensionless -
COPR,CD = Efficiency, coefficient of performance, cooling, corrected with
degradation factor dimensionless -
COPR,Test = Efficiency, coefficient of performance, cooling, test value dimensionless -
COPSHC = Efficiency, coefficient of performance, simultaneous cooling &
heating dimensionless -
cp = Specific heat at constant pressure British thermal unit (IT) per pound degree
Fahrenheit Btu/(lb·°F)
CQ = Correction factor, Capacity, polynomial equation coefficient dimensionless -
Cη = Correction factor, efficiency, polynomial equation coefficient dimensionless -
CWH = Cooling water hours degree Fahrenheit hour °F·h
D = Efficiency at 25% load. COP, EER, or kW/Ton depending on use. varies
d = Pipe inside diameter dimension foot ft
DBH = Dry bulb hours degree Fahrenheit hour °F·h
DQ = Correction factor, Capacity, equation term dimensionless -
Dη = Correction factor, efficiency, equation term dimensionless -
e = Base of natural logarithm; Euler's number; a mathematic constant dimensionless -
Ebal = Energy balance dimensionless -
EDB Entering Dry Bulb Temperature degree Fahrenheit °F

AHRI STANDARD 550/590 (I-P)-2018
40
Table 16. Symbols and Subscripts
Symbol Description Unit Name Unit Symbol
EER = Efficiency, energy efficiency ratio Btu per watt hour Btu/(W·h)
EERCD = Efficiency, energy efficiency ratio, corrected with degradation factor Btu per watt hour Btu/(W·h)
EERTest = Efficiency, energy efficiency ratio, test value Btu per watt hour Btu/(W·h)
Ein Energy into a system British thermal unit (IT) per hour Btu/h
Eout Energy out of a system British thermal unit (IT) per hour Btu/h
EWB = Entering wet bulb temperature degree Fahrenheit °F
EWT = Entering Water Temperature degree Fahrenheit °F
f = Darcy friction factor dimensionless -
%FS = Percent of full scale for the measurement instrument or
measurement system dimensionless -
%RDG = Percent of reading for the measurement instrument or measurement
system dimensionless -
g = Standard gravitational term foot per second squared ft/s2
hL = Head loss (pressure drop, pressure differential) foot ft
H = Geopotential altitude (see section 7.3) foot ft
IPLV = Efficiency, Integrated Part Load Value. kW/Ton, COP, or EER varies
IPLV.IP =
Efficiency, Integrated Part Load Value when calculated and reported
in accordance with AHRI Standard 550/590 in IP units. COP, EER,
or kW/Ton
varies
K = Resistance coefficient used in water side pressure drop calculations dimensionless -
K1 – K10 = Refer to Table 15 varies
kW/tonR = Efficiency, power input per Capacity kilowatt per ton of refrigeration kW/tonR
(kW
tonR
)𝐶𝐷
= Efficiency, power input per Capacity, corrected with degradation
factor kilowatt per ton of refrigeration kW/tonR
(kW
tonR
)𝑇𝑒𝑠𝑡
= Efficiency, power input per Capacity, test value kilowatt per ton of refrigeration kW/tonR
LF = Load factor dimensionless -
LH, LW, L1, L2 … Loverall, = Length dimensions (as used in Appendix E) foot ft
%Load = A part-load IPLV.IP or NPLV.IP rating point, i.e. 75%, 50%, or
25% dimensionless -
LWT = Leaving Water Temperature degree Fahrenheit °F
mw = Mass flow rate, water pound (avoirdupois) per hour lb/h
m = Slope of the regression line when used in the form of y=mx+c varies
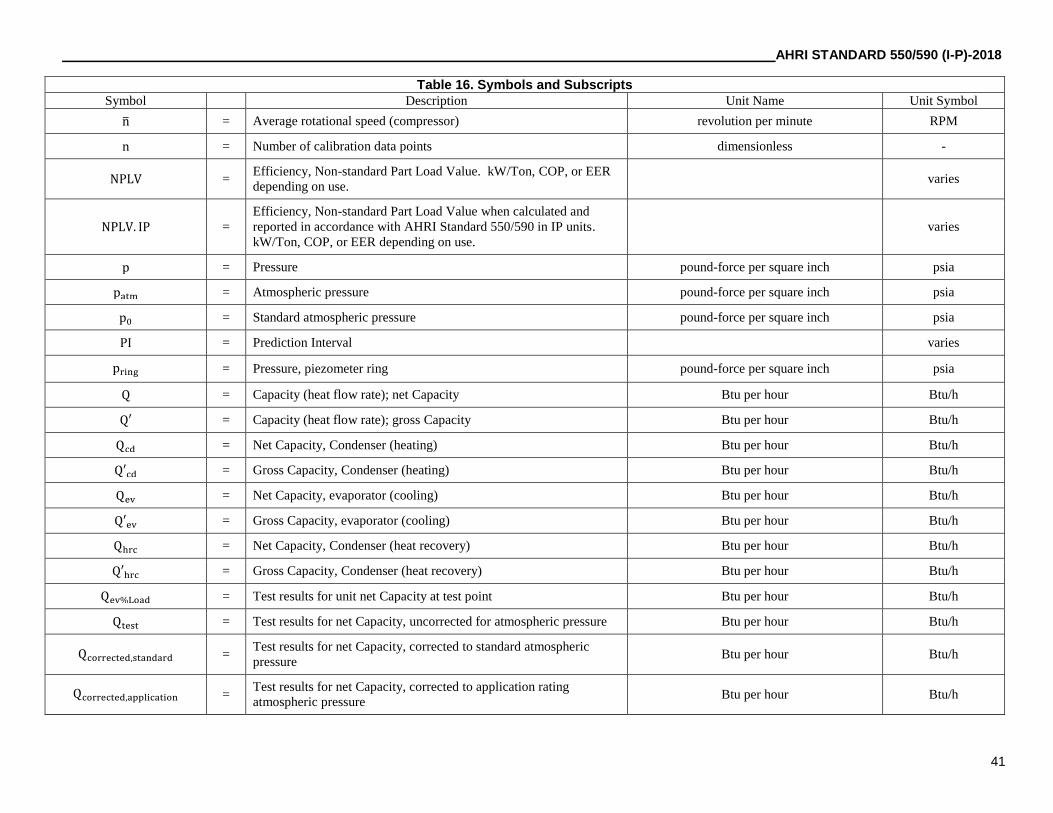
AHRI STANDARD 550/590 (I-P)-2018
41
Table 16. Symbols and Subscripts
Symbol Description Unit Name Unit Symbol
n = Average rotational speed (compressor) revolution per minute RPM
n = Number of calibration data points dimensionless -
NPLV = Efficiency, Non-standard Part Load Value. kW/Ton, COP, or EER
depending on use. varies
NPLV. IP =
Efficiency, Non-standard Part Load Value when calculated and
reported in accordance with AHRI Standard 550/590 in IP units.
kW/Ton, COP, or EER depending on use.
varies
p = Pressure pound-force per square inch psia
patm = Atmospheric pressure pound-force per square inch psia
p0 = Standard atmospheric pressure pound-force per square inch psia
PI = Prediction Interval varies
pring = Pressure, piezometer ring pound-force per square inch psia
Q = Capacity (heat flow rate); net Capacity Btu per hour Btu/h
Q′ = Capacity (heat flow rate); gross Capacity Btu per hour Btu/h
Qcd = Net Capacity, Condenser (heating) Btu per hour Btu/h
Q′cd = Gross Capacity, Condenser (heating) Btu per hour Btu/h
Qev = Net Capacity, evaporator (cooling) Btu per hour Btu/h
Q′ev = Gross Capacity, evaporator (cooling) Btu per hour Btu/h
Qhrc = Net Capacity, Condenser (heat recovery) Btu per hour Btu/h
Q′hrc = Gross Capacity, Condenser (heat recovery) Btu per hour Btu/h
Qev%Load = Test results for unit net Capacity at test point Btu per hour Btu/h
Qtest = Test results for net Capacity, uncorrected for atmospheric pressure Btu per hour Btu/h
Qcorrected,standard = Test results for net Capacity, corrected to standard atmospheric
pressure Btu per hour Btu/h
Qcorrected,application = Test results for net Capacity, corrected to application rating
atmospheric pressure Btu per hour Btu/h

AHRI STANDARD 550/590 (I-P)-2018
42
Table 16. Symbols and Subscripts
Symbol Description Unit Name Unit Symbol
Qev100% = Test results for unit net Capacity at 100% load point Btu per hour Btu/h
Qev%Load = Test results for unit net Capacity at any part load test point Btu per hour Btu/h
Qevmin%Load = The measured or calculated unit net Capacity at the minimum step
of Capacity including atmospheric pressure corrections as applicable Btu per hour Btu/h
r = Radius of the centerline of the elbow foot ft
Re = Reynolds number dimensionless -
Rfoul = Fouling Factor Allowance hour-foot squared-degree Fahrenheit per Btu h·ft2·ºF/Btu
s = Standard deviation of a sample from a population varies
SDT = Saturated Discharge Temperature degree Fahrenheit °F
SSx = Sum of squares of x value differences to the mean varies
sn = Standard deviation of governor speed varies
sp = Standard deviation of turbine pressure varies
sT = Standard deviation of temperature measurement samples varies
sV = Standard deviation of voltage varies
sω = Standard deviation of frequency varies
svw = Standard deviation of volumetric water flow measurement samples varies
sε = standard error of estimate varies
T = Temperature degree Fahrenheit °F
t = Time. Hour, minute, second depending on use. varies
Tin = Entering water temperature degree Fahrenheit °F
Tin,cd = Entering condenser water temperature degree Fahrenheit °F
Tin,DB = Entering dry bulb temperature degree Fahrenheit °F
Tin,w = Temperature, water entering degree Fahrenheit °F
Tin,WB = Entering wet bulb temperature degree Fahrenheit °F
Tliq,r = Liquid Refrigerant Temperature degree Fahrenheit °F

AHRI STANDARD 550/590 (I-P)-2018
43
Table 16. Symbols and Subscripts
Symbol Description Unit Name Unit Symbol
Tol1 = Tolerance 1, performance tolerance limit dimensionless -
Tol2 = Tolerance 2, IPLV and NPLV performance tolerance limit dimensionless -
Tol3 = Tolerance 3, Tolerance on water side pressure drop foot of water ft H2O (at 60 °F)
Tol4 Tolerance 4, energy balance validity tolerance limit dimensionless -
Tout = Leaving water temperature degree Fahrenheit °F
Tout,w = Temperature, water leaving degree Fahrenheit °F
Tsat = Temperature, saturated refrigerant degree Fahrenheit °F
Tsat,disch = Saturated discharge temperature degree Fahrenheit °F
Tsat,disch,AC = Saturated discharge temperature degree Fahrenheit °F
Tsat,disch,EC = Saturated discharge temperature degree Fahrenheit °F
Tsat,disch,WC = Saturated discharge temperature degree Fahrenheit °F
TWB,mean = Mean condenser wet bulb temperature degree Fahrenheit °F
tα/2,n−2 = Critical value of Student’s t distribution, at confidence level α/2 and
degrees of freedom n-2 dimensionless -
Vw = Volumetric flow rate gallon per minute gpm
V = Voltage volt V
v = Velocity foot per second ft/s
W = Power kilowatt kW
Winput = Power, total input power kilowatt kW
Wrefrig = Power, total of compressor work and auxiliary devices transferring
energy into the refrigerant kilowatt kW
Wshaft = Power, mechanical power input to the compressor shaft kilowatt kW
Wgear = Power, friction loss in an external gear box kilowatt kW
Wprime mover = Power, output of prime mover kilowatt kW

AHRI STANDARD 550/590 (I-P)-2018
44
Table 16. Symbols and Subscripts
Symbol Description Unit Name Unit Symbol
x = Variable representing any measurement value (corrected indicated
value) varies
x = Any value of x at which to evaluate the curve fit and prediction
interval varies
x = Mean of all corrected indicated values varies
y = Reference standard value varies
y = Linear regression curve fit of the calibration data evaluated at x varies
Z = Equation term (as used in Appendix C) dimensionless -
ZH = Geometric altitude foot ft
Δpcorrected, Δpadj
= Pressure differential pound force per square inch, or foot of water psid or
ft H2O (at 60 °F)
Δptest = Pressure differential pound force per square inch psid
Δprated = Pressure differential at rated water temperatures (inlet to outlet) pound force per square inch , or foot of
water
psid or ft H2O (at
60 °F)
Δt = Time interval second s
ΔT = Temperature differential degree Fahrenheit °F
ΔTadj = Temperature differential, additional temperature differential due to
fouling degree Fahrenheit °F
ΔTadj,weighted = Weighted temperature adjustment degree Fahrenheit °F
ΔTFL = Temperature differential, at rated full load design conditions degree Fahrenheit °F
ΔTiLMTD = Incremental log mean temperature difference degree Fahrenheit °F
ΔTLMTD = Log mean temperature difference degree Fahrenheit °F
ΔTrange = Temperature differential when referenced to entering and leaving
heat exchanger fluid temperatures degree Fahrenheit °F
ΔTsmall = Temperature differential when calculating LMTD degree Fahrenheit °F
ΔTsmall,clean = Small temperature difference as tested in clean condition degree Fahrenheit °F
ΔTsmall,sp = Small temperature difference as specified degree Fahrenheit °F

AHRI STANDARD 550/590 (I-P)-2018
45
Table 16. Symbols and Subscripts
Symbol Description Unit Name Unit Symbol
ε = Absolute roughness foot ft
η Efficiency (EER) for atmospheric pressure correction. Btu per watt hour Btu/(W·h)
ηtest,100% Efficiency (EER) measured in Full Load test, for atmospheric
pressure correction. Btu per watt hour Btu/(W·h)
ρ = Density pound (avoirdupois) per cubic foot lb/ft3
ω = Frequency (electrical) Hertz Hz

AHRI STANDARD 550/590 (I-P)-2018
46
Section 9. Marking and Nameplate Data
9.1 Marking and Nameplate Data. As a minimum, the nameplate shall display the following:
9.1.1 Manufacturer's name and location
9.1.2 Model number designation providing performance-essential identification
9.1.3 Refrigerant designation (in accordance with ANSI/ASHRAE Standard 34)
9.1.4 Voltage, phase and frequency
9.1.5 Serial number
9.2 Nameplate Voltage. Where applicable, nameplate voltages for 60 Hertz systems shall include one or more of the
equipment nameplate voltage ratings shown in Table 1 of AHRI Standard 110. Where applicable, nameplate voltages for 50
Hertz systems shall include one or more of the utilization voltages shown in Table 1 of IEC Standard 60038.
Section 10. Conformance Conditions
10.1 Conformance. While conformance with this standard is voluntary, conformance shall not be claimed or implied for
products or equipment within the standard’s Purpose (Section 1) and Scope (Section 2) unless such product claims meet all of
the requirements of the standard and all of the testing and rating requirements are measured and reported in complete
compliance with the standard. Any product that has not met all the requirements of the standard cannot reference, state, or
acknowledge the standard in any written, oral, or electronic communication.
Section 11. Operating Requirements
11.1 Operating Requirements. Chillers with air-cooled Condensers and published operability at an entering air dry-bulb
temperature of 125.6 °F shall comply with provisions of this section.
11.1.1 High Temperature Operating Requirements.
11.1.1.1 High Temperature Condition. The chiller shall be capable of an Application Rating at entering air
dry-bulb temperature of 125.6 °F.
11.1.1.2 Operability at High Temperature Condition. The chiller shall be capable of the following when
operating at the above condition and following test requirements of Section 4.1. When all power to the
equipment is momentarily interrupted for a period sufficient to cause the compressor to stop (loss of power not
to exceed 5 seconds), and power is then restored, the unit shall be capable to resume continuous operation
within one hour of restoration of power, and shall be capable to operate continuously without interruption for
one hour thereafter. Operation and resetting of safety devices after power loss but prior to establishment of
continuous operation is permitted to meet this operability requirement. For information only, average cooling
Capacity and input power are reported if conducting a test to demonstrate this capability.

AHRI STANDARD 550/590 (I-P)-2018
47
APPENDIX A. REFERENCES – NORMATIVE A1 Listed here are all standards, handbooks and other publications essential to the formation and implementation of the
standards. All references in this appendix are considered as part of the standard.
A1.1 AHRI Standard 110-2016, Air-Conditioning, Heating and Refrigerating Equipment Nameplate Voltages, 2016,
Air-Conditioning, Heating and Refrigeration Institute, 2311 Wilson Boulevard, Suite 400, Arlington, VA 22201, U.S.A.
A1.2 AHRI Standard 551/591 (SI)-2018, Performance Rating of Water-Chilling and Heat Pump Water-Heating
Packages Using the Vapor Compression Cycle, 2018, Air-Conditioning, Heating and Refrigeration Institute, 2311
Wilson Boulevard, Suite 400, Arlington, VA 22201, U.S.A.
A1.3 ANSI/AHRI/ASHRAE/ISO Standard 13256-2:1998 (RA 2012), Water-to-Water and Brine-to-Water Heat
Pumps – Testing and Rating for Performance, 1998, ASHRAE, 25 West 43rd Street, 4th Fl., New York, NY, 10036,
U.S.A./1791 Tullie Circle, N.E., Atlanta, Georgia, 30329, U.S.A.
A1.4 ANSI/ASHRAE Standard 34-2016 with Addenda, Number Designation and Safety Classification of
Refrigerants, 2016, ASHRAE, 25 West 43rd Street, 4th Fl., New York, NY, 10036, U.S.A./1791 Tullie Circle, N.E.,
Atlanta, Georgia, 30329, U.S.A.
A1.5 ANSI/ASHRAE Standard 41.1-2013, Measurements Guide - Section on Temperature Measurements, 2013,
ASHRAE, 25 West 43rd Street, 4th Fl., New York, NY, 10036, U.S.A./1791 Tullie Circle, N.E., Atlanta, Georgia, 30329,
U.S.A.
A1.6 ASHRAE Fundamentals Handbook, 2017, ASHRAE, 1791 Tullie Circle, N.E., Atlanta, Georgia, 30329,
U.S.A.
A1.7 ASHRAE, Terminology, https://www.ashrae.org/resources--publications/free-resources/ashrae-terminology,
2018, ASHRAE, 1791 Tullie Circle, N.E., Atlanta, GA 30329, U.S.A.
A1.8 ASME Standard MFC-3M-2004 (R2017), Measurement of Fluid Flow in Pipes Using Orifice, Nozzle, and
Venturi,
2004, American Society of Mechanical Engineers. ASME, Three Park Avenue, New York, NY 10016, U.S.A.
A1.9 ASME Standard MFC-6M-2013, Measurement of Fluid Flow in Pipes Using Vortex Flowmeters, 2013,
American Society of Mechanical Engineers. ASME, Three Park Avenue, New York, NY 10016, U.S.A.
A1.10 ASME Standard MFC-11-2006 (R2014), Measurement of Fluid Flow by Means of Coriolis Mass Flowmeters,
2006, American Society of Mechanical Engineers. ASME, Three Park Avenue, New York, NY 10016, U.S.A.
A1.11 ASME Standard MFC-16-2014, Measurement of Liquid Flow in Closed Conduits With Electromagnetic
Flowmeters, 2014, American Society of Mechanical Engineers. ASME, Three Park Avenue, New York, NY 10016,
U.S.A.
A1.12 ASME Standard PTC 19.2-2010 (R2015), Pressure Measurement, Instruments and Apparatus Supplement,
2010, American Society of Mechanical Engineers. ASME, Three Park Avenue, New York, NY 10016, U.S.A.
A1.13 ASME Standard PTC 19.5-2004 (R2013), Flow Measurement, 2004, American Society of Mechanical
Engineers. ASME, Three Park Avenue, New York, NY 10016, U.S.A.
A1.14 Crane Technical Paper Number 410, 2009 Edition.
A1.15 ICAO Document 7488/3-1993, Manual of the ICAO Standard Atmosphere, Third Edition. 1993, International
Civil Aviation Organization, 999 Robert-Bourassa Boulevard, Montréal, Quebec H3C 5H7, Canada.
http://aviadocs.net/icaodocs/Docs/ICAO_Doc7488.pdf.

AHRI STANDARD 550/590 (I-P)-2018
48
A1.16 IEC Standard 60038-2009, IEC Standard Voltages, 2009, International Electrotechnical Commission, rue de
Varembe, P.O. Box 131, 1211 Geneva 20, Switzerland.
A1.17 IEEE 120-1989 (RA2007), Master Test Guide for Electrical Measurements in Power Circuits, 1989,Institute of
Electrical and Electronic Engineers, 445 Hoes Lane, Piscataway, NJ 08854, U.S.A.
A1.18 IEEE C57.13-2016, IEEE Standard Requirements for Instrument Transformers, 2016, Institute of Electrical
and Electronic Engineers, 445 Hoes Lane, Piscataway, NJ 08854, U.S.A.
A1.19 ISA Standard RP31.1-1977, Recommended Practice Specification, Installation, and Calibration of Turbine
Flowmeters, 1977, Instrument Society of America, ISA, 67 Alexander Drive, P.O. Box 12277, Research Triangle Park, NC
27709, U.S.A.
A1.20 NIST. Lemmon, E.W., Huber, M.L., McLinden, M.O. NIST Standard Reference Database 23: Reference Fluid
Thermodynamic and Transport Properties-REFPROP, Version 9.1, National Institute of Standards and Technology,
Standard Reference Data Program, Gaithersburg, 2013.

AHRI STANDARD 550/590 (I-P)-2018
49
APPENDIX B. REFERENCES – INFORMATIVE
B1 Listed here are standards, handbooks and other publications which may provide useful information and background but
are not considered essential. References in this appendix are not considered part of the standard.
B1.1 ANSI/ASHRAE Standard 140-2017, Standard Method of Test for the Evaluation of Building Energy Analysis
Computer Programs, 2017, ASHRAE, 25 West 43rd Street, 4th Fl., New York, NY, 10036, U.S.A./1791 Tullie Circle,
N.E., Atlanta, Georgia, 30329, U.S.A.
B1.2 ANSI/ASHRAE Standard 37-2009, Method of Testing for Ratings Electrically Driven Unitary Air
Conditioning and Heat Pump Equipment, 2009, ASHRAE, 25 West 43rd Street, 4th Fl., New York, NY, 10036,
U.S.A./1791 Tullie Circle, N.E., Atlanta, Georgia, 30329, U.S.A.
B1.3 ANSI/ASHRAE Standard 90.1 (I-P)-2016, Energy Standard for Buildings Except for Low-Rise Residential
Buildings, 2016, ASHRAE, 1791 Tullie Circle, N.E., Atlanta, Georgia, 30329, U.S.A.
B1.4 ASHRAE Technical Report, Develop Design Data of Large Pipe Fittings, 2010, ASHRAE, 1791 Tullie Circle,
N.E., Atlanta, Georgia, 30329, U.S.A
B1.5 ASME Standard PTC 19.1-2013, Test Uncertainty, American Society of Mechanical Engineers. 2013, ASME,
Three Park Avenue, New York, NY 10016, U.S.A.
B1.6 Blake, K.A. “The design of piezometer rings,” Journal of Fluid Mechanics, Volume 78, Part 2, pages 415-428,
1976.
B1.7 Commercial Buildings Characteristics 1992; April 1994, DOE/EIA-0246(92).
B1.8 Excel Spreadsheet for Calibration. Available as download from the AHRI web site
(http://www.ahrinet.org/search+standards.aspx). Air-Conditioning and Refrigeration Institute, 2311 Wilson Boulevard,
Suite 400, Arlington, VA 22201, U.S.A.
B1.9 Excel Spreadsheet for the Computation of the Water Pressure Drop Adjustment Factors per Appendix G.
Available as download from the AHRI web site (http://www.ahrinet.org/search+standards.aspx). Air-Conditioning and
Refrigeration Institute, 2311 Wilson Boulevard, Suite 400, Arlington, VA 22201, U.S.A..
B1.10 ISO/IEC Standard 17025-2017, General Requirements for the Competence of Testing and Calibration
Laboratories, 2017, International Standards Organization. 1 ch. de la Voie-Creuse CP 56, CH-1211 Geneva 20,
Switzerland.
AHRI STANDARD 550/590 (I-P)-2018
50
APPENDIX C. METHOD OF TESTING WATER-CHILLING AND WATER-HEATING PACKAGES USING THE VAPOR
COMPRESSION CYCLE – NORMATIVE
C1 Purpose. This appendix prescribes a method of testing for Water-chilling and Water-heating Packages using the vapor
compression cycle and to verify Capacity and power requirements at a specific set of steady-state conditions.
Testing shall occur at a laboratory site where instrumentation is in place and load stability can be obtained.
Testing shall not be conducted in field installations to the provisions of this standard. Steady-state conditions and requirements
for consistent, reliable measurement are difficult to achieve in field installations.
C2 Definitions. Use definitions in Section 3.
C3 Calculations. This section includes required methods for determining water properties, data processing, performance
calculations (Capacity, power, efficiency, and corrections), test validation metrics, unit of measure conversions, and rules for
rounding numbers.
C3.1 Water Properties. Calculate density and specific heat per equations in Section 7.
C3.2 Data Processing. Data point measurements collected during the duration of the testing period shall be
processed to calculate mean and standard deviation per the following equations. Calculate final performance metrics
(Capacity, Efficiency, Water Pressure Drop) and other test results (Energy Balance, Voltage Balance) from the mean
values of measurement data (this method of test is not intended for transient testing).
C3.2.1 Mean of Data Points.
�� =1
𝑛∑ (𝑥𝑗)𝑛
𝑗=1 C1
C3.2.2 Standard Deviation of Data Points.
𝑠 = √1
𝑛−1∑ (𝑥𝑗 − ��)
2𝑛𝑗=1 C2
C3.3 Performance.
C3.3.1 Capacity. To provide increased accuracy for energy balance calculations, the energy associated with
pressure loss across the heat exchanger is included in the equation for gross Capacity. This formulation closely
approximates the method of calculating heat transfer Capacity based on the change of enthalpy of the water
flowing through the heat exchanger. For the evaporator the pressure term is added to the sensible heat change
in order to include all energy transferred from the water flow to the working fluid of the refrigeration cycle. For
the Condenser, or heat rejection heat exchanger, this term is subtracted. The incorporation of the terms
associated with pressure loss results in a more accurate representation of the energy rate balance on a control
volume surrounding the water flowing through the heat exchanger. Although these pressure influences may
have a near negligible effect at full-load Standard Rating Conditions, they have an increasing effect at part-load
conditions and high water flow rates where the temperature change of water through the heat exchangers is
smaller.
The Gross (Q′ev) and Net (Qev) Refrigerating Capacity of the evaporator, and the Gross (Q′cd) and Net (Qcd)
Heating Capacity of the Condenser or heat recovery Condenser, Btu/h, shall be obtained by the following
equations:
Qev′ = 𝑚𝑊 ∙ [cp ∙ (Tin − Tout) +
K9∙∆pcorrected
ρ] C3

AHRI STANDARD 550/590 (I-P)-2018
51
For Qev, refer to Equation 7.
Qcd′ = 𝑚𝑊 ∙ [cp ∙ (Tout − Tin) −
K9∙∆pcorrected
ρ] C4
Qhrc′ = 𝑚𝑊 ∙ [cp ∙ (Tout − Tin) −
K9∙∆pcorrected
ρ] C5
For Qcd, refer to Equation 9.
For Qhrc, refer to Equation 10.
𝑚𝑊 =V𝑤∙ρ
K10 C6
Where:
1) The values for specific heat of water, and for water density in the term ∆p
ρ, are evaluated at the average of
inlet and outlet temperatures.
2) The value for Water Pressure Drop of the heat exchanger uses the final test result ∆pcorrected after
adjustment per Appendix G and converted to psid units of measure using K1.
3) If measuring volumetric flow rate, convert to mass flow using density ρ required in Section C4.1.3.
4) Capacity using the unit of measure, tonR, to be calculated using conversion factor K5.
For reference, the conversion factor K9 in Section 7 was derived as follows:
K9 = 0.18505 =144 in2
ft2∙
Btu
778.17 ft ∙ lbf
Btu
778.17 ft ∙ lbf
=1 Btu
1055.05585262 J∙
1 J
1 N ∙ m∙
0.3048 m
1 ft∙
4.4482216152605 N
1 lbf
C3.3.2 Power.
C3.3.2.1 For use in efficiency calculations, determine the chiller Total Input Power, by
summation including compressor and all auxiliary power requirements. See Section C4.1.5 for
detailed requirements regarding measurement locations and power values that shall be included.
Winput = ∑ (Wj)nj=1 C7
C3.3.2.2 For use in energy balance calculations, determine the portion of the Total Input Power
that is transferred into the refrigerant circuit and rejected through the Condenser. See Sections
C3.4.1 and C4.5.1 for detailed requirements regarding which power values shall be included.
Wrefrig = ∑ (Wj)nj=1 C8
C3.3.3 Efficiency. Calculate efficiency per equations in Section 5.1.
C3.3.4 Corrections. This section defines fouling factor related adjustments to target temperature values, as
well as corrections to test measurements for water-side pressure drop, and corrections to test results for
atmospheric pressure.
C3.3.4.1 Method for Simulating Fouling Factor Allowance. The calculations in this section
apply to evaporators and Condensers using water, for full load and part load operating conditions.
The resultant fouling factor correction, ΔTadj, is added or subtracted to the target test water
temperature as appropriate to simulate the fouled condition.
∆Trange = |Tout,w − Tin,w| C9

AHRI STANDARD 550/590 (I-P)-2018
52
∆Tsmall = |Tsat,r − Tout,w| C10
Where Tsat,r is the saturated vapor temperature for single component or azeotrope refrigerants, or for
zeotropic refrigerants Tsat is the arithmetic average of the Dew Point and Bubble Point temperatures,
corresponding to refrigerant pressure.
Calculate the log mean temperature difference (ΔTLMTD) for the evaporator and/or Condenser using
the following equation at the Fouling Factor Allowance (Rfoul) specified by the rated performance,
and the corresponding specified small temperature difference, ∆Tsmall,sp.
∆TLMTD = ∆Trange
ln (1+ ∆Trange
∆Tsmall,sp)
C11
Calculate the incremental log mean temperature difference (ΔTILMTD) using the following equation:
∆TILMTD = Rfoul (Q
A𝑤) C12
Where Q is the rated net Capacity and Aw is the water-side heat transfer surface area for the heat
exchanger, which is inside or outside surface area depending on the heat exchanger design.
The water temperature adjustment needed to simulate the additional fouling, ΔTadj, can now be
calculated:
Z = ∆Trange
∆TLMTD−∆TILMTD C13
∆Tsmall,clean = ∆Trange
eZ−1 C14
ΔTadj = ∆Tsmall,sp − ∆Tsmall,clean C15
Where ΔTsmall,sp is the small temperature difference as rated at a specified Fouling Factor Allowance,
and ΔTsmall,clean is the small temperature difference as rated in a clean condition with no fouling.
The calculation of ΔTadj is used for both evaporator and condenser water temperature corrections.
The correcting water temperature difference, ΔTadj, is then added to the condenser entering water
temperature or subtracted from the evaporator leaving water temperature to simulate the additional
Fouling Factor.
C3.3.4.1.1 Special Consideration for Multiple Refrigerant Circuits.
For units that have multiple refrigeration circuits for the evaporator or Condenser, and
the following items are known for each heat exchanger: refrigerant saturation
temperatures, inlet and outlet water temperatures, and water flow rates; an adjustment
temperature ΔTadj,i shall be computed for each heat exchanger and then combined into
a single water temperature adjustment. For series water circuits, the intermediate
water temperatures are calculated when measurement is not practical. For this purpose
a weighted average for the ΔTadj,i values shall be computed as follows:
∆Tadj,weighted = ∑(Qi∙∆Tadj,i)
∑(Qi) C16
Where:
Qi = Heat transfer rate for each heat exchanger
ΔTadj,i= Computed temperature adjustment for each heat exchanger
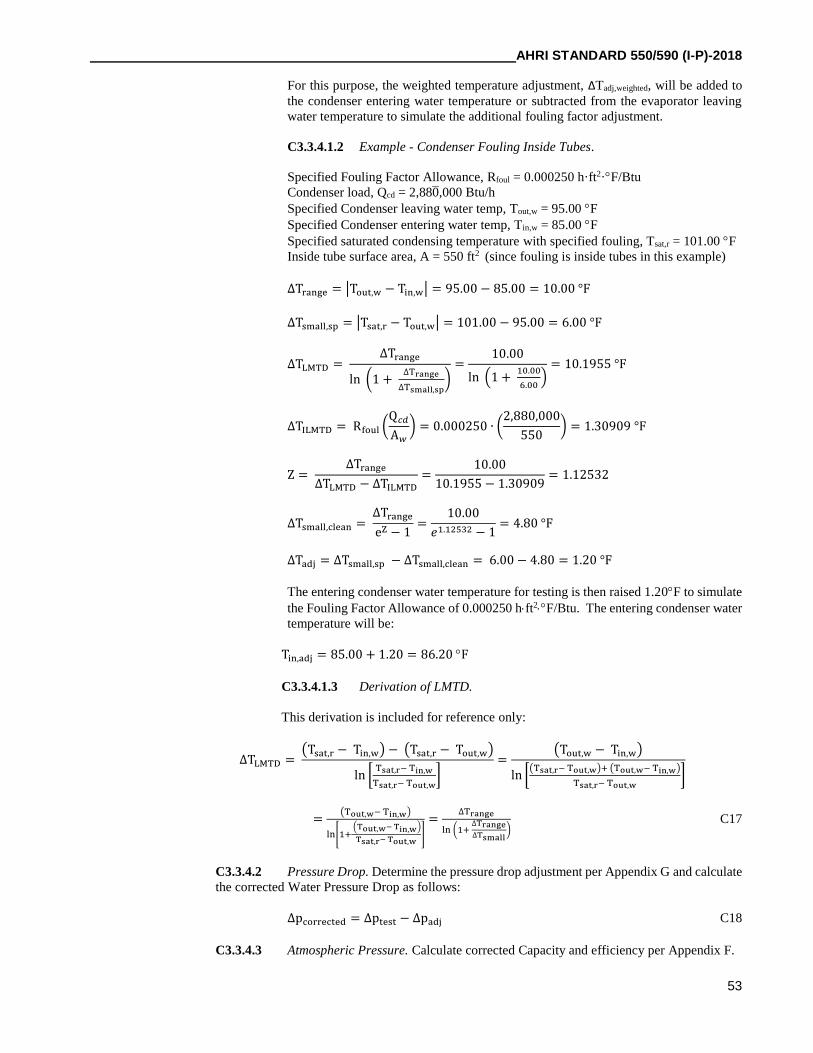
AHRI STANDARD 550/590 (I-P)-2018
53
For this purpose, the weighted temperature adjustment, ΔTadj,weighted, will be added to
the condenser entering water temperature or subtracted from the evaporator leaving
water temperature to simulate the additional fouling factor adjustment.
C3.3.4.1.2 Example - Condenser Fouling Inside Tubes.
Specified Fouling Factor Allowance, Rfoul = 0.000250 h·ft2·F/Btu
Condenser load, Qcd = 2,880,000 Btu/h
Specified Condenser leaving water temp, Tout,w = 95.00 F
Specified Condenser entering water temp, Tin,w = 85.00 F
Specified saturated condensing temperature with specified fouling, Tsat,r = 101.00 F
Inside tube surface area, A = 550 ft2 (since fouling is inside tubes in this example)
∆Trange = |Tout,w − Tin,w| = 95.00 − 85.00 = 10.00 °F
∆Tsmall,sp = |Tsat,r − Tout,w| = 101.00 − 95.00 = 6.00 °F
∆TLMTD = ∆Trange
ln (1 + ∆Trange
∆Tsmall,sp)
=10.00
ln (1 + 10.00
6.00)
= 10.1955 °F
∆TILMTD = Rfoul (Q𝑐𝑑
A𝑤
) = 0.000250 ∙ (2,880,000
550) = 1.30909 °F
Z = ∆Trange
∆TLMTD − ∆TILMTD
=10.00
10.1955 − 1.30909= 1.12532
∆Tsmall,clean = ∆Trange
eZ − 1=
10.00
𝑒1.12532 − 1= 4.80 °F
ΔTadj = ∆Tsmall,sp − ∆Tsmall,clean = 6.00 − 4.80 = 1.20 °F
The entering condenser water temperature for testing is then raised 1.20F to simulate
the Fouling Factor Allowance of 0.000250 hft2F/Btu. The entering condenser water
temperature will be:
Tin,adj = 85.00 + 1.20 = 86.20 F
C3.3.4.1.3 Derivation of LMTD.
This derivation is included for reference only:
∆TLMTD = (Tsat,r − Tin,w) − (Tsat,r − Tout,w)
ln [Tsat,r− Tin,w
Tsat,r− Tout,w]
=(Tout,w − Tin,w)
ln [(Tsat,r− Tout,w)+ (Tout,w− Tin,w)
Tsat,r− Tout,w]
=(Tout,w− Tin,w)
ln[1+ (Tout,w− Tin,w)
Tsat,r− Tout,w]
=∆Trange
ln (1+ ∆Trange
∆Tsmall) C17
C3.3.4.2 Pressure Drop. Determine the pressure drop adjustment per Appendix G and calculate
the corrected Water Pressure Drop as follows:
∆pcorrected = ∆ptest − ∆padj C18
C3.3.4.3 Atmospheric Pressure. Calculate corrected Capacity and efficiency per Appendix F.

AHRI STANDARD 550/590 (I-P)-2018
54
C3.4 Validation. Test results are validated by checking an energy balance and a voltage balance, calculated as
follows.
C3.4.1 Energy Balance. Based on the first law of thermodynamics, or the law of conservation of energy,
an energy balance calculation evaluates all of the measured energy flow into and out of a control volume. If
there is a non-zero difference between energy flow in and energy flow out, greater than the energy balance
measurement uncertainty, then either (a) the system is not at steady state (lack of equilibrium), or (b) some
significant heat gain or heat loss has been omitted from the calculation, or (c) there is a measurement error to
be corrected. The control volume shall include the entire chiller package, especially the refrigerant circuit(s)
that convey thermal energy from a source to a sink (from the evaporator water to the condenser water). In many
cases, heat losses or heat gain caused by radiation, convection, bearing friction, oil coolers, etc., are relatively
small and are either included or excluded without significant affect to the overall energy balance.
Gross Capacity shall be used for energy balance calculations.
Sum all energy sources flowing in and out of the system through the control volume boundary:
Ein = ∑ Einii C19
Eout = ∑ Eoutii C20
The general energy balance equation is expressed as a percentage:
Ebal =Ein−Eout
avg(Ein,Eout)· 100% = 2
Ein−Eout
Ein+Eout· 100% C21
For water-cooled chillers, the total measured input power (Winput) to the chiller package is often assumed to
equal the compressor work done on the refrigerant (Wrefrig). In cases where the difference in the total power and
the compressor work is significant, an analysis that provides a calculated value of Wrefrig shall be performed
and used in the energy balance equation. Cases for different chiller configurations are shown in Sections
C3.4.1.1 through C3.4.1.5.
C3.4.1.1 A typical summation omitting the effect of the small heat losses and gains mentioned
above.
Ein = ∑ Eini
i
= Qev′ + (Wrefrig) · K3
Eout = ∑ Eouti
i
= Qcd′ + Qhrc
′
C3.4.1.2 In a hermetic package, where the motor is cooled by refrigerant, chilled water or
condenser water, the motor cooling load will be included in the measured condenser load, so Wrefrig
shall be assumed to equal Winput as electrical power input to the compressor motor terminals, plus
any significant auxiliary input power transferred to the refrigerant.
C3.4.1.3 In a package using an open-type compressor with prime mover and external gear drive
Wrefrig shall be assumed to equal shaft input power (Wshaft), plus any significant auxiliary input
power transferred to the refrigerant. Wshaft is typically the prime mover output power (Wprime mover)
less the gear losses (Wgear).
The value of prime mover output power Wprime mover shall be determined from the power input to
prime mover using certified efficiency data from the prime mover manufacturer.
The value of Wgear shall be determined from certified gear losses provided by the gear manufacturer.

AHRI STANDARD 550/590 (I-P)-2018
55
C3.4.1.4 In a package using an open-type compressor with prime mover and internal gear Wrefrig
shall be assumed equal to shaft input power (Wshaft), plus any auxiliary input power transferred to
the refrigerant.
For determination of Wshaft for turbine or engine operated machines, the turbine or engine
manufacturer's certified power input/output data shall be used.
C3.4.2 Voltage Balance. Voltage balance is defined as the maximum absolute value of the voltage
deviation from the average voltage, expressed in relative terms as a percentage of the average voltage. For a
three-phase system with three measured voltages the equations are:
Vbal =max[|V1−Vavg|,|V2−Vavg|,|V3−Vavg|]
Vavg× 100% C22
Vavg =(V1+V2+V3)
3 C23
C3.5 Conversions. Calculations and reporting of test results using other units of measure shall use the conversion
factors defined in Section 7.
C3.6 Rounding. Reported measurement data and calculated test results shall follow the rounding requirements in
Section 4.3, making use of the significant figure requirements of Table 14. Energy balance and voltage balance shall be
rounded to four (4) Significant Figures.
C4 Test Requirements. This section defines requirements for instrumentation (accuracy, installation, calibration), test plan,
tolerances when conducting a test, corrections and adjustments to make, and test validation.
C4.1 Instrumentation. This section defines requirements for each type of measurement (temperature, flow, pressure,
power). Instruments shall be selected, installed, operated, and maintained according to the requirements of Table C1.
Further details are provided in this section for each measurement type.

AHRI STANDARD 550/590 (I-P)-2018
56
Table C1. Requirements for Test Instrumentation
Measurement
Measurement
System
Accuracy2,3,4,5
Measurement Resolution6,
7
Selected, Installed, Operated, Maintained in
Accordance With
Liquid
Temperature ±0.20 °F 0.01 °F
ANSI/ASHRAE Standard 41.1
Air Temperature ±0.20 °F 0.1 °F ANSI/ASHRAE Standard 41.1
Liquid Mass
Flow Rate 1 ±1.0% RDG 4 Significant Figures
ASME Power Test Code PTC 19.5
(flow measurement)
ASME MFC-16 (electromagnetic type)
ASME MFC-3M (orifice & venturi type)
ASME MFC-6M (vortex type)
ASME MFC-11 (coriolis type)
ISA Standard RP31.1 (turbine type)
Differential
Pressure ±1.0% RDG 3 Significant Figures
ASME Power Test Code PTC 19.2
Electrical Power 4 Significant Figures IEEE 120
IEEE C57.13
≤ 600V ±1.0% FS,
±2.0% RDG (V, A, kW, Hz)
> 600 V ±1.5% FS,
±2.5% RDG
Atmospheric
Pressure ±0.15 psia 0.01 psia
ASME Power Test Code PTC 19.2
Steam
condensate mass
flow rate
±1.0% RDG 4 Significant Figures
Steam pressure ±1.0% RDG 3 Significant Figures
Fuel volumetric
flow rate ±1.0% RDG 4 Significant Figures
Fuel energy
content - 3 Significant Figures
Gas quality shall be acquired by contacting the local
authority and requesting a gas quality report for
calorific value on the day of the test
Notes:
1. Accuracy requirement also applies to volumetric type meters.
2. Measurement system accuracy shall apply over the range of use during testing, as indicated by the Turn Down Ratio
determined during calibration, i.e. from full scale down to a value of full scale divided by the Turn Down Ratio. For
many types of instruments and/or systems this may require exceeding the accuracy requirement at full scale.
3. %RDG = percent of Reading, %FS = percent of Full Scale for the useable range of the measurement instrument or
measurement system.
4. If dual requirements are shown in the table, FS and RDG, then both requirements shall be met.
5. Current Transformers (CT’s) and Potential Transformers (PT’s) shall have a metering accuracy class of 0.3 or better,
rated in accordance with IEEE C57.13.
6. Measurement resolution shown is the minimum requirement (most coarse resolution allowable). Better (finer)
resolution is acceptable for instrument or panel displays, or computer screen displays. Resolution includes all parts of
the measurement system, such as analog to digital conversion.
7. Significant Figures (also known as significant digits) determined in accordance with Section 4.3.

AHRI STANDARD 550/590 (I-P)-2018
57
C4.1.1 Accuracy and Calibration.
C4.1.1.1 All instruments and measurement systems shall be calibrated over a range that meets
or exceeds the range of test readings. Data acquisition systems shall be either calibrated as a system,
or all individual component calibrations shall be documented in a manner that demonstrates the
measurement system meets the accuracy requirements specified in Table C1. Calibrations shall
include no less than four (4) points compared to a calibration standard. Calibration standards shall
be traceable to NIST or equivalent laboratories that participate in inter-laboratory audits.
Note: It is recommended that standards such as ISO 17025 be used by test facilities to improve
processes for the development and maintenance of instrument systems to achieve desired accuracy
and precision levels.
C4.1.1.2 For each instrument device in a measurement system, the calibration process shall
identify the range over which the required accuracy can be achieved (specified accuracy from Table
C1). This range shall be documented in a readily accessible format for verification (such as a manual
of calibration records, or instrument labeling system, or work instructions for test facility operators).
Many types of instruments have a usable range or Turn Down Ratio of 10:1, though some types are
quite different. Differential pressure type flow meters may be limited to 3:1 range of flow (due to
a differential pressure measurement range of 10:1). Some types of instruments, such as
electromagnetic and coriolis type flow meters, or current transformers with low burden, may be
capable of wider ranges such as 20:1 or more.
To determine the range over which the calibration achieves the required accuracy, a linear regression
analysis is performed on the calibration data. The data is plotted to show the residual errors versus
the calibration reference standard. The standard error of estimate shall be calculated for the
measurement system indicated values (post calibration) versus the calibration reference standard,
then using Equation C24 plot a 95% prediction interval (α=5%) on both sides of the curve fit. The
point(s) at which the prediction interval curve exceeds the required accuracy shall be the limit(s) of
the range. Table C2 and the equations that follow explain the method of calculating the prediction
interval. See example using sample data in Figures C1 and C2, in which the specified accuracy is
±1% of reading, and the useable range is from 100 to 13.4, or Turn Down Ratio of 7.5:1.
All test point readings (i.e. at any percent load, or at any operating test condition) shall be within
the calibration range or Turn Down Ratio for each instrument device measurement. For a given
type of measurement, multiple instruments may be required to cover a wide range of testing
conditions for a given test facility, or a range of Water-Chilling or Water-Heating Package sizes. In
the case of multiple instruments, procedures and protocols shall be established by the test facility
for use by test operators regarding when and how to switch between instruments.
C4.1.1.3 Accuracy of electrical measurements shall include all devices in the measurement
system (i.e. power meter or power analyzer, potential transformers, current transformers, data
acquisition signals). Water-chilling or Water-heating Packages that utilize power-altering
equipment, such as variable frequency drive or inverter, may require appropriate isolation and
precautions to ensure that accurate power measurements are obtained. Chillers that utilize power-
altering equipment may require the use of instrumentation that is capable of accurately measuring
signals containing high frequency and/or high crest factors. In these cases the instrumentation used
shall have adequate bandwidth and/or crest factor specifications to ensure the electrical power input
measurement errors are within the accuracy requirements of Table C1 for the quantity measured.

AHRI STANDARD 550/590 (I-P)-2018
58
Table C2. Prediction Interval to Determine Range of Acceptable Accuracy
Reference
Standard
Value 1
yj
j=1 to n
Corrected
(As Left)
Indicated
Value 2
xj
j=1 to n
Absolute
Prediction
Interval
of Indicated Value
Relative
Prediction
Interval
of Indicated Value
%RDG
Cal
ibra
tio
n D
ata
y1 x1 x1 - y ± PI(x1) 1 1
1
ˆ ( )x y PI x
x
y2 x2 x2 - y ± PI(x2) 1 2
2
ˆ ( )x y PI x
x
y3 x3 x3 - y ± PI(x3) 1 3
3
ˆ ( )x y PI x
x
… … … …
yn xn xn - y ± PI(xn) 1
ˆ ( )n
n
x y PI x
x
Reg
ress
ion
Sta
tist
ics
continuous curve
ˆ ˆ ˆ( )x y PI x
varying x from
min to max
values of xj
continuous curve
ˆ ˆ ˆ( )
ˆ
x y PI x
x
varying x from
min to max
values of xj
�� sε
SSx
Notes:
1. Reference Standard Value is the actual value determined or measured by the calibration standard.
2. Corrected Indicated Value is the value of the measured quantity given directly by a measuring system on the basis of its
calibration curve (“as left” when the calibration process has been completed, not “as found” at the beginning of the
calibration process).
2
, 22
ˆ1ˆ( ) 1
nx
x xPI x s t
n SS
C24
1
1 n
j
j
x xn
C25
2
1
n
x j
j
SS x x
C26
2
1
2
n
j j
j
y mx c
sn
C27
1 1 1
2
2
1 1
n n n
j j j j
j j j
n n
j j
j j
n x y x y
m
n x x
C28

AHRI STANDARD 550/590 (I-P)-2018
59
2
1 1 1 1
2
2
1 1
n n n n
j j j j j
j j j j
n n
j j
j j
x y x x y
c
n x x
C29
ˆ ˆy m x c C30
Figure C1. Sample of Relative Calibration Evaluation Data (Percent of Reading)

AHRI STANDARD 550/590 (I-P)-2018
60
Figure C2. Sample of Absolute Calibration Evaluation Data
C4.1.2 Temperature.
C4.1.2.1 Water. Measure entering and leaving water temperatures, °F. Temperature sensor(s)
shall be installed in a location that represents the average bulk fluid temperature.
Note: Non-mandatory but recommended practices to consider, especially if troubleshooting
problems with energy balance. When deciding where to locate water temperature measurement
sensors, consider the mixing effects of the piping configuration which may vary considerably across
a range of flow rates. Check the spatial variation of temperature across a range of flow rates within
a single plane perpendicular to the pipe, either with a movable (traversing) sensor or with multiple
stationary sensors. If necessary add flow conditioners or mixers.
C4.1.2.1.1 Units with an optional integrated evaporator or condenser water pump
shall be tested in either of the following two configurations.
If the pump is to be operational during the test, the pump shall not be located between
the entering and leaving water temperature measurement locations. In this case the
unit shall be modified to include a temperature measurement station between the pump
and the heat exchanger. Care shall be taken to ensure proper water mixing for an
accurate representation of the bulk fluid temperature.
If the pump is not operational during the test, temperature measurements external to
the unit shall be used. In this case, the water shall flow freely through the pump with
the pump in the off position.
C4.1.2.1.2 If evaporator or condenser water is used to add or remove heat to or from
any other source(s) within the package, the temperature measurements shall be made
at points so that the measurements reflect the Gross Capacity.

AHRI STANDARD 550/590 (I-P)-2018
61
C4.1.2.2 Air. For chillers with either an air-cooled or Evaporatively-cooled Condenser, measure
entering air temperature per Appendix E.
C4.1.3 Flow. Measure water mass flow rate, lbm/hr, or calculate mass flow rate from measured volumetric
flow rate using Equation C6. If a volumetric flow meter was used for the measurement, the conversion to mass
flow shall use the density corresponding to either of the following locations: (1) the temperature of the water at
the location of flow meter; or (2) the water temperature measurement, either entering or leaving, which best
represents the temperature at the flow meter.
C4.1.3.1 If volumetric flow rate is measured on the leaving side, then the target volumetric flow
rate shall be adjusted to match the Published Ratings which are based on the entering side (see
Sections 5.1 and 6.2), in order to have the same target mass flow rate.
C4.1.3.2 If evaporator or condenser water is used to add or remove heat to or from any other
source(s) within the package, the flow measurement(s) shall be made at points so that the
measurements reflect the Gross Capacity.
C4.1.4 Pressure.
Measure Water Pressure Drop across the heat exchanger, psid.
Static pressure taps shall be located per Appendix G. Depending on the design of the chiller water connections,
Appendix G may or may not require additional piping external to the unit for accurate measurements. External
piping for measurement purposes creates additional line losses between the static pressure tap and the unit
connections. These additional losses are calculated and then subtracted from the average test measurement
value as an adjustment method to obtain the reported test result for Water Pressure Drop across the unit
connections. Appendix G specifies the calculation method for adjustment factors.
For units containing an integrated water pump, the measured Water Pressure Drop shall not include the effects
of the pump. For these cases, the pressure drop measurement is to be taken across the heat exchanger only and
will not include the pressure rise associated with the pump that is operational or the pressure drop of a non-
operational pump or other internal components. A single static pressure tap upstream and downstream of the
heat exchanger is acceptable.
C4.1.5 Power. Power is the rate at which work is performed or energy is converted in electrical and
mechanical systems. The Total Input Power including Auxiliary Power shall be measured, by summation of
measurements at one or more locations defined below. Auxiliary Power shall include those devices active
during normal operation of the package; intermittent Auxiliary Power shall be reflected in the data points
defined in Section C6, providing a time-averaged value over the duration of the test time period. For Water-
cooled chillers, it will be necessary in some cases to make separate power measurements to segregate values
and obtain valid energy balance.
Electrical measurements include voltage (for each phase), current (for each phase), power, and frequency (from
a minimum of one phase). For units with a dual nameplate voltage rating, testing shall be performed at the
lower of the two voltages. Electrical power measurements shall be made at appropriate location(s) to accurately
measure the power input at the customer connection point(s) or terminals. The measurement location shall
exclude losses from transformers or other equipment comprising the power supply of the test facility, and shall
minimize losses due to cabling from the measurement location to the connection point on the chiller.
C4.1.5.1 For Air-cooled or Evaporatively-cooled Condensers, the test shall include the
condenser fan power and Condenser spray pump power in the measurement(s) of total input power.
C4.1.5.2 For packages containing optional integrated water pumps, for evaporator or condenser,
the test measurements shall exclude the pump power from the measurement of chiller input power
(refer to Section 6.2.1.4). For units tested with the integral pump turned off, the electrical power
connection from the pump motor shall be physically disconnected from the unit power by means of
a contactor or disconnected wiring.

AHRI STANDARD 550/590 (I-P)-2018
62
C4.1.5.3 Power Measurement Considerations for Energy Balance. Input power that enters the
refrigerant side of the circuit impacts the energy balance calculation. This includes compressor shaft
input power, and other refrigerant-cooled devices such as hermetic or semi-hermetic motors,
variable speed drives, oil coolers, etc. If the energy balance validation criteria cannot be met, one
possible cause is a significant quantity of input power lost to the ambient environment for air-cooled
devices such as open-drive motors, starters, variable speed drives, oil coolers, controls, etc. If this
is the case, then provide separate power measurement locations such that energy balance can be
more accurately determined while also meeting the requirement to measure Total Input Power to
calculate efficiency.
C4.1.5.4 Electric Drive. The input power shall be determined by measurement of electrical
input to the chiller.
C4.1.5.4.1 For electric-drive packages rated with starters, transformers, gearboxes,
or variable speed drives, whether self-contained or remote-mounted (free-standing),
the input power shall include the power losses due to those components and shall be
measured on the input (line side). In the case of remote-mounted (free-standing)
devices, substitute devices may be used during testing provided that they have similar
power losses (within ±0.5%) and speed control method as the device supplied to the
customer.
C4.1.5.4.2 For electric-drive packages not rated with a starter or variable speed
drive (provided by others per Section 6.2.1.4.4), input power shall be measured as
close as practical to the compressor motor terminals. For the case of such packages
rated for variable speed operation, a variable speed control method and variable speed
drive type consistent with the chiller manufacturer installation requirements shall be
used for the test.
C4.1.5.4.3 When testing a chiller package that was rated with a motor supplied by
others, the compressor shaft input power shall be measured by either of the following
two methods:
Torque meter and rotational speed sensor installed between the compressor and
another test motor used conduct the test. Power is calculated from torque multiplied
times speed.
Calibrated test motor with dynamometer or similar test data to determine the
relationship between input and output power at the required load points. Electrical
input power to the test motor is measured, then the corresponding output power
determined from calibration relationship.
C4.1.5.5 Non-electric Drive. Where turbine, engine drive, or other prime mover is employed,
the total input power, and compressor shaft input power for energy balance calculations, shall be
determined from steam or fuel consumption, at measured supply and exhaust conditions and prime
mover manufacturer's certified performance data. The Total Input Power shall include the losses
due to the prime mover and other driveline components such as a gearbox.
C4.2 Plan. A test plan shall document the all requirements for conducting the test. This includes a list of the required
full load and part load test points, the Published Ratings and associated operating conditions, including adjusted water
temperature targets based on the rated Fouling Factor Allowance.
C4.3 Tolerances.
C4.3.1 Operating Conditions. Operating condition tolerances are defined to control two characteristics.
The first is deviation of the mean value relative to the target value. The second is the stability, which is defined
in statistical terms and allows excursions from the target that are brief in time and/or small in magnitude. Over
the time period of each test point, the operating conditions shall be controlled to maintain the mean and standard
deviation within the tolerances defined in Table 12.

AHRI STANDARD 550/590 (I-P)-2018
63
C4.3.2 Performance. Performance tolerances are used when testing to validate Published Ratings in
accordance with Section 4.1, and are applicable to full load Capacity, and also applicable to efficiency and
Water Pressure Drop at both full and part load. The performance test results shall meet the tolerances defined
in Table 11.
C4.4 Corrections. The following corrections shall be applied to test targets or test results when applicable.
C4.4.1 Fouling Factor. Target water temperatures shall be adjusted per the calculation method of Section
C3.3.4.1, to simulate the effect of fouling at the Fouling Factor Allowance (Rfoul,sp.) that was specified in the
published rating. Testing shall be conducted with clean tubes (see Sections 5.5.1 and C6.1.1) and shall assume
Fouling Factors to be zero (Rfoul = 0.000 hft2F/Btu).
C4.4.2 Pressure Drop. To account for measurement methods, the measured values of Water Pressure Drop
during testing shall be corrected per the methods defined in Section C3.3.4.2 and Appendix G prior to reporting
the final test result for Water Pressure Drop.
C4.4.3 Atmospheric Pressure. For comparison to Published Ratings, whether at Standard Rating Conditions
or application rating conditions, units with air-cooled or evaporatively-cooled condenser type shall correct
Capacity and efficiency test results as defined in Appendix F such that the reported test results correspond to
the standard atmospheric pressure.
C4.5 Validation.
C4.5.1 Energy Balance.
For the case of Water-cooled Condensers, measurement data shall be collected to calculate an energy balance
(per Section C3.4.1) to substantiate the validity of each test point. Test validity tolerance for energy balance is
found in Table 13. The energy balance (%) shall be within the allowable tolerance calculated per Section 5.6
for the applicable conditions.
For Air-cooled and Evaporatively-cooled Condensers, it is impractical to measure heat rejection in a test and
an energy balance cannot be readily calculated. To validate test accuracy, concurrent redundant instrumentation
method per Section C4.5.2 shall be used to measure water temperatures, flow rates, and power inputs.
For heat recovery units with Air-cooled Condensers or Water-cooled Condensers, where the Capacity is not
sufficient to fully condense the refrigerant, the concurrent redundant instrumentation methods in Section C4.5.2
shall be used.
For heat recovery units with Water-cooled Condensers that fully condense the refrigerant, the energy balance
method shall be used.
If evaporator water is used to remove heat from any other source(s) within the package, the temperature,
pressure drop, and flow measurements of chilled water shall be made at points so that the measurements reflect
the Gross Refrigerating Capacity.
If condenser water is used to cool the compressor motor or for some other incidental function within the
package, the temperature, pressure drop, and flow measurements of condenser water shall be made at points
such that the measurements reflect the Gross Heating Capacity.
C4.5.2 Concurrent Redundant Instrumentation.
For the case of Air-cooled or Evaporatively-cooled Condensers, or Air-source Evaporators for Heating Mode,
redundant measurement data shall be collected to substantiate the validity of each test point.
AHRI STANDARD 550/590 (I-P)-2018
64
C4.5.2.1 Measurement Verification: Redundant instrument measurements shall be within the
limitations below:
C4.5.2.1.1 Entering water temperature measurements shall not differ by more
than 0.20°F
C4.5.2.1.2 Leaving water temperature measurements shall not differ by more
than 0.20°F
C4.5.2.1.3 Flow measurements shall not differ by more than 2%
C4.5.2.1.4 Power input measurements shall not differ by more than 2%
C4.5.2.1.5 Average voltage shall not differ by more than 2%
C4.5.2.2 Capacity Calculation Method. For Capacity calculations use the average of the
entering water temperature measurements, the average of the leaving water temperature
measurements and the average of the flow measurements. For efficiency calculations use the
average of the power measurements.
C4.5.2.3 Operating Condition Tolerance and Stability Criteria. For applying the operating
condition tolerances of Table 12, calculate the average of the two redundant measurements from the
sample mean of each measurement as shown in Equation C31:
�� =(��)1+(��)2
2 C31
For applying the stability criteria of Table 12, calculate the standard deviation as the root sum square
from sample standard deviation of each measurement as shown in Equation C32:
𝑠𝑥 = √(𝑠𝑥1)2+(𝑠𝑥2)2
2 C32
C4.5.2.4 Example Calculation for Capacity with Concurrent Redundant Verification.
Tin,1 = 54.10 °F, Tin,2 = 53.91 °F (difference of 0.19°F is acceptable)
Tout,1 = 44.10 °F, Tout,2 = 43.90 °F (difference 0.20°F is acceptable)
mw,1 = 101020 lbm/h, mw,2 = 99080 lbm/h (difference of 1.94% is acceptable)
Tin,avg = 54.005 °F
Tout,avg = 44.000 °F
mw,avg = 100050 lbm/h
Properties of water are calculated per Section 7.2 as follows:
cp = 1.0018 Btu/lbm·°F
using an average entering and leaving temperature of (54.005+44.000)/2=49.0025 °F
Net Refrigeration Capacity:
Qev = 100050 lbm/h · 1.0018 Btu/lbm·°F · (54.005 °F – 44.000 °F)
Qev = 83.62 tonR
C4.5.2.5 Example Calculation for Voltage with Concurrent Redundant Verification
V1,a = 466 V, V1,b = 469 V
V2,a = 468 V, V2,b = 470 V
V3,a = 466 V, V3,b = 469 V

AHRI STANDARD 550/590 (I-P)-2018
65
Va,avg = 467 V, Vb,avg = 469 V (difference of 0.43% is acceptable)
Vavg = 468 V
C4.5.3 Voltage Balance. Multi-phase power supply with significant voltage unbalance can impact
equipment operation and efficiency. Calculate voltage balance per Section C3.4.2. Test validity tolerance is
found in Table 13. Voltage balance is not applicable to single phase units.
C4.6 Uncertainty Analysis. This standard does not require an uncertainty analysis for measurements and test
results. It is recommended practice to perform uncertainty analysis following the procedures in ASME PTC 19.1.
C5 Data Collection.
C5.1 Primary Data. Table C3 summarizes the data to be recorded during the test for each of the data point samples.

AHRI STANDARD 550/590 (I-P)-2018
66
Table C3. Data to be Recorded During the Test
Type Data Item Units of Measure
All Condenser Types General Time of day for each data point within a test point hh:mm:ss.s
Atmospheric pressure psia
Evaporator Tin °F
Tout °F
mw or Vw lb/h or gpm
Δptest psid
Water-cooled Condenser Condenser Tin °F
Water-cooled Heat Recovery
Condenser
Tout °F
mw or Vw lb/h or gpm
Δptest psid
Air-cooled Condenser Condenser Spatial average dry-bulb temperature of entering
air °F
Evaporatively-cooled Condenser Condenser Spatial average dry-bulb temperature of entering
air
°F
Spatial average wet-bulb temperature of entering
air
°F
Without Condenser Compressor Discharge temperature °F
Discharge pressure psia
Liquid Line Liquid refrigerant temperature entering the
expansion device
°F
Liquid pressure entering the expansion device psia
Electric Drive Chiller Winput (and Wrefrig if needed) kW
Voltage for each phase V
If 3-phase: average voltage V
Frequency for one phase Hz
Non-Electric Drive Chiller Winput (and Wrefrig if needed) kW
If Steam Turbine:
Steam consumption
Steam supply pressure
Steam supply temperature
Steam exhaust pressure
lb/h
psig
ºF
psia
If Gas Turbine or Gas Engine:
fuel consumption (natural gas or propane)
Higher Heating Value
ft³/h
Btu/ ft³
If Internal Combustion Engine:
liquid fuel consumption (diesel or gasoline)
Higher Heating Value
gal/h
Btu/lb
C5.2 Auxiliary Data. Table C4 summarizes the auxiliary data that shall be recorded for the test.
Table C4. Auxiliary Data to be Recorded
Type Data Item Units of Measure
All Date, place, and time of test dd-mmm-yyyy
hh:mm:ss
Names of test supervisor and witnessing personnel -
Ambient temperature at test site °F
Nameplate data including make, model, size, serial number and refrigerant
designation number, sufficient to completely identify the water chiller. Unit
voltage and frequency shall be recorded.
-
Prime mover nameplate data (motor, engine or turbine). -
Non-electric Drive Fuel specification (if applicable) and calorific value -

AHRI STANDARD 550/590 (I-P)-2018
67
Table C5 summarizes optional auxiliary data (non-mandatory) that may be recorded during the test for diagnostic
information.
Table C5. Optional Auxiliary Data to be Recorded
Type Data Item Units of Measure
Open-type compressor Compressor driver rotational speed rpm
Electric Drive Current for each phase of electrical input to chiller package amp
C6 Test Procedures. For each test point at a specific load and set of operating conditions, the test will measure Capacity,
input power, and water-side pressure drop. Capacity, a measurement of the heat added to or removed from the water as it
passes through the heat exchanger (cooling, heating, heat recovery, and/or heat recovery according to the test plan). Net
Capacity is always required, and gross Capacity is required when an energy balance requirement applies. Each test point will
collect multiple data points versus time. The test shall use instrumentation meeting the requirements in Section C4 and
calculations in Section C3.
C6.1 Setup. The chiller package to be tested shall be setup at the test facility in accordance with the manufacturer’s
instructions, including but not limited to support of installation mounting points, connections for water, connections for
power supply, test instrumentation, charging of refrigerant or oil, etc. Non-condensable gases if present shall be removed
from the system.
C6.1.1 Condition of Heat Transfer Surfaces. The as tested Fouling Factors shall be assumed to be zero
(Rfoul = 0.000 hft2F/Btu). Tests conducted in accordance with this standard may require cleaning of the heat
transfer surfaces (in accordance with manufacturer's instructions) prior to conducting the test.
C6.2 Operation. After setup is complete, the chiller will be started and operated to attain the target conditions of the
test point per the test plan. The chiller is not required to operate continuously between different test points, shut down
and re-start between test points is allowable.
C6.2.1 General.
Steady-state operating conditions and performance shall be maintained for a minimum test time period of 15
minutes, such that measurement parameters, associated standard deviations, and test results are within both the
operating condition tolerances and test tolerances set forth in Section 5.6. If not within tolerance due to lack of
stability, then continue testing until within tolerance. If not within tolerance but stability is acceptable, then
stop testing to investigate and resolve instrumentation problems, then repeat the test. Resolving problems may
require new calibration of instrumentation, or adjustment of the time averaging of data samples used to create
data points.
To minimize the effects of transient conditions, all measurement types should be taken as simultaneously as
possible (flow, temperature, power, etc.). Software or other recording methods shall be used to capture time-
stamped data points over the duration of the test time period. A minimum of 30 data point measurements shall
be collected and recorded for each parameter at uniform time intervals. Intervals between time stamps shall
not vary more than ±5% from the average time interval for all data points. Each data point measurement shall
represent either an individual reading from the measurement system, or a time averaged value from a larger
number of data samples. In the case of using time averaging, whether in hardware or software, the time interval
for averaging of data samples shall not exceed 1/60 of the total test time period. There is no limit on sampling
rate and various time averaging methods may be employed. See Informative Appendix I for examples on the
use of permissible averaging methods.
Measurement values include temperatures, flow rates, differential pressure, power, voltage, fuel or steam
consumption, and atmospheric pressure. Calculate the average and standard deviation for each measurement
value.
Test results include Net Capacity, Efficiency, and Water Pressure Drop (corresponding to certification program
published rating values). Calculate test results using the mean of the test measurement values. Capacity may
be calculated for each data point for purposes of test facility control, but the final result for Capacity shall be
calculated from the mean of all measurement values.

AHRI STANDARD 550/590 (I-P)-2018
68
C6.2.2 Heat Pump. Heating mode or heat recovery tests of chillers with Air-cooled or Evaporatively-cooled
Condensers shall use the test procedure in Appendix H.
C6.3 Adjustments.
C6.3.1 Controls. Manual operation of chiller controls is allowed to avoid cycling and disruption of test
stability.
C6.3.1 Refrigerant. Refrigerant charge may be adjusted during setup, prior to conducting the test, in
accordance with manufacturer’s instructions which may require operation of the chiller. Refrigerant charge
quantity shall be held constant for the duration of the test, including all test points in a series of full load and
part load tests.
C7 Reporting of Results. A written or electronic test report shall be generated including the following items for each test
point at a specific load and set of operating conditions.
C7.1 Data. For each test point, at a specific load and set of operating conditions report the test time period and
number of data point measurements. Include the mean and standard deviation for each measurement value (temperature,
flow, pressure drop, power, etc.). Data point measurements shall be made available upon request.
C7.2 Calculations. Report the correction adjustment values Δpadj and ΔTadj, correction factors CFQ and CFη when
applicable, and associated input data used for the correction calculations. Report the density, specific heat Capacity,
and mass flow values used for capacity calculations. Report all values of Q used in energy balance calculations.
C7.3 Results. Report the following test results.
Table C6. Results to be Reported
Item Units of Measure
Net Capacity (heating and/or cooling as applicable;
corrected if applicable)
tonR or Btu/h
Gross Capacity (heating and cooling, only for water-
cooled condenser type)
tonR or Btu/h
Power Input (Winput; and Wrefrig as applicable) kW or W
Efficiency (corrected if applicable) kW/tonR, EER, or COP
Δpcorrected ft H2O (at 60 °F)
Energy Balance (if applicable) %
Voltage Balance %
AHRI STANDARD 550/590 (I-P)-2018
69
APPENDIX D. DERIVATION OF INTEGRATED PART-LOAD VALUE (IPLV.IP) – INFORMATIVE
D1 Purpose. This appendix is an informative appendix that has been included in the standard to document the derivation
of the Integrated Part-Load Value (IPLV.IP) weighting factors and temperatures.
D2 Background. Prior to the publication of ANSI/ASHRAE Standard 90.1-1989 which included an AHRI proposal for
IPLV.IP, the Standard Rating Condition, design efficiency (full-load/design ambient), was the only widely accepted metric
used to compare relative chiller efficiencies. A single chiller’s design rating condition represents the performance at the
simultaneous occurrence of both full-load and design ambient conditions which typically are the ASHRAE 1% weather
conditions. The design efficiency contains no information representative of the chiller’s operating efficiency at any off-design
condition (part-load, reduced ambient).
The IPLV.IP metric was developed to create a numerical rating of a single chiller as simulated by 4 distinct operating
conditions, established by taking into account blended climate data to incorporate various load and ambient operating
conditions. The intent was to create a metric of part-load/reduced ambient efficiency that, in addition to the design rating, can
provide a useful means for regulatory bodies to specify minimum chiller efficiency levels and for engineering firms to compare
chillers of like technology. The IPLV.IP value was not intended to be used to predict the annualized energy consumption of a
chiller in any specific application or operating conditions.
There are many issues to consider when estimating the efficiency of chillers in actual use. Neither IPLV.IP nor design rating
metrics on their own can predict a building’s energy use. Additionally, chiller efficiency is only a single component of many
which contribute to the total energy consumption of a chiller plant. It is for this reason that AHRI recommends the use of
building energy analysis programs, compliant with ANSI/ASHRAE Standard 140, that are capable of modeling not only the
building construction and weather data but also reflect how the building and chiller plant operate. In this way the building
designer and operator will better understand the contributions that the chiller and other chiller plant components make to the
total chiller plant energy use. Modeling software can also be a useful tool for evaluating different operating sequences for the
purpose of obtaining the lowest possible energy usage of the entire chiller plant. To use these tools, a complete operating
model of the chiller, over the intended load and operating conditions, should be used.
In summary, it is best to use a comprehensive analysis that reflects the actual weather data, building load characteristics,
operational hours, economizer capabilities and energy drawn by auxiliaries such as pumps and cooling towers, when calculating
the chiller and system efficiency. The intended use of the IPLV.IP (NPLV.IP) rating is to compare the performance of similar
technologies, enabling a side-by-side relative comparison, and to provide a second certifiable rating point that can be referenced
by energy codes. A single metric, such as design efficiency or IPLV.IP shall not be used to quantify energy savings.
D3 Equation and Definition of Terms.
D3.1 The energy efficiency of a chiller is commonly expressed in one of the three following ratios.
D3.1.1 Coefficient of Performance, COPR
D3.1.2 Energy Efficiency Ratio, EER for cooling only
D3.1.3 Total Input Power per Capacity, kW/tonR
These three alternative ratios are related as follows:
COPR = 0.293071 EER, EER = 3.41214 COPR
kW/tonR= 12/EER, EER = 12/(kW/tonR)
kW/tonR= 3.51685/COPR COPR = 3.51685/(kW/tonR)
The following equation is used when an efficiency is expressed as EER [Btu/(Wh)] or COPR [W/W]:
IPLV.IP = 0.01A + 0.42B + 0.45C + 0.12D D1

AHRI STANDARD 550/590 (I-P)-2018
70
Where, at operating conditions per Tables D-1 and D-3:
A = EER or COPR at 100% Capacity
B = EER or COPR at 75% Capacity
C = EER or COPR at 50% Capacity
D = EER or COPR at 25% Capacity
The following equation is used when the efficiency is expressed in Total Input Power per Capacity, kW/tonR:
IPLV. IP = 1
0.01
A +
0.42
B +
0.45
C +
0.12
D
D2
Where, at operating conditions per Tables D-1 and D-3:
A = kW/tonR at 100% Capacity
B = kW/tonR at 75% Capacity
C = kW/tonR at 50% Capacity
D = kW/tonR at 25% Capacity
The IPLV.IP or NPLV.IP rating requires that the unit efficiency be determined at 100%, 75%, 50% and 25% at the
conditions as specified in Table 3. If the unit, due to its capacity control logic cannot be operated at 75%, 50%, or 25%
Capacity then the unit can be operated at other load points and the 75%, 50%, or 25% capacity efficiencies should be
determined by plotting the efficiency versus the % load using straight line segments to connect the actual performance
points. The 75%, 50%, or 25% load efficiencies can then be determined from the curve. Extrapolation of data shall not
be used. An actual chiller capacity point equal to or less than the required rating point shall be used to plot the data. For
example, if the minimum actual Capacity is 33% then the curve can be used to determine the 50% capacity point, but
not the 25% capacity point.
If a unit cannot be unloaded to the 25%, 50%, or 75% capacity point, then the unit should be run at the minimum step
of unloading at the condenser entering water or air temperature based on Table D3 for the 25%, 50% or 75% capacity
points as required. The efficiency shall then be determined by using the following equation:
𝐸𝐸𝑅𝐶𝐷 = EERTest
CD D3
Where CD is a degradation factor to account for cycling of the compressor for capacities less than the minimum step of
Capacity. CD should be calculated using the following equation:
CD = (0.13 ∙ LF) + 1.13 D4
The load factor LF should be calculated using the following equation:
LF = %Load∙(Full Load unit capacity)
(Part−Load unit Capacity) D5
Where:
%Load is the standard rating point i.e. 75%, 50% and 25%.
Part-Load unit Capacity is the measured or calculated unit Capacity from which standard rating points are
determined using the method above.
D3.2 Equation Constants. The constants 0.01, 0.42, 0.45 and 0.12 (refer to Equations D1 and D2) are based on the
weighted average of the most common building types, and operating hours, using average USA weather data. To reduce
the number of data points, the ASHRAE based bin data was reduced to a design bin and three bin groupings as illustrated
in Figure D1.

AHRI STANDARD 550/590 (I-P)-2018
71
D3.3 Equation Derivation. The ASHRAE Temperature Bin Method was used to create four separate
NPLV.IP/IPLV.IP formulas to represent the following building operation categories:
Group 1 - 24 hrs/day, 7 days/wk, 0F and above
Group 2 - 24 hrs/day, 7 days/wk, 55F and above
Group 3 - 12 hrs/day, 5 days/wk, 0F and above
Group 4 - 12 hrs/day, 5 days/wk, 55F and above
0
100
200
300
400
500
600
97.5 82.5 67.5 52.5 37.5 22.5 7.5
Outdoor Air Temperature, DB, F
A B C D
Ton
-Ho
urs
Figure D1. TonR-Hour Distribution Categories
The following assumptions were used:
D3.3.1 Modified ASHRAE Temperature Bin Method for energy calculations was used.
D3.3.2 Weather data was a weighted average of 29 cities across the U.S.A, specifically targeted because
they represented areas where 80% of all chiller sales occurred over a 25 year period (1967-1992).
D3.3.3 Building types were a weighted average of all types (with chiller plants only) based on a DOE study
of buildings in 1992 [DOE/EIA-0246(92)].
D3.3.4 Operational hours were a weighted average of various operations (with chiller plants only) taken
from the DOE study of 1992 and a BOMA study (1995 BEE Report).
D3.3.5 A weighted average of buildings (with chiller plants only) with and without some form of
economizer, based upon data from the DOE and BOMA reports, was included.
D3.3.6 The bulk of the load profile used in the last derivation of the equation was again used, which
assumed that 38% of the buildings’ load was average internal load (average of occupied vs. unoccupied internal
load). It varies linearly with outdoor ambient and mean Condenser wet-bulb (MCWB) down to 50 F DB, then
flattens out below that to a minimum of 20% load.
D3.3.7 Point A was predetermined to be the design point of 100% load and 85F ECWT/95 F EDB for
IPLV.IP/NPLV.IP. Other points were determined by distributional analysis of tonR-hours, MCWBs and EDBs.
ECWTs were based upon actual MCWBs plus an 8 F tower approach.
The individual equations that represent each operational type were then averaged in accordance with weightings
obtained from the DOE and BOMA studies.
The load line was combined with the weather data hours (Figure D2) to create tonR-hours (Figure D3) for the
temperature bin distributions. See graphs below:

AHRI STANDARD 550/590 (I-P)-2018
72
0%
20%
40%
60%
80%
100%
97.5 77.5 57.5 37.5 17.5
Loadline
Outdoor Air Temperature, DB, F
% To
ns
0
200
400
600
800
1000
97.5 77.5 57.5 37.5 17.5
Average Weather Hours
Ho
urs
Outdoor Air Temperature, DB, F
Figure D2. Bin Groupings –TonR Hours
A more detailed derivation of the Group 1 equation is presented here to illustrate the method. Groups 2, 3,
and 4 are done similarly, but not shown here. In the chart below, note that the categories are distributed as
follows:
0
100
200
300
400
500
600
97.5 82.5 67.5 52.5 37.5 22.5 7.5
Outdoor Air Temperature, DB, F
A B C D
Ton
-Ho
urs
Figure D3. Group 1 TonR-Hour Distribution Categories
Point A = 1 bin for Design Bin
Point B = 4 bins for Peak Bin
Point C = 4 bins for Low Bin
Point D = all bins below 55 F for Min Bin
See Table D1 for Air Cooled and Table D2 for water-cooled calculations. The result is average
weightings, ECWT’s (or EDB’s), and % Loads.
The next step would be to begin again with Group 2 Ton Hour distribution as below. Note Group 2 is
Group 1, but with 100% Economizer at 55 F.
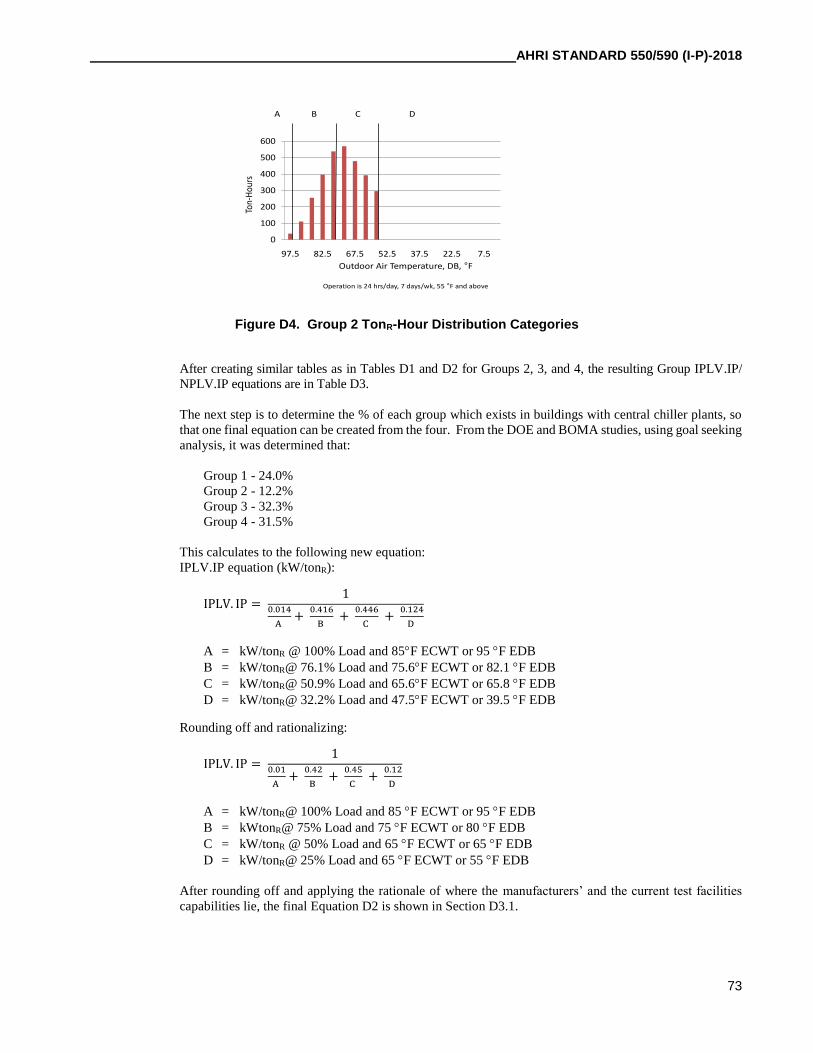
AHRI STANDARD 550/590 (I-P)-2018
73
0
100
200
300
400
500
600
97.5 82.5 67.5 52.5 37.5 22.5 7.5
Outdoor Air Temperature, DB, F
Operation is 24 hrs/day, 7 days/wk, 55 F and above
A B C D
Ton-
Hou
rs
Figure D4. Group 2 TonR-Hour Distribution Categories
After creating similar tables as in Tables D1 and D2 for Groups 2, 3, and 4, the resulting Group IPLV.IP/
NPLV.IP equations are in Table D3.
The next step is to determine the % of each group which exists in buildings with central chiller plants, so
that one final equation can be created from the four. From the DOE and BOMA studies, using goal seeking
analysis, it was determined that:
Group 1 - 24.0%
Group 2 - 12.2%
Group 3 - 32.3%
Group 4 - 31.5%
This calculates to the following new equation:
IPLV.IP equation (kW/tonR):
IPLV. IP = 1
0.014
A +
0.416
B +
0.446
C +
0.124
D
A = kW/tonR @ 100% Load and 85F ECWT or 95 F EDB
B = kW/tonR@ 76.1% Load and 75.6F ECWT or 82.1 F EDB
C = kW/tonR@ 50.9% Load and 65.6F ECWT or 65.8 F EDB
D = kW/tonR@ 32.2% Load and 47.5F ECWT or 39.5 F EDB
Rounding off and rationalizing:
IPLV. IP = 1
0.01
A +
0.42
B +
0.45
C +
0.12
D
A = kW/tonR@ 100% Load and 85 F ECWT or 95 F EDB
B = kWtonR@ 75% Load and 75 F ECWT or 80 F EDB
C = kW/tonR @ 50% Load and 65 F ECWT or 65 F EDB
D = kW/tonR@ 25% Load and 65 F ECWT or 55 F EDB
After rounding off and applying the rationale of where the manufacturers’ and the current test facilities
capabilities lie, the final Equation D2 is shown in Section D3.1.

AHRI STANDARD 550/590 (I-P)-2018
74
Table D1. Group 1 Air-cooled IPLV.IP Data and Calculation
C/S Chiller
Min Bin Low Bin Peak Bin Design Bin
Outside Temp, °F
Average DB, °F
OA DB, °F
Total Hours, h
DBH, °F∙h
Total, tonR-,
h
Cooling Load, %
DBH, °F∙h
tonR,-
h
DBH, °F∙h
tonR-
h
DBH, °F∙h
tonR-,
h
DBH, °F∙h
tonR-,
h
95-99 97.5 97.5 37 3608 37 100% 0 0 0 0 0 0 3608 37
90-94 92.5 92.5 120 11100 111 92% 0 0 0 0 11100 111 0 0
85-89 87.5 87.5 303 26513 256 85% 0 0 0 0 26513 256 0 0
80-84 82.5 82.5 517 42653 397 77% 0 0 0 0 42653 397 0 0
75-79 77.5 77.5 780 60450 539 69% 0 0 0 0 60450 539 0 0
70-74 72.5 72.5 929 67353 570 61% 0 0 67353 570 0 0 0 0
65-69 67.5 67.5 894 60345 479 54% 0 0 60345 479 0 0 0 0
60-64 62.5 62.5 856 53500 393 46% 0 0 53500 393 0 0 0 0
55-59 57.5 57.5 777 44678 296 38% 0 0 44678 296 0 0 0 0
50-54 52.5 52.5 678 35595 247 36% 35595 247 0 0 0 0 0 0
45-49 47.5 47.5 586 27835 204 35% 27835 204 0 0 0 0 0 0
40-44 42.5 42.5 550 23375 183 33% 23375 183 0 0 0 0 0 0
35-39 37.5 37.5 518 19425 163 32% 19425 163 0 0 0 0 0 0
30-34 32.5 32.5 467 15178 140 30% 15178 140 0 0 0 0 0 0
25-29 27.5 27.5 299 8223 84 28% 8223 84 0 0 0 0 0 0
20-24 22.5 22.5 183 4118 49 27% 4118 49 0 0 0 0 0 0
15-19 17.5 17.5 111 1943 28 25% 1943 28 0 0 0 0 0 0
10-14 12.5 12.5 68 850 16 23% 850 16 0 0 0 0 0 0
05-09 7.5 7.5 40 300 9 22% 300 9 0 0 0 0 0 0
00-04 2.5 2.5 47 118 9 20% 118 9 0 0 0 0 0 0
Total 57.9 57.9 8760 507155 4210 DBH Total 136958 1132 225628 1738 140715 1303 3608 37
Weighting: 26.9% 41.3% 30.9% 0.9%
EDB °F: 38.6 65.4 81.8 95.0
Load: 31.9% 50.3% 75.7% 100%
Points D C B A
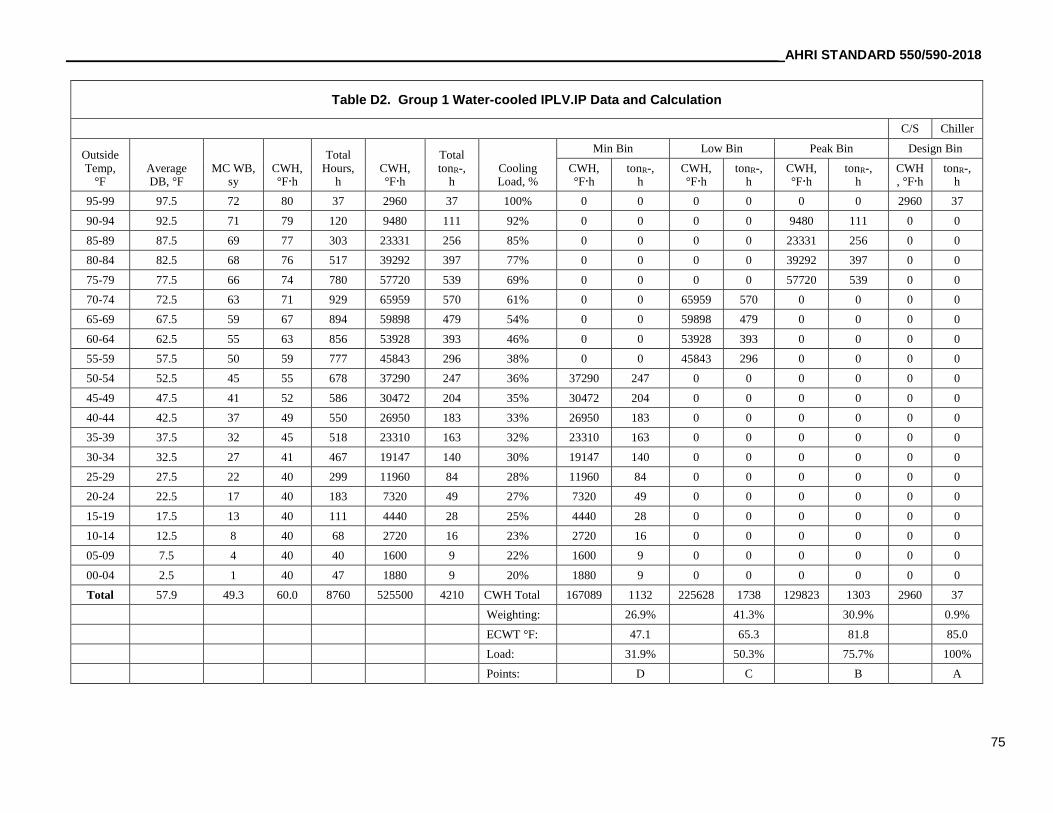
_________________________________________________________________________________________________ AHRI STANDARD 550/590-2018
75
Table D2. Group 1 Water-cooled IPLV.IP Data and Calculation
C/S Chiller
Outside Temp,
°F Average DB, °F
MC WB, sy
CWH, °F∙h
Total Hours,
h CWH, °F∙h
Total tonR-,
h Cooling Load, %
Min Bin Low Bin Peak Bin Design Bin
CWH, °F∙h
tonR-, h
CWH, °F∙h
tonR-, h
CWH, °F∙h
tonR-, h
CWH, °F∙h
tonR-, h
95-99 97.5 72 80 37 2960 37 100% 0 0 0 0 0 0 2960 37
90-94 92.5 71 79 120 9480 111 92% 0 0 0 0 9480 111 0 0
85-89 87.5 69 77 303 23331 256 85% 0 0 0 0 23331 256 0 0
80-84 82.5 68 76 517 39292 397 77% 0 0 0 0 39292 397 0 0
75-79 77.5 66 74 780 57720 539 69% 0 0 0 0 57720 539 0 0
70-74 72.5 63 71 929 65959 570 61% 0 0 65959 570 0 0 0 0
65-69 67.5 59 67 894 59898 479 54% 0 0 59898 479 0 0 0 0
60-64 62.5 55 63 856 53928 393 46% 0 0 53928 393 0 0 0 0
55-59 57.5 50 59 777 45843 296 38% 0 0 45843 296 0 0 0 0
50-54 52.5 45 55 678 37290 247 36% 37290 247 0 0 0 0 0 0
45-49 47.5 41 52 586 30472 204 35% 30472 204 0 0 0 0 0 0
40-44 42.5 37 49 550 26950 183 33% 26950 183 0 0 0 0 0 0
35-39 37.5 32 45 518 23310 163 32% 23310 163 0 0 0 0 0 0
30-34 32.5 27 41 467 19147 140 30% 19147 140 0 0 0 0 0 0
25-29 27.5 22 40 299 11960 84 28% 11960 84 0 0 0 0 0 0
20-24 22.5 17 40 183 7320 49 27% 7320 49 0 0 0 0 0 0
15-19 17.5 13 40 111 4440 28 25% 4440 28 0 0 0 0 0 0
10-14 12.5 8 40 68 2720 16 23% 2720 16 0 0 0 0 0 0
05-09 7.5 4 40 40 1600 9 22% 1600 9 0 0 0 0 0 0
00-04 2.5 1 40 47 1880 9 20% 1880 9 0 0 0 0 0 0
Total 57.9 49.3 60.0 8760 525500 4210 CWH Total 167089 1132 225628 1738 129823 1303 2960 37
Weighting: 26.9% 41.3% 30.9% 0.9%
ECWT °F: 47.1 65.3 81.8 85.0
Load: 31.9% 50.3% 75.7% 100%
Points: D C B A

AHRI STANDARD 550/590 (I-P)-2018
76
Table D3. Group 1 – 4 IPLV.IP Summary
Group 1
% Load
ECWT,
ºF
EDB,
ºF
Weight
Group 2
% Load
ECWT,
ºF
EDB,
ºF
Weight
A
100.0%
85.0
95.0
0.95%
A
100.0%
85.0
95.0
1.2%
B
75.7%
75.5
81.8
30.9%
B
75.7%
75.5
81.8
42.3%
C
50.3%
65.3
65.4
41.3%
C
50.3%
65.3
65.4
56.5%
D
31.9%
47.1
38.6
26.9%
D
N/A
N/A
N/A
0.0%
IPLV.IP
=
1
0. 009 A⁄ + 0. 309 B⁄ + 0. 413 C⁄ + 0. 269 D⁄
IPLV.IP
=
1
0. 012 A⁄ + 0. 423 B⁄ + 0. 565 C⁄ + 0. 0 D⁄
Group 3
% Load
ECWT,
ºF
EDB,
ºF
Weight
Group 4
% Load
ECWT,
ºF
EDB,
ºF
Weight
A
100.0%
85.0
95.0
1.5%
A
100.0%
85.0
95.0
1.8%
B
75.7%
75.6
82.2
40.9%
B
76.4%
75.6
82.2
50.1%
C
50.3%
65.8
66.0
39.2%
C
51.3%
65.8
66.0
48.1%
D
31.9%
47.7
40.0
18.4%
D
N/A
N/A
N/A
0.0%
IPLV.IP
=
1
0. 015 A⁄ +0. 409 B⁄ + 0. 392 C⁄ + 0. 184 D⁄
IPLV.IP
=
1
0. 018 A⁄ + 0. 501 B⁄ +0. 481 C⁄ + 0. 0 D⁄

_____________________________________________________________ AHRI STANDARD 550/590-2018
77
APPENDIX E. CHILLER CONDENSER ENTERING AIR TEMPERATURE MEASUREMENT – NORMATIVE
Note: This appendix includes modifications to the test stand setup and instrumentation to be compliant with the AHRI
certification program. As such, additional provisions are made for instrumentation and facility review by the auditing
laboratory.
E1 Purpose. The purpose of this appendix is to prescribe a method for measurement of the air temperature entering the Air-
Cooled or Evaporatively-cooled Condenser section of an Air-cooled Water-chilling Package. The appendix also defines the
requirements for controlling the air stratification and what is considered acceptable for a test. Measurement of the air
temperatures are needed to establish that the conditions are within the allowable tolerances of this standard. For air-cooled
chillers operating in the cooling mode, only the dry-bulb temperature is required. For evaporatively-cooled and heat pump
chilled water packages operating in the heating mode, both the dry-bulb and wet-bulb temperatures are required for the test.
E2 Definitions.
E2.1 Air Sampling Tree Assembly. An air temperature measurement assembly that facilitates air temperature
measurement using an Air Sampling Tree, Aspirating Psychrometer and a Thermopile Grid. See Section E4 for design
requirements.
E2.1.1 Air Sampling Tree. A tubular air sampling device consisting of a single trunk with regularly spaced
branches each with regularly spaced holes. See Figure E1 for a typical design.
E2.1.2 Aspirating Psychrometer. A device with a monitored airflow section that draws a uniform airflow
velocity from Air Sampling Tree branch tube holes and through a measurement section that has probes for
measurement of dry-bulb and wet-bulb air temperature.
E2.1.3 Thermopile Grid. A temperature measurement grid attached to an Air Sampling Tree to measure
the average dry-bulb air temperature of the airflow over the Air Sampling Tree.
E2.2 Air Sampling Array. An array of dry-bulb air temperature measurement devices that sample air temperature
over a given cross sectional area as shown Figure E3.
E3 General Requirements. Air temperature measurements shall be made using an Air Sampling Tree (see Section E4) or
Air Sampling Array (see Section E5).
E3.1 Air Temperature Measurement. Temperature measurements shall be made in accordance with ANSI/ASHRAE
Standard 41.1 with an instrument or instrument system, including read-out devices, meeting or exceeding the following
accuracy and precision requirements detailed in Table E1. Where there are differences between this document and
ANSI/ASHRAE Standard 41.1, this document shall prevail.

AHRI STANDARD 550/590 (I-P)-2018
78
Table E1. Temperature Measurement Requirements
Measurement
Measurement
System
Accuracy
Measurement
Resolution
Selected, Installed, Operated,
Maintained in Accordance with
Dry-Bulb and Wet-Bulb Temperatures2 ≤ ±0.2 °F ≤ 0.1 °F
ANSI/ASHRAE Standard 41.1 Air Sampling Tree Average Temperature1 ≤ ±1.0 °F ≤ 0.1 °F
Dewpoint Temperature3 ±0.4 °F ≤ 0.1 °F
Notes:
1. If a thermopile is used for this measurement, then the thermocouple wire shall have special limits of error and all
thermocouple junctions shall be made from the same spool of wire; thermopile junctions are wired in parallel.
2. The accuracy specified is for the temperature indicating device and does not reflect the operation of the aspirating
psychrometer.
3. Dewpoint may be measured and wet-bulb temperatures calculated and recorded as required for evaporatively-
cooled units and heat pump chillers operating in the heating mode.
E3.2 Air Distribution and Temperature Control. Tests shall be conducted while maintaining the following tolerance
limits on operating conditions. Measurement values shall not deviate from published rating values more than the
operating condition tolerance limits determined from Table E2.

_____________________________________________________________ AHRI STANDARD 550/590-2018
79
Table E2. Criteria for Air Distribution and Control of Air Temperature
Item Purpose Deviation from Mean Value, °F
Dry-bulb Temperature
Individual Aspirating Psychrometer
or Air Sampling Array 2
Uniform temperature
distribution
±2.00 1
(≤200 tonR)
±3.00 1
(>200 tonR)
Dry-bulb temperature measured
with air sampling Thermopile Grid
or an array of individual Dry-bulb
measurements3
Uniform temperature
distribution ±1.50 2
Recirculating temperature measured
with an individual Thermocouple or
Dry-bulb measurement
Recirculation Check ±5.00 4
Wet-bulb Temperature 5
Wet-bulb temperature at any
individual temperature
measurement station6
Uniform humidity
distribution ±1.00
Notes:
1. The mean dry-bulb temperature (MADBT) is the mean of all A/P measurement stations.
2. Each A/P measurement represents a mean value as measured by a single Aspirating Psychrometer or an
array of individual Dry-bulb measurements.
3. Each T/P measurement is either a Thermopile Grid or an array of individual Dry-bulb measurements.
4. Each R/C measurement is either an individual Thermocouple or Dry-bulb measurement.
5. The wet-bulb temperature measurement is only required for evaporatively-cooled units and heat pump
chillers operating in the heating mode.
6. Dewpoint may be measured and wet-bulb temperatures calculated and recorded. Mean value is the result
of 2 or more measurements.
E3.2.1 Condenser Discharge Air Recirculation Check. To ensure adequate air distribution, thorough
mixing, and uniform air temperature, it is important that the room and test setup is properly designed and
operated. The room conditioning equipment airflow should be set such that recirculation of condenser
discharged air is avoided. To check for the recirculation of condenser discharged air back into the condenser
coil(s) the following method shall be used:
Multiple individual reading temperature sensors (at least one per Air Sampling Tree or Air Sampling Array
location) will be installed around the unit air discharge perimeter so that they are below the plane of condenser
fan exhaust and just above the top of the condenser coil(s). These temperature sensors shall not indicate a
temperature difference greater than 5.0 °F from the air sampling tree or air sampling array measured value. Air
distribution at the test facility point of supply to the unit shall be reviewed and may require remediation prior
to beginning testing.
E3.2.2 Mixing Fans. Mixing fans can be used to ensure adequate air distribution in the test room. If used,
mixing fans shall be oriented such that they are pointed away from the air intake so that the mixing fan exhaust
direction is at an angle of 90°-270° to the air entrance to the condenser air inlet. Particular attention should be
given to prevent recirculation of condenser fan exhaust air back through the unit.
E3.2.3 Air Sampling Placement. Air Sampling Trees and Air Sampling Arrays shall be placed within 6-12
inches of the unit to minimize the risk of damage to the unit while ensuring that the air sampling tubes are
measuring the air going into the unit rather than the room air around the unit.

AHRI STANDARD 550/590 (I-P)-2018
80
E4 Air Sampling Tree Assembly Requirements. The Air Sampling Tree Assembly (consisting of an Air Sampling Tree,
Aspirating Psychrometer, and Thermopile Grid) is intended to draw a uniform sample of the airflow entering the Air-cooled
Condenser or Evaporatively-cooled Condenser.
E4.1 Air Sampling Tree. A typical Air Sampling Tree configuration for the sampling tree is shown in Figure E1 for
a tree with overall dimensions of 4 feet by 4 feet. Other sizes and rectangular shapes can be used, and should be scaled
accordingly as long as the aspect ratio (width to height) of no greater than 2 to 1 is maintained.
The Air Sampling Tree shall be constructed of stainless steel, plastic or other suitable, durable materials. It shall have a
main flow trunk tube with a series of branch tubes connected to the trunk tube. It shall have from 10 to 20 branch tubes.
The branch tubes shall have appropriately spaced holes, sized to provide equal airflow through all the holes by increasing
the hole size as you move further from the trunk tube to account for the static pressure regain effect in the branch and
trunk tubes. The number of sampling holes shall be greater than 50.
The average minimum velocity through the sampling tree holes shall be ≥ 2.5 ft/s. Average velocity in the holes may be
determined by an inverse ratio from the average velocity through in the Aspirating Psychrometer, using the area through
the Aspirating Psychrometer and the sum of the open area of the holes in the trees. The assembly shall have a tubular
connection to allow a flexible tube to be connected to the Air Sampling Tree and to the Aspirating Psychrometer.
Figure E1. Typical Air Sampling Tree
Note: The 0.75 inch by 0.50 inch slots referenced in Figure E1 are cut into the branches of the sampling tree and are
located inside of the trunk of the sampling tree. They are placed to allow air to be pulled into the main trunk from each
of the branches. Drill holes and mill slot shall be on the same side of the sampling tube. The holes and slot shall only
pass through the one side of the sampling tube.
E4.2 Aspirating Psychrometer. The aspirating psychrometer consists of a flow section and a fan to draw air through
the flow section and measures an average value of the sampled air stream. The flow section shall be equipped with two
dry-bulb temperature probe connections, one of which will be used for the facility temperature measurement and one of
which shall be available to confirm this measurement using an additional or a third-party’s temperature sensor probe.

_____________________________________________________________ AHRI STANDARD 550/590-2018
81
For applications where wet-bulb air temperature measurement is also required, the flow section shall be equipped with
two wet-bulb temperature probe connections, one of which will be used for the facility wet-bulb measurement and one
of which shall be available to confirm the wet-bulb measurement using an additional wet-bulb sensor probe. The
psychrometer shall include a fan that either can be adjusted manually or automatically to maintain average velocity
across the sensors. A typical configuration for the aspirating psychrometer is shown in Figure E2.
Figure E2. Aspirating Psychrometer
E4.3 Thermopile Grid. The Thermopile Grid shall have at least 16 points per sampling tree, evenly spaced across
the sampling tree. The 16 points can be measured by a thermopile wired in parallel or by individual measurement devices.
If individual thermocouples are used, then an average will be calculated to determine the air sampling tree temperature.
E4.4 Air Sampling Array. When using individual dry-bulb temperature sensors the Thermopile Grid is not required.
E4.5 Dewpoint. When using Dewpoint sensors, the Wet-bulb values shall be determined and recorded. A minimum
of two sensors are required positioned to ensure uniformity of the air entering the test sample.
E5 Air Sampling Array Requirements. The Air Sampling Array is an alternative to utilizing a Thermopile Grid.
Measurement devices shall be positioned to measure at the four (4) locations shown in Figure E3 within 5% of overall width
and height, where W and H are condenser air inlet nominal face area width and height.

AHRI STANDARD 550/590 (I-P)-2018
82
Figure E3. Air Sampling Array
E6 Test Setup Description. Air dry-bulb temperature shall be measured at multiple locations entering the Condenser, based
on the required number of Air Sampling Trees or Air Sampling Arrays as shown in Figure E4.
E6.1 Condenser Air Inlet Nominal Face Area. The nominal face area of the Condenser may extend beyond the
condenser coil depending on coil configuration and orientation, and shall include all regions through which air enters
the unit. The Condenser Air Inlet Nominal Face Area shall be divided into a number of equal area rectangles with aspect
ratios no greater than 2 to 1. Each rectangular area shall have one Air Sampling Tree or Air Sampling Array located at
the geometric center of each rectangle.

_____________________________________________________________ AHRI STANDARD 550/590-2018
83
Figure E4. Required Number of Air Sampling Trees or Air Sampling Arrays
L
L
L
L
L
L
2·L
3·L
4·L
5·L
L L
2·L
3·L
L
6·L
L
7·L = Loverall
LH 0.8L ≤ LH ≤ L
LW
0.8L ≤ LW ≤ L
Legend
Condenser Air Inlet
Nominal Face Area
Equal Area Rectangles
Air Sampler Tree
L1 L2 L3 L4
0.6 Loverall ≤ (L1+L2+L3+L4+...) ≤ Loverall

AHRI STANDARD 550/590 (I-P)-2018
84
Figure E5. Typical Test Setup Configurations
E6.2 Air Sampling Tree Assembly. Air Sampling Trees shall cover at least 80% of the height and 60% of the width
of the air entrance to the unit (for long horizontal coils), or shall cover at least 80% of the width and 60% of the height
of the air entrance (for tall vertical coils). Block all Air Sampling Tree branch holes that extend beyond the Condenser
Air Inlet Nominal Face Area.
When more than one Condenser inlet area exists than a minimum total of two (2) air sampling trees shall be used to
assess air temperature uniformity.
A maximum of four (4) sampling trees shall be connected to each Aspirating Psychrometer. The sampling trees should
be connected to the Aspirating Psychrometer using flexible tubing that is insulated and routed to prevent heat transfer to
the air stream. In order to proportionately divide the flow stream for multiple sampling trees for a given Aspirating
Psychrometer, the flexible tubing should be of equal lengths for each sampling tree. Refer to Figure E5 for typical
examples of air sampling tree and aspirating psychrometer setups.
A minimum of one Aspirating Psychrometer per side of a chiller shall be used. For units with three (3) sides, two (2)
Aspirating Psychrometers can be used but will require a separate air sampling tree for the third side. For units that have
air entering the sides and the bottom of the unit, additional air sampling trees shall be used.
E6.3 Air Sampling Array. Each Air Sampling Array shall be positioned in each equal area rectangle as shown in
Figure E3.
E6.4 Part Load Test Points. For Part-load test points, Air Sampling Tree Assemblies or Air Sampling Arrays
positioned at non-operating portions of the coil on the test chiller are permitted to be excluded from the calculation.

_____________________________________________________________ AHRI STANDARD 550/590-2018
85
APPENDIX F. ATMOSPHERIC PRESSURE ADJUSTMENT – NORMATIVE
F1 Purpose. The purpose of this appendix is to prescribe a method of adjusting measured test data according to the local
atmospheric pressure.
F2 Background. In order to ensure that performance can be uniformly compared from one unit to another and from one
manufacturer to another, performance testing for air-cooled and evaporatively-cooled chillers shall be corrected for air density
variations. To accomplish this, use the following two (2) correction factors (CFQ, CFη) to correct test data at test load points
back to standard atmospheric pressure at sea level, for Standard Rating Conditions, or to correct to another atmospheric pressure
corresponding to a site altitude for Application Rating Conditions. These correction factors use an empirical method of
correction based on industry average values across a wide variety of chillers. The correction factors are based on pressure
rather than altitude, in order to include the effects of weather variations. Test data shall be corrected from actual tested
atmospheric pressure to rated atmospheric pressure for comparison to Published Ratings. The correction multiplier for
efficiency and Capacity at the 0% load point will be 1.0. Intermediate correction multipliers at part-load points will be
calculated at each part-load point where the % load value is based on the measured Capacity at that load point divided by the
100% load point measured Capacity.
Note: These factors are not intended to serve as selection code correction factors. For selection codes it is best to use component
models that properly adjust for variation in atmospheric pressure as related to fan, heat exchanger and compressor power and
Capacity.
The correction factors (CFQ, CFη) will be limited to a value corresponding to an atmospheric pressure of 11.56 psia
(approximately 6500 feet altitude). Correction factors for measured atmospheric pressure readings below the minimum will
be equal to the value determined at 11.56 psia.
F3 Procedure for Correcting Test Data to Standard Rating Condition Atmospheric Pressure. Air-cooled and evaporatively-
cooled chillers are tested at the local conditions. The data is then corrected to sea level and standard pressure by multiplying
the measured data by the appropriate correction factor (CF). Both factors are in the form of a second order polynomial
equations:
DQ = AQ · p2 + BQ · p + CQ F1
D = Aƞ · p2 + Bƞ · p + Cƞ F2
(𝐶𝐹𝑄)𝑃=𝑃𝑡𝑒𝑠𝑡
= 1 + (𝑄𝑒𝑣,%𝐿𝑜𝑎𝑑
𝑄𝑒𝑣,100%) ∙ (𝐷𝑄 − 1) ∙ 𝑒𝑥𝑝{−0.35 ∙ [(𝐷𝜂 ∙ 𝜂𝑡𝑒𝑠𝑡,100%) − 9.6]} F3
(𝐶𝐹𝜂)𝑃=𝑃𝑡𝑒𝑠𝑡
= 1 + (𝑄𝑒𝑣,%𝐿𝑜𝑎𝑑
𝑄𝑒𝑣,100%) ∙ (𝐷𝜂 − 1) ∙ 𝑒𝑥𝑝{−0.35 ∙ [(𝐷𝜂 ∙ 𝜂𝑡𝑒𝑠𝑡,100%) − 9.6]} F4
𝑄𝑐𝑜𝑟𝑟𝑒𝑐𝑡𝑒𝑑,𝑠𝑡𝑎𝑛𝑑𝑎𝑟𝑑 = 𝑄𝑡𝑒𝑠𝑡(𝐶𝐹𝑄)𝑃=𝑃𝑡𝑒𝑠𝑡
F5
𝜂𝑐𝑜𝑟𝑟𝑒𝑐𝑡𝑒𝑑,𝑠𝑡𝑎𝑛𝑑𝑎𝑟𝑑 = 𝜂𝑡𝑒𝑠𝑡(𝐶𝐹𝜂)𝑃=𝑃𝑡𝑒𝑠𝑡
F6
If efficiency η is expressed in kW/tonR then divide, Equation F6, by the correction factor CFη instead of
multiplying.

AHRI STANDARD 550/590 (I-P)-2018
86
Table F1. Correction Factor (CF) Coefficients
Capacity DQ Efficiency D
Units of
Measure for P AQ BQ CQ Aη Bη Cη
IP (psia) 1.1273E-03 -4.1272E-02 1.36304E+00 2.4308E-03 -9.0075E-02 1.79872E+00
Note: E indicates scientific notation, example: 1E-02 = 0.01
100% Load Point Example:
A chiller has Published Ratings of 200.0 tonR and 10.500 EER at sea level. The chiller is tested at an altitude of about
3500 feet.
The measured test results:
Capacity Qtested = 198.5 tonR
Efficiency ηtested = 10.35 EER
Air pressure Ptest = 13.00 psia
Correction factor DQ = 0.0011273∙13.00² –0.041272∙13.00 + 1.36304 = 1.0170
Correction factor D = 0.0024308∙13.00²–0.090075∙13.00 + 1.79872 = 1.0386
Correction factor CFq = 1+ (198.5 / 198.5) · (1.0170 – 1) ∙ exp [-0.35∙(1.0386∙10.35 – 9.6)] = 1.0114
Correction factor CFη = 1+ (198.5 / 198.5) · (1.0386 – 1) ∙exp [-0.35∙(1.0386∙10.35 – 9.6)] = 1.0258
Corrected test Capacity Qcorrected standard = 198.5∙1.0114= 200.8 tonR
Corrected test efficiency ηcorrected standard = 10.35∙1.0258 = 10.62 EER
Part load efficiency and capacity correction factors for the following example are determined using the same calculation process
as for the 100% Load Point example:
With a part load test result Capacity of 160 tonR and a 198.5 tonR test result for 100% load point Capacity. The chiller
is tested at an altitude of about 3500 feet,
The measured test results for the part load test;
Capacity Qtest = 160.00 tonR
Efficiency ƞtested ,100% = 10.35 EER
Efficiency ƞtest = 12.60 EER
Air Pressure Ptest = 13.00 psia
Correction factor DQ = 0.0011273∙13.00² –0.041272∙13.00 + 1.36304 = 1.0170
Correction factor Dη = 0.0024308∙13.00²–0.090075∙13.00 + 1.79872 = 1.0386
Correction Factor CFq = 1 + (160.0/198.5) ∙(1.0170-1) ∙exp[-0.35∙(1.0386∙10.35-9.6)] = 1.0092
Correction Factor CFƞ = 1+ (160.0/198.5) ∙(1.0386-1∙exp[-0.35∙(1.0386∙10.35-9.6)] = 1.0208
Corrected test Capacity Qcorrected standard = 160.0∙1.0092 = 161.5 tonR
Corrected test efficiency ƞcorrected standard = 12.60∙1.0208 = 12.86 EER

_____________________________________________________________ AHRI STANDARD 550/590-2018
87
F4 Procedure for Correcting Test Data to Application Rating Condition Atmospheric Pressure. First use the method in
Section F3 to correct from tested atmospheric pressure to standard sea level atmospheric pressure. Then reverse the method to
correct to the application rated atmospheric pressure Prated.
𝑄𝑐𝑜𝑟𝑟𝑒𝑐𝑡𝑒𝑑,𝑎𝑝𝑝𝑙𝑖𝑐𝑎𝑡𝑖𝑜𝑛 =𝑄𝑐𝑜𝑟𝑟𝑒𝑐𝑡𝑒𝑑,𝑠𝑡𝑎𝑛𝑑𝑎𝑟𝑑
(𝐶𝐹𝑄)𝑃=𝑃𝑟𝑎𝑡𝑒𝑑
F7
𝜂𝑐𝑜𝑟𝑟𝑒𝑐𝑡𝑒𝑑,𝑎𝑝𝑝𝑙𝑖𝑐𝑎𝑡𝑖𝑜𝑛 =𝜂𝑐𝑜𝑟𝑟𝑒𝑐𝑡𝑒𝑑,𝑠𝑡𝑎𝑛𝑑𝑎𝑟𝑑
(𝐶𝐹𝜂)𝑃=𝑃𝑟𝑎𝑡𝑒𝑑
F8
100% Load Point Example:
The same chiller from the example in Section F3 also has published Application Ratings of 199.3 tonR and 10.42 EER
at 1000 feet, corresponding to rated atmospheric pressure of 14.17 psia. The chiller is tested at an altitude of about
3500 feet.
The measured test results:
Capacity Qtested = 198.5 tonR
Efficiency ηtested = 10.35 EER
Air pressure Ptest = 13.00 psia
From prior example calculations:
Corrected test Capacity Qcorrected,standard = 200.8 tonR
Corrected test efficiency ηcorrected,standard = 10.62 EER
Next calculate correction factors for the application rating value of Prated=14.17 psia:
Correction factor DQ = 0.0011273∙14.17² –0.041272∙14.17 + 1.36304 = 1.0045
Correction factor Dη = 0.0024308∙14.17²–0.090075∙14.17 + 1.79872 = 1.0104
Correction factor CFq = 1+ (198.5 / 198.5) · (1.0045 – 1) ∙ exp [-0.35∙(1.0104∙10.35 – 9.6)] = 1.0034
Correction factor CFη = 1+ (198.5 / 198.5) · (1.0104 – 1) ∙exp [-0.35∙(1.0104∙10.35 – 9.6)] = 1.0077
Corrected test Capacity Qcorrected,application = 200.8 / 1.0034 = 200.1 tonR
Corrected test efficiency ηcorrected,application = 10.62 / 1.0077 = 10.54 EER

AHRI STANDARD 550/590 (I-P)-2018
88
APPENDIX G. WATER PRESSURE DROP MEASUREMENT PROCEDURE – NORMATIVE
G1 Purpose. The purpose of this appendix is to prescribe a measurement method for Water Pressure Drop and, when
required, a correction method to compensate for friction losses associated with external piping measurement sections. The
measurement method only applies to pipe of circular cross section.
G2 Background. As a certified test point for the liquid to refrigerant heat exchangers, the water-side pressure drop needs to
be determined by test with acceptable measurement uncertainty. In some cases, the measured Water Pressure Drop per this
standard will be determined by using static pressure taps in piping external to the unit. When using external piping, adjustment
factors are allowed to compensate the reported pressure drop measurement. Numerous studies conclude that the determination
of a calculated correction term for these external components may contain significant sources of error and therefore the use of
external correction factors will be restricted to limit the magnitude of these potential errors. For units with small connection
sizes it is feasible that straight pipe sections be directly connected to the units with adequate length to obtain static pressure
measurements with acceptable systematic errors due to instrument installation location. This is the preferred connection
methodology. Units with larger size connections may have spatial limits in the connection arrangements such that elbows or
pipe diameter changes may be necessary to accommodate the available space at the test facility, or to provide mechanical
support for piping weight loads. While this may increase the measurement uncertainty it is a practical compromise considering
capital costs of test facilities.
G3 Measurement Locations. Static pressure taps shall simultaneously meet all of the following requirements:
G3.1 Static pressure taps shall be in either the unit connections (i.e. nozzles) or in additional external piping
provided for the purpose of test measurements.
G3.2 If using additional external piping, the piping arrangement shall use rigid pipe and may include fittings such
as elbows, reducers, or enlargers between the pressure tap locations and the unit connections. Flexible hose is
prohibited between the unit connections and the pressure taps.
G3.3 Static pressure taps shall maintain the following lengths of cylindrical straight pipe in the flow path adjacent
to each pressure tap location in Table G1.
Table G1. Straight Length in Flow Path
Unit Connection, Straight Length in Flow Path
Nominal Pipe Size Upstream of Pressure Tap Downstream of Pressure Tap
≤3 inches Minimum 10 · d Minimum 3 · d
4, 5, or 6 inches Minimum 6 · d Minimum 2 · d
≥8 inches Minimum 3 · d Minimum 1 · d
d = The greatest pipe inside diameter dimension, using the nominal pipe size and pipe schedule nominal
wall thickness, of the following locations:
The pipe diameter at the pressure tap location
The largest diameter of any reducer or enlarger fittings between the pressure tap location and unit
connections
The largest diameter of the first reducer or enlarger fitting between the pressure tap location and
the test facility if any
G4 Static Pressure Taps. Static pressure taps will be in a piezometer ring or piezometer manifold arrangement with a
minimum of 3 taps located circumferentially around the pipe, all taps at equal angle spacing. To avoid introducing measurement
errors from recirculating flow within the piezometer ring, each of the pipe tap holes shall have a flow resistance that is greater
than or equal to 5 times the flow resistance of the piezometer ring piping connections between any pair of pressure taps. A
“Triple-Tee” manifold arrangement using 4 pipe tap holes is the preferred arrangement, but not required if meeting the flow
resistance requirement.
G4.1 For design or evaluation purposes, flow resistance may be estimated by resistance coefficient K factor
calculation methods as found in Crane Technical Paper No. 410. Generally, manifold tubing or piping can be evaluated
using the K factor and pressure tap holes can be evaluated using orifice flow equations (refer to Section G5.2).
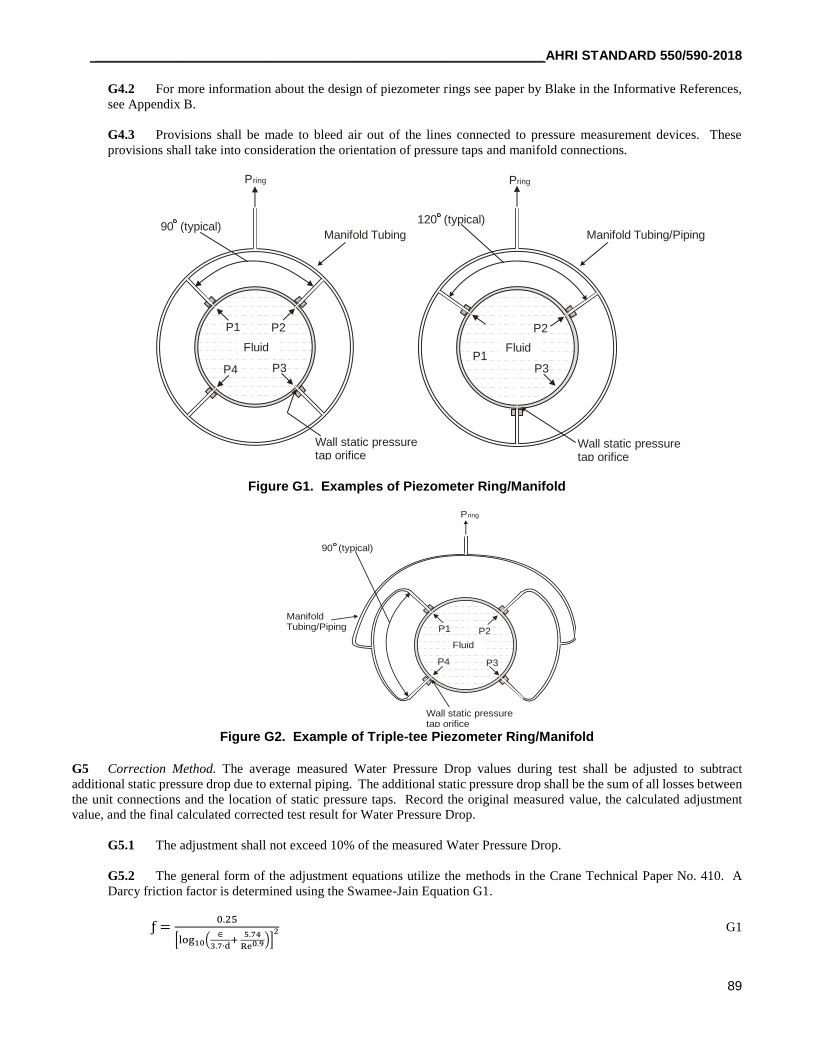
_____________________________________________________________ AHRI STANDARD 550/590-2018
89
G4.2 For more information about the design of piezometer rings see paper by Blake in the Informative References,
see Appendix B.
G4.3 Provisions shall be made to bleed air out of the lines connected to pressure measurement devices. These
provisions shall take into consideration the orientation of pressure taps and manifold connections.
Figure G1. Examples of Piezometer Ring/Manifold
Figure G2. Example of Triple-tee Piezometer Ring/Manifold
G5 Correction Method. The average measured Water Pressure Drop values during test shall be adjusted to subtract
additional static pressure drop due to external piping. The additional static pressure drop shall be the sum of all losses between
the unit connections and the location of static pressure taps. Record the original measured value, the calculated adjustment
value, and the final calculated corrected test result for Water Pressure Drop.
G5.1 The adjustment shall not exceed 10% of the measured Water Pressure Drop.
G5.2 The general form of the adjustment equations utilize the methods in the Crane Technical Paper No. 410. A
Darcy friction factor is determined using the Swamee-Jain Equation G1.
ƒ =0.25
[log10(∈
3.7∙d+
5.74
Re0.9)]2 G1
Pring
P1 P2
P3P4
Wall static pressuretap orifice
Manifold Tubing
Fluid
90 (typical)
P1
P2
P3
Wall static pressuretap orifice
Manifold Tubing/Piping
Fluid
120 (typical)
Pring
Pring
Wall static pressuretap orifice
Manifold Tubing/Piping P1 P2
P3P4
Fluid
90 (typical)

AHRI STANDARD 550/590 (I-P)-2018
90
Pipe roughness values shall be either actual measurements or approximations based on handbook values. If using handbook
values consideration shall be given and values adjusted accordingly to the actual conditions of the pipe interior surface, which
may have higher roughness versus the clean conditions of new pipe. Typical pipe roughness handbook values for reference:
Commercial Pipe,
New Condition
𝜖 (rms)
(ft)
Steel 1.810-4
Plastic 6.010-6
The pressure drop (hL) associated with a flow component or fitting may be calculated using the friction factor as detailed above
or the equation may use a K factor. These are shown in Equations G2 and G3.
hL = f ∙L
d∙
V2
2g when the Darcy friction factor is used for straight pipe sections G2
hL = K ∙V2
2g when a K factor is specified for elbows and expansions/contractions G3
∆padj = ρg[∑ (hf)ii + ∑ (hm)jj ] G4
Where:
g = 32.174 ft/s2 (for the purposes of this standard)
Table G2. K Factors for Elbow Arrangements
Description K Factor
Smooth elbow with r/d = 1 20·f
Smooth elbow with r/d= 1.5 14·f
Smooth elbow with r/d = 2 12·f
Smooth elbow with r/d = 3 12·f
Smooth elbow with r/d = 4 14·f
Segmented with 2·45° miters 30·f
Segmented with 3·30° miters 24·f
Segmented with 6·15° miters 24·f
The determination of the K factor for the expansion and contraction sections is a function of the diameter ratio (𝛽 =𝑑1
𝑑2, 𝑑1 < 𝑑2) as well as the angle θ of the expansion or contraction. For typical commercially available gradual
expansion or contraction fittings, an equation has been developed for θ as a function of the smaller diameter 𝑑1 that
best represents the pressure drop results found in the ASHRAE Technical Report 1034-RP. The equation is valid in
the range of 10° to 45°. For sudden expansion or contractions use the table’s values for θ > 45°. See Crane Technical
Paper No. 410 for a more complete description of the loss coefficient equations.
Table G3. Angle for Expansion and Reduction Fittings
d1 ≤ 5 inch 5 inch < d1 < 20 inch d1 ≥ 20 inch
gradual expander, gradual
reducer 𝜃 = 45° 𝜃 =
170 − 7𝑑1
3 𝜃 = 10°
sudden expansion, sudden
contraction 45° < θ < 180° 45° < θ < 180° 45° < θ < 180°

_____________________________________________________________ AHRI STANDARD 550/590-2018
91
Table G4. Resistance Coefficient for Expansion and Reduction Fittings
θ ≤ 45° θ > 45°
expansion
𝐾 =2.6sin (
𝜃
2)(1 − 𝛽2)2
𝛽4
𝐾 =(1 − 𝛽2)2
𝛽4
reduction
𝐾 =0.8sin (
𝜃
2)(1 − 𝛽2)2
𝛽4
𝐾 =0.5√sin (
𝜃
2)(1 − 𝛽2)
𝛽4
An Excel® spreadsheet is available from AHRI for computation of the water pressure drop adjustment factors.
Figure G3. Correction Term for Included Angle for Expansion/Contraction Fittings
0
10
20
30
40
50
0 5 10 15 20 25
Incl
ud
ed
An
gle
(°)
Minimum Pipe Diameter, inch
AHRI STANDARD 550/590 (I-P)-2018
92
APPENDIX H. HEATING CAPACITY TEST PROCEDURE – NORMATIVE
H1 Purpose. This appendix prescribes methods of testing for measurement of water-side heating Capacity for Air Source
Heat Pump Water-heating Packages.
H1.1 General. Net Heating Capacity is determined from water-side measurements of temperature change and
flow rate. Redundant instrumentation, rather than two separate capacity measurements methods, is used to check for
erroneous measurements.
H1.1.1 During the entire test, the equipment shall operate without damage to the equipment.
H1.1.2 During the entire test, the heat rejection water flow rate shall remain constant at the cooling mode
test conditions derived from Table 1 or Table 2 as shown in Section 5 of AHRI Standard 550/590 (I-P).
H1.1.3 For the duration of the test all ice or melt shall be captured and removed by drain provisions.
H1.2 Heating Capacity tests used to evaluate the heating performance of a heat pump when operating at conditions
that are conducive to frost accumulation on the outdoor coil should be conducted using the “T” test procedure described
in Section H3. Otherwise, the manufacturer shall have the option of first trying to use the “S” test procedure of Section
H2. If the requirements of the “S” test procedure cannot be achieved, then the heating capacity test shall be conducted
using the “T” test procedure described in Section H3.
H1.3 Except as noted, overriding of automatic defrost controls shall be prohibited. The controls shall only be
overridden when manually initiating a defrost cycle is permitted.
H1.4 For heat pumps that use a time-adaptive defrost control system, where defrost initiation depends on the length
of previous defrost cycles, the defrost controls of the heat pump shall be defeated during the official data collection
interval of all heating capacity tests. When the defrost controls are defeated, defrost cycles (if any) shall be manually
induced in accordance with the manufacturer's instructions.
H1.5 Any defrost cycle, whether automatically or manually initiated, that occurs while conducting a heating capacity
test shall always be terminated by the action of the heat pump's defrost controls.
H1.6 Defrost termination shall be defined as occurring when the controls of the heat pump actuate the first change
in converting from defrost operation to normal heating operation. Whether automatically or manually initiated, defrost
initiation shall be defined as occurring when the controls of the heat pump first alter its normal heating operation in order
to eliminate possible accumulations of frost on the outdoor coil.
H1.7 Frosting capacity degradation ratio used in the “S” Test Procedure is defined as:
Frosting capacity degradation ratio = 𝑄𝑐𝑑(𝑡=0)− 𝑄𝑐𝑑(𝑡)
𝑄𝑐𝑑(𝑡=0) H1
H2 “S” Test Procedure.
H2.1 The dry-bulb temperature and water vapor content of the air entering the outdoor-side shall be sampled at equal
intervals of one minute throughout the preconditioning and data collection periods. Over these same periods, all other
applicable Table 12 non-frosting parameters used in evaluating equilibrium shall be sampled at equal intervals of five
minutes. All data collected over the respective periods, except for parameters sampled between a defrost initiation and
ten minutes after the defrost termination, shall be used to evaluate compliance with the test tolerances specified in Table
11.
H2.2 The test room reconditioning apparatus and the equipment under test shall be operated until equilibrium
conditions are attained, but for not less than one hour, before test data are recorded. At any time during the
preconditioning period, the heat pump may undergo one or more defrost cycles if automatically initiated by its own
controls. The preconditioning period may, in addition, end with a defrost cycle and this period ending defrost cycle may

_____________________________________________________________ AHRI STANDARD 550/590-2018
93
be either automatically or manually initiated. Ending the preconditioning period with a defrost cycle is especially
recommended for heating capacity tests at low outdoor temperatures. If a defrost does occur, the heat pump shall operate
in the heating mode for at least ten minutes after defrost termination prior to resuming or beginning the data collection
described in Sections H2.1 and H2.3, respectively.
H2.3 Once the preconditioning described in Section H2.2 is completed, the data required for the specified test shall
be collected. These data shall be sampled at equal intervals that span five minutes or less. The Net Heating Capacity
Qcd shall be evaluated at equal intervals of five minutes. The Capacity evaluated at the start of the data collection period,
Qcd(=0), shall be saved for purposes of evaluating Sections H2.4.1 or H2.5.1 compliance.
H2.4 Test Procedures If the Pre-Conditioning Period Ends with a Defrost Cycle.
H2.4.1 Data collection shall be suspended immediately if any of the following conditions occur prior to
completing a 30-minute interval where the Table 12 non-frosting test tolerances are satisfied:
H2.4.1.1 The heat pump undergoes a defrost
H2.4.1.2 The indoor-side water temperature difference degrades such that the degradation ratio
exceeds 0.050 (refer to Equation H1)
H2.4.1.3 One or more of the applicable Table 12 non-frosting test tolerances are exceeded
H2.4.2 If the “S” test procedure is suspended because of the condition in Section H2.4.1.1, then the “T” test
procedure described in Section H3 shall be used.
H2.4.3 If the “S” test procedure is suspended because of the condition in Section H2.4.1.2, then the “T” test
procedure described in H3 shall be used.
H2.4.4 If the “S” test procedure is suspended because of the condition in Section H2.4.1.3, then another
attempt at collecting data in accordance with H2 and the “S” test procedure shall be made as soon as steady
performance is attained. An automatic or manually initiated defrost cycle may occur prior to making this
subsequent attempt. If defrost does occur, the heat pump shall operate in the heating mode for at least ten
minutes after defrost termination prior to beginning the data collection described in Section H2.3. The
preconditioning requirements in Section H2.2 are not applicable when making this subsequent attempt.
H2.4.5 If the “S” test procedure is not suspended in accordance with Section H2.4.1, then the sampling
specified in Section H2.3 shall be terminated after 30 minutes of data collection. The test, for which the Table
12 test tolerances for non-frosting apply, shall be designated as a completed steady-state heating capacity test,
and shall use the average of the seven (7) samples at the reported Net Heating Capacity.
H2.5 Test Procedure If the Pre-conditioning Period Does Not End with a Defrost Cycle.
H2.5.1 Data collection shall be suspended immediately if any of the following conditions occur prior to
completing a 30-minute interval where the Table 12 non-frosting test tolerances are satisfied:
H2.5.1.1 The heat pump undergoes a defrost
H2.5.1.2 The indoor-side water temperature difference degrades such that the degradation ratio
exceeds 0.050 (refer to Equation H1)
H2.5.1.3 One or more of the applicable Table 12 non-frosting test tolerances are exceeded
H2.5.2 If the “S” test procedure is suspended because of the condition in Section H2.5.1.1, then another
attempt at collecting data in accordance with Sections H2.3 and H2.4 shall be made beginning ten minutes after
the defrost cycle is terminated. The preconditioning requirements of Section H2.2 are not applicable when
making this subsequent attempt.
H2.5.3 If the “S” test procedure is suspended because of the condition in Section H2.5.1.2, then another

AHRI STANDARD 550/590 (I-P)-2018
94
attempt at collecting data in accordance with Sections H2.3 and H2.4 shall be made. This subsequent attempt
shall be delayed until ten minutes after the heat pump completes a defrost cycle. This defrost cycle should be
manually initiated, if possible, in order to avoid the delay of having to otherwise wait for the heat pump to
automatically initiate a defrost.
H2.5.4 If the “S” test procedure is suspended because of the condition in Section H2.5.1.3, then another
attempt at collecting data in accordance with Section H2 and the “S” test procedure shall be made as soon as
steady performance is attained. An automatic or manually initiated defrost cycle may occur prior to making
this subsequent attempt. If defrost does occur, the heat pump shall operate in the heating mode for at least ten
minutes after defrost termination prior to beginning the data collection described in Section H2.3. The
preconditioning requirements in Section H2.2 are not applicable when making this subsequent attempt.
H2.5.5 If the “S” test procedure is not suspended in accordance with Section H2.5.1, then the sampling
specified in Section H2.3 shall be terminated after 30 minutes of data collection. The test, for which the Table
12 test tolerances for non-frosting apply, shall be designated as a completed steady-state heating capacity test,
and shall use the average of the seven (7) samples at the reported Net Heating Capacity.
H3 “T” Test Procedure.
H3.1 Average heating Capacity shall be determined using the indoor water temperature method. The normal
outdoor-side airflow of the equipment shall not be disturbed.
H3.2 No changes in the water flow or air flow settings of the heat pumps shall be made.
H3.3 The test tolerance given in Table 12, “heat with frost,” shall be satisfied when conducting heating capacity tests
using the “T” test procedure. As noted in Table 12, the test tolerances are specified for two sub-intervals. “Heat portion”
consists of data collected during each heating interval; with the exception of the first ten minutes after defrost
termination. “Defrost portion” consists of data collected during each defrost cycle plus the first ten minutes of the
subsequent heating interval. In case of multiple refrigerant circuits, “Defrost portion” applies if any individual circuit is
in defrost cycle. The test tolerance parameters in Table 12 shall be sampled throughout the preconditioning and data
collection periods. For the purpose of evaluating compliance with the specified test tolerances, the dry-bulb temperature
of the air entering the outdoor-side shall be sampled once per minute during the heat portion and once per 20 second
intervals during the defrost portion. The water vapor content of the air entering the outdoor-side shall be sampled once
per minute. All other Table 12 “heat with frost” parameters shall be sampled at equal intervals that span five minutes
or less.
All data collected during each interval, heat portion and defrost portion, shall be used to evaluate compliance with the
Table 12 “heat with frost” tolerances. Data from two or more heat portion intervals or two or more defrost portion
intervals shall not be combined and then used in evaluating Table 12 “heat with frost” compliance. Compliance is based
on evaluating data for each interval separately.
H3.4 The test room reconditioning apparatus and the equipment under test shall be operated until equilibrium
conditions are attained, but for not less than one hour. Elapsed time associated with a failed attempt using the “S” test
procedure of Section H2 may be counted in meeting the minimum requirement for one hour of operation. Prior to
obtaining equilibrium and completing one hour of operation, the heat pump may undergo a defrost(s) cycle if
automatically initiated by its own controls.
H3.5 Once the preconditioning described in Section H3.4 is completed, a defrost cycle shall occur before data are
recorded. This defrost cycle should be manually initiated, if possible, in order to avoid the delay of having to otherwise
wait for the heat pump to automatically initiate a defrost. Data collection shall begin at the termination of the defrost
cycle and shall continue until one of the following criteria is met. If, at an elapsed time of three hours, the heat pump
has completed at least one defrost cycle per refrigerant circuit, and a defrost cycle is not presently underway, then data
collection shall be immediately terminated. If, at an elapsed time of three hours, the heat pump is conducting a defrost
cycle, the cycle shall be completed before terminating the collection of data. If three complete cycles are concluded
prior to three hours, data collection shall be terminated at the end of the third cycle, provided that each circuit in a
multiple circuit design has had at least one defrost cycle. A complete cycle consists of a heating period and a defrost
period, from defrost termination to defrost termination. For a heat pump where the first defrost cycle is initiated after
three hours but before six hours have elapsed, data collection shall cease when this first defrost cycle terminates. Data
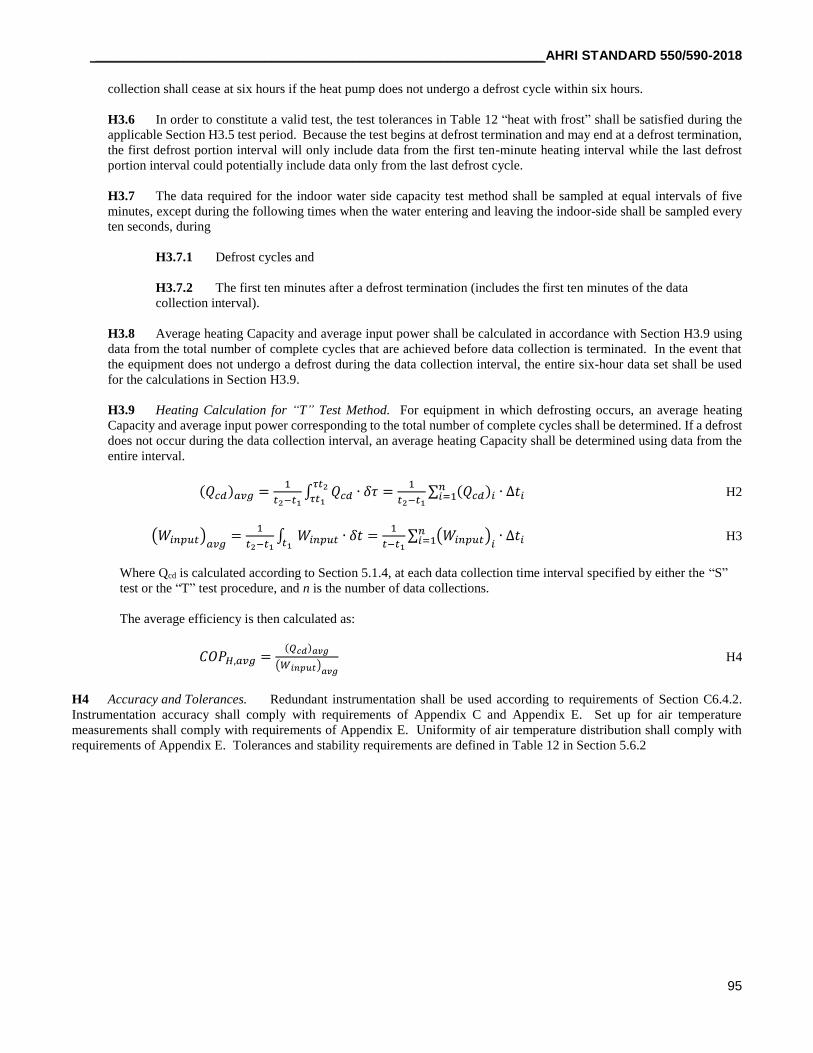
_____________________________________________________________ AHRI STANDARD 550/590-2018
95
collection shall cease at six hours if the heat pump does not undergo a defrost cycle within six hours.
H3.6 In order to constitute a valid test, the test tolerances in Table 12 “heat with frost” shall be satisfied during the
applicable Section H3.5 test period. Because the test begins at defrost termination and may end at a defrost termination,
the first defrost portion interval will only include data from the first ten-minute heating interval while the last defrost
portion interval could potentially include data only from the last defrost cycle.
H3.7 The data required for the indoor water side capacity test method shall be sampled at equal intervals of five
minutes, except during the following times when the water entering and leaving the indoor-side shall be sampled every
ten seconds, during
H3.7.1 Defrost cycles and
H3.7.2 The first ten minutes after a defrost termination (includes the first ten minutes of the data
collection interval).
H3.8 Average heating Capacity and average input power shall be calculated in accordance with Section H3.9 using
data from the total number of complete cycles that are achieved before data collection is terminated. In the event that
the equipment does not undergo a defrost during the data collection interval, the entire six-hour data set shall be used
for the calculations in Section H3.9.
H3.9 Heating Calculation for “T” Test Method. For equipment in which defrosting occurs, an average heating
Capacity and average input power corresponding to the total number of complete cycles shall be determined. If a defrost
does not occur during the data collection interval, an average heating Capacity shall be determined using data from the
entire interval.
(𝑄𝑐𝑑)𝑎𝑣𝑔 =1
𝑡2−𝑡1∫ 𝑄𝑐𝑑 ∙ 𝛿𝜏 =
1
𝑡2−𝑡1∑ (𝑄𝑐𝑑)𝑖 ∙ ∆𝑡𝑖
𝑛𝑖=1
𝜏𝑡2
𝜏𝑡1 H2
(𝑊𝑖𝑛𝑝𝑢𝑡)𝑎𝑣𝑔
=1
𝑡2−𝑡1∫ 𝑊𝑖𝑛𝑝𝑢𝑡 ∙ 𝛿𝑡 =
1
𝑡−𝑡1∑ (𝑊𝑖𝑛𝑝𝑢𝑡)
𝑖∙ ∆𝑡𝑖
𝑛𝑖=1𝑡1
H3
Where Qcd is calculated according to Section 5.1.4, at each data collection time interval specified by either the “S”
test or the “T” test procedure, and n is the number of data collections.
The average efficiency is then calculated as:
𝐶𝑂𝑃𝐻,𝑎𝑣𝑔 =(𝑄𝑐𝑑)𝑎𝑣𝑔
(𝑊𝑖𝑛𝑝𝑢𝑡)𝑎𝑣𝑔
H4
H4 Accuracy and Tolerances. Redundant instrumentation shall be used according to requirements of Section C6.4.2.
Instrumentation accuracy shall comply with requirements of Appendix C and Appendix E. Set up for air temperature
measurements shall comply with requirements of Appendix E. Uniformity of air temperature distribution shall comply with
requirements of Appendix E. Tolerances and stability requirements are defined in Table 12 in Section 5.6.2

AHRI STANDARD 550/590 (I-P)-2018
96
APPENDIX I. AVERAGING – INFORMATIVE
I1 Purpose. This appendix describes a method to average data samples collected between each time stamp for the test data
points collected in accordance with Section C6.2.1.
I2 General. Per the requirements of Section C6.2.1, averaging of data samples between each time stamp can be employed
and reported for each of the 30 or more data points required to be collected and reported at uniform time intervals. This
averaging can be performed either within hardware or software, either within the measuring instrument or a data acquisition
system, can use any method of averaging (e.g. simple moving average or a weighted moving average of trailing points), with
the requirement that the time interval across which data samples are averaged to create each data point shall not exceed 1/60
of the total test time period. If choosing to test for the minimum allowable time period of 15 minutes, then the method of
averaging shall only use samples from a time period not exceeding 15 seconds. Choosing a longer test time period allows a
longer averaging time period (e.g. a 20 minute test period allows 20 second averaging). The data samples do not need to be
recorded or reported, due to the fact that some hardware implementations of averaging (also referred to as filtering or smoothing
for some measurement instrument types) never indicate or communicate the internally collected samples. The resulting data
points are then used to calculate the mean and standard deviation in accordance with Section C3.2, for use in judging
compliance with the operating condition tolerance limit and the stability criteria found in Table 12.
I3 Examples. Two examples are provided using leaving evaporator water temperature. The sample data (raw data) shown
in Tables I1.2 and I2.2 and the summary of sample data shown in Tables I1.1 and I2.1 are provided for informational purposes
only to demonstrate the concept, even though this data is not required to be recorded or reported. Visual representations of
sample data are provided in Figures I1 and I2.
Example #1 is a data set that meets the target test condition of 44.00 °F within the operating condition tolerance limit of
±0.50 °F and stability criteria to have a standard deviation not exceeding 0.18 °F as found in Table 12 for leaving evaporator
water and cooling mode operation. Example #2 is a similar data set that does not meet the stability criteria. Both examples have
chosen to use a 20 minute test time period. The data acquisition system is capable of collecting data samples at 5 second
intervals. The maximum allowable averaging is employed by taking the average of 5 data samples collected over the trailing
20 second time period (t=0, -5, -10, -15, -20 seconds).
I3.1 Example #1. Referring to Table I1.2, the data point value 44.56 for time = 0:00:30.0 was calculated as the
average of sample values 44.51, 44.41, 44.67, 44.57, and 44.65 °F. The prior sample value of 44.28 °F was discarded
since it is outside the allowable 20 second time interval for averaging.
Table I1.1. Summary for Example #1
Item Averaging Count Mean,
°F
Standard
Deviation,
°F
Data Samples
(All Raw Data) None 246 44.33 0.20
Data Points
(Averaged Data Samples)
Simple moving average for 20 seconds
(using the trailing 5 samples) 41 44.33 0.14
For the data points, the mean value is within the operating condition tolerance interval of 44.00±0.50 °F, and the standard
deviation is within the stability criterion of less than or equal to 0.18 °F, so this test point is valid. Note that in this
example, the use of averaging significantly reduced the standard deviation.

_____________________________________________________________ AHRI STANDARD 550/590-2018
97
Table I1.2. Data for Example #1
Test Time Data
Sample
Data Point
Time Data Point
-0:00:25.0 44.68
-0:00:20.0 44.63
-0:00:15.0 44.72
-0:00:10.0 44.21
-0:00:05.0 44.66
0:00:00.0 44.54 0:00:00.0 44.55
0:00:05.0 44.28
0:00:10.0 44.65
0:00:15.0 44.57
0:00:20.0 44.67
0:00:25.0 44.41
0:00:30.0 44.51 0:00:30.0 44.56
0:00:35.0 44.29
0:00:40.0 44.52
0:00:45.0 44.66
0:00:50.0 44.46
0:00:55.0 44.70
0:01:00.0 44.63 0:01:00.0 44.59
0:01:05.0 44.58
0:01:10.0 44.53
0:01:15.0 44.44
0:01:20.0 44.37
0:01:25.0 44.29
0:01:30.0 44.42 0:01:30.0 44.41
0:01:35.0 44.41
0:01:40.0 44.53
0:01:45.0 44.30
0:01:50.0 44.77
0:01:55.0 44.26
0:02:00.0 44.71 0:02:00.0 44.51
0:02:05.0 44.54
0:02:10.0 44.37
0:02:15.0 44.36
0:02:20.0 44.56
0:02:25.0 44.35
0:02:30.0 44.48 0:02:30.0 44.42
0:02:35.0 44.59
0:02:40.0 44.38
0:02:45.0 44.49
0:02:50.0 44.75
0:02:55.0 44.27
0:03:00.0 44.57 0:03:00.0 44.49
0:03:05.0 44.70
0:03:10.0 44.42
0:03:15.0 44.37
0:03:20.0 44.23
0:03:25.0 44.51
0:03:30.0 44.32 0:03:30.0 44.37
0:03:35.0 44.31
0:03:40.0 44.30
0:03:45.0 44.70
0:03:50.0 44.69
0:03:55.0 44.62
Table I1.2. Data for Example #1 (Continued)
Test Time Data
Sample
Data Point
Time Data Point
0:04:00.0 44.46 0:04:00.0 44.55
0:04:05.0 44.45
0:04:10.0 44.28
0:04:15.0 44.68
0:04:20.0 44.44
0:04:25.0 44.61
0:04:30.0 44.57 0:04:30.0 44.52
0:04:35.0 44.70
0:04:40.0 44.63
0:04:45.0 44.31
0:04:50.0 44.27
0:04:55.0 44.29
0:05:00.0 44.51 0:05:00.0 44.40
0:05:05.0 44.58
0:05:10.0 44.41
0:05:15.0 44.63
0:05:20.0 44.57
0:05:25.0 44.23
0:05:30.0 44.16 0:05:30.0 44.40
0:05:35.0 44.35
0:05:40.0 44.31
0:05:45.0 44.16
0:05:50.0 44.22
0:05:55.0 44.16
0:06:00.0 44.30 0:06:00.0 44.23
0:06:05.0 44.26
0:06:10.0 44.63
0:06:15.0 44.11
0:06:20.0 44.41
0:06:25.0 44.20
0:06:30.0 44.10 0:06:30.0 44.29
0:06:35.0 44.15
0:06:40.0 44.17
0:06:45.0 44.49
0:06:50.0 44.47
0:06:55.0 44.53
0:07:00.0 44.08 0:07:00.0 44.35
0:07:05.0 44.34
0:07:10.0 44.12
0:07:15.0 44.38
0:07:20.0 44.05
0:07:25.0 44.22
0:07:30.0 44.08 0:07:30.0 44.17
0:07:35.0 44.24
0:07:40.0 44.47
0:07:45.0 44.46
0:07:50.0 44.55
0:07:55.0 44.13
0:08:00.0 44.39 0:08:00.0 44.40
0:08:05.0 44.41
0:08:10.0 44.40
0:08:15.0 44.35
0:08:20.0 44.36

AHRI STANDARD 550/590 (I-P)-2018
98
Table I1.2. Data for Example #1 (Continued)
Test Time Data
Sample
Data Point
Time Data Point
0:08:25.0 44.10
0:08:30.0 44.26 0:08:30.0 44.29
0:08:35.0 44.02
0:08:40.0 44.05
0:08:45.0 44.22
0:08:50.0 44.50
0:08:55.0 44.06
0:09:00.0 44.42 0:09:00.0 44.25
0:09:05.0 44.24
0:09:10.0 44.10
0:09:15.0 44.16
0:09:20.0 44.19
0:09:25.0 44.39
0:09:30.0 44.36 0:09:30.0 44.24
0:09:35.0 44.34
0:09:40.0 44.11
0:09:45.0 44.34
0:09:50.0 44.30
0:09:55.0 44.09
0:10:00.0 44.47 0:10:00.0 44.26
0:10:05.0 44.15
0:10:10.0 44.40
0:10:15.0 44.32
0:10:20.0 44.44
0:10:25.0 44.25
0:10:30.0 44.14 0:10:30.0 44.31
0:10:35.0 44.52
0:10:40.0 44.49
0:10:45.0 44.16
0:10:50.0 44.20
0:10:55.0 44.15
0:11:00.0 44.05 0:11:00.0 44.21
0:11:05.0 44.17
0:11:10.0 44.14
0:11:15.0 44.52
0:11:20.0 44.26
0:11:25.0 44.22
0:11:30.0 44.23 0:11:30.0 44.27
0:11:35.0 44.49
0:11:40.0 44.26
0:11:45.0 44.31
0:11:50.0 44.42
0:11:55.0 44.50
0:12:00.0 44.41 0:12:00.0 44.38
0:12:05.0 44.43
0:12:10.0 44.19
0:12:15.0 44.50
0:12:20.0 44.53
0:12:25.0 44.44
0:12:30.0 44.13 0:12:30.0 44.36
0:12:35.0 44.59
0:12:40.0 44.52
0:12:45.0 44.56
Table I1.2. Data for Example #1 (Continued)
Test Time Data
Sample
Data Point
Time Data Point
0:12:50.0 44.22
0:12:55.0 44.43
0:13:00.0 44.17 0:13:00.0 44.38
0:13:05.0 44.41
0:13:10.0 44.45
0:13:15.0 44.21
0:13:20.0 44.45
0:13:25.0 44.53
0:13:30.0 44.10 0:13:30.0 44.35
0:13:35.0 44.10
0:13:40.0 44.61
0:13:45.0 44.58
0:13:50.0 44.26
0:13:55.0 44.27
0:14:00.0 44.52 0:14:00.0 44.45
0:14:05.0 44.61
0:14:10.0 44.14
0:14:15.0 44.38
0:14:20.0 44.43
0:14:25.0 44.54
0:14:30.0 44.45 0:14:30.0 44.39
0:14:35.0 44.15
0:14:40.0 44.35
0:14:45.0 44.56
0:14:50.0 44.38
0:14:55.0 44.28
0:15:00.0 44.10 0:15:00.0 44.33
0:15:05.0 44.14
0:15:10.0 44.18
0:15:15.0 44.20
0:15:20.0 44.05
0:15:25.0 44.54
0:15:30.0 44.13 0:15:30.0 44.22
0:15:35.0 44.53
0:15:40.0 44.12
0:15:45.0 44.09
0:15:50.0 44.58
0:15:55.0 44.37
0:16:00.0 44.51 0:16:00.0 44.33
0:16:05.0 44.17
0:16:10.0 44.42
0:16:15.0 44.04
0:16:20.0 44.01
0:16:25.0 44.24
0:16:30.0 44.00 0:16:30.0 44.14
0:16:35.0 44.14
0:16:40.0 44.38
0:16:45.0 44.17
0:16:50.0 44.02
0:16:55.0 44.10
0:17:00.0 43.98 0:17:00.0 44.13
0:17:05.0 44.49
0:17:10.0 44.50

_____________________________________________________________ AHRI STANDARD 550/590-2018
99
Table I1.2. Data for Example #1 (Continued)
Test Time Data
Sample
Data Point
Time Data Point
0:17:15.0 44.16
0:17:20.0 44.23
0:17:25.0 44.21
0:17:30.0 43.99 0:17:30.0 44.22
0:17:35.0 44.04
0:17:40.0 44.02
0:17:45.0 44.14
0:17:50.0 44.01
0:17:55.0 44.16
0:18:00.0 44.47 0:18:00.0 44.16
0:18:05.0 44.32
0:18:10.0 44.02
0:18:15.0 43.92
0:18:20.0 44.03
0:18:25.0 43.97
0:18:30.0 44.42 0:18:30.0 44.07
0:18:35.0 43.96
Table I1.2. Data for Example #1 (Continued)
Test Time Data
Sample
Data Point
Time Data Point
0:18:40.0 44.23
0:18:45.0 43.94
0:18:50.0 43.95
0:18:55.0 44.25
0:19:00.0 44.18 0:19:00.0 44.11
0:19:05.0 44.22
0:19:10.0 44.06
0:19:15.0 44.02
0:19:20.0 44.24
0:19:25.0 44.28
0:19:30.0 44.28 0:19:30.0 44.18
0:19:35.0 44.28
0:19:40.0 43.87
0:19:45.0 44.19
0:19:50.0 44.36
0:19:55.0 44.41
0:20:00.0 44.11 0:20:00.0 44.19
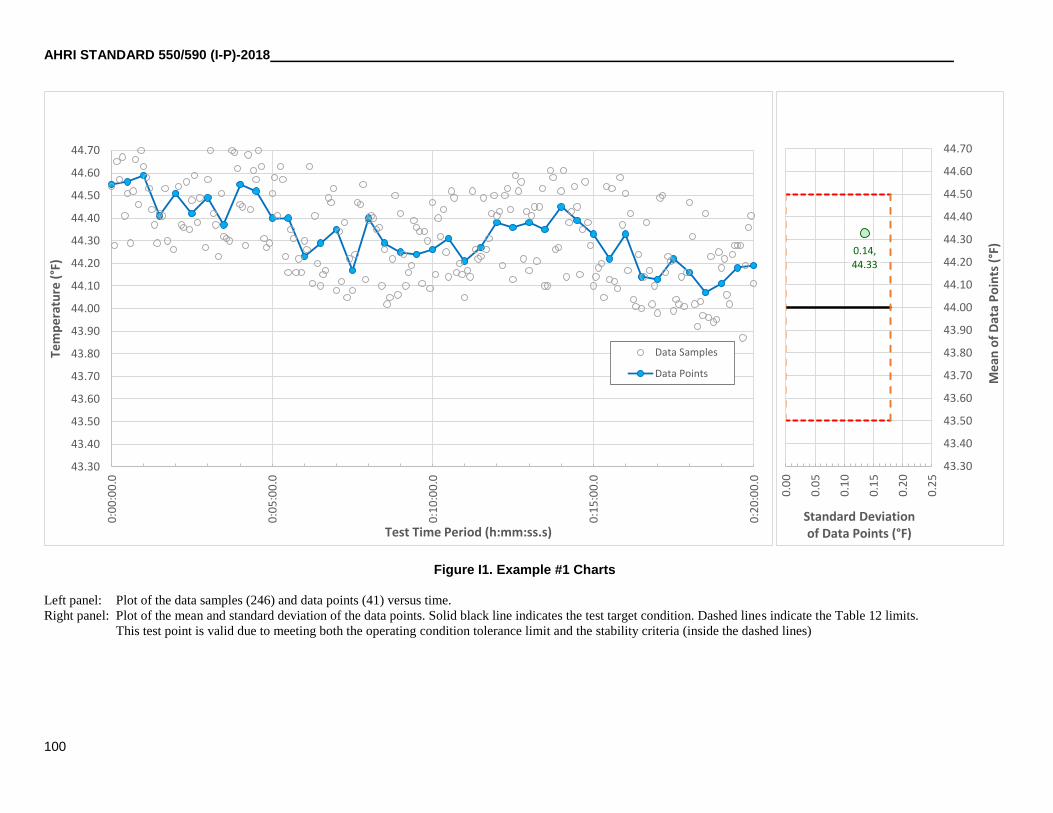
AHRI STANDARD 550/590 (I-P)-2018
100
Figure I1. Example #1 Charts
Left panel: Plot of the data samples (246) and data points (41) versus time.
Right panel: Plot of the mean and standard deviation of the data points. Solid black line indicates the test target condition. Dashed lines indicate the Table 12 limits.
This test point is valid due to meeting both the operating condition tolerance limit and the stability criteria (inside the dashed lines)
43.30
43.40
43.50
43.60
43.70
43.80
43.90
44.00
44.10
44.20
44.30
44.40
44.50
44.60
44.70
0:0
0:0
0.0
0:0
5:0
0.0
0:1
0:0
0.0
0:1
5:0
0.0
0:2
0:0
0.0
Tem
per
atu
re (
°F)
Test Time Period (h:mm:ss.s)
Data Samples
Data Points
0.14, 44.33
43.30
43.40
43.50
43.60
43.70
43.80
43.90
44.00
44.10
44.20
44.30
44.40
44.50
44.60
44.70
0.0
0
0.0
5
0.1
0
0.1
5
0.2
0
0.2
5
Mea
n o
f D
ata
Po
ints
(°F
)
Standard Deviationof Data Points (°F)

_____________________________________________________________ AHRI STANDARD 550/590-2018
101
I3.2 Example #2. Referring to Table I2.2, the data point value 44.56 for time = 0:00:30.0 was calculated as the
average of sample values 44.60, 44.45, 44.40, 44.49, and 44.85 °F. The prior sample value of 44.83 °F was discarded
since it is outside the allowable 20 second time interval for averaging.
Table I2.1. Summary for Example #2.
Item Averaging Count Mean,
°F
Standard
Deviation,
°F
Data Samples
(All Raw Data) None 246 44.11 0.26
Data Points
(Averaged Data Samples)
Simple moving average for 20 seconds
(using the trailing 5 samples) 41 44.10 0.22
While the mean value is within the operating condition tolerance interval of 44.00±0.50 °F, the standard deviation
exceeds the stability criterion of less than equal to 0.18 °F, so this test point would not be valid and would need to be
either repeated, or operation continued and a new set of test data collected. Note that in this example, the use of averaging
was not as effective as in the prior example for reducing the standard deviation, due to the water temperature change
versus time, or lack of sufficient stability.

AHRI STANDARD 550/590 (I-P)-2018
102
Table I2.2. Data for Example #2
Test Time Data
Sample
Data Point
Time Data Point
-0:00:25.0 44.47
-0:00:20.0 44.42
-0:00:15.0 44.47
-0:00:10.0 44.53
-0:00:05.0 44.70
0:00:00.0 44.49 0:00:00.0 44.52
0:00:05.0 44.83
0:00:10.0 44.85
0:00:15.0 44.49
0:00:20.0 44.40
0:00:25.0 44.45
0:00:30.0 44.60 0:00:30.0 44.56
0:00:35.0 44.80
0:00:40.0 44.57
0:00:45.0 44.41
0:00:50.0 44.40
0:00:55.0 44.70
0:01:00.0 44.68 0:01:00.0 44.55
0:01:05.0 44.50
0:01:10.0 44.40
0:01:15.0 44.33
0:01:20.0 44.79
0:01:25.0 44.63
0:01:30.0 44.37 0:01:30.0 44.50
0:01:35.0 44.63
0:01:40.0 44.54
0:01:45.0 44.39
0:01:50.0 44.58
0:01:55.0 44.30
0:02:00.0 44.66 0:02:00.0 44.49
0:02:05.0 44.32
0:02:10.0 44.51
0:02:15.0 44.72
0:02:20.0 44.29
0:02:25.0 44.28
0:02:30.0 44.70 0:02:30.0 44.50
0:02:35.0 44.50
0:02:40.0 44.44
0:02:45.0 44.38
0:02:50.0 44.60
0:02:55.0 44.43
0:03:00.0 44.41 0:03:00.0 44.45
0:03:05.0 44.60
0:03:10.0 44.24
0:03:15.0 44.32
0:03:20.0 44.34
0:03:25.0 44.52
0:03:30.0 44.50 0:03:30.0 44.38
0:03:35.0 44.21
0:03:40.0 44.47
0:03:45.0 44.30
0:03:50.0 44.29
0:03:55.0 44.22
Table I2.2. Data for Example #2 (Continued)
Test Time Data
Sample
Data Point
Time Data Point
0:04:00.0 44.39 0:04:00.0 44.33
0:04:05.0 44.20
0:04:10.0 44.22
0:04:15.0 44.32
0:04:20.0 44.17
0:04:25.0 44.40
0:04:30.0 44.45 0:04:30.0 44.31
0:04:35.0 44.04
0:04:40.0 44.07
0:04:45.0 44.03
0:04:50.0 44.23
0:04:55.0 44.04
0:05:00.0 44.27 0:05:00.0 44.13
0:05:05.0 44.10
0:05:10.0 44.34
0:05:15.0 44.31
0:05:20.0 44.16
0:05:25.0 44.34
0:05:30.0 44.09 0:05:30.0 44.25
0:05:35.0 44.35
0:05:40.0 44.07
0:05:45.0 43.91
0:05:50.0 44.18
0:05:55.0 44.17
0:06:00.0 43.92 0:06:00.0 44.05
0:06:05.0 43.93
0:06:10.0 44.11
0:06:15.0 44.07
0:06:20.0 44.30
0:06:25.0 44.06
0:06:30.0 43.91 0:06:30.0 44.09
0:06:35.0 44.28
0:06:40.0 44.25
0:06:45.0 44.18
0:06:50.0 44.07
0:06:55.0 43.87
0:07:00.0 43.86 0:07:00.0 44.05
0:07:05.0 43.87
0:07:10.0 44.23
0:07:15.0 43.86
0:07:20.0 43.87
0:07:25.0 43.87
0:07:30.0 44.17 0:07:30.0 44.00
0:07:35.0 43.83
0:07:40.0 43.94
0:07:45.0 44.00
0:07:50.0 44.03
0:07:55.0 43.89
0:08:00.0 44.13 0:08:00.0 44.00
0:08:05.0 44.06
0:08:10.0 43.76
0:08:15.0 43.98
0:08:20.0 44.09
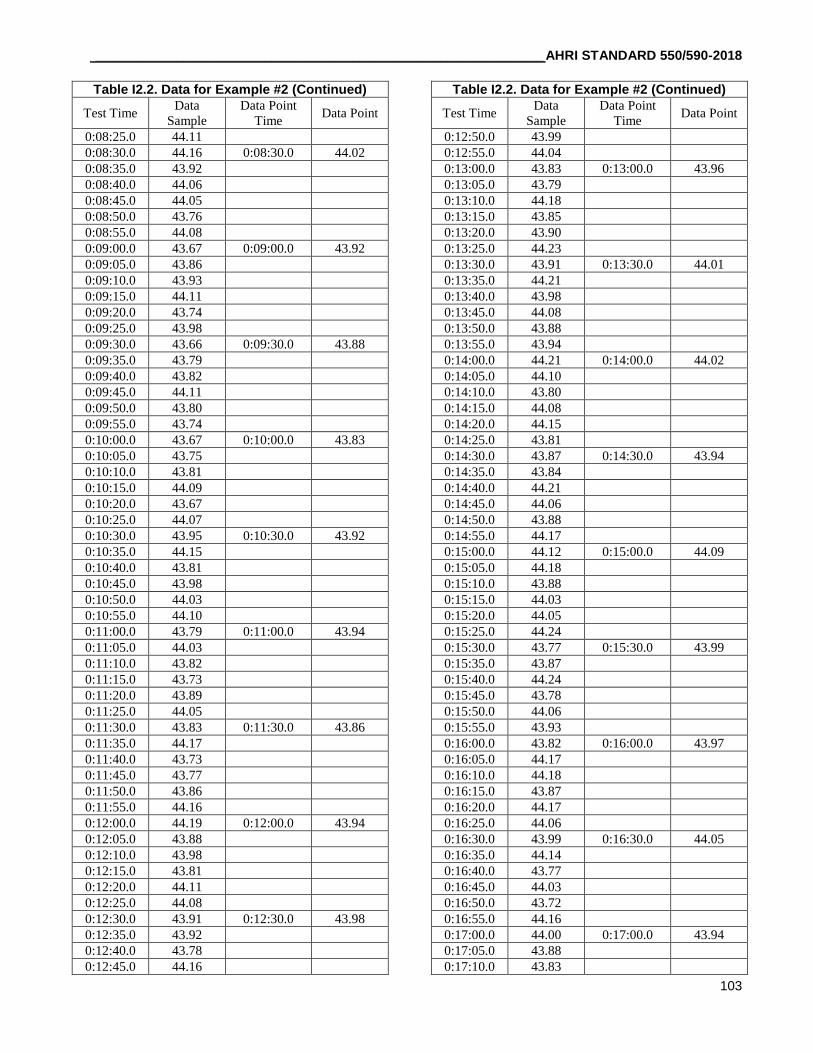
_____________________________________________________________ AHRI STANDARD 550/590-2018
103
Table I2.2. Data for Example #2 (Continued)
Test Time Data
Sample
Data Point
Time Data Point
0:08:25.0 44.11
0:08:30.0 44.16 0:08:30.0 44.02
0:08:35.0 43.92
0:08:40.0 44.06
0:08:45.0 44.05
0:08:50.0 43.76
0:08:55.0 44.08
0:09:00.0 43.67 0:09:00.0 43.92
0:09:05.0 43.86
0:09:10.0 43.93
0:09:15.0 44.11
0:09:20.0 43.74
0:09:25.0 43.98
0:09:30.0 43.66 0:09:30.0 43.88
0:09:35.0 43.79
0:09:40.0 43.82
0:09:45.0 44.11
0:09:50.0 43.80
0:09:55.0 43.74
0:10:00.0 43.67 0:10:00.0 43.83
0:10:05.0 43.75
0:10:10.0 43.81
0:10:15.0 44.09
0:10:20.0 43.67
0:10:25.0 44.07
0:10:30.0 43.95 0:10:30.0 43.92
0:10:35.0 44.15
0:10:40.0 43.81
0:10:45.0 43.98
0:10:50.0 44.03
0:10:55.0 44.10
0:11:00.0 43.79 0:11:00.0 43.94
0:11:05.0 44.03
0:11:10.0 43.82
0:11:15.0 43.73
0:11:20.0 43.89
0:11:25.0 44.05
0:11:30.0 43.83 0:11:30.0 43.86
0:11:35.0 44.17
0:11:40.0 43.73
0:11:45.0 43.77
0:11:50.0 43.86
0:11:55.0 44.16
0:12:00.0 44.19 0:12:00.0 43.94
0:12:05.0 43.88
0:12:10.0 43.98
0:12:15.0 43.81
0:12:20.0 44.11
0:12:25.0 44.08
0:12:30.0 43.91 0:12:30.0 43.98
0:12:35.0 43.92
0:12:40.0 43.78
0:12:45.0 44.16
Table I2.2. Data for Example #2 (Continued)
Test Time Data
Sample
Data Point
Time Data Point
0:12:50.0 43.99
0:12:55.0 44.04
0:13:00.0 43.83 0:13:00.0 43.96
0:13:05.0 43.79
0:13:10.0 44.18
0:13:15.0 43.85
0:13:20.0 43.90
0:13:25.0 44.23
0:13:30.0 43.91 0:13:30.0 44.01
0:13:35.0 44.21
0:13:40.0 43.98
0:13:45.0 44.08
0:13:50.0 43.88
0:13:55.0 43.94
0:14:00.0 44.21 0:14:00.0 44.02
0:14:05.0 44.10
0:14:10.0 43.80
0:14:15.0 44.08
0:14:20.0 44.15
0:14:25.0 43.81
0:14:30.0 43.87 0:14:30.0 43.94
0:14:35.0 43.84
0:14:40.0 44.21
0:14:45.0 44.06
0:14:50.0 43.88
0:14:55.0 44.17
0:15:00.0 44.12 0:15:00.0 44.09
0:15:05.0 44.18
0:15:10.0 43.88
0:15:15.0 44.03
0:15:20.0 44.05
0:15:25.0 44.24
0:15:30.0 43.77 0:15:30.0 43.99
0:15:35.0 43.87
0:15:40.0 44.24
0:15:45.0 43.78
0:15:50.0 44.06
0:15:55.0 43.93
0:16:00.0 43.82 0:16:00.0 43.97
0:16:05.0 44.17
0:16:10.0 44.18
0:16:15.0 43.87
0:16:20.0 44.17
0:16:25.0 44.06
0:16:30.0 43.99 0:16:30.0 44.05
0:16:35.0 44.14
0:16:40.0 43.77
0:16:45.0 44.03
0:16:50.0 43.72
0:16:55.0 44.16
0:17:00.0 44.00 0:17:00.0 43.94
0:17:05.0 43.88
0:17:10.0 43.83

AHRI STANDARD 550/590 (I-P)-2018
104
Table I2.2. Data for Example #2 (Continued)
Test Time Data
Sample
Data Point
Time Data Point
0:17:15.0 43.81
0:17:20.0 44.16
0:17:25.0 43.89
0:17:30.0 43.72 0:17:30.0 43.88
0:17:35.0 44.14
0:17:40.0 44.03
0:17:45.0 44.10
0:17:50.0 44.02
0:17:55.0 43.75
0:18:00.0 43.93 0:18:00.0 43.97
0:18:05.0 44.14
0:18:10.0 44.13
0:18:15.0 43.84
0:18:20.0 43.99
0:18:25.0 44.14
0:18:30.0 43.97 0:18:30.0 44.01
0:18:35.0 43.85
Table I2.2. Data for Example #2 (Continued)
Test Time Data
Sample
Data Point
Time Data Point
0:18:40.0 43.92
0:18:45.0 44.10
0:18:50.0 44.04
0:18:55.0 43.82
0:19:00.0 43.96 0:19:00.0 43.97
0:19:05.0 44.00
0:19:10.0 43.98
0:19:15.0 43.89
0:19:20.0 43.81
0:19:25.0 43.78
0:19:30.0 43.77 0:19:30.0 43.85
0:19:35.0 43.76
0:19:40.0 44.07
0:19:45.0 44.03
0:19:50.0 44.13
0:19:55.0 43.97
0:20:00.0 44.14 0:20:00.0 44.07

_________________________________________________________________________________________________ AHRI STANDARD 550/590-2018
105
Figure I2. Example #2 Charts Left panel: Plot of the data samples (246) and data points (41) versus time.
Right panel: Plot of the mean and standard deviation of the data points. Solid black line indicates the test target condition. Dashed lines indicate the Table 12 limits.
This test point is invalid due to not meeting the stability criteria (outside the dashed line
43.30
43.40
43.50
43.60
43.70
43.80
43.90
44.00
44.10
44.20
44.30
44.40
44.50
44.60
44.70
0:0
0:0
0.0
0:0
5:0
0.0
0:1
0:0
0.0
0:1
5:0
0.0
0:2
0:0
0.0
Tem
per
atu
re (
°F)
Test Time Period (h:mm:ss.s)
Data Samples
Data Points
0.22, 44.10
43.30
43.40
43.50
43.60
43.70
43.80
43.90
44.00
44.10
44.20
44.30
44.40
44.50
44.60
44.70
0.0
0
0.0
5
0.1
0
0.1
5
0.2
0
0.2
5
Mea
n o
f D
ata
Po
ints
(°F
)
Standard Deviationof Data Points (°F)