2018 LMR Negotiated Cattle Market
26
2018 LMR Negotiated Cattle Market Confidentiality in the negotiated cattle market, 0-14 day delivered negotiated cattle market, and reporting regions.
Transcript of 2018 LMR Negotiated Cattle Market

2018 LMR Negotiated Cattle Market
Confidentiality in the negotiated cattle market,
0-14 day delivered negotiated cattle market, and reporting regions.

3/70/20 Confidentiality GuidelineThe 3/70/20 confidentiality guideline requires the following three conditions:
At least three reporting entities need to provide data at least 50% of the time over the most recent 60‐day time period.
No single reporting entity may provide more than 70% of the data for a report over the most recent 60‐day time period.
No single reporting entity may be the sole reporting entity for an individual report more than 20% of the time over the most recent 60‐day time period.
The Livestock Mandatory Reporting Act of 1999 requires USDA to publish mandatory data on livestock and meat price trends, contracting arrangements, and supply and demand conditions in a manner that protects the identity of reporting entities and preserves the confidentiality of proprietary transactions.
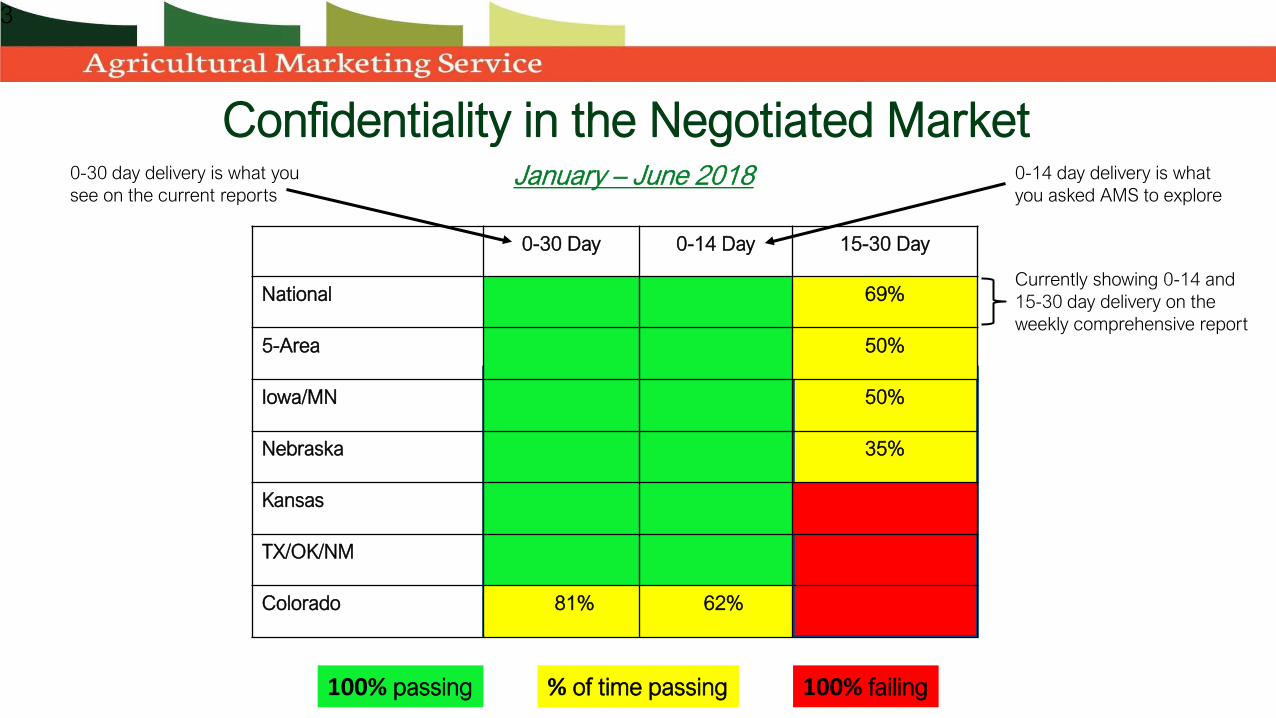
Confidentiality in the Negotiated Market
0-30 Day 0-14 Day 15-30 Day
National 69%
5-Area 50%
Iowa/MN 50%
Nebraska 35%
Kansas
TX/OK/NM
Colorado 81% 62%
% of time passing
January – June 2018
100% passing 100% failing
3
0-30 day delivery is what you see on the current reports
0-14 day delivery is what you asked AMS to explore
Currently showing 0-14 and 15-30 day delivery on the weekly comprehensive report

Average Number of Firms per Week
0-30 Day 0-14 Day 15-30 Day
National 7.27 7.11 3.46
5-Area 7.27 7.11 3.35
Iowa/MN 6.76 6.51 2.68
Nebraska 6.24 5.92 2.32
Kansas 4.32 4.32 0.84
TX/OK/NM 3.03 2.97 0.41
Colorado 2.65 2.57 0.65
January – June 2018
Passing Occasionally Passing Failing
4

2005Jan - June
2018
Cash 55.8% 26.2%
Formula 31.9% 63.0%
Forward Contract
4.6% 8.1%
Negotiated Grid
7.7% 2.7%
20
25
30
35
40
45
50
55
60
65
2005 2018
55.8%
26.2%
31.9%
63.0%
5-Area Purchase Type Changes
Cash Formula
Shift in 5-area Purchase Types

Negotiated Cash Purchase Type Shift
Regions 2005 2018
National 52.1% 25.4%
5-Area 55.8% 26.2%
Iowa/ MN 73.9% 57.8%
Nebraska 64.6% 43.0%
Kansas 50.6% 19.7%
TX/OK/NM 47.2% 6.7%
Colorado 51.8% 13.5%
Change
-26.7
-29.6
-16.1
-21.6
-30.9
-40.5
-38.35
15
25
35
45
55
65
75
2005 2018
Negotiated Cash Purchase Type Trends
National 5-Area Iowa/MN Nebraska
Kansas TX/OK/NM Colorado
*January – June 2018

Formula Purchase Type Shift
Regions 2005 2018
National 33.2% 60.0%
5-Area 31.9% 63.0%
Iowa/ MN 7.2% 21.3%
Nebraska 18.3% 43.3%
Kansas 44.8% 74.9%
TX/OK/NM 42.2% 84.8%
Colorado 30.1% 74.5% 5
15
25
35
45
55
65
75
2005 2018
Formula Purchase Type Trends
National 5-Area Iowa/MN Nebraska
Kansas TX/OK/NM Colorado
Change
26.8
31.1
14.1
25.0
30.1
42.6
44.4
*January – June 2018

15-30 Day Delivery Data
0-14 day delivery volumes are generally larger than 15-30 day delivery volumes
5-area regions occasionally show greater 15-30 day delivery volumes
Area 15-30 Portion of 0-30 Trade
National 18%
TX/OK/MN 6%
KS 4%
NE 26%
CO 17%
IA/MN 21%
SD 25%
WY 5%
IL 4%
*January – June 2018
27%percent of time 15-30 day delivery traded at a premium ($) to 0-14 day delivery purchases
*from 2017 to June 2018 on weekly basis.

5-Area Potential Changes

Current 5-Area Regions
MN
IANE
KSCO
NMOK
TX

Potential 3-Area Regions
Northern Plains
Western Cornbelt
Southern Plains
MN
IA
IL
SDWY
CO
NE
KS
NMOK
TX

Average Number of Firms per Week
Region 0-30 Day 0-14 Day 15-30 Day
IA/MN 6.76 6.51 2.68
IA/MN/SD/IL 7.11 6.86 2.81
Nebraska 6.24 5.92 2.32
Colorado 2.65 2.57 0.65
NE/CO/WY 6.27 5.95 2.43
Kansas 4.32 4.32 0.84
TX/OK/NM 3.03 2.97 0.41
KS/TX/OK/NM 4.38 4.38 1.03
January – June 2018
Passing
Occasionally Passing
Failing
*current region
*
**
**

South Dakota Data

South Dakota Harvested Crops
0
1
2
3
4
5
6
2.55 1.75
3.4
5.5 5.6
2.3
Millions of Acres
Harvested
Corn Soybeans Wheat1993
2017

South Dakota Field Crop Totals
2017: 23,687,000 acres planted
1993: 15,231,000 acres planted

South Dakota
South Dakota recorded nearly 691,000 head of live cattle in 2017 via LMR.
310,000 head were negotiated cash purchases
305,000 head reported from January - June 2018
percent increase of 5-Area volume by adding South Dakota (using 2017 data)6.4%

South Dakota Purchase Type Percentages
2017
Cash 44.8%
Formula 29.4%
Forward Contract 16.7%
Negotiated Grid 9.1%
2018
56.0%
26.8%
10.1%
7.1%

Wyoming Data
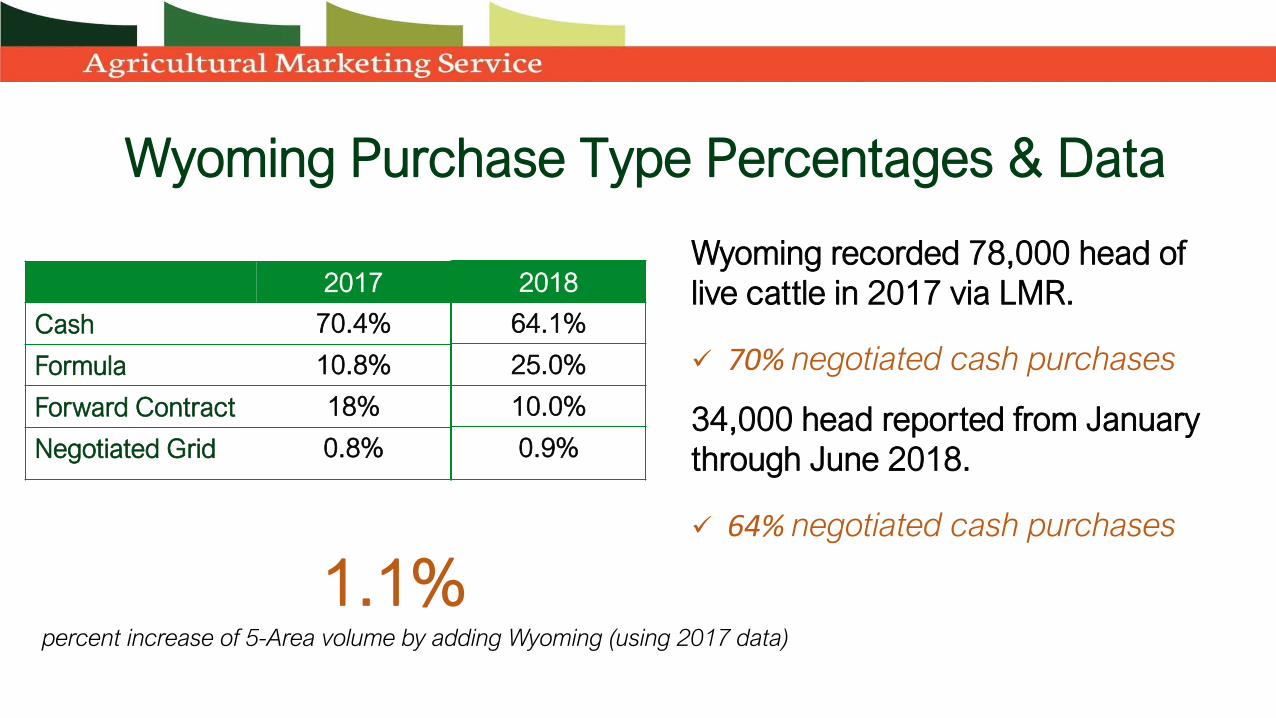
Wyoming Purchase Type Percentages & Data
2017
Cash 70.4%
Formula 10.8%
Forward Contract 18%
Negotiated Grid 0.8%
2018
64.1%
25.0%
10.0%
0.9%
Wyoming recorded 78,000 head of live cattle in 2017 via LMR.
70% negotiated cash purchases
34,000 head reported from January through June 2018.
64% negotiated cash purchases
percent increase of 5-Area volume by adding Wyoming (using 2017 data)
1.1%
Illinois Data

Illinois Data
Illinois recorded 246,255 head of live cattle in 2017 via LMR.
104,183 head were negotiated cash purchases
133,862 head reported from January - June 2018
percent increase of 5-Area volume by adding Illinois (using 2017 data)
2.1%
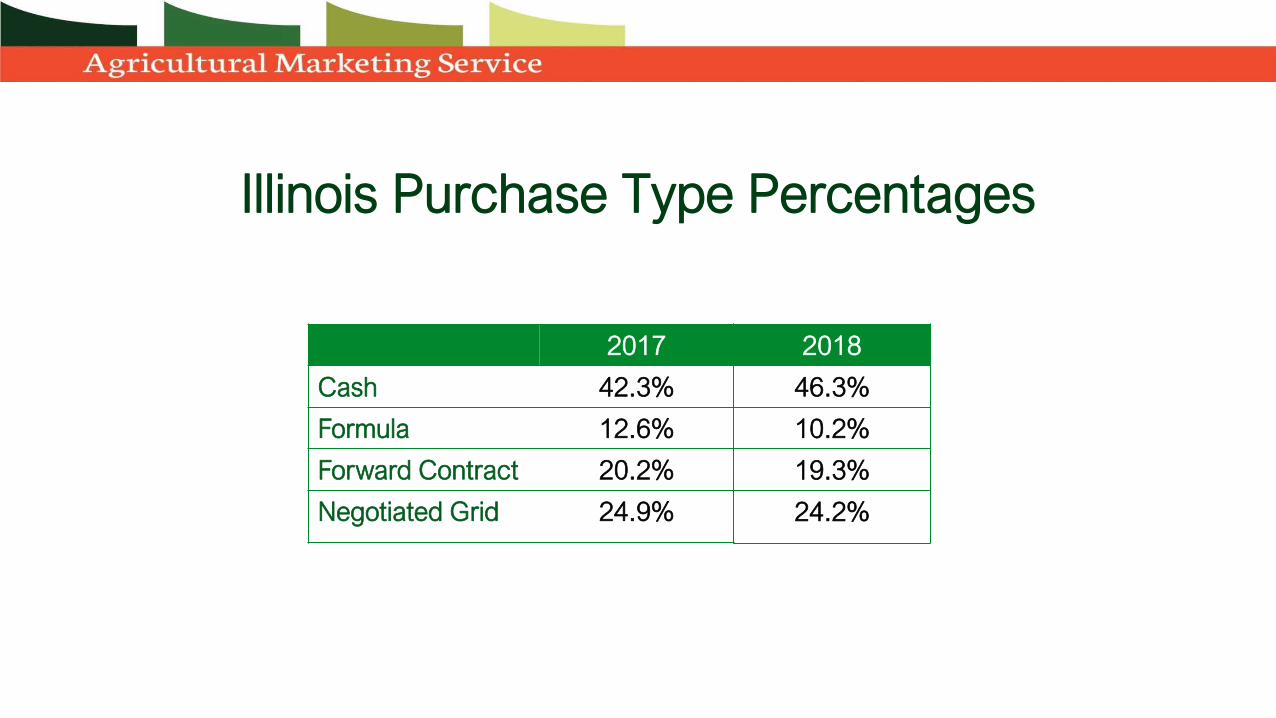
Illinois Purchase Type Percentages
2017
Cash 42.3%
Formula 12.6%
Forward Contract 20.2%
Negotiated Grid 24.9%
2018
46.3%
10.2%
19.3%
24.2%

Price Comparison of Region/States6 Month Average
PriceDifference Average Weekly
Spread From 5-Area
5-Area $121.25 $0.00 $0.00
Iowa/MN $121.91 $0.66 $0.76
Nebraska $121.13 -$0.12 $0.23
Kansas $121.12 -$0.14 $0.31
TX/OK/NM $121.20 -$0.05 $0.41
Colorado $121.03 -$0.22 $0.69
South Dakota $120.99 -$0.26 $0.60
Wyoming $121.50 $0.24 $0.90
Illinois $122.38 $1.13 $1.29
*January – June 2018

Grading Percent Choice or Higher
National 78.69%
5-Area 78.03%
Iowa/MN 85.77%
Nebraska 82.83%
Kansas 80.76%
TX/OK/NM 70.23%
Colorado 81.87%
South Dakota 85.01%
Wyoming 82.64%
Illinois 91.21%
* Beef Type, Formula Net, Contract Net, and Grid Nets
*January - June 2018

5-Area Volume Increase Adding Illinois, South Dakota, & Wyoming increases negotiated volume in the current 5-Area by
almost 10%!
There were 4,872,899 head of negotiated cattle reported via LMR in the 5-Area in 2017.
Negotiated Increase
Illinois 104,183 2.1%
South Dakota 310,000 6.4%
Wyoming 54,600 1.1%
Total 468,783 9.6%
*based on 2017 data.

Taylor Cox
Field Chief
Livestock, Poultry, and Grain Market News Division
USDA Agricultural Marketing Service
515.323.2261 | [email protected]