2018 Financial Report - ISO Ne
54
2018 Financial Report © ISO New England Inc. MAY 31, 2019 ISO-NE PUBLIC
Transcript of 2018 Financial Report - ISO Ne

2018 Financial Report © ISO New England Inc. MAY 31, 2019
ISO-NE PUBLIC


2018 Financial Report page iii ISO-NE PUBLIC
Contents
Figure .................................................................................................................................................................... 4
Tables .................................................................................................................................................................... 4
Letter from the CEO ............................................................................................................................................... v
Management’s Discussion and Analysis ................................................................................................................. 1
The Company............................................................................................................................................................. 1
Current Environment ................................................................................................................................................. 1
Critical Accounting Estimates .................................................................................................................................... 2
Accounting Policies .................................................................................................................................................... 2
Tariff Recovery .......................................................................................................................................................... 3
Liquidity and Capital Resources................................................................................................................................. 4
Regulatory Update .................................................................................................................................................... 5
Federal Update ...................................................................................................................................................... 5
States Update ........................................................................................................................................................ 7
Financial Data ............................................................................................................................................................ 8
Results of Actual Operations ..................................................................................................................................... 8
Capital Spending ...................................................................................................................................................... 10
Price-Responsive Demand ................................................................................................................................... 11
Energy Management Platform 3.2 Upgrade Part I .............................................................................................. 11
Energy Storage Device Phase I ............................................................................................................................. 11
Energy Market Offer Caps (Order 831) ................................................................................................................ 12
CIMNET Simultaneous Feasibility Test with Data-Transfer Enhancements ......................................................... 12
Internal Market Monitoring Data Analysis Phase II ............................................................................................. 13
Forward Capacity Market Pay for Performance .................................................................................................. 13
Streamline Asset Registration Phase III ............................................................................................................... 13
Competitive Auctions with Sponsored Policy Resources ..................................................................................... 14
Software Development Costs .............................................................................................................................. 14
Nonproject Hardware and Software Costs .......................................................................................................... 14
Risks ......................................................................................................................................................................... 14
Interest Rates ....................................................................................................................................................... 15
Litigation .............................................................................................................................................................. 15
Cybersecurity ....................................................................................................................................................... 15
Energy-Security Challenges ................................................................................................................................. 16
Billing and Credit ..................................................................................................................................................... 17

2018 Financial Report page iv ISO-NE PUBLIC
Various Market Services and Participation Data ..................................................................................................... 19
Management’s Responsibility for Financial Reporting ........................................................................................ 21
Figure Figure 1: Annual historical market-clearing activity, 1997 to 2018 ($ thousands). ............................................. 20
Tables Table 1 Actual Amounts ($ Millions) and Percentages of Total Expenses for the Years Ending
December 31, 2018 and 2017 .................................................................................................................. 8
Table 2 Key Settlement Market Information, 2018 and 2017 ($ Millions, MWh) .............................................. 19
2018 Financial Statements

2018 Financial Report page v ISO-NE PUBLIC
Letter from the CEO ISO New England is pleased to issue its 2018 Financial Report. As the not-for-profit Regional Transmission Organization for New England, the ISO measures success by our ability to deliver high-quality service within a framework of fiscal responsibility and best practices.
This document includes a summary of last year’s operations and our financial position, as well as our financial statements audited by independent public accounting firm KPMG LLP. In addition to discussing the complex day-to-day operations we perform in service to the region, this report reflects expenditures for our extensive project work identified through a rigorous annual budgeting process. This process involves iterative input from New England state agencies and the New England Power Pool (NEPOOL), strong oversight from the ISO Board of Directors, and review and approval by the Federal Energy Regulatory Commission (FERC) (see www.iso-ne.com/budget). Some of these refinements and enhancements help address ongoing changes in and challenges to the region’s electric power system, while others facilitate informed participation or introduce technological innovations and efficiencies that help the ISO provide even more value for the region. The ISO’s annual Regional Electricity Outlook (www.iso-ne.com/reo) explores many of these issues.
Highlights of our efforts in 2018 include the successful completion of several major market enhancements, including the development and design of market rules to fully integrate demand-response resources into the energy and reserve markets; Forward Capacity Market pay-for-performance design improvements that reward or penalize the capacity resource based on the energy or the reserves it supplies during periods of system stress; and, in early 2019, the Competitive Auctions with Sponsored Policy Resources project, an initiative to accommodate publicly funded power resources while maintaining competitive capacity market pricing. The Energy Storage Device project, also completed in early 2019, enables electric storage facilities to participate in the energy and reserve markets as dispatchable resources.
Energy security, the integration of renewables and other new resources, and regional transmission planning are key objectives for 2019. The ISO will work on developing market designs to mitigate energy-security concerns, enhance grid modeling and forecasting of emerging technologies, conduct a transmission needs assessment for the Boston area, and continue to shore up cybersecurity.
On behalf of ISO New England, I thank the market participants, federal and state officials, and other electricity stakeholders for their participation in a productive 2018 and look forward to the work ahead. In light of our rapidly evolving industry, your collaborative spirit and support is instrumental to the ISO’s mission of ensuring the reliable supply of electricity that undergirds the region’s prosperity and progress.
Sincerely,
Gordon van Welie
President and Chief Executive Officer


2018 Financial Report Page 1 ISO-NE PUBLIC
Management’s Discussion and Analysis The Company
ISO New England Inc. (ISO) is a Regional Transmission Organization serving Connecticut, Maine, Massachusetts, New Hampshire, Rhode Island, and Vermont. The ISO meets the electricity demands of the region’s economy and people by fulfilling three primary responsibilities:
• Reliably plan and operate New England’s bulk electric power system, economically dispatching and directing the generation and flow of electricity minute-to-minute across the region’s interstate high-voltage transmission lines, thereby ensuring the constant availability of electricity for consumers
• Develop and administer New England’s competitive wholesale electricity markets that provide reliability and efficiency benefits for consumers
• Manage comprehensive, long-term bulk electric power system planning that considers and incorporates federal and state policies
The ISO is an entity organized as a nonstock corporation under the General Corporation Law, as amended, of the State of Delaware. The US Internal Revenue Service recognizes the company as an organization described in Internal Revenue Code (IRC) 501(c)(3) and is generally exempt from income taxes under IRC Section 501(a).
On January 13, 2014, the ISO, along with several Eastern Interconnection reliability coordinators (RC) became a member of a newly formed entity, Eastern Interconnect Data Sharing Network, Inc. (EIDSN).1 EIDSN is a 501(c)(6) nonstock, nonprofit corporation established to, among other things, facilitate the secure, consistent, effective, and efficient sharing of important electric transmission and operational data among and between its members and other applicable parties to help improve electricity industry operations and promote the reliable and efficient operation of the Eastern Interconnection.2
Current Environment
ISO New England has identified its priorities for 2019 and beyond that correspond to its three core objectives. The ISO fulfills these responsibilities while ensuring that its business operations are well managed, cost effective, and responsive to New England’s market participants, state officials, and other electricity stakeholders.
Projects and initiatives for 2019 will encompass three major strategic areas: reliable operations, wholesale electricity markets, and comprehensive bulk power system planning. Many are specifically related to the
1 According to the North American Reliability Corporation (NERC) a reliability coordinator is an entity with the highest level of authority for reliably operating the bulk electric power system, including the authority to prevent or mitigate emergency operating situations in next-day and real-time operations. The ISO has registered with NERC as an RC and is responsible for complying with NERC standards applicable to an RC. 2 The Eastern Interconnection is one of two major AC power grids in North America spanning from central Canada eastward to the Atlantic coast (excluding Québec), south to Florida, and west to the foot of the Rocky Mountains (excluding most of Texas—the portion in the Electric Reliability Corporation of Texas) that, during normal system conditions, interconnects transmission and distribution infrastructure and operates at a synchronized frequency of 60 Hz average. The Eastern Interconnection connects to the Western Interconnection, the Texas Interconnection, and the Québec Interconnection generally through numerous high-voltage DC transmission lines.
2018 Financial Report Page 2 ISO-NE PUBLIC
following near-term challenges to the power system: fuel-delivery systems and energy security for power system operations, active participation in setting and meeting regional and national reliability and cyber standards, and the integration of the various flexible resources coming into the system as technology emerges. Incorporating these strategic areas of focus, the ISO’s major projects and initiatives in 2019 will address the following:
• Forward Capacity Market (FCM) and other market reforms:
o Nested export-constrained capacity zones
• Competitive auctions with subsidized policy resources
o Improved efficiency to integrate state policies
o Retirement of resources
• Energy security
o Enhanced by the development of new products in the markets
• Impact of grid modeling and forecasting from emerging technologies, including energy-storage devices, energy efficiency, photovoltaics, and wind
• Federal Energy Regulatory Commission (FERC) Order No. 10003
• Cybersecurity enhancements
o FERC’s supply-chain-risk initiative
o Participation with national and regional entities
Critical Accounting Estimates
The ISO’s management team must conduct the following tasks to prepare the company’s financial statements in conformity with accounting principles generally accepted in the United States:
• Make estimates and assumptions that affect the reported amounts of assets and liabilities
• Disclose contingent assets and liabilities on the date of the financial statements
• Report the amounts of revenues and expenses during the reporting period.
Significant items subject to such estimates and assumptions include the useful lives of fixed assets; pension and postretirement benefits, including earnings rates, discount rates, healthcare cost trends, and reserve for employee-benefit obligations; and other contingencies.
Accounting Policies
The ISO implemented Sarbanes-Oxley 302 (SOX 302) compliance in 2003. SOX 302 is a set of internal procedures designed to ensure accurate financial disclosure, as well as the disclosure of material information
3 Third Order No. 1000 Regional Compliance Filing of ISO New England Inc. and the Participating Transmission Owners Administrative Committee, Docket No, ER13-193-___ (May 18, 2015), http://www.iso-ne.com/static-assets/documents/2015/05/er13-196-004.pdf and http://www.iso-ne.com/static-assets/documents/2015/05/er13-193-005.pdf. FERC, Order on Compliance Filings (May 17, 2013), http://www.iso-ne.com/static-assets/documents/regulatory/ferc/orders/2013/may/er13_193_er13_196_5_17_13_order_on_order_1000_compliance_filings.pdf.

2018 Financial Report Page 3 ISO-NE PUBLIC
about the ISO, to its signing officers. In 2009, the ISO added a critical vendor matrix to its SOX 302 disclosure. This matrix, prepared by the ISO’s vice president of Information Services and chief operating officer (COO), identifies those companies that provide very specialized goods or services to the ISO. The critical vendor matrix identifies the risk, as well as a mitigation plan for the risk, where applicable. The ISO also developed disclosure checklists, which represent the essential internal controls for maintaining financial accuracy. Department managers, senior officers, and the ISO’s chief executive officer (CEO) complete these disclosure checklists quarterly. The ISO’s chief financial officer (CFO) reports the results of the disclosures and matrices quarterly to the Audit and Finance Committee of the ISO’s board of directors. The Audit and Finance Committee must review the SOX 302 disclosure before the release of the quarterly unaudited financial statements.
In 2010, the ISO implemented a modified Sarbanes-Oxley 404 (SOX 404) compliance process to complement the SOX 302 procedures. For SOX 404 compliance, the ISO evaluates the control environment associated with financial reporting. To perform this evaluation, the ISO developed a principle evaluation matrix, which contains specific questions covering each of the seven principles that address the control environment component of guidance from the Committee of Sponsoring Organizations of the Treadway Commission (COSO).4 Key individuals in the company complete the matrix annually, and the CEO and CFO review it for completeness and effectiveness. In addition, the ISO’s director of Finance and Accounting annually assesses the Statement of Financial Position and the Statement of Activities to measure the risk of fraud, control, and various other risk profiles that certain accounts and activities have. The CEO and CFO review the results of the risk assessment and make recommendations for additional controls, as needed.
Tariff Recovery
Each year since its inception, the ISO has filed a new tariff with FERC to recover its operating costs and fund its capital expenditure program for the subsequent year. The ISO’s funding-recovery process is defined in Section IV of the ISO New England Inc. Transmission, Markets, and Services Tariff (ISO tariff).5 The funding-recovery process begins with the development of the annual budgets, which ultimately become the revenue requirement collected under Section IV.A, Recovery of ISO Administrative Expenses, of the ISO tariff and the anticipated capital expenditures. In preparing the budgets, the ISO executes a rigorous process to ensure that the budgets submitted to stakeholders for review and to FERC for approval align with the ISO’s initiatives and goals and are just and reasonable.
The ISO’s budgets are based on business plan initiatives the ISO sets for the coming five years. Senior management begins to develop the business plan at the start of the year preceding the budget year. The ISO reviews the plan with the ISO board of directors and stakeholders in the spring and early summer before establishing the budgets. The ISO meets with and obtains feedback from the New England Power Pool (NEPOOL), New England Conference of Public Utilities Commissioners (NECPUC), New England States Committee on Electricity (NESCOE), other state officials, and other interested stakeholders.
In July of each year, the ISO’s department managers submit their budgets based on the business plan. Senior managers, including the CFO and CEO, review the budgets, which are then adjusted as needed. The ISO
4 The Committee of Sponsoring Organizations of the Treadway Commission is a joint initiative of the American Accounting Association, American Institute of Certified Public Accountants, Financial Executives International, American Association of Accountants and Financial Professionals in Business, and Institute of Internal Auditors, which develop frameworks and guidance on enterprise risk management, internal control, and fraud deterrence; see https://www.coso.org. 5 ISO New England Inc. Transmission, Markets, and Services Tariff (ISO tariff), Section IV (2014), www.iso-ne.com/participate/rules-procedures/tariff.

2018 Financial Report Page 4 ISO-NE PUBLIC
prepares a comprehensive presentation for review and amendment by the ISO’s Board Audit and Finance Committee. The presentation includes information on the budget process, new initiatives, summarized budget data, budget details, depreciation and interest rates, the capital budget (with explanations for each project), cash flow and pro forma financial projections for future years, and a comparison of cost data and services provided by other Independent System Operators and Regional Transmission Organizations.
The budgets are presented in August to the NEPOOL Budget and Finance Subcommittee for review, input, and recommendation to the NEPOOL Participants Committee, which reviews and votes on the budgets at its October meeting. During this August-to-October timeframe, the ISO solicits input on the budgets from state officials. The ISO’s full board of directors then must approve the budgets in October of each year before considered complete and ready for filing with FERC.
The administrative costs budget and the capital budget recommended by the NEPOOL Participants Committee and approved by the ISO board of directors provide the basis for Section IV.A of the ISO tariff filed with FERC on or before November 1 of each year. Pursuant to Section IV.A, the ISO recovers its operating costs through the following three tariff schedules:
• Schedule 1—Scheduling, System Control, and Dispatch Service
• Schedule 2—Energy Administration Service
• Schedule 3—Reliability Administration Service
Each year during the tariff development process, department managers allocate their budgeted costs by activity, with each activity having an allocation to one, two, or all three of the tariff schedules. This process allows the ISO to categorize the applicable year’s budget according to the three tariff schedules. The costs applicable to each schedule or set of activities become the revenue requirement for that schedule. To arrive at billable rates, the costs are then allocated to market participants on the basis of the billing determinants for each schedule’s revenue requirements. The billing determinants are based on both volumetric and transactional units, depending on the schedule.
Because actual costs will vary from the budgeted costs, as well as the projected billing determinants, Section IV.A of the ISO tariff contains a true-up provision. The ISO records any over- or undercollection as a deferred charge or a regulatory liability, and the adjustment for the true up increases or decreases the cost recovery in a subsequent tariff filing.
Liquidity and Capital Resources
As a nonstock, nonprofit organization, the ISO has neither equity nor any accumulated reserves. The creditworthiness of the ISO is based on the ISO tariff, which allows recovery of costs, including debt service costs. To fund its working capital needs, the ISO has a $20 million line of credit provided by a bank. In addition, to support shortfall payments under the ISO New England Billing Policy (Exhibit ID of the ISO tariff), the ISO has a $4 million line of credit provided by a bank. In June 2018, the ISO refinanced the expiring lines of credit for a new three-year term, which will expire on July 1, 2021. Section IV.B, Capital Funding Arrangements, of the ISO tariff is the backstop to all the ISO’s borrowings in the event of any acceleration of debt repayments.
In 2018, the ISO’s five-year projection (reviewed and updated in 2018) of funding for future capital expenditures remained in place. The program includes funding for an average of $25 to $28 million in capital spending for the next five years.

2018 Financial Report Page 5 ISO-NE PUBLIC
The ISO reviewed many available financing options for meeting the needs of the spending program in a cost-effective manner and consequently discontinued its practice of securing new term-loan debt each year. By issuing longer-term private-placement notes, the ISO saves the cost of borrowing new money each year, as well as the cost of filing with FERC, and instills budgetary discipline in the capital expenditure program.
The ISO currently has two private-placement, fixed-rate note issuances totaling $50 million.
In 2012, the ISO issued $11 million in 12-year, private-placement, fixed-rate notes (expiring in 2024) to provide funding to support the capital project program. The additional $11 million in notes issued was a result of increased project work arising from the stakeholder process and regulations, as well as longer project-implementation lead times due to increased complexity. These notes were in addition to the then existing $39 million of private-placement, fixed-rate notes, expiring in September 2014. The $39 million of private-placement, fixed-rate notes that expired in 2014 were replaced for the same amount ($39 million); the new notes will expire in 2024.
The continued issuance of private-placement notes aligns with the ISO’s philosophy of budgetary discipline and saving the cost of new borrowings each year. As the ISO places projects in service and the projects begin to depreciate, the ISO recovers the depreciation expense under Section IV.A of the ISO tariff, and the recovered expense becomes available for funding future capital spending requirements.
In 2005, the ISO secured $45.5 million of tax-exempt debt to finance its new master control center and renovate and consolidate its existing office facilities. The debt comprises multimode variable-rate civic-facility revenue bonds, which reprice weekly. The Massachusetts Development Finance Agency issued the bonds, which the ISO will be repaying over 25 years; principal repayments began in May 2007. The weighted average cost of the debt for 2018, including the direct-pay letter of credit, was 1.75%.
In 2012, the ISO secured $36 million of tax-exempt debt to finance the construction of its new backup control center (BCC). The new BCC was fully operational in May 2014. The debt comprises multimode variable-rate civic-facility revenue bonds, which reprice weekly. Connecticut Innovations Incorporated issued the bonds. Principal repayments began in November 2014, with a redemption payment of $1,350,000, in addition to the regularly scheduled principal payments because the project completed under budget. The weighted average cost of the debt for 2018, including the direct-pay letter of credit, was 1.75%.
Regulatory Update
Federal Update
The November 2018 elections resulted in no change in the majority in the US Senate; however, in the US House of Representatives, the Democrats won back the majority and thereby control the policy agenda and discussions on energy. This change ushered all 21 Democratic members of New England’s House delegation into the new majority and elevated two senior members to influential positions. Congressmen Richard Neal (MA-1) and James McGovern (MA-2) ascended to chair the House Ways and Means and Rules Committees, respectively.
The House Energy and Commerce Committee is likely to continue to take the lead on energy policy, including issues impacting the bulk power system and FERC. Although a variety of committees (including Natural Resources and Science, Space, and Technologies) may conduct oversight hearings on issues such as climate change, the Energy and Commerce Committee will continue to assert jurisdiction over most electricity-related issues. A revived select committee is expected to discuss climate-change-related issues but does not have the ability to subpoena witnesses and lacks jurisdiction or ability to author or pass legislation.
2018 Financial Report Page 6 ISO-NE PUBLIC
One electricity-related matter finalized in 2018 was legislation—signed into law in October—spurred by the results of New England’s 8th Forward Capacity Auction (FCA 8) in 2014. The Fair RATES Act, authored by Congressman Joe Kennedy (D-MA), modified the Federal Power Act to create a process for appeal when “inaction” by FERC allows a rate increase to take effect.6 FERC’s 2–2 deadlock on the results of FCA 8 allowed the auction results to move forward without definitive approval or denial by the commission. The legislative text from the Fair RATES Act, which had passed the House in prior sessions of Congress, was inserted into a mostly-unrelated water resources bill that received strong Congressional support.
The cyber and physical security of the electric power grid is likely to continue to receive widespread attention on Capitol Hill. However, in the recent past, much of the cyber-related legislation (and discussion at a number of cybersecurity hearings) has not progressed much beyond authorizing or directing studies, reports, aor pilot programs among various federal agencies and the national laboratories.
Recent turnover among commissioners at FERC will continue in 2019. The passing of former Chairman Kevin McIntyre in early January returned Neil Chatterjee to the position of Chairman (a position he previously held for several months in 2017) and left a Republican seat vacant. In early 2019, Commissioner Cheryl LaFleur announced she would not seek a third term when her current term ends on July 1; however, if a successor is not confirmed by that time, Commissioner LaFleur (if she chooses) can remain at FERC until the end of the current session of Congress (likely late in calendar year 2019). Regardless of how and when the vacant seats are filled, Chairman Chatterjee will become the longest-tenured of the sitting commissioners, having been confirmed by the Senate in August 2017.
Regardless of its membership, FERC seems likely to continue to work in 2019 on a number of policy areas it addressed in 2018. The commission has an open docket on resilience issues impacting the bulk power system stemming from the 2017 US Department of Energy notice of proposed rulemaking (NOPR), which sought to provide out-of-market support for energy-secure resources. While FERC strongly rejected the NOPR, it did ask grid operators to submit filings on issues impacting resilience. In its filing, the ISO noted that issues impacting resilience are mainly associated with the availability of fuel (and the fuel-supply infrastructure) during the coldest periods of the year and less tied to having sufficient capacity.7 FERC has yet to move forward on the resilience docket after receiving comments in the first half of 2018.
In addition, various FERC commissioners have voiced interest in other policy areas, including, but not limited to, the following:
• Further examination of the digital and physical security of the bulk power system (as well as natural gas pipelines)
• Possible changes to rules governing the building and financing of transmission
• Reform of the Public Utility Regulatory Policies Act
• Studies of the certification process for natural gas pipelines
6 Fair RATES Act, H.R. 587, 115th Cong. (January 23, 2017), https://www.congress.gov/bill/115th-congress/house-bill/587. 7 ISO New England, Response of ISO New England Inc. (on Grid Resilience in Regional Transmission Organizations and Independent System Operators), Docket No. AD18-7-000, FERC filing (March 9, 2018), https://www.iso-ne.com/static-assets/documents/2018/03/ad18-7_iso_response_to_grid_resilience.pdf.

2018 Financial Report Page 7 ISO-NE PUBLIC
• Further discussion of the impact of state policies on wholesale markets and the role of federal and state regulators
States Update
As has been the case for several years, New England states continue to spend over $1 billion combined annually on energy efficiency (EE) measures in the region. The impact of these efficiency investments is substantial.
For example, in FCA 13 (conducted in February 2019 to cover a capacity commitment period starting June 1, 2022), over 10% of the capacity obligations were awarded to energy efficiency or demand-response programs.8 In addition, through the ISO’s 10-year energy efficiency forecast, the ISO predicts energy efficiency to slow the growth of peak demand to near zero and reduce annual energy usage over the next decade.
States also continue to simultaneously promote the development of renewable energy through state-specific renewable energy standards. Massachusetts, Connecticut, and Rhode Island, in particular have already enacted statues directing utilities to sign long-term contracts to develop approximately 5,000 megawatts of clean energy (including on- and offshore wind, solar, and Canadian hydro).9 The ISO expect states to continue to drive these long-term commitments in clean energy in the coming years. Their dedication to a cleaner electric grid has played a role in the dramatic reductions of emissions in New England; since 2001, nitrogen oxide (NOX) emissions have fallen by more than 70%, sulfur dioxide (SO2) emissions are down more than 95%, and carbon dioxide (CO2) emissions have been reduced by more than 30%.
However, states are still intently focused on the relatively high retail cost of electricity in New England. In 2018, the Coalition of Northeastern Governors kicked off an energy-affordability initiative to better understand the underlying factors affecting retail electricity prices. At the governors’ request, ISO senior management and members of its board of directors met with several governors last year to provide support for this initiative (and the ISO expects to continue that support in 2019).
For a decade, ISO New England has served as the principal facilitator of the Consumer Liaison Group (CLG), a forum promoting direct interaction between consumers (residential, commercial, and industrial) and the ISO. In 2018, ISO senior management and members of its board of directors met with representatives of the CLG Coordinating Committee to hear their concerns about electricity costs and share the key factors the ISO understands as driving these costs in the region. Overseen by representatives of the Massachusetts Attorney General’s office and a coordinating committee comprising CLG members (including consumer advocates), the CLG hosts quarterly meetings, open to the public and press, to address issues important to New England electricity consumers, including cost, reliability, and environmental priorities. In 2018, the CLG heard from speakers addressing topics such as how consumers are affected by the evolution of New England’s wholesale electricity markets, the role energy efficiency plays in New England, and the future of the electrification of the heating sector.
8 Certain energy-efficiency measures can bid into the Forward Capacity Market as capacity suppliers. 9 States have enacted economywide goals for reducing greenhouse gas emissions roughly 80% by 2050.

2018 Financial Report Page 8 ISO-NE PUBLIC
Financial Data
Results of Actual Operations
Table 1 summarizes the actual amounts and percentage of total expenses for the years ending December 31, 2018 and 2017:
Table 1 Actual Amounts ($ Millions) and Percentages of Total Expenses
for the Years Ending December 31, 2018 and 2017
Year Ending December 31 2018 ($)
2018 (%)
2017 ($)
2017 (%)
Salaries and benefits 111.4 57.7 106.2 57.6
Depreciation and amortization expense 30.2 15.6 32.6 17.6
Professional fees and consultants 15.9 8.2 11.3 6.1
Computer services 13.4 7.0 12.6 6.8
Northeast Power Coordinating Council and NERC dues and expenses 5.8 3.0 5.9 3.2
Interest expense 2.3 1.2 2.2 1.2
Communication expense 2.2 1.2 1.7 0.9
Insurance expense 2.0 1.0 2.2 1.2
Building services 1.8 0.9 1.4 0.8
Utilities 1.3 0.7 1.2 0.7
Information services and industry memberships 1.3 0.7 1.2 0.7
Board of directors 1.2 0.6 1.2 0.7
Rents and leases 0.9 0.5 1.0 0.5
Administrative and other 3.3 1.7 3.7 2.0
Total $ 193.0 100.0% $ 184.4 100.0%
Total expenses increased by $8.6 million, or 4.7%, in 2018 over 2017. Expenses net of depreciation, amortization, and interest increased $10.9 million, or 7.3%, in 2018 over 2017. The changes were primarily the result of the following factors:
• Salaries and benefits increased $5.2 million, or 4.9%, in 2018. Increases were a result of year-over-year annual merit and promotional increases; slightly higher average headcount in 2018; an increase in medical insurance premium rates; and a lower allocation of internal ISO staff work on capital development projects.
• Professional fees and consultants increased $4.6 million or 40.7% in 2018, due to the following:

2018 Financial Report Page 9 ISO-NE PUBLIC
o Nonrepetitive reductions associated with the accrual of legal fees from the previous year that were adjusted in 2017
o Consulting expenses and legal fees associated with winter energy-security concerns, including:
Development of market-based solutions to mitigate winter energy security
Regulatory support and testimony for a cost-of-service Reliability Agreement with a large regional generator
Analysis of the energy market impact of a regional liquefied natural gas terminal, including the potential closure of this facility
o Information Technology consulting to supplement staff in the areas of regulatory compliance, power system modeling, the Energy Management System, and professional training for software developers
o Increased costs for human resource and recruiting-related expenses, including relocation, recruiter fee, succession planning, and medical plan updates
• Computer services increased $0.8 million, or 6.3%, in 2018, due to the following year-over-year
changes:
o Licensing and fees for Forward Capacity Auction software included as internal capital-related expense in 2017, as a result of functional enhancements
o Maintenance expenses for Energy Management System performance due to the introduction of new resource types into the energy markets
o Increases for existing products upon renewal of multiyear licensing and maintenance agreements as well as year-over-year product inflationary increases
o Maintenance on capital purchases of new hardware and software to meet growing data storage and retrieval demands and to replace end-of-life servers that vendors no longer support
o Increases were partially offset by the following nonrecurring 2017 expenses:
o Additional licensing costs for the ongoing expansion of virtual system environments
o Cost increases for the purchase of additional licenses for security and compliance purposes
• Communications expense increased $0.5 million, or 29.4%, in 2018. The increase is due to reduced 2017 expenses with the start of a new vendor phone contract and for communication lines in 2018 as a result of additional generating resources being available for dispatch under the ISO tariff.
• Building services increased $0.4 million, or 28.6%, in 2018. Increases included cyclical items that do not occur every year, including replacement of uninterruptable (emergency) power supply batteries at both the master and backup control centers, and capacitor and fan assembly replacement at the master control center. An increase also resulted from maintenance and updates due to normal wear and tear of the facilities.

2018 Financial Report Page 10 ISO-NE PUBLIC
• Depreciation and amortization expense decreased $2.4 million, or 7.4%, in 2018. This decrease in expense is a result of a number of large projects becoming fully depreciated in late 2017 or early 2018 including
o Energy Market Offer Flexibility (Hourly Market)
o Alternative Technologies and Regulation Market
o FCA 9
o Simultaneous Feasibility Test and Market System Upgrade
o NX9/NX12 Data Integration and Automation Phase II
o Web Enhancements Phase II
o Prerequisite Unit Dispatch and Scheduling Changes for Generation Control Application
o Forward Capacity Market Terminations and Retirements
The reductions were partially offset by projects placed in service in mid-2017 or mid-2018:
o Price-Responsive Demand
o Forward Capacity Market Pay for Performance
o Situational Awareness—Video Wall Expansion Phase II
o Subhourly Settlements
o Real-Time Fast-Start Pricing
o IT Asset Workflow
• Administrative and other expenses decreased $0.4 million, or 10.8%, in 2018. Reductions included lower travel, meeting, and training expenses and other miscellaneous reductions.
Capital Spending
The FERC-approved capital expenditure budget for 2018 was $28.0 million. Actual spending was under budget by $3,154,600. Reduced spending was the result of obtaining updated project requirements that needed fewer external vendor resources, and extending certain projects into 2019 due to the resourcing of higher-priority projects. The following projects were affected:
• FCA 13 was removed from the budget and replaced with the Annual Reconfiguration Transactions (ARTs) project for a lower cost.
• The Competitive Auctions with Sponsored Policy Resources project had reduced costs.
• The following projects were extended into 2019 or beyond:
o CIMNET Simultaneous Feasibility Test with Data-Transfer Enhancements
o nGEM Software Development
o Internal Market Monitoring Data Analysis Phase II
o Issues Resolution Phase II
The following sections summarize the major projects in 2018, some of which are ongoing and multiyear.

2018 Financial Report Page 11 ISO-NE PUBLIC
Price-Responsive Demand
In 2011, FERC issued Order 745, Demand-Response Compensation in Organized Wholesale Energy Markets. This order requires organized wholesale energy markets to pay demand-response providers the energy market price for reducing consumption below expected levels when doing so would lower the costs to consumers and help balance real-time supply and demand.10 ISO New England developed and designed market rules to fully integrate demand-response resources (DRRs) into the energy and reserve markets.
Full integration has allowed DRRs to be dispatchable and participate in the energy and reserve markets as well as the capacity market, in each case, comparable to a generator. The scope of work for the Price-Responsive Demand project included significant software changes and enhancements to multiple systems, including but not limited to, the market database, market clearing engines, eMarket, the Energy Management System (EMS), electronic dispatch, day-ahead and real-time support applications, ISO enterprise applications, and market settlement applications.
The project was put into production in June 2018 with a cost of $9,611,500.
Energy Management Platform 3.2 Upgrade Part I
The ISO’s Energy Management System is currently running on an outdated version of its vendor’s Energy Management Platform (EMP) that will be discontinued in 2020. To continue vendor support and ensure compatibility with the latest versions of the ISO’s operating system and third party software, the ISO must upgrade to EMP version 3.2 before 2020. The implementation of the EMP 3.2 upgrade will be done in two parts.
The EMP 3.2 Upgrade Part I will convert/port all the necessary system customizations to generation and transmission management, load forecasting, network analysis, and storage management software that have been put into production before and concurrent with the Price-Responsive Demand project. Part I will also include the initial integration and functional testing of all ported custom software changes. Part I will lay the foundation for Part II and will be placed in service when Part II is complete, in 2020.
The EMP 3.2 Upgrade Part II will include the conversion/porting, integration, and testing of additional software custom programs put into production after July 1, 2018.
The estimated total cost for Part I of this project is $4,405,500. The target completion date is June 2019.11
Energy Storage Device Phase I
The Energy Storage Device project will develop a solution that enables emerging grid-sized electric storage technologies (not including pumped-storage technologies that can already fully participate in the markets) to participate in the energy and reserve markets as dispatchable resources (when charging and discharging) while also continuing to participate in the Regulation Market under the Alternative Technology Regulation
10 FERC, Demand Response Compensation in Organized Wholesale Energy Markets, 134 FERC ¶ 61,187, final rule (March 15, 2011), https://www.iso-ne.com/static-assets/documents/regulatory/ferc/orders/2011/mar/rm10_17_000_3_15_000_demand_resp_order.pdf. 11 Both the EMP 3.2 Upgrade Part I and Part II projects will be put into production at the completion of the Part II project. The EMP 3.2 Upgrade Part I project will remain in work-in-process status and will not begin amortizing until the completion of Part II when the cost of both projects will begin amortizing.

2018 Financial Report Page 12 ISO-NE PUBLIC
Resource construct. Several of the ISO’s systems will need to be enhanced to accommodate for this new technology.
The project was completed in March 2019 at an estimated total cost of $2,994,400.
Energy Market Offer Caps (Order 831)
In response to FERC Order 831, the ISO filed tariff revisions to modify how offers are capped in the Day-Ahead and Real-Time Energy Markets.12 These modifications involve four key rule changes:
• A resource’s incremental energy offer in the energy market clearing engines must be capped at the higher of $1,000/megawatt-hour (MWh) or that resource’s verified cost-based incremental energy offer.
• When calculating locational marginal prices, ISO New England must impose a hard cap of $2,000/MWh on all verified, cost-based, incremental energy offers.13
• The verification process for cost-based incremental offers above $1,000/MWh should ensure that the resource’s offer reasonably reflects the resources actual or expected costs.
• The ISO must allow resources to be eligible for make-whole payments in the event that a resource has a verified cost-based offer above the $2,000/MWh hard cap, or an incremental energy cost above $1,000/MWh that is not verifiable before market clearing but rather after-the-fact.
The Energy Market Offer Caps project will incorporate all required system updates, enhancements, and reporting steps to comply with the commission’s order. System enhancements include updates to the participant offer process, Day-Ahead and Real-Time Energy Markets, and after-the-fact capping review.
The estimated total cost for this project is $2,741,000. The target completion date is March 2020.
CIMNET Simultaneous Feasibility Test with Data-Transfer Enhancements
The CIMNET Simultaneous Feasibility Test (SFT) with Data-Transfer Enhancements project will implement SFT software enhancements and other market data application changes. Enhancements include the replacement of the existing platform for the SFT and the topology processing software to eliminate the frequent deployment of security patches. Enhancements will also include updating the custom software currently in place, introducing new task management, and orchestrating applications, among other improvements to the Energy Market System software. The new software will be certified and audited by a third party.
The estimated total cost for this project is $2,656,500. The target completion date is October 2020.
12 FERC approved changes in letter order issued to ISO New England Inc. in Docket No. ER17-1565-000 (November 9, 2017); see https://www.iso-ne.com/static-assets/documents/2017/11/er17-1565-000_11-9-17_ltr_order_accept_order_831_compliance_filing.pdf. 13 ISO New England Inc. anticipates filing a further revision to clarify that the $2,000/MWh cap will also apply for purposes of committing resources in the Day-Ahead Energy Market; in real-time, verified offers above the price cap will be used for dispatch purposes. In that filing, ISO New England Inc. will also request that the effective date for the offer-cap revisions be moved from October 2019 to March 2020.

2018 Financial Report Page 13 ISO-NE PUBLIC
Internal Market Monitoring Data Analysis Phase II
ISO New England’s Internal Market Monitoring (IMM) department performs market data analysis to identify issues that may compromise the efficiency and integrity of market outcomes. Successful analysis requires access to a large variety of market data, and this project will allow IMM market analysts to explore data across multiple markets (e.g., energy, capacity, and ancillary services) and multiple market products (e.g., physical and financial). Phase I of this project, completed in June 2018, provided a market data analysis system for Financial Transmission Rights and the Forward Reserve Market.
Phase II of the project will provide the IMM access through the newly developed system from Phase I to the energy markets and Regulation Market and associated mitigation and settlement functions. This project will develop application program interfaces (APIs) in the day-ahead and real-time market systems that will provide immediate, ready-to-use data to market analysts, increasing efficiency, availability, accuracy, and timing of results.
The estimated total cost for this project is $2,233,000. The target completion date is August 2020.
Forward Capacity Market Pay for Performance
The pay-for-performance (PFP) design improved the current Forward Capacity Market (FCM) design by including stronger links between a supply resource’s capacity revenues and such resource’s performance during reserve deficiencies, providing strong incentives for each resource to perform as needed and to make the required investments to build and maintain the resources necessary to assure reliable service.
The FCM PFP project required extensive modifications to several existing software applications. Significant effort was needed to enhance interfaces between systems to provide capacity-scarcity conditions, unit-specific “capping” for transmission limitations, desired dispatch points, external reserve support, and replacement reserve megawatts to the ISO Gateway for eventual use in settlement, as well as to enhance the Forward Capacity Tracking System. The Financial Assurance Management software was updated to include the new collateral obligation requirements that may arise consistent with the PFP construct.
The project was completed and put into production in June 2018 with a cost of $2,125,100.
Streamline Asset Registration Phase III
ISO New England has been working to streamline the asset-registration process by improving and eliminating a labor-intensive, paper-based process that relied on participants submitting scanned, emailed, or faxed asset-registration forms and ISO staff manually entering data into multiple systems, including the Settlements Market System (SMS) and the Customer and Asset Management System (CAMS).
Earlier phases of this project included moving the functionality of asset registration from SMS to CAMS, making asset information visible to market participants. The goal of the project’s third phase is to define a single source for asset data (a system of record) to maintain the data in a central repository and have the data available to other systems as needed. This project will also improve data visibility and exchange through various bridges to other applications. System enhancements include modifications in user interfaces, applications, energy market settlements, data bridges, and several tables, views, packages, and triggers.
The estimated total cost for this project is $1,955,400. The target completion date is May 2020.

2018 Financial Report Page 14 ISO-NE PUBLIC
Competitive Auctions with Sponsored Policy Resources
The Competitive Auctions with Sponsored Policy Resources (CASPR) project is designed to maintain competitive capacity pricing while accommodating the entry of new sponsored policy resources into the Forward Capacity Market over time. The CASPR project required the development of a substitution auction clearing engine, certification of the new clearing engine, and a substitution auction administration interface. Updates were required to downstream systems and reports, including the business intelligence warehouse, the Market Information System, and system planning reliability review tool.
The estimated total cost for this project is $1,450,000. The completion date was February 2019.
Software Development Costs
In addition to the major projects described above, the ISO incurred $2.4 million in software development costs during 2018. These costs supported a multitude of enhancements to existing software systems.
Nonproject Hardware and Software Costs
The ISO incurred $3.2 million of non-project-related hardware and software costs. Nonproject capital expenditures fund furniture and fixtures, non-project-related hardware and software purchases, and the internal capitalized labor necessary to code system improvement requests (SIRs).
Hardware purchases included those to meet increased storage requirements throughout ISO New England’s infrastructure, including storage, computing, and network equipment to expand virtual environments. This expansion of database storage supports business intelligence and data warehouse environments to accommodate the analytical storage and use of subhourly data as well as the replacement of equipment reaching its end-of-life phase, including email services, high performance computing systems, general support servers, and messaging infrastructure. Also included were purchases providing continued support to comply with Critical Infrastructure Protection (CIP) Standards. The following Improvements were made:
• Enhancing and strengthening the ISO’s electronic security perimeters to isolate administrative activity from business networks
• Separating the Energy Management System production and test environments
• Encrypting data flows between the master control center and the backup control center
• Securing system deployment processes to ensure system protection in the production network
• Removing non-CIP network traffic from our network equipment to eliminate mixed-trust configurations
• Building out a dedicated temporary control center room at the master control center facility
Capital funds were also invested for new software to enhance configuration management, single sign-on solutions, and development software tools. In addition, software licenses were purchased to meet the requirements for server storage to optimize the deployment of and minimize licensing costs and risks for these products.
Risks
ISO New England is exposed to financial risk in four primary areas: interest rates, litigation, cybersecurity, and regulatory changes. The ISO historically has included in its annual budget two contingency funds to address unknown costs—a CEO emerging-work allowance and a board of director’s contingency fund. These

2018 Financial Report Page 15 ISO-NE PUBLIC
contingencies typically represent a combined 1.0% to 1.5% of the total amount to be recovered each year under Section IV.A of the ISO tariff. The CEO emerging-work allowance is used as part of the normal course of business, and allocations are controlled by the CFO and CEO. The board contingency fund, subject to use only through ISO board of directors’ approval, has never been used. Because the ISO does not have any capital to draw on for unknown expenses, these two contingencies are important for the ISO to operate efficiently.
Interest Rates
Fluctuating interest rates can have an impact on the costs of the ISO in several ways. Specifically, the ISO earns interest on the settlement funds it collects from market participants, pays a floating interest rate on its tax-exempt bonds, and uses assumptions on interest rates to establish liabilities and costs for its pension and postretirement benefit plans.
Historically, the average float in the settlement account had been consistently higher than the outstanding principal of the tax-exempt debt and, therefore, was an effective hedge against interest-expense rates. A decrease in the settlement float will make the hedge less effective against increasing interest rates. In 2018, the settlement float increased on average approximately 60% from 2017 levels. This increase was primarily due to higher clearing prices in the energy markets. The increase in float and the low interest rates of the tax-exempt debt has had a minor overall impact to the hedge; the average balance of the tax-exempt-issued debt was lower than the average settlement float in 2018. However, to mitigate the risk of the uncovered hedge (i.e., the higher level of variable-rate debt compared with the settlement float), in late 2012, the ISO purchased an interest-rate cap that benefits the ISO when interest rates exceed a certain level. The interest-rate cap is a 10-year cap, which amortizes as the tax-exempt debt principal is repaid. Both interest income and interest expense rates continued to remain low in 2018, although the interest income rates for the year did experience an uptick. The ISO regularly analyzes the interest-rate environments to ensure that its debt structure is as cost effective as possible, in addition to reviewing all debt and funding needs.
Interest rates also are used in the discount-rate assumptions for establishing the liabilities and costs associated with the pension and postretirement plans. Lower interest rates result in increased costs for these plans when the rates filed in the tariff for recovery include using the calculated expense amount for the cost of these items. For years before 2016, the rates filed for recovery were inclusive of this approach for the pension and postretirement plans; for 2016 and forward, only the postretirement benefit plan will be affected by the change in interest rates. In 2016, the ISO implemented a level funding approach to the pension benefit plans, rather than the historical method of funding the expense amount as calculated, in accordance with the Financial Accounting Standards Board’s (FASB) Accounting Standards Codification (ASC) for the defined benefit pension and other postretirement plan topic. The level funding approach will reduce the volatility of the pension plan expense included in the ISO tariff, while still providing reasonable assurance for sufficient funding of the pension plan.
Litigation
The ISO also has potential exposure to costs resulting from litigation. The ISO does not budget for unforeseen litigation costs during the normal budgeting process. Therefore, any material unexpected litigation that arises during the course of the year would pose a risk to the ISO’s ability to operate within the approved budget.
Cybersecurity
Cybersecurity continues to be one of the most important national security priorities. The volume and sophistication of cybersecurity threats have been increasing. The ISO faces a variety of cybersecurity threats, including targeted attacks such as social engineering, phishing, and malware throughout our cyber supply chain. The ISO’s systems and networks contain vast amounts of critical and confidential information

2018 Financial Report Page 16 ISO-NE PUBLIC
pertaining to the power system grid and internal networks. Protecting these systems, networks, and data is critical. As such, the ISO continues to heavily invest in the appropriate resources to manage this risk.
Energy-Security Challenges
As noted earlier in this report, energy security is one of the ISO’s key objectives for 2019. ISO New England’s current wholesale market construct is misaligned with the region’s rapidly evolving power system and does not provide appropriate incentives via market mechanisms to signal the necessary investment for regional energy security.
The lack of market mechanisms to align incentives for energy generation (from any technology) is a critical concern given the power system’s evolving resource mix and the region’s constrained fuel-delivery infrastructure. This may result in insufficient energy available to satisfy electricity demand under stressed power system conditions. For generators, investing in more robust energy-supply (e.g., fuel) arrangements may often be beneficial and cost effective for the system but not financially viable on an individual basis, and thus the benefits for society and private investment are not aligned.
In addition, the existing markets may not recognize attributes, such as energy (or fuel) security, that will be required to allow system operations to both accommodate increasing quantities of intermittent, distributed storage, and behind-the-meter sources of supply and optimize energy on a multiday basis.
Potentially exacerbating these dynamics are the retirement of a large percentage of non-gas-fired generators, possible restrictions on dual-fuel generation, and further limitations on CO2 emissions, all of which would further limit the generating fleet’s operational flexibility. Underlying these concerns is the loss of a natural gas pipeline supply or liquefied natural gas to New England, resulting in gas supply interruptions to generation for a lengthy period.
With regard to failures of energy infrastructure, the ISO recognizes that it cannot cost effectively address the risk of extended interruptions to gas supply and transportation to the region. This risk can only be addressed by policymakers agreeing to invest in sufficient redundancy in the gas system or compensating for the risk by investing in alternate energy infrastructure (e.g., investment in transmission to accommodate more energy from neighboring regions).
In December 2018, FERC accepted the ISO’s proposed tariff changes to retain resources seeking retirement on the basis of a fuel-security reliability need (in place for FCA 13, 14 and 15). The ISO will support any state initiatives on gas pipeline or storage investments as necessary. The ISO continues to complete fuel surveys, coordinate with gas pipelines, and execute emergency procedures as needed.
The ISO is developing market designs to mitigate energy-security concerns in the region and further the integration of intermittent resources and small distributed resources. In the near-term, the ISO is working on an interim market-based solution that would provide compensation for inventoried energy during cold winter conditions occurring in the capacity commitment periods associated with FCA 14 and 15. A more permanent solution is being developed that includes three major components: changing the current Day-Ahead Energy Market to a Multi-Day-Ahead Energy Market, introducing three new ancillary services cooptimized with a Multi-Day-Ahead Energy Market, and adding a new (voluntary) forward/seasonal market ahead of the winter period.
Regional Transmission Planning Challenges
The Boston area could face transmission security concerns if two Boston-area generating resources retired in the next several years. The current rules, in combination with subsequent permitting, siting, and project

2018 Financial Report Page 17 ISO-NE PUBLIC
construction, are not likely to be completed in time to meet forecasted needs. To address this concern, the ISO will be working with regional stakeholders in summer 2019 to make transmission tariff changes that will help expedite the competitive solicitation process for new transmission infrastructure. If a transmission solution is not in place by the time the generating resources retire, it will pose a reliability risk to Boston under high-load conditions. The ISO currently is conducting a Boston area transmission needs assessment, which includes the assumption that certain generating resources will retire. The needs assessment analysis is scheduled for completion in late 2019.
The ISO will draft competitive transmission request-for-proposal (RFP)-related documents on a parallel path, to be issued soon after the needs assessment is completed. An additional mitigation measure to preserve reliability in the Boston region will include issuing a gap RFP that will bridge the reliability gap in the local area until the transmission solution is in service. It could also seek to procure a wide swath of resource technologies, including summer-only resources such as energy efficiency, demand response, or storage.
Billing and Credit
The ISO is responsible for the billings associated with the wholesale electricity markets for New England’s bulk power generation and transmission system. It also must ensure that proper measures are in place to mitigate participants’ exposure to credit risk from transacting in the ISO-administered markets. Since its inception in 1999, the ISO has continually reviewed its Billing and Financial Assurance Policies and, since 2004, has made great strides in reducing the credit risk for market participants.14
In 2018, the ISO continued to modify and improve the Financial Assurance Policy (FAP):
• On March 1, 2018, the ISO submitted a filing to FERC to amend the FCM delivery-financial-assurance component of the obligations in the ISO Financial Assurance Policy.15 The FCM delivery-financial-assurance component is associated with financial assurance of a market participant participating in the Forward Capacity Market when the two-settlement capacity market design (pay for performance) was implemented on June 1, 2018. Under the Forward Capacity Market design reflected in the currently effective tariff, capacity payments cannot be negative, and hence, for commercial resources, no potential financial obligation exists to collateralize. Under PFP, however, a resource’s net capacity payments may be negative; thus, the FAP was revised to account for the possibility of net payment obligations under PFP. To collateralize this additional potential obligation, beginning on June 1, 2018, market participants with a capacity supply obligation were required to add FCM delivery financial assurance to the calculations for their total financial-assurance requirements. The rate design being modified did not contemplate a market participant’s ability to receive a positive capacity payment, which would have reduced the amount of the FCM delivery financial assurance the market participant wood need to provide.
In addition, this filing included modifications to the FCM delivery-financial-assurance calculation to properly reflect that, for energy-efficiency resources, this obligation only includes those charges that
14 ISO New England Transmission, Markets, and Services Tariff, Section 1, General Terms and Conditions: Exhibit IA, “ISO New England Financial Assurance Policy,” (June 1, 2017) and Exhibit ID, “ISO New England Billing Policy,” (July 1, 2017), https://www.iso-ne.com/participate/rules-procedures/tariff/. 15 ISO New England, Inc. Revisions to ISO New England Transmission, Markets and Services Tariff Related to a Market Participant’s Forward Capacity Market Financial Assurance Requirements Under the Financial Assurance Policy, Docket No. ER18- -000, FERC filing (March 1, 2018), https://www.iso-ne.com/static-assets/documents/2018/03/er18-944-000_fcm_delivery_fa.pdf.

2018 Financial Report Page 18 ISO-NE PUBLIC
may occur during capacity scarcity conditions. Because an energy-efficiency resource would incur these costs only in June, July, August, December, and January, these resources should not have to collateralize for such payments in the other months of the year.
Lastly, this filing also included some clean-up and conforming changes. One change will prevent potential double collateralization of certain capacity charges that might be captured in both the MCC calculation and the calculation of financial assurance associated with transfers of capacity supply obligations in FCM reconfiguration auctions. Another change clarifies the timing language for when certain values will be included in a market participant’s financial-assurance obligations. FERC approved these modifications on April 3, 2018.
• In March 2016, the ISO launched a project to improve the Financial Transmission Rights (FTRs)
Market, Balance of Planning Period Auctions (BoPP). The implementation of BoPP was first vetted with FERC in a May 2011 filing, which stated BoPP was a way to increase liquidity in the FTR market, enhance price discovery, and more efficiently allocate resources.16 The ISO had been pursuing an arrangement with an exchange for several years before March 2016, which was expected to produce these same market benefits. The pursuit of the exchange arrangement ended due to regulatory hurdles that cannot be solved at this time and is uncertain for the future.
The BoPP replacement to the exchange approach will open up a fundamentally different FTR auction structure. BoPP provides a vehicle for market participants to close out their open contracts to lock-in profits or limit potential losses, and a netting provision in FTR obligations will be included with BoPP to prevent double margining. Additionally, a mark-to-market methodology will be incorporated to reflect a more current value of the portfolio than exists today, along with some other improvements to valuing the collateral requirements for FTRs. A FERC filing of these changes was made on April 20, 2017, which the ISO subsequently withdrew. Further discussion and clarification was required with stakeholders, which took place in the latter part of 2017.
The ISO made a filing on August 24, 2018, reflecting the additional stakeholder input, which resulted in some design changes to the financial assurance obligations calculations.17 The current methodology for calculating financial assurance associated with FTRs is not well-suited to this new monthly FTR auction structure, primarily because it does not provide for the netting of offsetting positions. Before this modification, FTR obligations had four components of financial assurance. These have been reduced to three, and a netting mechanism has been introduced to account for the new monthly auctions and ensure that a market participant is not subject to higher financial assurance than needed. Additionally, the new BoPP design reflects the change in the value of the FTR at the time of the monthly auctions compared with when it was first acquired, as well as a change in the basis for the proxy value—the key input to the settlement risk financial-assurance calculation—from a percentile-based approach to a standard-deviation approach. FERC approved these changes on October 24, 2018, which will be implemented in October 2019.18
16 ISO New England Inc., NEPOOL Participants Committee, and Participating Transmission Owners Administrative Committee; Filing of FTR Enhancements; Docket No. ER11-___-000, FERC filing (May 13, 2011), https://www.iso-ne.com/static-assets/documents/regulatory/ferc/filings/2011/may/er11_3568_000_5_13_11_ftr_enhancements.pdf. 17 New England Inc. and New England Power Pool, Docket No. ER18-_____-000; Changes to ISO New England Financial Assurance Policy, FERC filing (August 24, 2018), https://www.iso-ne.com/static-assets/documents/2018/08/er18-2293-000_changes_to_fap.pdf. 18 FERC, Revisions to the Financial Assurance Policy for Financial Transmission Rights, Docket No. ER18-2293-000, letter order (October 23, 2018), https://www.iso-ne.com/static-assets/documents/2018/10/er18-2293-000.pdf.

2018 Financial Report Page 19 ISO-NE PUBLIC
The ISO will continue to work closely with its participants to reduce default risk, including minimizing the settlement cycle time.
Various Market Services and Participation Data
Table 2 compares key settlement market information for the years ending 2018 and 2017 for the markets the ISO oversees.
Table 2 Key Settlement Market Information, 2018 and 2017 ($ Millions, MWh)(a)
2018 2017
Energy markets total $6,071 $4,516
Day-Ahead Energy Market $5,891 $139
Real-Time Energy Market $180 $4,377
Real-time load obligation (MWh) (b) 129,614,519 127,919,538
Net Commitment-Period Compensation $70 $52
Reserve markets total $71 $70
Forward Reserve Market, net $41 $40
Real-time reserve payments $30 $30
Regulation Market $35 $32
Forward Capacity Market payments $3,606 $2,245
Financial Transmission Rights (FTRs) total $24 $20
FTRs—long-term auction $9 $11
FTRs—monthly auction $15 $9
Open-Access Transmission Tariff charges total $2,246 $2,195
Regional network service/through or out $2,212 $2,163
Blackstart $14 $12
Volt-ampere-reactive capacity cost $20 $20
Demand-response payments(c) $2 $1
(a) Data shown in the table reflect settled operational days January 1 through December 31 of the respective years.
(b) The real-time load obligation shown in the table reflects load at all pricing location in New England, including exports at the external nodes.
(c) Before June 1, 2018, this line item reflected the sum of the day-ahead and real time transitional price-responsive demand (TPRD) payments. After June 1, 2018, this line item reflects the real-Time price-responsive demand (PRD) payments. In 2018, TPRD payments totaled $329,237, while real-time PRD payments totaled $1,211,002.
The following measures are key indicators of the cash that clears through the ISO:
• The ISO’s aggregate customer base has increased by approximately 4% year over year (i.e., 491 customers in 2018: 472 customers in 2017). The ISO’s customers include generators, suppliers, publicly owned entities, transmission owners, demand-response resources, alternative resources, end users, and a few smaller groups, including data-only and provisional.
• The net cash cleared in 2018 was $8.6 billion, compared with $5.4 billion in 2017, which is an increase of approximately 59%.
2018 Financial Report Page 20 ISO-NE PUBLIC
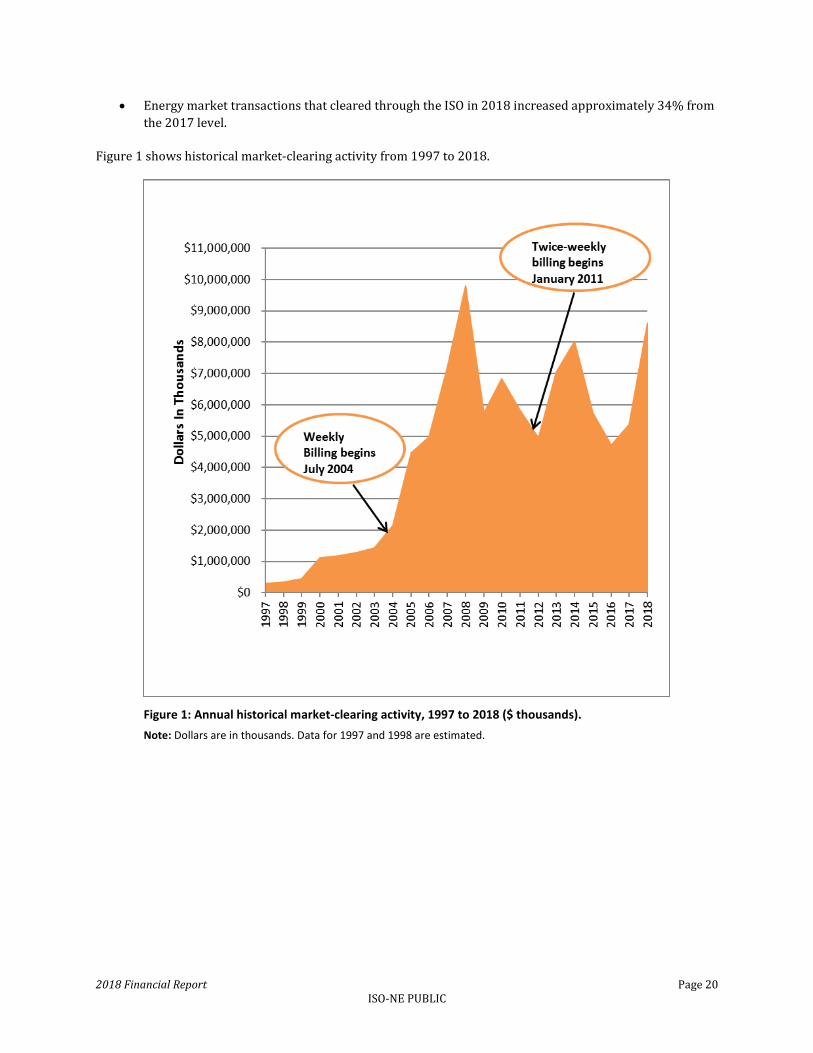
• Energy market transactions that cleared through the ISO in 2018 increased approximately 34% from the 2017 level.
Figure 1 shows historical market-clearing activity from 1997 to 2018.
Figure 1: Annual historical market-clearing activity, 1997 to 2018 ($ thousands). Note: Dollars are in thousands. Data for 1997 and 1998 are estimated.

2018 Financial Report Page 21 ISO-NE PUBLIC
Management’s Responsibility for Financial Reporting The management of ISO New England Inc. (ISO) is responsible for the preparation, objectivity, and presentation of the following financial statements, as well as for the integrity of these statements. These financial statements have been prepared to conform to accounting principles generally accepted in the United States and, where required, include amounts that represent management’s best judgments and estimates. The ISO’s management also is responsible for the preparation of other information in this annual report and for its accuracy and consistency with the financial statements.
To aid in carrying out this responsibility, we, along with all other members of management, maintain a system of internal accounting control modeled after the Committee of Sponsoring Organizations of the Treadway Commission, or the COSO framework. In the opinion of management, the overall system of internal accounting control provides reasonable assurance that the ISO’s assets are safeguarded and that transactions are executed in accordance with the management’s authorization and are properly recorded for the preparation of financial statements. In addition, management believes the overall system of internal accounting control provides reasonable assurance that, in the normal course of their duties, employees prevent or detect material errors or irregularities on a timely basis.
Any system of internal accounting control, no matter how well designed, has inherent limitations, including the possibility that controls can be circumvented or overridden and misstatements due to error or fraud can occur and not be detected. Also, because of changing conditions, the effectiveness of internal control can vary over time. Accordingly, even an effective system of internal control will provide only reasonable assurance about the preparation and reporting of financial statements.
The system of internal accounting control is supported by written policies and guidelines, the selection and training of qualified employees, an organizational structure that provides an appropriate division of responsibility, and a program of internal auditing. The ISO’s written policies include a Code of Conduct that states management’s policy on conflict‐of‐interest and ethical conduct. All personnel annually confirm their compliance with the Code of Conduct.
Gordon van Welie Robert C. Ludlow President and Chief Executive Officer Vice President, Chief Financial and Compliance Officer

ISO New England Inc. Financial Statements For the Years Ended December 31, 2018 and 2017 (With Independent Auditors’ Report Thereon)

Table of Contents
Page(s)
Independent Auditors’ Report 1
Financial Statements
Statements of Financial Position 2
Statements of Activities 3
Statements of Cash Flows 4
Notes to Financial Statements 5 – 25

KPMG LLP is a Delaware limited liability partnership and the U.S. member firm of the KPMG network of independent member firms affiliated with KPMG International Cooperative (“KPMG International”), a Swiss entity.
KPMG LLP One Financial Plaza 755 Main Street Hartford, CT 06103
Independent Auditors’ Report The Board of Directors ISO New England Inc.: Report on the Financial Statements We have audited the accompanying financial statements of ISO New England Inc., which comprise the statements of financial position as of December 31, 2018 and 2017, and the related statements of activities, and cash flows for the years then ended, and the related notes to the financial statements. Management’s Responsibility for the Financial Statements
Management is responsible for the preparation and fair presentation of these financial statements in accordance with U.S. generally accepted accounting principles; this includes the design, implementation, and maintenance of internal control relevant to the preparation and fair presentation of financial statements that are free from material misstatement, whether due to fraud or error. Auditors’ Responsibility
Our responsibility is to express an opinion on these financial statements based on our audits. We conducted our audits in accordance with auditing standards generally accepted in the United States of America. Those standards require that we plan and perform the audit to obtain reasonable assurance about whether the financial statements are free from material misstatement. An audit involves performing procedures to obtain audit evidence about the amounts and disclosures in the financial statements. The procedures selected depend on the auditors’ judgment, including the assessment of the risks of material misstatement of the financial statements, whether due to fraud or error. In making those risk assessments, the auditor considers internal control relevant to the entity’s preparation and fair presentation of the financial statements in order to design audit procedures that are appropriate in the circumstances, but not for the purpose of expressing an opinion on the effectiveness of the entity’s internal control. Accordingly, we express no such opinion. An audit also includes evaluating the appropriateness of accounting policies used and the reasonableness of significant accounting estimates made by management, as well as evaluating the overall presentation of the financial statements. We believe that the audit evidence we have obtained is sufficient and appropriate to provide a basis for our audit opinion. Opinion
In our opinion, the financial statements referred to above present fairly, in all material respects, the financial position of ISO New England Inc. as of December 31, 2018 and 2017, and the results of its operations and its cash flows for the years then ended in accordance with U.S. generally accepted accounting principles.
Hartford, Connecticut March 22, 2019

ISO New England Inc.
2
Statements of Financial Position
As of December 31, 2018 and 2017
2018 2017
(In thousands) Assets Current assets:
Cash and cash equivalents $ 48,935 $ 90,924 Restricted cash on deposit 34,822 11,663 Security deposits 249,734 162,282 Unbilled receivable, net 32,310 33,106 Prepaid expenses and other assets 4,189 5,341 Regulatory assets - current — 381
Noncurrent assets: Property and equipment in-service, net 78,826 85,120 `Work in process 19,510 18,639 Restricted cash on deposit 16,135 716 Deferred charges 1,149 1,259 Regulatory assets 61,602 65,147
Total assets $ 547,212 474,578
Liabilities and Net Assets Current liabilities: Accounts payable:
Settlement, net $ 14,441 $ 67,089 Administration 9,647 9,313
Deposit payable 272,656 183,941 Interest payable 482 439 Accrued compensation - current 19,765 18,252 Regulatory liability - current 9,363 26 Restricted cash on deposit payable 34,822 11,663 Long-term debt - current portion 3,180 3,180
Long-term liabilities: Pension and post retirement benefit liability 61,602 65,147 Accrued compensation, net of current portion 3,008 3,159 Restricted cash on deposit payable, net of current portion 16,135 716 Regulatory liability, net of current portion 2,949 9,335 Long-term debt 99,162 102,318
Total liabilities 547,212 474,578
Net assets without donor restrictions — —
Total liabilities and net assets $ 547,212 $ 474,578
The accompanying notes are an integral part of these financial statements.

ISO New England Inc.
3
Statements of Activities
For Years Ended December 31, 2018 and 2017
2018 2017
(In thousands)
Changes in net assets without donor restrictions: Revenues:
ISO tariff revenues
$ 192,152 $ 184,066 Interest income 669 84 Fees and services 227 259
Total revenues without donor restrictions
193,048 184,409
General and administrative:
Salaries and benefits 111,459 106,178 Depreciation and amortization expense 30,192 32,601 Professional fees and consultants 15,918 11,320 Computer services 13,442 12,649 NPCC/NERC dues and expenses 5,820 5,896 Interest expense 2,349 2,151 Communication expense 2,249 1,720 Insurance expense 1,974 2,206 Building services 1,751 1,427 Utilities 1,305 1,182 Information services and industry memberships 1,254 1,158 Board of directors 1,207 1,213 Rents and leases 873 1,016 Administrative and other 3,255 3,692
Total expenses 193,048 184,409
Change in net assets without donor restrictions — —
Net assets without donor restrictions, beginning of year — —
Net assets without donor restrictions, end of year $ — $ —
The accompanying notes are an integral part of these financial statements.

ISO New England Inc.
4
For Years Ended December 31, 2018 and 2017
2018 2017
(In thousands)
Cash flows from operating activities: Change in net assets without donor restriction $ — $ — Adjustments to reconcile change in net assets without donor
restriction to net cash (used) provided by operating activities: Depreciation and amortization expense 30,335 32,746 Loss on disposal 68 266 Decrease (increase) in unbilled receivable, net 796 (3,353) Decrease (increase) in prepaid expenses and other assets 1,152 (2,417) Decrease in regulatory assets (Decrease) increase in accounts payable:
Settlement
381
(52,648)
—
(6,703) Administration (323) 3,011
Increase in accrued compensation 1,362 1,165 Increase in interest payable 43 41 Increase in regulatory liability 2,951 8,749
Net cash (used) provided by operating activities (15,883) 33,505
Cash flows from investing activities: Capital expenditures
(24,189)
(26,728)
Net cash used in investing activities (24,189) (26,728)
Cash flows from financing activities: Increase in security deposits (87,452) (15,936) (Increase) decrease in restricted cash on deposit (38,578) 3,364 Increase (decrease) in restricted cash on deposit payable 38,578 (3,181) Increase in deposit payable 88,715 20,546 Repayment on long-term debt (3,180) (3,180) Borrowing on revolving credit — 11,000 Repayment on revolving credit — (11,000)
Net cash (used) provided by financing activities (1,917) 1,613
Net change in cash and cash equivalents (41,989) 8,390
Cash and cash equivalents at beginning of year 90,924 82,534
Cash and cash equivalents at end of year $ 48,935 $ 90,924
Supplemental data: Amounts included in Accounts Payable - Administration
$ 4,310
$ 3,653
related to work in process Cash paid during the year for interest, net of interest capitalized 2,304 $ 2,108 Non-cash activity - Change in pension liability is offset by
regulatory assets $ (3,545) $ 4,398
The accompanying notes are an integral part of these financial statements.

5
ISO New England Inc. Notes to Financial Statements For Years Ended December 31, 2018 and 2017 1. Summary of Significant Accounting Policies
Description of Business ISO New England Inc. (the "Company" or "ISO") is the Regional Transmission Organization
(“RTO”) for New England in compliance with the requirements of the Federal Energy Regulatory Commission ("FERC"). On January 1, 2013, ISO NE became the central counterparty to market transactions that flow through the ISO. The change to central counterparty was the result of a FERC rulemaking designed to afford the ISO and market participants more protection in bankruptcy. The ISO’s assumption of the central counterparty role did not have a material effect on the ISO’s settlement of the Markets or on business operations.
On January 13, 2014, a new entity, Eastern Interconnect Data Sharing Network, Inc. was formed and later amended the Certificate of Incorporation on May 10, 2018 to reflect a name change to EIDSN, Inc. (“EIDSN”). EIDSN is a 501(c)(6), nonstock, nonprofit corporation that was established to, among other things, facilitate the secure, consistent, effective, and efficient sharing of important electric transmission and operational data among its members and/or other applicable parties to help improve electric industry operations and promote the reliable and efficient operation of bulk power system. On the formation date, the ISO, along with several Reliability Coordinators (as that term is defined by the North American Electric Reliability Corporation (“NERC”)), became a member of the corporation.
Basis of Accounting and Presentation
The accompanying financial statements have been prepared on an accrual basis of accounting in accordance with U.S. generally accepted accounting principles and Financial Accounting Standards Board Accounting Standards Codification (FASB ASC) Topic 980, Regulated Operations. The preparation of financial statements in conformity with accounting principles generally accepted in the United States of America requires management to make estimates and assumptions that affect the reported amounts of assets and liabilities and disclosure of contingent assets and liabilities at the date of the financial statements and the reported amounts of revenues and expenses during the reported period. Significant items subject to such estimates and assumptions include the useful lives of fixed assets, assumptions utilized in the accounting for employee benefit obligations such as discount rates, return on assets, fair value of investments and other contingencies.
Cash and Cash Equivalents
The Company considers cash on hand and short-term marketable securities with original maturities of three months or less to be cash equivalents. The cash equivalents at December 31, 2018 and 2017 were held in overnight repurchase agreements, money market account and also in direct and indirect obligations of the United States, with original maturities of three months or less.
Restricted Cash on Deposit
The balance of approximately $50,957,000 and $12,379,000 at December 31, 2018 and 2017, respectively, recorded as restricted cash on deposit, represents the Forward Capacity Market Forfeited Funds, the Congestion Revenue Fund, and Cluster Study Funds. The balance has a corresponding liability on the Statements of Financial Position. The restricted cash on deposit at December 31, 2018 and 2017 was held in overnight repurchase agreements and also in direct and indirect obligations of the United States of America US treasuries, with original maturities of three months or less. The restricted cash on deposit is presented on the statement of financial position as required by the FASB ASC Topic 958, Presentation of Financial Statements of Not-for-Profit Entities.

ISO New England Inc.
Notes to Financial Statements
For Years Ended December 31, 2018 and 2017
6
Accounts Receivable and Accounts Payable
In the course of bulk power transactions administered by the Company on behalf of the Market Participants (“Participants”), amounts for energy purchased and sold among Participants become payable to and receivable from such Participants. The Company summarizes and prices the energy transactions and provides an invoice or remittance advice to each Participant that summarizes the amount either receivable from or payable to each Participant twice each week.
Accounts payable on the Statements of Financial Position are segregated between (i) the amounts owed for energy transactions and transmission, for which the ISO functions as paying agent, which are included in accounts payable as “settlement, net,” and (ii) the administrative expenses incurred by the Company in the course of operations. The reference to “settlement, net” is used due to the nature of billing and payment for the amounts owed for energy transactions and transmission markets, and represents the Participant’s net amount due, less any amounts which may have been owed to them.
The net unbilled receivables, the majority of which have been determined as a result of the settlement
process, include those amounts that will be billed and included in the invoice or remittance advice to Participants on subsequent invoices issued twice per week. The balance at the end of the year represents mainly ISO Tariff revenues. The net payables and receivables for those energy transactions stated above are settled with the Participants in the same week.
Property and Equipment in Service and Work in Process Property and equipment is stated at cost, net of accumulated depreciation and amortization. The Company capitalizes the interest and fees associated with borrowings that the Company has entered into for the acquisition of assets related to a project that has a material effect on the Company’s financial position as required by FASB ASC Topic 980, Regulated Operations. In addition, the Company capitalizes internal software development costs as required by FASB ASC Subtopic 350-40, Internal-use Software.
Depreciation and Amortization Depreciation is generally computed using the straight-line method over an estimated useful life
ranging from three years to twenty-five years (e.g., computer hardware, software and accessories – three to five years; software development costs – three to five years; vehicles – three to seven years; furniture and fixtures and machinery and equipment – seven years; building and building improvements - one to twenty-five years or remaining life of the building improvement; and building – twenty-five years). Capitalized interest and fees are amortized over the same useful life of the asset to which it pertains, principally software development costs and building. No depreciation is recorded for assets classified as work in process until the assets are placed into service (Note 3).
Deferred Charges and Regulatory Assets and Liabilities
As a regulated entity, the Company, in appropriate circumstances, establishes regulatory assets or liabilities, and thereby defers the income statement impact of certain charges or revenues because it is probable to be collected or refunded through future customer billings. ISO-NE’s financial statements are prepared in accordance with generally accepted accounting principles for rate-regulated entities, FASB ASC Topic 980, Regulated Operations.

ISO New England Inc.
Notes to Financial Statements
For Years Ended December 31, 2018 and 2017
7
The Company incurred costs with the purchase of land located at Sullivan Road and Helmsford Way. The cost of the land at both locations, which were deferred, are being amortized, and the current year amortization is included in the current year’s filing pursuant to Section IV.A. of the Tariff (titled “Recovery of ISO Administrative Expenses”). The land located at Sullivan Road is fully amortized. The remaining cost for the land located at Helmsford Way, also deferred, will be collected in future filings.
The following table is a detail of the deferred charges, regulatory assets and liabilities balances as presented in the Statements of Financial Position: Deferred charges 2018 2017
Land located on Helmsford Way $ 796,000 $ 835,000 Interest Rate Cap 353,000 424,000
$ 1,149,000 $ 1,259,000
Regulatory assets - current 2018 2017
Actual 2016 under collection $ — $ 381,000
$ — $ 381,000
Regulatory assets, net of current portion 2018 2017Asset related to pension and postretirement
benefit liabilities (Note 5) $ 61,602,000 $ 65,147,000
$ 61,602,000 $ 65,147,000
Regulatory liability - current 2018 2017
Actual 2017 over collection $ 9,335,000 $ — Mark to Market Interest Rate Cap 28,000 26,000
$ 9,363,000 $ 26,000
Regulatory liability, net of current portion 2018 2017
Actual 2018 over collection $ 2,949,000 $ — Actual 2017 over collection — 9,335,000
$ 2,949,000 $ 9,335,000

ISO New England Inc.
Notes to Financial Statements
For Years Ended December 31, 2018 and 2017
8
Income Taxes The Company is an entity organized as a non-stock corporation under the General Corporation Law, as amended, of the State of Delaware. The Company has been recognized by the Internal Revenue Service as an organization described in Internal Revenue Code (IRC) 501(c)(3) and is generally exempt from income taxes under IRC Section 501(a). The Company has determined prior to recording any benefit in the financial statements that it is more likely than not that the tax position will be sustained upon examination by the appropriate taxing authorities, as required by the Accounting for Uncertainty in Income Taxes in FASB ASC Topic 740, Income Taxes. A tax position is measured at the largest amount of benefit that is greater than fifty percent likely of being realized upon settlement. On December 22, 2017, the President signed into law H.R. 1, originally known as the Tax Cuts and Jobs Act. The new law includes several provisions that result in substantial changes to the tax treatment of tax-exempt organizations and their donors. The Company has reviewed these provisions and the potential impact and concluded the enactment of H.R. 1 does not have a material effect on the operations of the Company. Pension and Other Postretirement Plans The Company has two noncontributory defined benefit pension plans. The benefits are based on age, years of service and average compensation. The Company also sponsors a defined postretirement benefit health, dental and life insurance plan. The Company records annual amounts relating to its pension and postretirement plans based on calculations that incorporate various actuarial and other assumptions, including discount rates, mortality, assumed rates of return, compensation increases, turnover rates and healthcare cost trend rates. The Company reviews its assumptions on an annual basis and makes modifications to the assumptions based on current rates and trends when it is appropriate to do so. The Company believes that the assumptions utilized in recording its obligations under its plans are reasonable based on its experience and market conditions. Security Deposits
The Participants are required to comply with the Financial Assurance Policy under the ISO’s Tariff. In certain cases, including non-investment grade rated Participants that meet certain criteria and all Participants participating in the Financial Transmission Rights market, the Company’s Financial Assurance Policy requires these Participants to put in place alternate forms of financial assurance. There are a few options allowed under the Company’s Financial Assurance Policy for compliance, one of which is to post cash collateral. The collateral deposits at December 31, 2018 and 2017 were $249,734,000 and $162,282,000, respectively, and are recorded in deposits payable.

ISO New England Inc.
Notes to Financial Statements
For Years Ended December 31, 2018 and 2017
9
Revenue Recognition The Company recovers its operating and debt service costs pursuant to Section IV of the ISO’s Tariff,
which provides for recovery of expenses through three schedules to Section IV.A. Scheduling, System Control and Dispatch Service (Schedule 1), Energy Administration Service (Schedule 2) and Reliability Administration Service (Schedule 3) recover related costs through a pre-approved rate applied to each month’s activity. Schedules 1, 2, and 3 are subject to true-up through subsequent years’ rates, and any over or under collection are recorded as regulatory assets or regulatory liabilities and will be recovered under future filings to recover the ISO’s expenses. Concentrations The Company’s top 10 Participants represented approximately 50% or $97,476,000 and 48% or $91,848,000 in Tariff revenues for the years ended December 31, 2018 and 2017, respectively. The Company’s top 10 Participants with unbilled accounts receivable balances represented approximately 50% or $15,822,000 and 46% or $14,941,000 as of December 31, 2018 and 2017, respectively. Liquidity Information In order to provide information about liquidity, assets have been sequenced according to their nearness to conversion to cash, and liabilities have been sequenced according to the nearness of their resulting use of cash. Reclassifications The Company has reclassified certain amounts relating to its prior period results to conform to its current period presentation. These reclassifications have not changed the results of operations of prior periods. Accounting Pronouncements Recently Adopted In August 2016, FASB issued ASU 2016-14, Not-for-Profit Entities (Topic 958): Presentation of Financial Statements of Not-for-Profit Entities. The new standard requires temporarily restricted and permanently restricted assets to collapse into one net asset class. The Company is required to reconcile such total to amounts on the balance sheet and disclose the nature of the restrictions. For non-public entities, ASU 2016-14 is effective for fiscal years beginning after December 15, 2018. The Company adopted ASU 2016-14 in 2018. Accounting Pronouncements Not Yet Adopted In February 2016, the FASB issued ASU 2016-02, Leases (Topic 842). The new standard impacts accounting and disclosure of leases such that the Company will need to recognize a right-of-use asset and a lease liability for virtually all of its leases (other than leases that meet the definition of a short-term lease). Operating leases will result in straight-line expense (similar to current operating leases) while finance leases will result in a front-loaded expense pattern (similar to current capital leases). For public entities and not-for-profit organizations that have issued, or are a conduit bond obligor for securities that are traded, listed or quoted on an exchange or an over-the-counter market, which the Company is a conduit bond obligor, ASU 2016-02 is effective for fiscal years beginning after December 15, 2018. The Company has not determined the impact to the financial statements in adoption of ASU 2016-02 in 2019.

ISO New England Inc.
Notes to Financial Statements
For Years Ended December 31, 2018 and 2017
10
In August 2016, FASB issued ASU 2016-15, Statement of Cash Flows (Topic 230): Classification of Certain Cash Receipts and Cash Payments. The new standard is intended to reduce diversity in how certain transactions are classified in the statement of cash flows. For non-public entities, ASU 2016-15 is effective for fiscal years beginning after December 15, 2018. The Company expects that the adoption of ASU 2016-15 in 2019 will not have a material impact on its financial statements. In August 2016, FASB issued ASU 2016-18, Statement of Cash Flows (Topic 230): Restricted Cash. The new standard requires that the statement of cash flows explain the change during the period in the total of cash, cash equivalents, and amounts generally described as restricted cash or restricted cash equivalents. The Company will be required to reconcile such total to amounts on the balance sheet and disclose the nature of the restrictions. For non-public entities, ASU 2016-18 is effective for fiscal years beginning after December 15, 2018. The Company is evaluating the impact on its financial statements based on the restricted cash at the time of the adoption of ASU 2016-18 in 2019. In March 2017, FASB issued ASU 2017-07, Statement of Cash Flows (Topic 715): Improving the Presentation of Net Periodic Pension Cost and Net Periodic Postretirement Benefit Cost. The new standard requires that the service cost component is broken out from other components of the net benefit cost. The Company will be required to change the disclosures to adhere to the new standard. For non-public entities, ASU 2017-07 is effective for fiscal years beginning after December 15, 2018. The Company expects that the adoption of ASU 2017-07 in 2019 will not have a material impact on its financial statements.
2. Commitments and Contingencies
Capital and Administrative Funding Tariff The FERC accepted the ISO's capital and administrative funding filings to recover administrative
expenses for 2018 and 2017. These filings, made pursuant to Section IV of the Tariff, support the ISO’s loan arrangements with various banks and note holders to fund the capital and working capital requirements of the Company. Legal Proceedings The Company is involved in various claims and legal proceedings of a nature considered normal to its business. The claims are in various stages and some may ultimately be brought to trial. While it is not feasible to predict or determine the outcome of these claims, it is the opinion of management that the final outcome of these claims will not materially impact the Company's statement of financial position or statement of activities.

ISO New England Inc.
Notes to Financial Statements
For Years Ended December 31, 2018 and 2017
11
3. Property and Equipment In-Service, Net and Work in Process
December 31,2018 2017
Computer hardware, software and accessories $ 221,785,000 $ 217,806,000 Software development costs 88,064,000 82,747,000 Furniture and fixtures 4,262,000 4,312,000 Machinery and equipment 209,000 194,000 Building and building improvements 66,321,000 66,009,000 Capitalized interest and fees 8,427,000 8,338,000 Vehicles 19,000 19,000
389,087,000 379,425,000
Less: accumulated depreciation and amortization (310,261,000) (294,305,000)
Property and equipment in-service, net $ 78,826,000 $ 85,120,000
Work in process ("WIP") $ 19,510,000 $ 18,639,000
Costs represented in WIP include Energy Storage Device Phase 1, Energy Management Platform 3.2 Upgrade Part I, nGem Software Development, Competitive Auctions with Sponsored Policy Resources, Update Enhanced Energy Scheduling Technical Architecture, CIMNET Simultaneous Feasibility Test with Data Transfer Enhancements, and Data Archival and Storage, which all began between 2016 and 2017 and continued into 2018. Additionally, a number of new projects began in 2018, such as Energy Market Offer Caps (Order 831), Streamline Asset Registration Phase III, Annual Reconfiguration Transactions, Internal Market Monitoring Data Analysis Phase II, and various other market enhancement projects that have not been placed in service as of December 31, 2018. Depreciation and amortization expense was $30,192,000 and $32,601,000 for the years ended December 31, 2018 and 2017, respectively.

ISO New England Inc.
Notes to Financial Statements
For Years Ended December 31, 2018 and 2017
12
4. Credit Facilities
Revolving Credit Arrangement In June, 2015, the Company entered into a $20,000,000 revolving credit arrangement that expired on July 1, 2018. From the period of July 1, 2015 through January 14, 2018, interest accrued on the revolving credit at either Base Rate or LIBOR of which the Company had the option of selecting the 30, 60, 90, or 180-day rate. On January 15, 2018, the Company amended the agreement to include the options of selecting Overnight and Weekly LIBOR in addition to the already existing options. Interest was paid at the earlier of the selected LIBOR term or 30 days. The Company was charged an annual fee of .10% on the unused amount on the line of credit. In July, 2018, the Company entered into a $20,000,000 revolving credit arrangement that expires on July 1, 2021, and any outstanding balance must be paid by this date. In March 2018, the Company filed under Section 204 with FERC to issue this new debt; the filing was approved in June 2018. Interest accrues on the revolving credit at either Base Rate or LIBOR of which the Company has the option of selecting the Overnight, Weekly, 30, 60, 90, or 180-day rate. Interest is paid at the earlier of the selected LIBOR term or 30 days. The Company is charged an annual fee of .075% on the unused amount on the line of credit. The outstanding balance for each of the years ended December 31, 2018 and 2017 was $0. For the years ended December 31, 2018 and 2017, the weighted average interest rate was approximately 0% and 1.82%, respectively. The Company entered into a $4,000,000 revolving credit arrangement in June 2015 that expired on July 1, 2018. From the period of July 1, 2015 through January 14, 2018, interest accrued on the revolving credit at either Base Rate or LIBOR of which the Company had the option of selecting the 30, 60, 90, or 180-day rate. On January 15, 2018, the Company amended the agreement to include the options of selecting Overnight and Weekly LIBOR in addition to the already existing options. Interest was paid at the earlier of the selected LIBOR term or 30 days. The Company is charged an annual fee of .10% on the unused amount on the line of credit. In July, 2018, the Company entered into a $4,000,000 revolving credit arrangement that expires on July 1, 2021, and any outstanding balance must be paid by this date. In March 2018, the Company filed under Section 204 with FERC to issue this new debt; the filing was approved in June 2018. Interest accrues on the revolving credit at either Base Rate or LIBOR of which the Company has the option of selecting the Overnight, Weekly, 30, 60, 90, or 180-day rate. Interest is paid at the earlier of the selected LIBOR term or 30 days. The Company is charged an annual fee of .075% on the unused amount on the line of credit. The outstanding balance for each of the years ended December 31, 2018 and 2017 was $0 for each year. The Company incurred $19,000 in debt issuance costs as a result of refinancing the revolving credit arrangement in 2018. These costs have been capitalized and are being amortized on a straight-line basis over the remaining life of the arrangement. The balance of the existing $24,000 in debt issuance costs as a result of refinancing the revolving credit arrangement in 2015 was fully amortized in 2018. Total amortization expense was approximately $7,000 and $8,000 for years ended December 31, 2018 and 2017, respectively.
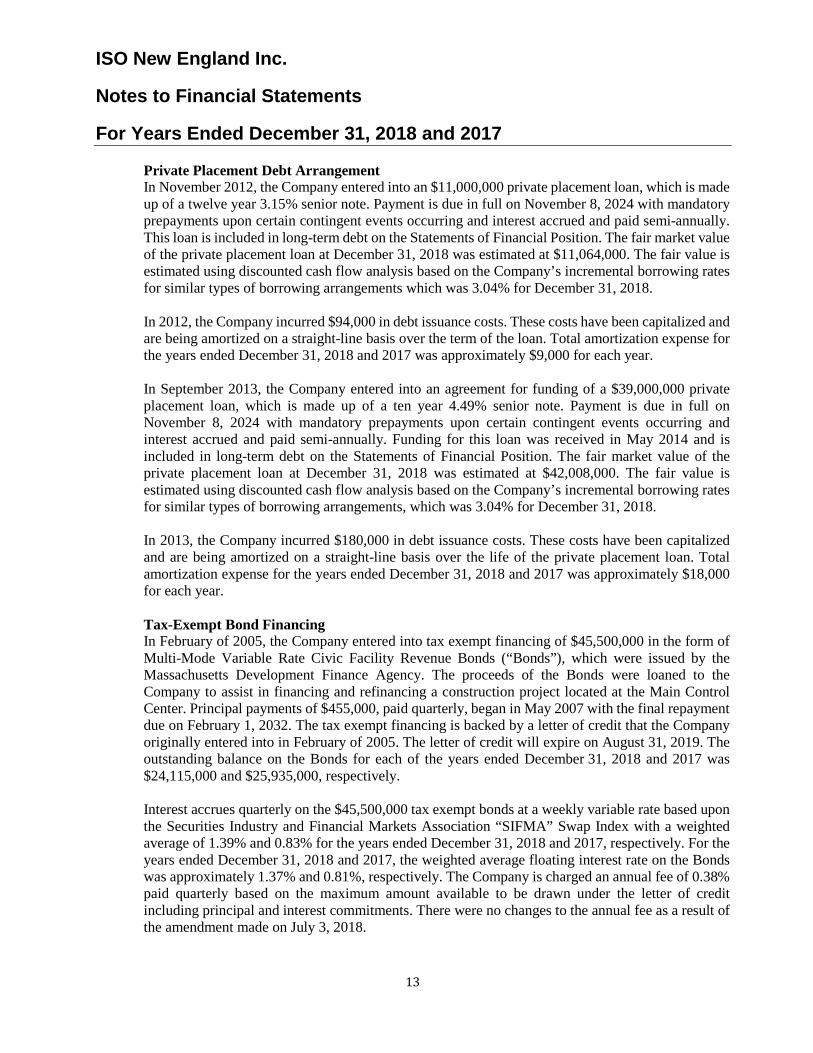
ISO New England Inc.
Notes to Financial Statements
For Years Ended December 31, 2018 and 2017
13
Private Placement Debt Arrangement In November 2012, the Company entered into an $11,000,000 private placement loan, which is made up of a twelve year 3.15% senior note. Payment is due in full on November 8, 2024 with mandatory prepayments upon certain contingent events occurring and interest accrued and paid semi-annually. This loan is included in long-term debt on the Statements of Financial Position. The fair market value of the private placement loan at December 31, 2018 was estimated at $11,064,000. The fair value is estimated using discounted cash flow analysis based on the Company’s incremental borrowing rates for similar types of borrowing arrangements which was 3.04% for December 31, 2018. In 2012, the Company incurred $94,000 in debt issuance costs. These costs have been capitalized and are being amortized on a straight-line basis over the term of the loan. Total amortization expense for the years ended December 31, 2018 and 2017 was approximately $9,000 for each year. In September 2013, the Company entered into an agreement for funding of a $39,000,000 private placement loan, which is made up of a ten year 4.49% senior note. Payment is due in full on November 8, 2024 with mandatory prepayments upon certain contingent events occurring and interest accrued and paid semi-annually. Funding for this loan was received in May 2014 and is included in long-term debt on the Statements of Financial Position. The fair market value of the private placement loan at December 31, 2018 was estimated at $42,008,000. The fair value is estimated using discounted cash flow analysis based on the Company’s incremental borrowing rates for similar types of borrowing arrangements, which was 3.04% for December 31, 2018. In 2013, the Company incurred $180,000 in debt issuance costs. These costs have been capitalized and are being amortized on a straight-line basis over the life of the private placement loan. Total amortization expense for the years ended December 31, 2018 and 2017 was approximately $18,000 for each year. Tax-Exempt Bond Financing In February of 2005, the Company entered into tax exempt financing of $45,500,000 in the form of Multi-Mode Variable Rate Civic Facility Revenue Bonds (“Bonds”), which were issued by the Massachusetts Development Finance Agency. The proceeds of the Bonds were loaned to the Company to assist in financing and refinancing a construction project located at the Main Control Center. Principal payments of $455,000, paid quarterly, began in May 2007 with the final repayment due on February 1, 2032. The tax exempt financing is backed by a letter of credit that the Company originally entered into in February of 2005. The letter of credit will expire on August 31, 2019. The outstanding balance on the Bonds for each of the years ended December 31, 2018 and 2017 was $24,115,000 and $25,935,000, respectively. Interest accrues quarterly on the $45,500,000 tax exempt bonds at a weekly variable rate based upon the Securities Industry and Financial Markets Association “SIFMA” Swap Index with a weighted average of 1.39% and 0.83% for the years ended December 31, 2018 and 2017, respectively. For the years ended December 31, 2018 and 2017, the weighted average floating interest rate on the Bonds was approximately 1.37% and 0.81%, respectively. The Company is charged an annual fee of 0.38% paid quarterly based on the maximum amount available to be drawn under the letter of credit including principal and interest commitments. There were no changes to the annual fee as a result of the amendment made on July 3, 2018.
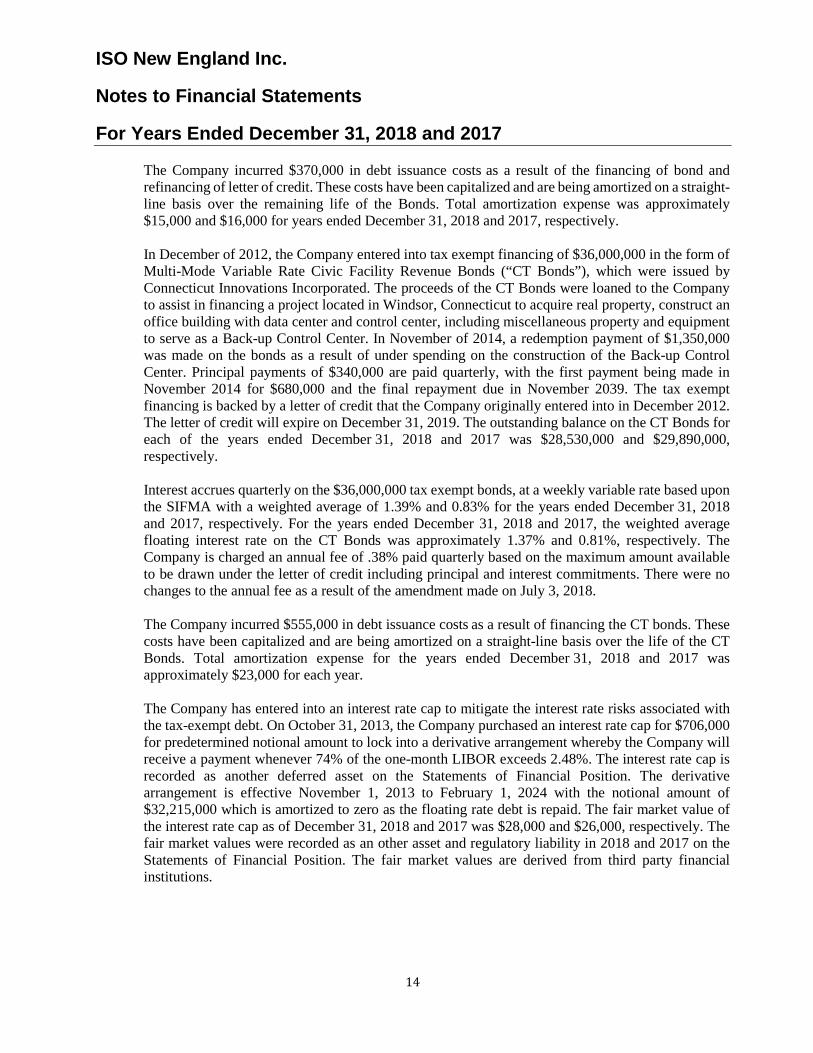
ISO New England Inc.
Notes to Financial Statements
For Years Ended December 31, 2018 and 2017
14
The Company incurred $370,000 in debt issuance costs as a result of the financing of bond and refinancing of letter of credit. These costs have been capitalized and are being amortized on a straight-line basis over the remaining life of the Bonds. Total amortization expense was approximately $15,000 and $16,000 for years ended December 31, 2018 and 2017, respectively. In December of 2012, the Company entered into tax exempt financing of $36,000,000 in the form of Multi-Mode Variable Rate Civic Facility Revenue Bonds (“CT Bonds”), which were issued by Connecticut Innovations Incorporated. The proceeds of the CT Bonds were loaned to the Company to assist in financing a project located in Windsor, Connecticut to acquire real property, construct an office building with data center and control center, including miscellaneous property and equipment to serve as a Back-up Control Center. In November of 2014, a redemption payment of $1,350,000 was made on the bonds as a result of under spending on the construction of the Back-up Control Center. Principal payments of $340,000 are paid quarterly, with the first payment being made in November 2014 for $680,000 and the final repayment due in November 2039. The tax exempt financing is backed by a letter of credit that the Company originally entered into in December 2012. The letter of credit will expire on December 31, 2019. The outstanding balance on the CT Bonds for each of the years ended December 31, 2018 and 2017 was $28,530,000 and $29,890,000, respectively. Interest accrues quarterly on the $36,000,000 tax exempt bonds, at a weekly variable rate based upon the SIFMA with a weighted average of 1.39% and 0.83% for the years ended December 31, 2018 and 2017, respectively. For the years ended December 31, 2018 and 2017, the weighted average floating interest rate on the CT Bonds was approximately 1.37% and 0.81%, respectively. The Company is charged an annual fee of .38% paid quarterly based on the maximum amount available to be drawn under the letter of credit including principal and interest commitments. There were no changes to the annual fee as a result of the amendment made on July 3, 2018. The Company incurred $555,000 in debt issuance costs as a result of financing the CT bonds. These costs have been capitalized and are being amortized on a straight-line basis over the life of the CT Bonds. Total amortization expense for the years ended December 31, 2018 and 2017 was approximately $23,000 for each year. The Company has entered into an interest rate cap to mitigate the interest rate risks associated with the tax-exempt debt. On October 31, 2013, the Company purchased an interest rate cap for $706,000 for predetermined notional amount to lock into a derivative arrangement whereby the Company will receive a payment whenever 74% of the one-month LIBOR exceeds 2.48%. The interest rate cap is recorded as another deferred asset on the Statements of Financial Position. The derivative arrangement is effective November 1, 2013 to February 1, 2024 with the notional amount of $32,215,000 which is amortized to zero as the floating rate debt is repaid. The fair market value of the interest rate cap as of December 31, 2018 and 2017 was $28,000 and $26,000, respectively. The fair market values were recorded as an other asset and regulatory liability in 2018 and 2017 on the Statements of Financial Position. The fair market values are derived from third party financial institutions.

ISO New England Inc.
Notes to Financial Statements
For Years Ended December 31, 2018 and 2017
15
2018 2017
Long-term debt $ 102,645,000 $ 105,825,000 Less: applicable debt issuance cost (303,000) (327,000)
Total long-term debt $ 102,342,000 $ 105,498,000
December 31,
The total long-term debt at December 31, 2018 and 2017 was $102,645,000 and $105,825,000, respectively. Principal payments on the private placement debt and tax-exempt bonds, excluding debt issuance cost, are due annually as follows:
2019 $ 3,180,000 2020 3,180,000 2021 3,180,000 2022 3,180,000 2023 3,180,000 Thereafter 86,745,000
$ 102,645,000
Interest incurred on the revolving credit arrangement, private placement debt, and tax-exempt bonds for the years ended December 31, 2018 and 2017 was approximately $2,850,000 and $2,619,000, respectively.
5. Pension and Other Employee Benefits
The Company sponsors two defined benefit pension plans (one for union and the other for nonunion employees), each of which is funded solely by Company contributions. Benefits are determined based on years of service and average compensation. Effective January 1, 2014, the defined benefit pension plans were closed to all employees hired or rehired on or after January 1, 2014.
The Company sponsors a postretirement benefit plan other than pension that provides medical, dental and life insurance benefits for eligible employees and their beneficiaries. The medical benefits are contributory with participants’ contributions adjusted annually, and participants are responsible for deductible and coinsurance amounts. Dental benefits are non-contributory but participants are responsible for deductible and coinsurance amounts. The life insurance benefits are non-contributory. The measurement date used to determine pension and other postretirement benefit obligations for the pension plans and the postretirement benefit plan is December 31. Effective January 1, 2016, the postretirement benefit plan other than pension was closed to employees hired or rehired on or after January 1, 2016.
The Company accounts for the plans as required in FASB ASC Topic 715, Compensation – Retirement Benefits. Additionally, the Company discloses net periodic benefit cost for the defined benefit pension and other postretirement benefit plan for each annual period for which a statement of income is presented as required by the Employers’ Disclosures.

ISO New England Inc.
Notes to Financial Statements
For Years Ended December 31, 2018 and 2017
16
In 2010, the Patient Protection and Affordable Care Act and the Health Care and Education Reconciliation Act (collectively, the “Health Care Acts”) were signed into law by President Obama. The Health Care Acts include several provisions that may affect a company’s postretirement benefit plans, including imposing an excise tax on high cost coverage, eliminating lifetime and annual coverage limits, reducing subsidies to Medicare Advantage plans, and extending coverage for adult children until age 26. The Company has evaluated the effects of the Health Care Acts and concluded that as of December 31, 2018, none of the provisions have a material impact on its postretirement benefit plan. The Company does not provide benefits that are actuarially equivalent to the Medicare prescription drug benefit in its postretirement benefit plan.
The following table sets forth the plans’ benefit obligations, fair value of the plans’ assets, and the plans’ funded status:
Pension Benefits Other Postretirement BenefitsYears Ended December 31, Years Ended December 31,
2018 2017 2018 2017
Change in benefit obligation:Benefit obligation at beginning of year $ 221,102,000 $ 189,402,000 $ 22,231,000 $ 19,926,000 Service cost 10,223,000 8,647,000 1,457,000 1,326,000 Interest cost 7,798,000 7,445,000 738,000 749,000 Benefits paid (5,765,000) (3,953,000) (678,000) (652,000) Amendments — — (247,000) — Plan participants' contributions — — 180,000 120,000 Actuarial loss(gain) (21,313,000) 19,561,000 (3,069,000) 762,000
Benefit obligation at end of year 212,045,000 221,102,000 20,612,000 22,231,000
Change in plan assets:Fair value of plan assets at beginning
of year 157,965,000 131,507,000 20,221,000 17,602,000 Actual return on plan assets (10,487,000) 20,343,000 (1,104,000) 2,452,000 Employer contributions 10,111,000 10,068,000 612,000 699,000 Plan participants' contributions — — 180,000 120,000 Benefits paid (5,765,000) (3,953,000) (678,000) (652,000)
Fair value of plan assets at end of year 151,824,000 157,965,000 19,231,000 20,221,000
Funded status at end of the year (60,221,000) (63,137,000) (1,381,000) (2,010,000)
Net amount recognized as non-current liabilities $ (60,221,000) $ (63,137,000) $ (1,381,000) $ (2,010,000)
The Company has determined that the pension liability is probable of recovery through Section IV.A. of the Tariff and has recorded a regulatory asset as of December 31, 2018 and 2017 in the accompanying Statements of Financial Position.
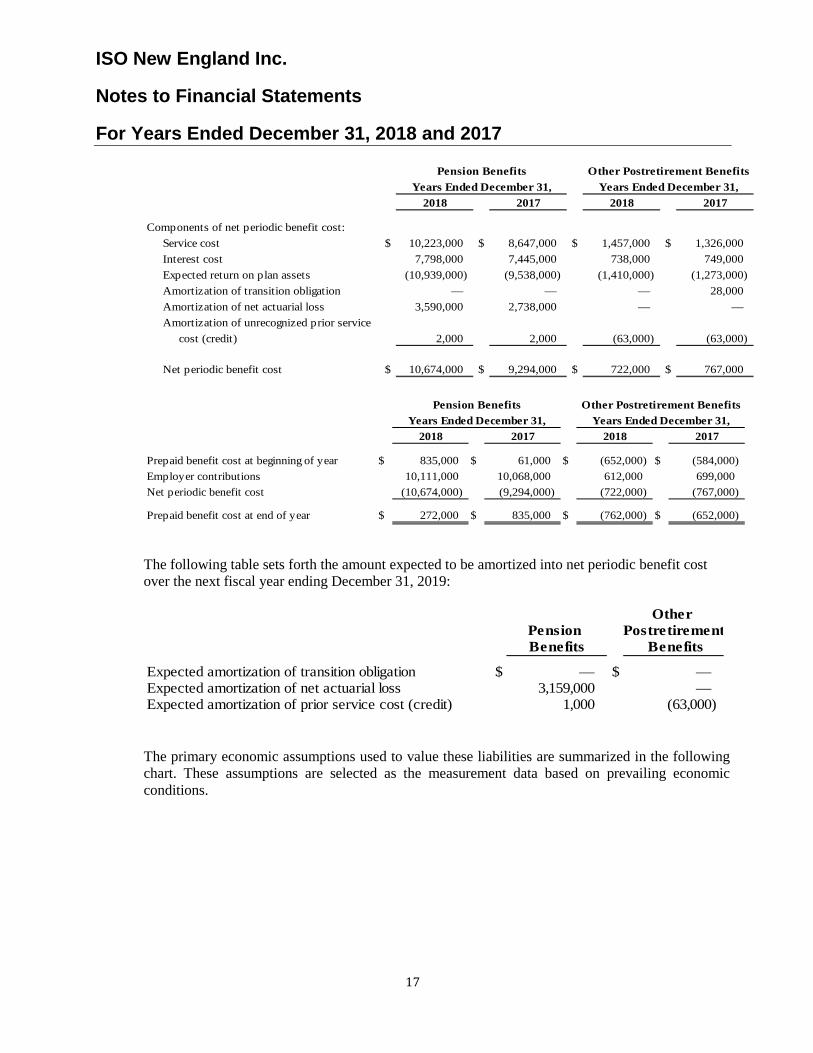
ISO New England Inc.
Notes to Financial Statements
For Years Ended December 31, 2018 and 2017
17
Pension Benefits Other Postretirement BenefitsYears Ended December 31, Years Ended December 31,
2018 2017 2018 2017
Components of net periodic benefit cost:Service cost $ 10,223,000 $ 8,647,000 $ 1,457,000 $ 1,326,000 Interest cost 7,798,000 7,445,000 738,000 749,000 Expected return on plan assets (10,939,000) (9,538,000) (1,410,000) (1,273,000) Amortization of transition obligation — — — 28,000 Amortization of net actuarial loss 3,590,000 2,738,000 — — Amortization of unrecognized prior service
cost (credit) 2,000 2,000 (63,000) (63,000)
Net periodic benefit cost $ 10,674,000 $ 9,294,000 $ 722,000 $ 767,000
Pension Benefits Other Postretirement BenefitsYears Ended December 31, Years Ended December 31,
2018 2017 2018 2017
Prepaid benefit cost at beginning of year $ 835,000 $ 61,000 $ (652,000) $ (584,000) Employer contributions 10,111,000 10,068,000 612,000 699,000 Net periodic benefit cost (10,674,000) (9,294,000) (722,000) (767,000)
Prepaid benefit cost at end of year $ 272,000 $ 835,000 $ (762,000) $ (652,000)
The following table sets forth the amount expected to be amortized into net periodic benefit cost over the next fiscal year ending December 31, 2019:
Other Pension PostretirementBenefits Benefits
Expected amortization of transition obligation $ — $ — Expected amortization of net actuarial loss 3,159,000 — Expected amortization of prior service cost (credit) 1,000 (63,000)
The primary economic assumptions used to value these liabilities are summarized in the following chart. These assumptions are selected as the measurement data based on prevailing economic conditions.
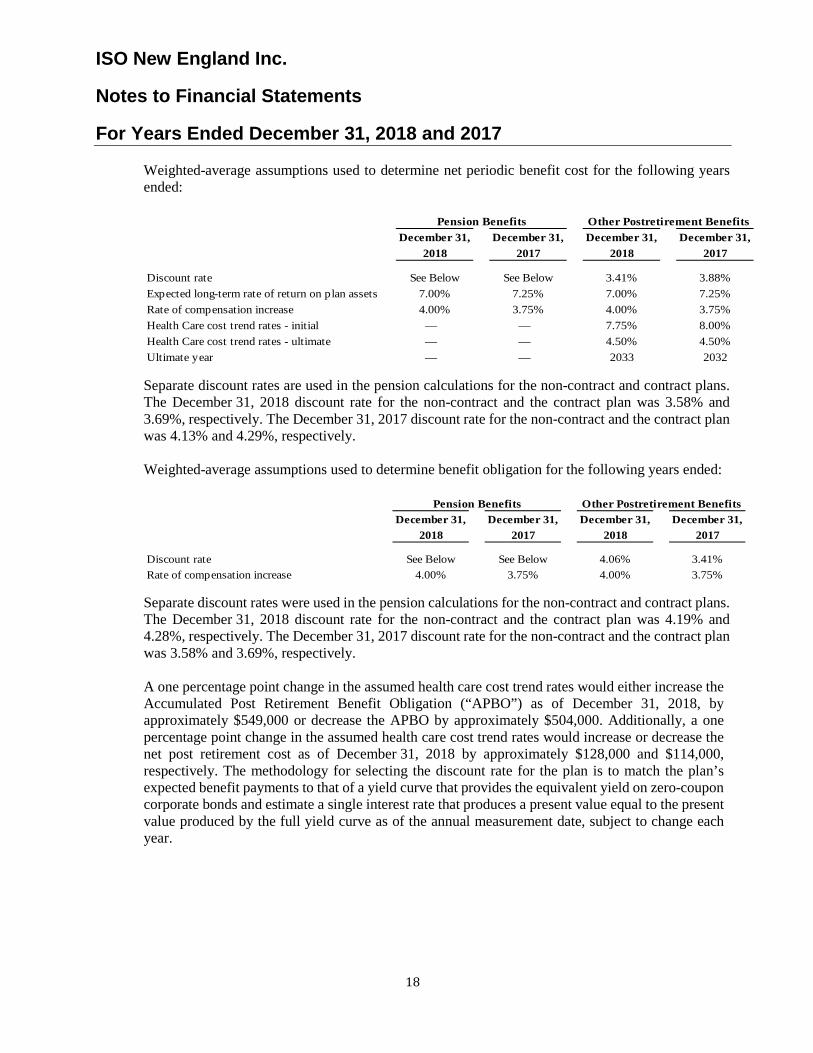
ISO New England Inc.
Notes to Financial Statements
For Years Ended December 31, 2018 and 2017
18
Weighted-average assumptions used to determine net periodic benefit cost for the following years ended:
Pension Benefits Other Postretirement BenefitsDecember 31, December 31, December 31, December 31,
2018 2017 2018 2017
Discount rate See Below See Below 3.41% 3.88%Expected long-term rate of return on plan assets 7.00% 7.25% 7.00% 7.25%Rate of compensation increase 4.00% 3.75% 4.00% 3.75%Health Care cost trend rates - initial — — 7.75% 8.00%Health Care cost trend rates - ultimate — — 4.50% 4.50%Ultimate year — — 2033 2032
Separate discount rates are used in the pension calculations for the non-contract and contract plans. The December 31, 2018 discount rate for the non-contract and the contract plan was 3.58% and 3.69%, respectively. The December 31, 2017 discount rate for the non-contract and the contract plan was 4.13% and 4.29%, respectively. Weighted-average assumptions used to determine benefit obligation for the following years ended:
Pension Benefits Other Postretirement BenefitsDecember 31, December 31, December 31, December 31,
2018 2017 2018 2017
Discount rate See Below See Below 4.06% 3.41%Rate of compensation increase 4.00% 3.75% 4.00% 3.75%
Separate discount rates were used in the pension calculations for the non-contract and contract plans. The December 31, 2018 discount rate for the non-contract and the contract plan was 4.19% and 4.28%, respectively. The December 31, 2017 discount rate for the non-contract and the contract plan was 3.58% and 3.69%, respectively. A one percentage point change in the assumed health care cost trend rates would either increase the Accumulated Post Retirement Benefit Obligation (“APBO”) as of December 31, 2018, by approximately $549,000 or decrease the APBO by approximately $504,000. Additionally, a one percentage point change in the assumed health care cost trend rates would increase or decrease the net post retirement cost as of December 31, 2018 by approximately $128,000 and $114,000, respectively. The methodology for selecting the discount rate for the plan is to match the plan’s expected benefit payments to that of a yield curve that provides the equivalent yield on zero-coupon corporate bonds and estimate a single interest rate that produces a present value equal to the present value produced by the full yield curve as of the annual measurement date, subject to change each year.

ISO New England Inc.
Notes to Financial Statements
For Years Ended December 31, 2018 and 2017
19
ISO’s pension plan and postretirement benefit plan weighted-average asset allocations and expected returns by asset category are as follows:
Pension and Postretirement Plan Assets Weighted Average
Target Percentage of Plan Expected Long-TermAllocation Assets at December 31 Rate of Return -
2019 2018 2017 2019
Equity Securities 54% 54% 59% 4.86%Debt Securities 36% 36% 36% 1.34%Real Estate 5% 5% 0% 0.40%Other 5% 5% 5% 0.40%
Total 100% 100% 100% 7.00%
The forward-looking estimates of total return are generated through combined assessment of current valuation measures, income, economic growth and inflation forecasts, historical risk premiums, and universal capital market assumptions. The long-term bond forecast is derived from the expected long-term return of a portfolio of corporate, government and high yield debt instruments. The equity forecasts are based on the long-term real returns of a portfolio of US large cap, US small cap, international developed markets and emerging markets equity securities. The plan’s investment portfolio is to be invested to provide benefits for qualified employees of the ISO. Investments are to be compatible with the liquidity requirements determined by the plan’s actuary. An optimal target allocation of 60/40 between equities and fixed income investments is to be kept with an allowance of fifteen percent (15%) over/under deviation from the optimal allocation target.

ISO New England Inc.
Notes to Financial Statements
For Years Ended December 31, 2018 and 2017
20
The fair values of the pension plan assets at December 31, 2018 and 2017 by asset category are as follows:
QuotedPrices in
ActiveMarket Markets for Significant SignificantValue at Identical Observable Unobservable
December 31, Assets Inputs Inputs2018 (Level 1) (Level 2) (Level 3)
Long-term investment strategies: Fixed income:
Long Duration Corporate Bonds $ 54,184,000 $ — $ 54,184,000 $ — Reinsurance Bond 3,795,000 3,795,000 — — U.S. High Yield Bond Funds 4,596,000 4,596,000 — —
Total 62,575,000 8,391,000 54,184,000 —
Global (ex-U.S.) equities:Developed markets 18,026,000 18,026,000 — — Emerging markets value (actively managed) 4,527,000 4,527,000 — —
Total 22,553,000 22,553,000 — —
Real assets:U.S. real estate investment trust funds 7,547,000 7,547,000 — — Private real estate mutual funds 4,121,000 4,121,000 — —
Total 11,668,000 11,668,000 — —
Cash and cash equivalents 919,000 919,000 — —
Total long-term investments $ 97,715,000 $ 43,531,000 $ 54,184,000 $ —
Investments redeemable at net asset value:Traditional equity index funds 54,109,000
Total 54,109,000
Total Portfolio $ 151,824,000
Certain investments are measured at fair value using net asset value (“NAV”) as a practical expedient and have not been classified in the fair value hierarchy. The NAV amounts have been presented to permit reconciliation of the fair value hierarchy to the amounts presented in the statements of financial position.
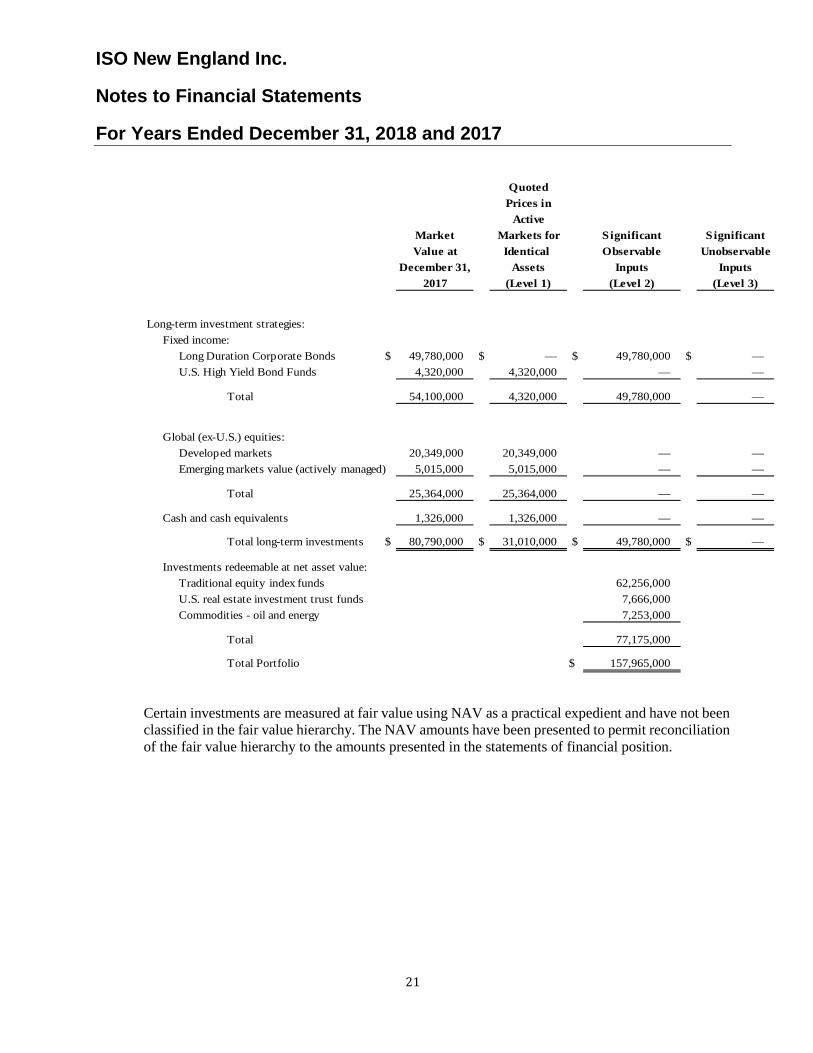
ISO New England Inc.
Notes to Financial Statements
For Years Ended December 31, 2018 and 2017
21
QuotedPrices in
ActiveMarket Markets for Significant SignificantValue at Identical Observable Unobservable
December 31, Assets Inputs Inputs2017 (Level 1) (Level 2) (Level 3)
Long-term investment strategies: Fixed income:
Long Duration Corporate Bonds $ 49,780,000 $ — $ 49,780,000 $ — U.S. High Yield Bond Funds 4,320,000 4,320,000 — —
Total 54,100,000 4,320,000 49,780,000 —
Global (ex-U.S.) equities:Developed markets 20,349,000 20,349,000 — — Emerging markets value (actively managed) 5,015,000 5,015,000 — —
Total 25,364,000 25,364,000 — —
Cash and cash equivalents 1,326,000 1,326,000 — —
Total long-term investments $ 80,790,000 $ 31,010,000 $ 49,780,000 $ —
Investments redeemable at net asset value:Traditional equity index funds 62,256,000 U.S. real estate investment trust funds 7,666,000 Commodities - oil and energy 7,253,000
Total 77,175,000
Total Portfolio $ 157,965,000
Certain investments are measured at fair value using NAV as a practical expedient and have not been classified in the fair value hierarchy. The NAV amounts have been presented to permit reconciliation of the fair value hierarchy to the amounts presented in the statements of financial position.

ISO New England Inc.
Notes to Financial Statements
For Years Ended December 31, 2018 and 2017
22
The fair values of the other postretirement benefit plan assets at December 31, 2018 and 2017 by asset category are as follows:
QuotedPrices in
ActiveMarket Markets for Significant SignificantValue at Identical Observable Unobservable
December 31, Assets Inputs Inputs2018 (Level 1) (Level 2) (Level 3)
Long-term investment strategies: Fixed income:
U.S. Treasury inflation-protected $ 1,007,000 $ 1,007,000 $ — $ — U.S. and global core fixed income funds 5,809,000 5,809,000 — — U.S. High Yield Bond Funds 603,000 603,000 — — Reinsurance Bond 464,000 464,000 — —
Total 7,883,000 7,883,000 — — Domestic equities:
Traditional equity index funds 6,821,000 6,821,000 — —
Total 6,821,000 6,821,000 — —
Global (ex-U.S.) equities:Developed markets 2,271,000 2,271,000 — — Emerging markets value (actively managed) 537,000 537,000 — —
Total 2,808,000 2,808,000 — — Real assets:
U.S. real estate investment trust funds 950,000 950,000 — — Private real estate mutual funds 516,000 516,000 — —
Total 1,466,000 1,466,000 — —
Cash and cash equivalents 253,000 253,000 — —
Total long-term investments $ 19,231,000 $ 19,231,000 $ — $ —
Total Portfolio $ 19,231,000 Certain investments are measured at fair value using NAV as a practical expedient and have not been classified in the fair value hierarchy. The NAV amounts have been presented to permit reconciliation of the fair value hierarchy to the amounts presented in the statements of financial position.
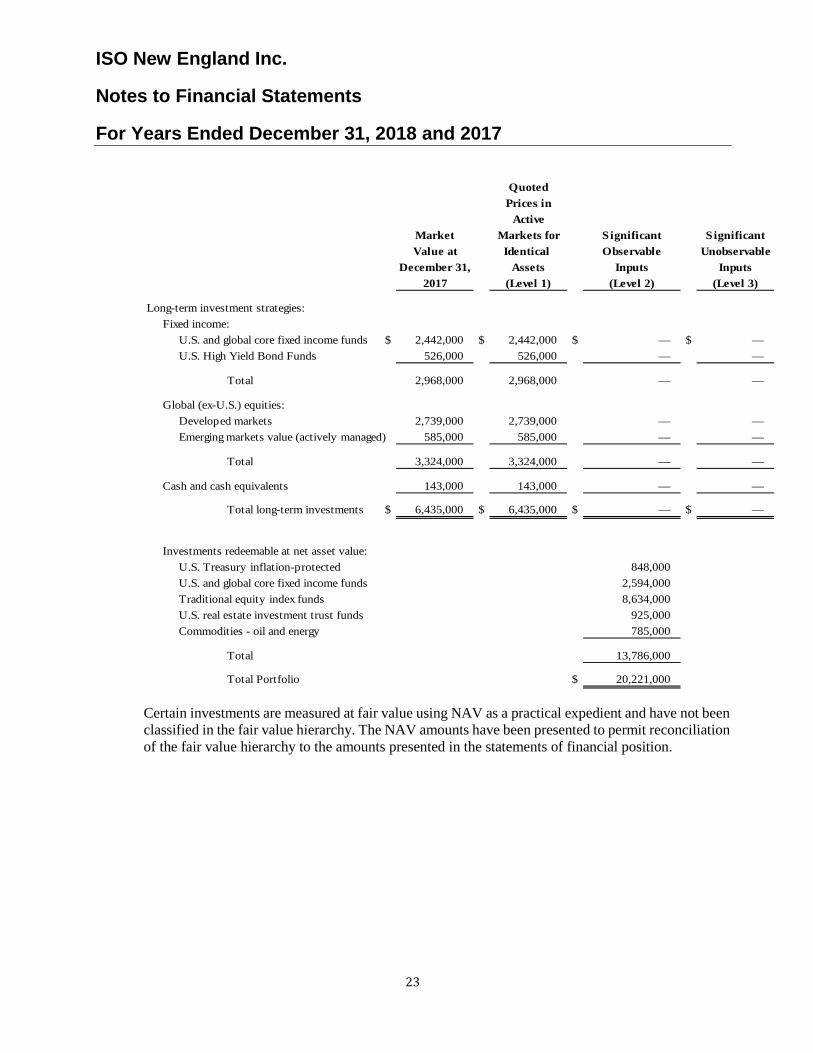
ISO New England Inc.
Notes to Financial Statements
For Years Ended December 31, 2018 and 2017
23
QuotedPrices in
ActiveMarket Markets for Significant SignificantValue at Identical Observable Unobservable
December 31, Assets Inputs Inputs2017 (Level 1) (Level 2) (Level 3)
Long-term investment strategies: Fixed income:
U.S. and global core fixed income funds $ 2,442,000 $ 2,442,000 $ — $ — U.S. High Yield Bond Funds 526,000 526,000 — —
Total 2,968,000 2,968,000 — —
Global (ex-U.S.) equities:Developed markets 2,739,000 2,739,000 — — Emerging markets value (actively managed) 585,000 585,000 — —
Total 3,324,000 3,324,000 — —
Cash and cash equivalents 143,000 143,000 — —
Total long-term investments $ 6,435,000 $ 6,435,000 $ — $ —
Investments redeemable at net asset value:U.S. Treasury inflation-protected 848,000 U.S. and global core fixed income funds 2,594,000 Traditional equity index funds 8,634,000 U.S. real estate investment trust funds 925,000 Commodities - oil and energy 785,000
Total 13,786,000
Total Portfolio $ 20,221,000
Certain investments are measured at fair value using NAV as a practical expedient and have not been classified in the fair value hierarchy. The NAV amounts have been presented to permit reconciliation of the fair value hierarchy to the amounts presented in the statements of financial position.

ISO New England Inc.
Notes to Financial Statements
For Years Ended December 31, 2018 and 2017
24
The Company expects to contribute $10,000,000 to its pension plans and $650,000 to its postretirement benefit plan in 2019. The following benefit payments, which reflect expected future service, as appropriate, are expected to be paid:
OtherPension PostretirementBenefits Benefits
2019 $ 9,472,000 $ 884,000 2020 10,326,000 969,000 2021 9,095,000 1,062,000 2022 11,333,000 1,136,000 2023 9,456,000 1,262,000 Years 2024-2028 61,478,000 7,295,000
Total $ 111,160,000 $ 12,608,000
6. Fair Value of Financial Statement Instruments
In determining fair value of financial assets and liabilities, the Company uses various valuation techniques. The availability of inputs observable in the market varies from instrument to instrument and depends on a variety of factors including the type of instrument, whether the instrument is actively traded, and other characteristics particular to the transaction. For many financial instruments, pricing inputs are readily observable in the market, the valuation methodology used is widely accepted by market participants, and the valuation does not require significant management discretion. For other financial instruments, pricing inputs are less observable in the market and may require management’s judgment. We assess the inputs used to measure fair value using the following three-tier hierarchy, which indicates the extent to which inputs used are observable in the market. Level 1 Valuation is based upon unadjusted quoted prices for identical instruments traded in active markets. Level 2 Valuation is based upon quoted prices for identical or similar instruments such as interest rates, foreign currency exchange rates, commodity rates and yield curves, and model-based valuation techniques for which all significant assumptions are observable in the market. Level 3 Valuation is generated from model-based techniques that use at least one significant assumption not observable in the market. These unobservable assumptions include management’s own judgments about the assumptions market participants would use in pricing the asset or liability. Valuation techniques include use of option pricing models, discounted cash flow models and similar techniques.

ISO New England Inc.
Notes to Financial Statements
For Years Ended December 31, 2018 and 2017
25
7. 401(k) Savings and Defined Contribution Plans The Company has a 401(k) Retirement and Savings Plan open to substantially all employees. This
savings plan provides for employee contributions up to specified limits. The Company matches employee contributions up to 3% of eligible compensation and provides a 50% match on the next 2% of eligible compensation. The matching contributions for the Company were $3,171,000 and $3,058,000 for the years ended December 31, 2018 and 2017, respectively. In 2014, the Company established a defined contribution plan for new employees hired after January 1, 2014. The Company funds the contribution into the plan based on a formula of employee’s age, service and compensation. The contributions paid by the Company were $839,000 and $641,000 for the years ended December 31, 2018 and 2017, respectively.
8. Leases
The following is a schedule by year of future minimum rental payments for all non-cancelable operating leases:
2019 $ 714,000 2020 435,000 2021 176,000 2022 15,000
Total minimum lease payments $ 1,340,000
The Company currently leases office equipment and computer hardware through 2022. For fiscal years 2018 and 2017, rental payments for operating leases were $872,000 and $1,016,000, respectively.
9. Subsequent Events The Company has evaluated subsequent events from the balance sheet date through, March 22 2019, the date at which the financial statements were available to be issued, and determined that there are no items to disclose that occurred in the subsequent period.