Demand Resources in ISO-NE Markets and Planning
23
ISO-NE PUBLIC OCTOBER 27, 2016 | NEW BRITAIN, CT Eric Winkler, Ph.D. TECHNICAL MANAGER, SYSTEM PLANNING Connecticut Department of Energy and Environmental Protection Demand Resources in ISO-NE Markets and Planning
Transcript of Demand Resources in ISO-NE Markets and Planning
ISO-NE PUBLIC
O C T O B E R 2 7 , 2 0 1 6 | N E W B R I T A I N , C T
Eric Winkler, Ph.D. T E C H N I C A L M A N A G E R , S Y S T E M P L A N N I N G
Connecticut Department of Energy and Environmental Protection
Demand Resources in ISO-NE Markets and Planning

ISO-NE PUBLIC
2
Overview of Presentation
• ISO New England Overview
• Overview of Demand Resources in ISO-NE Markets
• Forward Capacity Market
• Long-Range Planning and Economic Studies
• Opportunities and Challenges for Demand Resources in Markets and Planning

ISO-NE PUBLIC
ISO New England (ISO) Has Two Decades of Experience Overseeing the Region’s Restructured Electric Power System
• Regulated by the Federal Energy Regulatory Commission
• Reliability coordinator for New England under the North American Electric Reliability Corporation
• Independent of companies in the marketplace and neutral on technology
3

ISO-NE PUBLIC
Reliability Is the Core of ISO New England’s Mission Fulfilled by three interconnected and interdependent responsibilities
Overseeing the day-to-day operation of New England’s electric power generation and transmission system
Developing and administering the region’s competitive wholesale electricity markets
Managing comprehensive regional power system planning
4
ISO-NE PUBLIC
ISO-NE INTERNAL USE
ISO-NE PUBLIC
ISO-NE INTERNAL USE
ISO-NE PUBLIC
OVERVIEW OF DEMAND RESOURCES IN ISO-NE MARKETS
5
ISO-NE PUBLIC
6
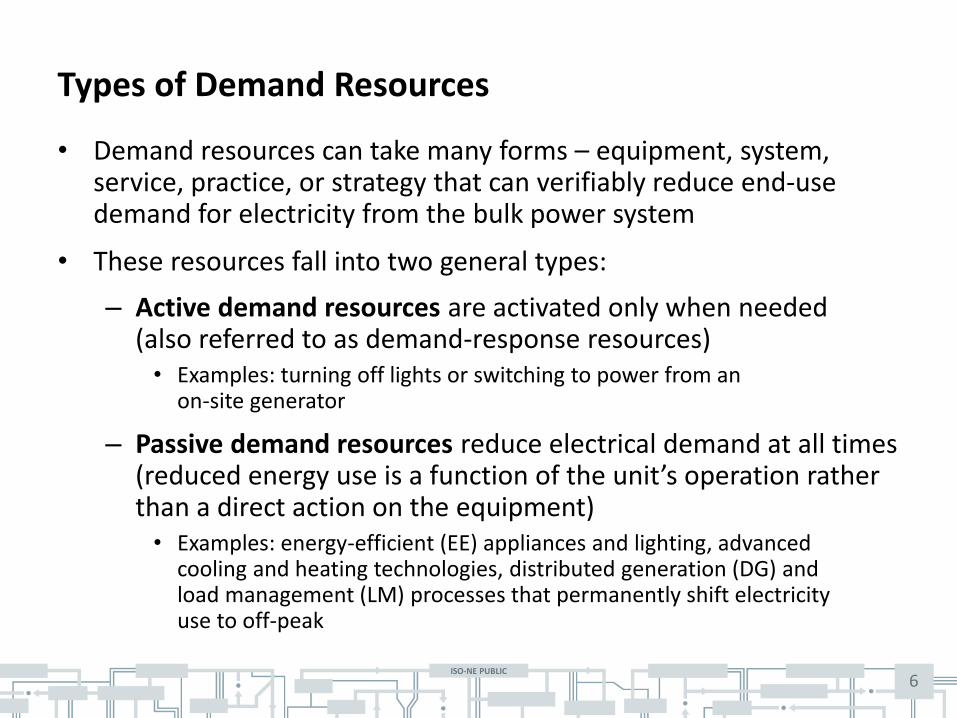
Types of Demand Resources
• Demand resources can take many forms – equipment, system, service, practice, or strategy that can verifiably reduce end-use demand for electricity from the bulk power system
• These resources fall into two general types:
– Active demand resources are activated only when needed (also referred to as demand-response resources)
• Examples: turning off lights or switching to power from an on-site generator
– Passive demand resources reduce electrical demand at all times (reduced energy use is a function of the unit’s operation rather than a direct action on the equipment)
• Examples: energy-efficient (EE) appliances and lighting, advanced cooling and heating technologies, distributed generation (DG) and load management (LM) processes that permanently shift electricity use to off-peak
ISO-NE PUBLIC
7
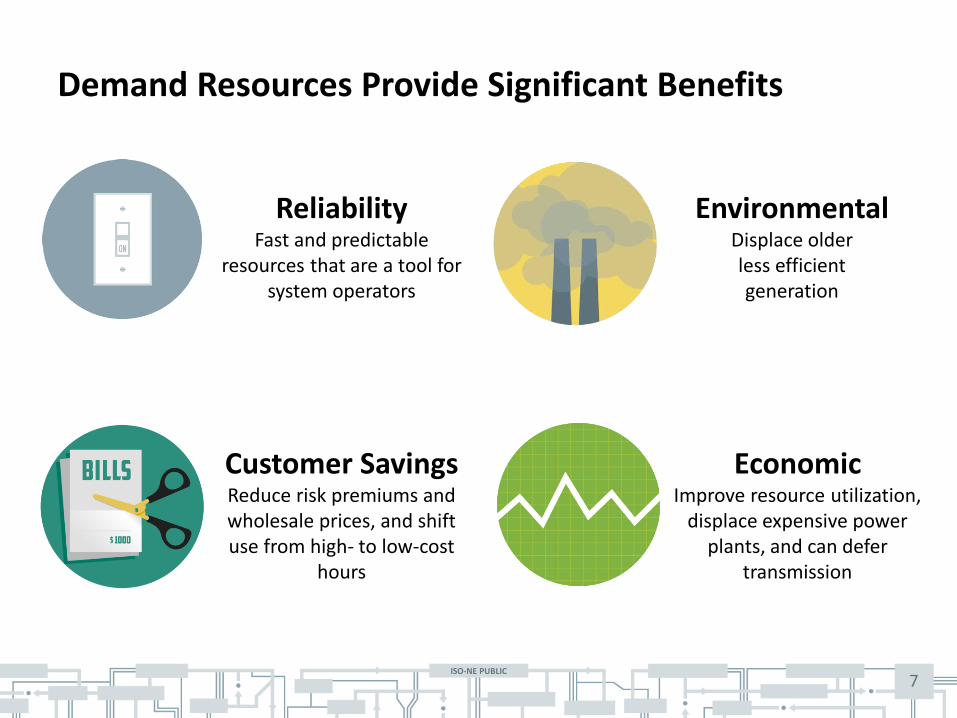
Demand Resources Provide Significant Benefits
Reliability Fast and predictable
resources that are a tool for system operators
Environmental Displace older less efficient generation
Customer Savings Reduce risk premiums and wholesale prices, and shift use from high- to low-cost
hours
Economic Improve resource utilization,
displace expensive power plants, and can defer
transmission
ISO-NE PUBLIC
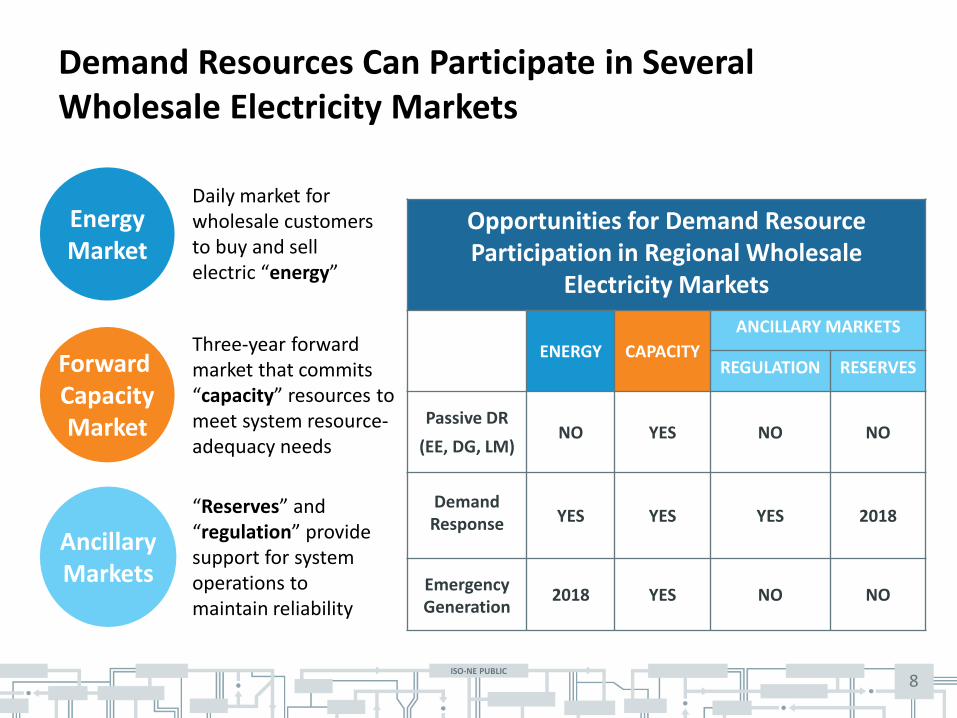
Demand Resources Can Participate in Several Wholesale Electricity Markets
8
Energy Market
Forward Capacity Market
Ancillary Markets
Daily market for wholesale customers to buy and sell electric “energy”
Three-year forward market that commits “capacity” resources to meet system resource-adequacy needs
“Reserves” and “regulation” provide support for system operations to maintain reliability
Opportunities for Demand Resource Participation in Regional Wholesale
Electricity Markets
ENERGY CAPACITY
ANCILLARY MARKETS
REGULATION RESERVES
Passive DR
(EE, DG, LM) NO YES NO NO
Demand Response YES YES YES 2018
Emergency Generation
2018 YES NO NO
ISO-NE PUBLIC
ISO-NE INTERNAL USE
ISO-NE PUBLIC
ISO-NE INTERNAL USE
ISO-NE PUBLIC
FORWARD CAPACITY MARKET
9
ISO-NE PUBLIC
10
Forward Capacity Market Overview
• The Forward Capacity Market (FCM) is a locational market that procures capacity to meet New England’s forecasted Installed Capacity Requirement (ICR) three years in the future
– Capacity Zones are developed to align with system transmission constraints and are a mechanism to signal areas of need to the marketplace
• The FCM allows new capacity projects to compete in the market and set the price for capacity in the region
• The FCM selects a portfolio of generation and demand-side resources through a competitive Forward Capacity Auction (FCA) process
– Resources must be pre-qualified to participate in the auction – Resources must clear in the auction and perform to be paid for capacity
during the Capacity Commitment Period (CCP)
• The FCM provides a long-term (up to 7-year) commitment to new supply and demand resources to encourage investment
ISO-NE PUBLIC
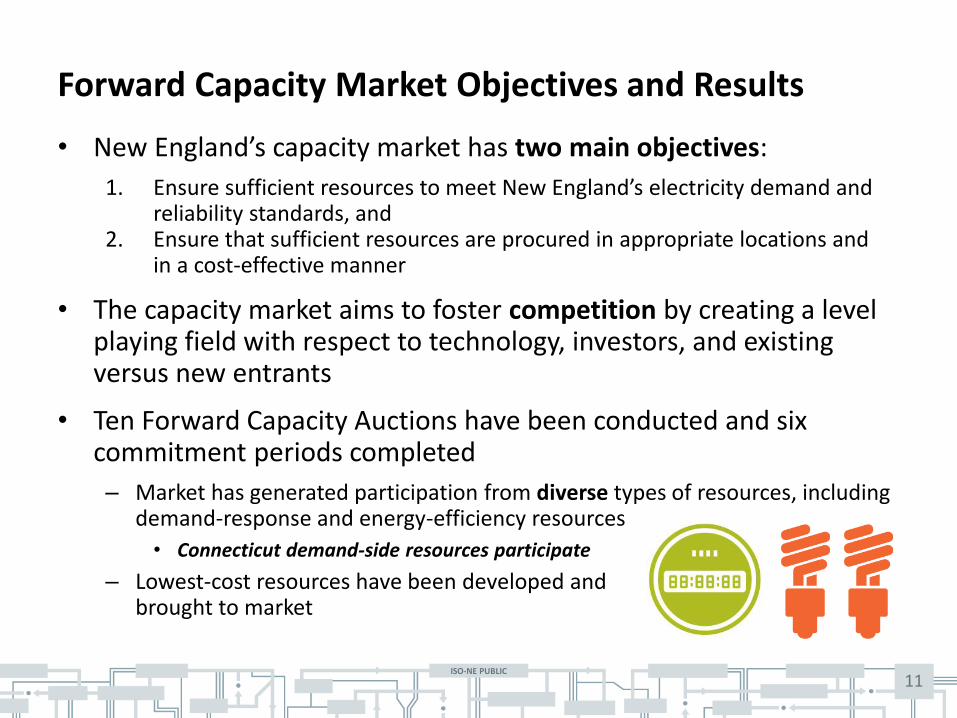
Forward Capacity Market Objectives and Results
• New England’s capacity market has two main objectives:
1. Ensure sufficient resources to meet New England’s electricity demand and reliability standards, and
2. Ensure that sufficient resources are procured in appropriate locations and in a cost-effective manner
• The capacity market aims to foster competition by creating a level playing field with respect to technology, investors, and existing versus new entrants
• Ten Forward Capacity Auctions have been conducted and six commitment periods completed
– Market has generated participation from diverse types of resources, including demand-response and energy-efficiency resources
• Connecticut demand-side resources participate
– Lowest-cost resources have been developed and brought to market
11

ISO-NE PUBLIC
12
• ICR is the amount of installed capacity that New England needs to meet the ISO New England resource planning reliability criterion
• The reliability criterion requires that the interruption of firm customer load, due to insufficient resources, be expected no more than one day in ten years
– This is the Loss-of-Load Expectation (LOLE) criterion of 0.1 interruption per year or one interruption in 10 years (1-in-10 LOLE)
• The NET ICR is the amount of capacity ISO procures in the FCA to meet the reliability criterion after accounting for the capability contribution of the Hydro Québec Interconnection Capability Credits toward meeting ICR
Installed Capacity Requirement
ISO-NE PUBLIC
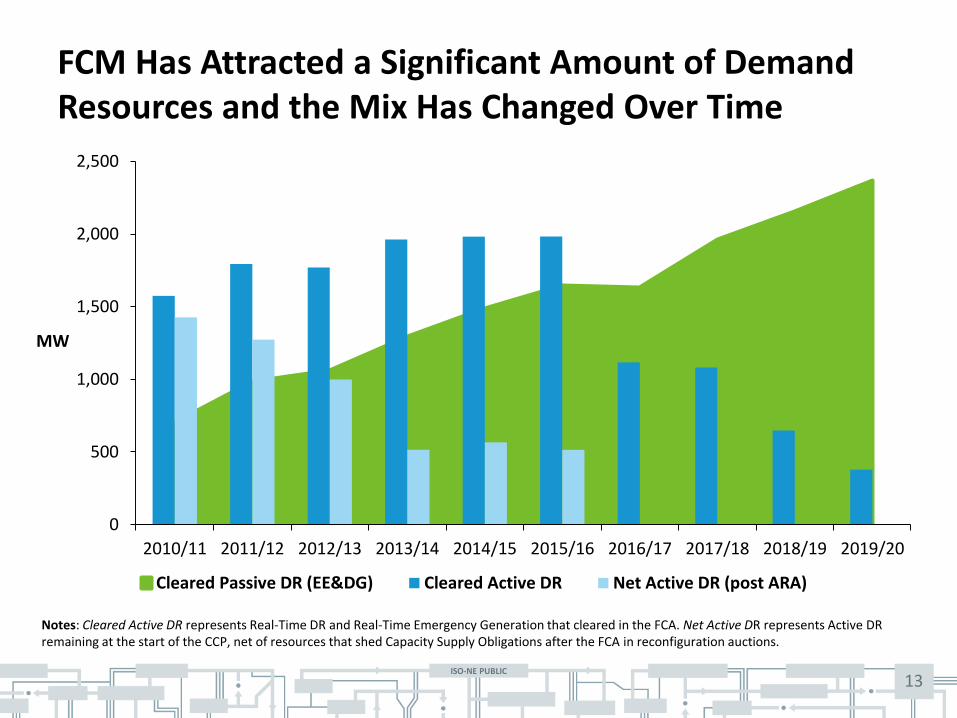
0
500
1,000
1,500
2,000
2,500
2010/11 2011/12 2012/13 2013/14 2014/15 2015/16 2016/17 2017/18 2018/19 2019/20
MW
Cleared Passive DR (EE&DG) Cleared Active DR Net Active DR (post ARA)
13
FCM Has Attracted a Significant Amount of Demand Resources and the Mix Has Changed Over Time
Notes: Cleared Active DR represents Real-Time DR and Real-Time Emergency Generation that cleared in the FCA. Net Active DR represents Active DR remaining at the start of the CCP, net of resources that shed Capacity Supply Obligations after the FCA in reconfiguration auctions.
ISO-NE PUBLIC
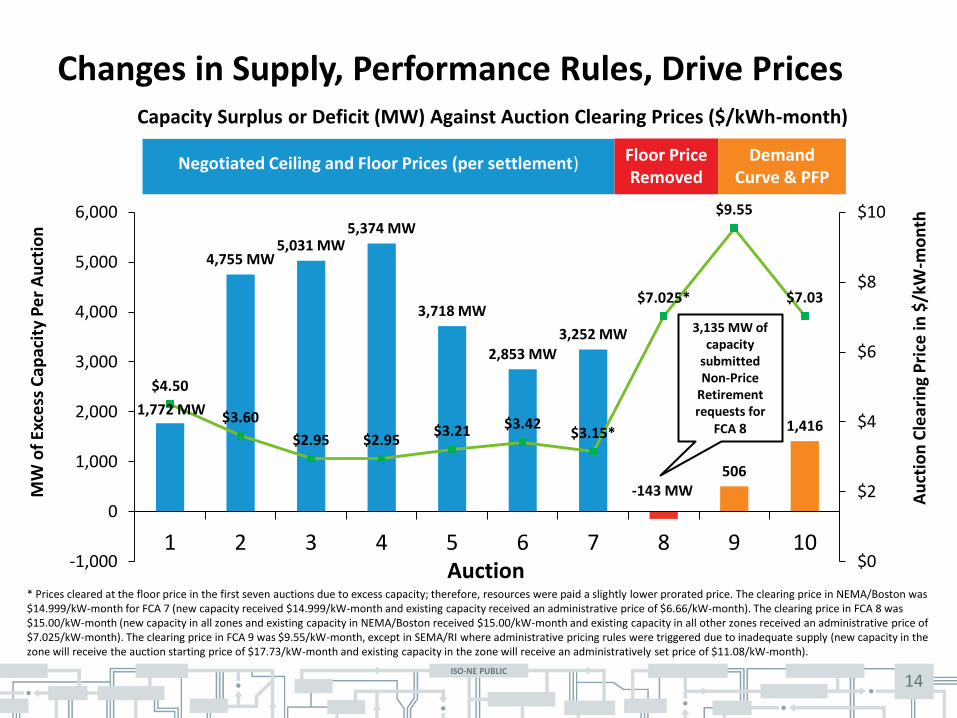
Changes in Supply, Performance Rules, Drive Prices
1,772 MW
4,755 MW 5,031 MW
5,374 MW
3,718 MW
2,853 MW 3,252 MW
-143 MW 506
1,416
$4.50
$3.60
$2.95 $2.95 $3.21 $3.42
$3.15*
$7.025*
$9.55
$7.03
$0
$2
$4
$6
$8
$10
-1,000
0
1,000
2,000
3,000
4,000
5,000
6,000
1 2 3 4 5 6 7 8 9 10
Capacity Surplus or Deficit (MW) Against Auction Clearing Prices ($/kWh-month)
Negotiated Ceiling and Floor Prices (per settlement)
* Prices cleared at the floor price in the first seven auctions due to excess capacity; therefore, resources were paid a slightly lower prorated price. The clearing price in NEMA/Boston was $14.999/kW-month for FCA 7 (new capacity received $14.999/kW-month and existing capacity received an administrative price of $6.66/kW-month). The clearing price in FCA 8 was $15.00/kW-month (new capacity in all zones and existing capacity in NEMA/Boston received $15.00/kW-month and existing capacity in all other zones received an administrative price of $7.025/kW-month). The clearing price in FCA 9 was $9.55/kW-month, except in SEMA/RI where administrative pricing rules were triggered due to inadequate supply (new capacity in the zone will receive the auction starting price of $17.73/kW-month and existing capacity in the zone will receive an administratively set price of $11.08/kW-month).
MW
of
Exce
ss C
apac
ity
Pe
r A
uct
ion
Au
ctio
n C
lear
ing
Pri
ce in
$/k
W-m
on
th
14
Floor Price Removed
Demand Curve & PFP
3,135 MW of capacity
submitted Non-Price
Retirement requests for
FCA 8
Auction
ISO-NE PUBLIC
ISO-NE INTERNAL USE
ISO-NE PUBLIC
ISO-NE INTERNAL USE
ISO-NE PUBLIC
LONG-RANGE PLANNING AND ECONOMIC STUDIES
15
ISO-NE PUBLIC
16
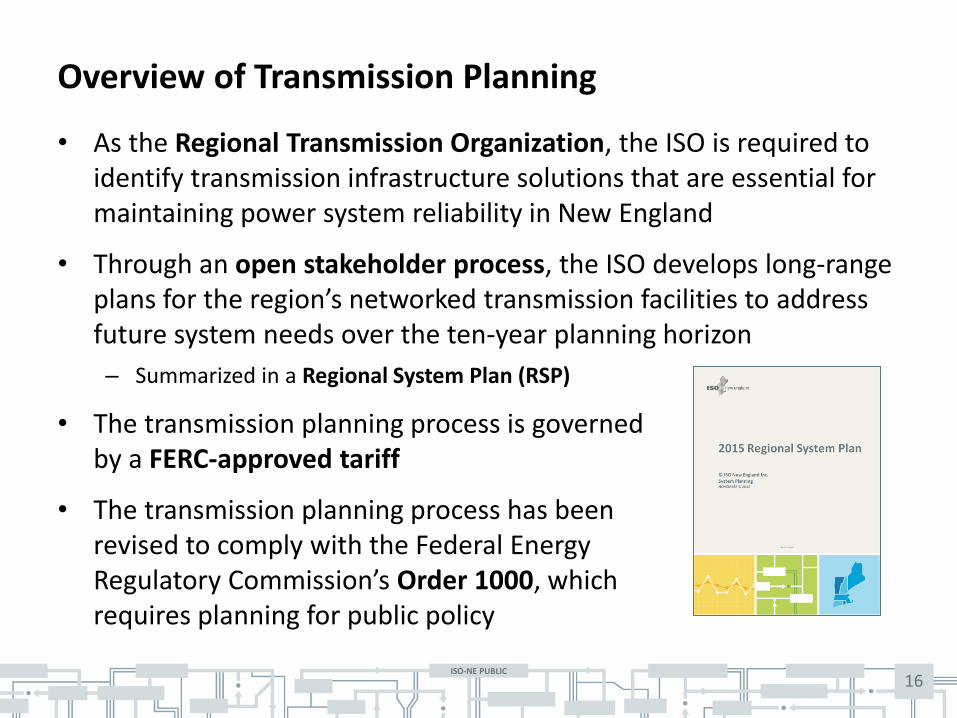
Overview of Transmission Planning
• As the Regional Transmission Organization, the ISO is required to identify transmission infrastructure solutions that are essential for maintaining power system reliability in New England
• Through an open stakeholder process, the ISO develops long-range plans for the region’s networked transmission facilities to address future system needs over the ten-year planning horizon
– Summarized in a Regional System Plan (RSP)
• The transmission planning process is governed by a FERC-approved tariff
• The transmission planning process has been revised to comply with the Federal Energy Regulatory Commission’s Order 1000, which requires planning for public policy
ISO-NE PUBLIC
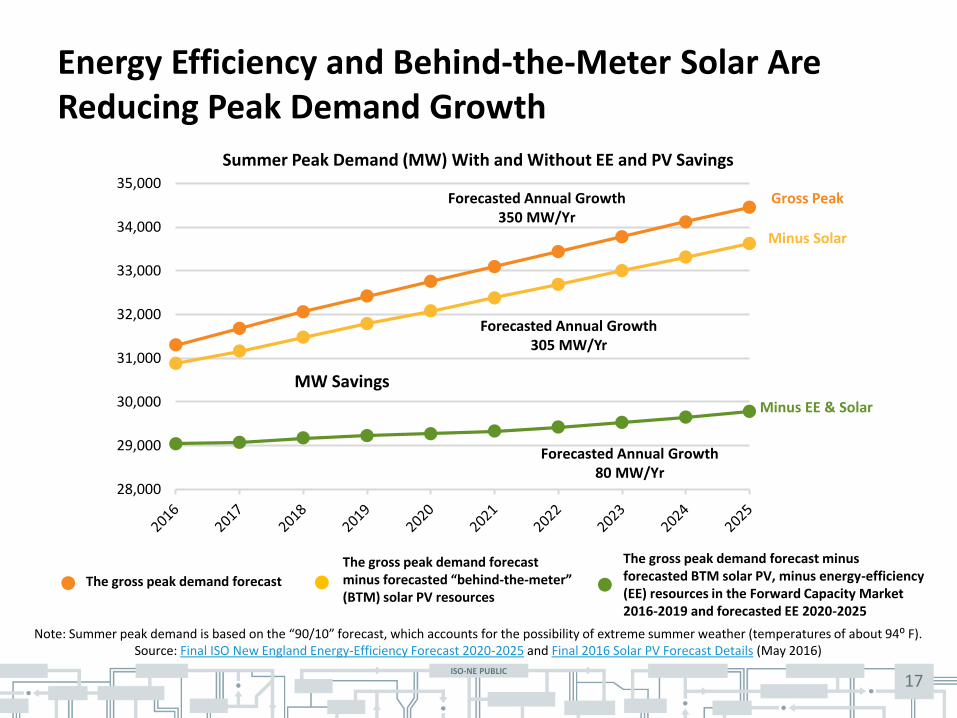
Energy Efficiency and Behind-the-Meter Solar Are Reducing Peak Demand Growth
17
Note: Summer peak demand is based on the “90/10” forecast, which accounts for the possibility of extreme summer weather (temperatures of about 94⁰ F). Source: Final ISO New England Energy-Efficiency Forecast 2020-2025 and Final 2016 Solar PV Forecast Details (May 2016)
28,000
29,000
30,000
31,000
32,000
33,000
34,000
35,000Forecasted Annual Growth
350 MW/Yr
Gross Peak
Minus EE & Solar
Minus Solar
Forecasted Annual Growth 80 MW/Yr
MW Savings
The gross peak demand forecast
The gross peak demand forecast minus forecasted “behind-the-meter” (BTM) solar PV resources
The gross peak demand forecast minus forecasted BTM solar PV, minus energy-efficiency (EE) resources in the Forward Capacity Market 2016-2019 and forecasted EE 2020-2025
Forecasted Annual Growth 305 MW/Yr
Summer Peak Demand (MW) With and Without EE and PV Savings
ISO-NE PUBLIC
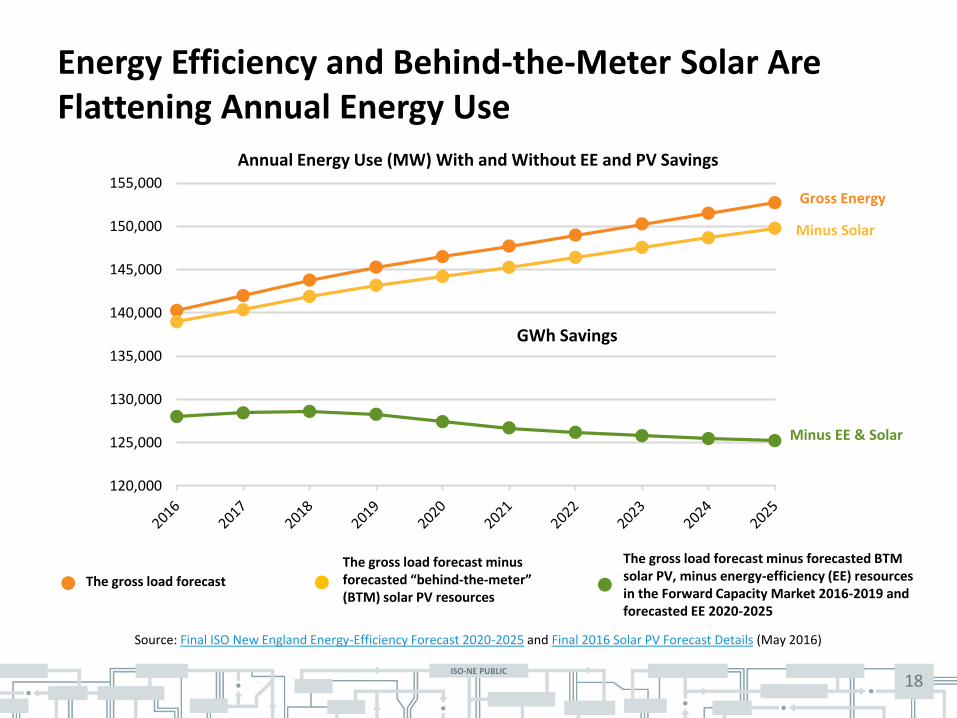
Energy Efficiency and Behind-the-Meter Solar Are Flattening Annual Energy Use
18
Source: Final ISO New England Energy-Efficiency Forecast 2020-2025 and Final 2016 Solar PV Forecast Details (May 2016)
120,000
125,000
130,000
135,000
140,000
145,000
150,000
155,000
Gross Energy
Minus EE & Solar
Minus Solar
GWh Savings
Annual Energy Use (MW) With and Without EE and PV Savings
The gross load forecast
The gross load forecast minus forecasted “behind-the-meter” (BTM) solar PV resources
The gross load forecast minus forecasted BTM solar PV, minus energy-efficiency (EE) resources in the Forward Capacity Market 2016-2019 and forecasted EE 2020-2025
ISO-NE PUBLIC
ISO-NE INTERNAL USE
ISO-NE PUBLIC
ISO-NE INTERNAL USE
ISO-NE PUBLIC
OPPORTUNITIES AND CHALLENGES FOR DEMAND RESOURCES IN MARKETS AND PLANNING
19
ISO-NE PUBLIC
20
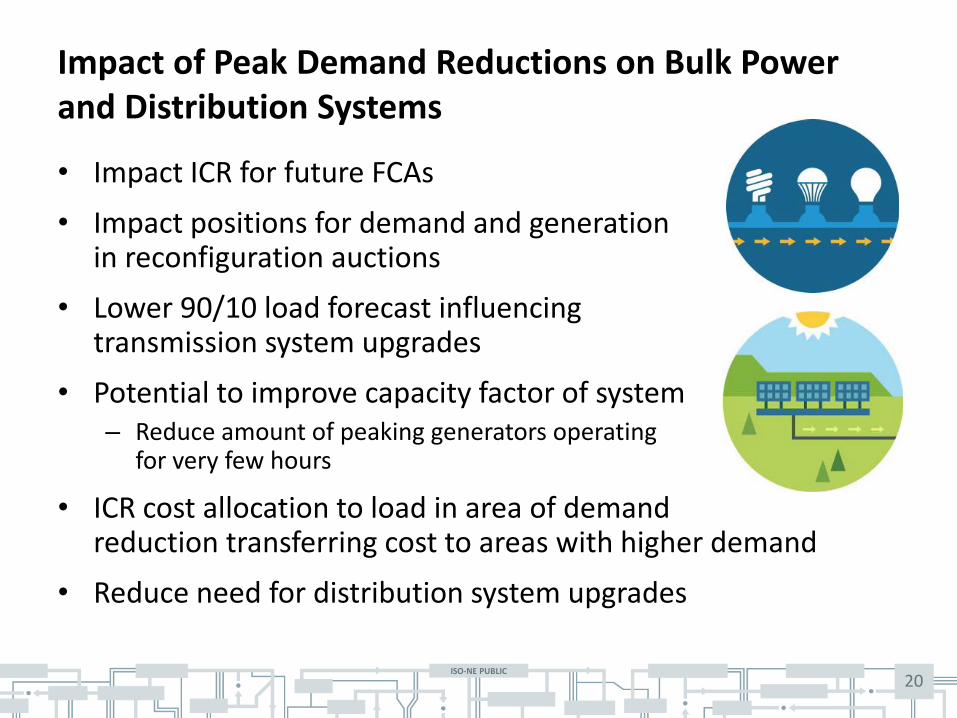
Impact of Peak Demand Reductions on Bulk Power and Distribution Systems
• Impact ICR for future FCAs
• Impact positions for demand and generation in reconfiguration auctions
• Lower 90/10 load forecast influencing transmission system upgrades
• Potential to improve capacity factor of system
– Reduce amount of peaking generators operating for very few hours
• ICR cost allocation to load in area of demand reduction transferring cost to areas with higher demand
• Reduce need for distribution system upgrades
ISO-NE PUBLIC
21
Potential Technical and Financial Challenges from Peak Load Reduction
Bulk Power System
• Increase transmission import/export constraints creating zones of separation and changes to transfer limits
• Capacity factor changes with corresponding large energy reductions from energy efficiency
• Shift in system peak due to variable generating resources
• Impacts to existing supply and new market entrants
Distribution System
• Increased fixed costs due to lower volumetric sales and stranded infrastructure
• Increased costs at distribution level due to more variable load and distributed generation
– Spur the need for more sophisticated monitoring and controls – Investment in technology to handle two-way flow of energy with increased penetration
of distributed generation

ISO-NE PUBLIC
22
On-Going Efforts at ISO New England to Manage Future System Changes
• Real-time forecasting of variable generating resources (wind and solar)
• Long-range EE and solar forecasting
• Integration of demand response into energy and reserve markets (FERC Order No. 745)
• Improvements to FCM – Zonal Demand Curves, Retirement Reforms,
FCM Performance Incentives
• Transmission planning for public policy (FERC Order No. 1000)
• Integration of storage and other electrification initiatives
ISO-NE PUBLIC
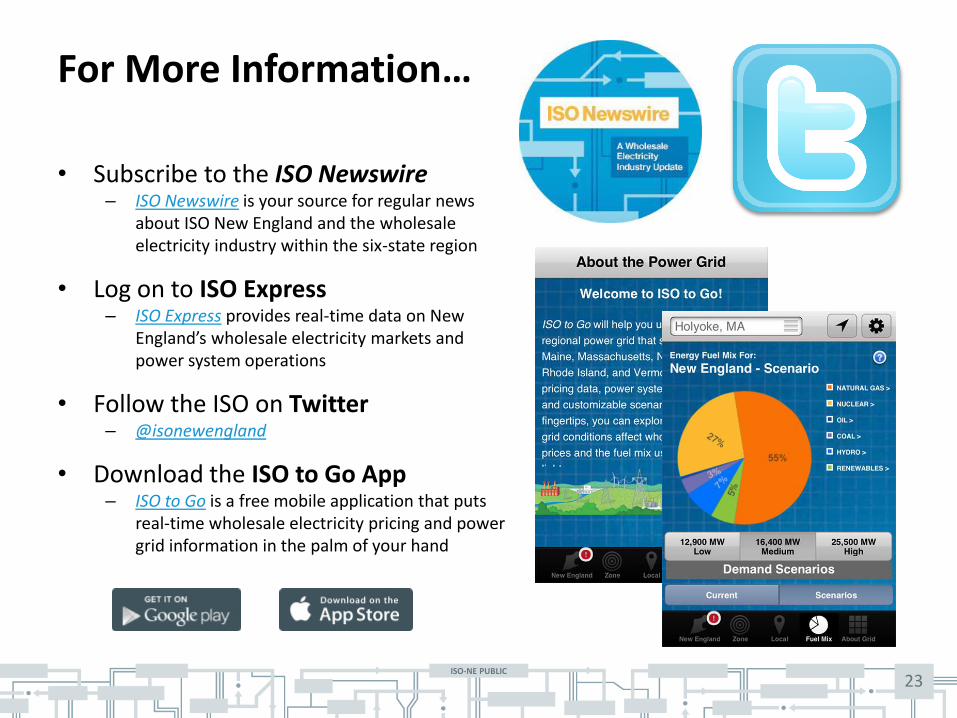
• Subscribe to the ISO Newswire – ISO Newswire is your source for regular news
about ISO New England and the wholesale electricity industry within the six-state region
• Log on to ISO Express – ISO Express provides real-time data on New
England’s wholesale electricity markets and power system operations
• Follow the ISO on Twitter – @isonewengland
• Download the ISO to Go App – ISO to Go is a free mobile application that puts
real-time wholesale electricity pricing and power grid information in the palm of your hand
For More Information…
23