2018 Director Compensation Report - FW Cook...FW Cook’s 2018 Director Compensation Report studies...
28
November 2018 2018 Director Compensation Report
Transcript of 2018 Director Compensation Report - FW Cook...FW Cook’s 2018 Director Compensation Report studies...

November 2018
2018 Director Compensation Report

i© 2018 FW Cook
2018 Director compensation report
Table of ContentsExecutive Summary 1
Overview and Methodology 3
Total Board Compensation 5
Board Cash Compensation 7
Equity Award Types 10
Equity Award Denomination 11
Equity Compensation Values 12
Equity Vesting Practices 13
Committee Member Compensation 14
Committee Chair Compensation 15
Non- Executive Board Chair and Lead Director Compensation 16
Stock Ownership Guidelines and Retention Requirements 18
Compensation Deferrals 20
Shareholder- Approved Limits on Annual Director Compensation 21
List of Companies Surveyed 23
Company Profile 26

1© 2018 FW Cook
eXecUtiVe sUmmarYFW Cook’s 2018 Director Compensation Report studies non-employee director compensation at 300 companies of various sizes and industries to analyze market practices in pay levels and program structure.
Total compensation amounts increased by 0.5% at the median of the total sample versus last year’s study, reflecting generally stable compensation levels across size sectors. Large-cap companies in our study pay directors $275,000 at the median, and experienced the smallest increase in median total pay this year of 0.2%, following a 5.4% increase the previous year. This year, among mid-cap companies, median total pay of $205,000 increased by 1.9%, which increased from last year’s growth of 0.8%. Median total pay at small-cap companies grew 1.2% to $152,000, following a 3.7% increase the prior year. Technology continues to be the highest-paying sector in our study, while Financial Services continues to be the lowest-paying sector.
There is minimal change to director compensation program structure. We observe an increase in equity compensation as a percentage of total pay, representing approximately 62% across the sample (up from 58% in the prior two years). In line with the trend toward simplification, meeting fees continue to be eliminated in favor of retainer-only director pay programs. The vast majority of companies continue to use fixed-value equity award guidelines. Full-value stock awards are the dominant form of equity compensation and provide the most consistent means to align director pay with shareholder interests. Equity grants most commonly either vest immediately or cliff-vest after one year.
Director stock ownership guidelines continue to be majority practice and have increased in prevalence this year among large-cap and small-cap companies. Mandatory stock deferrals are overall still a minority practice, utilized by 13% of companies granting equity. Large-cap companies continue to have the highest prevalence of mandatory stock deferrals, present at 26% of large-cap companies.
We continue to observe companies adding annual limits on director compensation to shareholder-approved equity plans to help reduce the risk of litigation. Over half of the companies in this study now have such limits. To enhance protection, these limits are increasingly covering total pay rather than just equity: 34% of limits cover total pay this year, versus 26% in the prior study. Among the companies in this study, limits on total pay typically reflect a multiple of two-to-three times annual total pay.
The following chart summarizes total non-employee director pay levels and market capitalizations of the 300 companies in our study (100 companies in each size grouping):
small-cap mid-cap Large-cap
median Values (Less than $1B) ($1B - $5B) (Greater than $5B)
total compensation - 2018 study $151,750 $205,417 $274,583
total compensation - 2017 study $150,000 $201,667 $274,000
Year-over-Year compensation change 1.2% 1.9% 0.2%
market capitalization ($m) - 2018 study $548 $2,178 $20,525
market capitalization ($m) - 2017 study $544 $2,506 $18,217
Year-over-Year market cap. change 0.8% -13.1% 12.7%

2© 2018 FW Cook
eXecUtiVe sUmmarY
cash vs. equity
Additional key findings are summarized below:
cash compensation for Board service
equity compensation for Board service
committee compensation
non-executive Board chairs and Lead Directors
stock ownership Guidelines and retention requirements
compensation Deferrals
annual Limits on Director compensation
• Companiesinallsizesegmentscontinuetoprovidemorethanhalfoftotalpayinequity,onaverage, with equity weighting generally increasing with company size
• Theaveragemixacrosstheentiresampleis38%cashand62%equity• Higher-payingsectorstendtoplaceagreaterweightingonequity;Technologycompanies
continue to have the most equity-heavy mix while Financial Services have the least
• Justoverthree-quartersofthesampleuseretainersonly(noboardmeetingfees)• Themedianboardretainerforsmall-capandmid-capcompaniesremainedflatat$50,000
and $70,000, respectively, while large-cap companies saw a $5,000 increase in the median board retainer to $90,000
• TheIndustrialssectorprovidesthehighestmediancashretainerfeeforboardservice($77,500) and Technology the lowest ($60,000)
• Atleast82%ofcompaniesineachsizegroupgrantfull-valuestockawardsexclusively(i.e.,nostock options)
• Thevastmajorityofequityawardscontinuetobedenominatedasadollarvalueratherthananumber of shares
• TheTechnologysectorhasthehighestprevalenceofstockoptions(15%),followedbyIndustrials (12%)
• Consistentwithlastyear,63%ofcompaniesprovideadditionalcompensationtocommitteemembers, with committee member retainers remaining the more prevalent means of accomplishing this, as opposed to committee meeting fees
• Theprevalenceofcommitteememberretainershasbeenstableyear-over-year,whiletheuseof committee meeting fees continues to decrease, especially at large-cap companies
• Nearlyallcompaniesprovideadditionalcompensationtocommitteechairs.Acrossthesample, median retainers are $20,000 for audit chair and $15,000 for both compensation and nominating/governance chairs
• Non-executiveboardchairsaretypicallyprovidedadditionalcompensationfortherole,with the median ranging from $50,000 at small-cap companies to $150,000 at large-cap companies
• Almost90%ofleaddirectorsreceiveadditionalcompensation,rangingfrom$15,000to$30,000 at the median across all size and sector groups
• Approximately80%ofcompanieshaveownershipguidelines,whilestockretentionrequirements remain a minority practice, prevalent at approximately 35% of companies
• Amongcompanieswithownershipguidelines,approximately80%definetheguidelineasamultiple of cash retainer, most commonly 5x for large-cap and mid-cap companies and 3x for small-cap companies
• Prevalenceofcashdeferralprogramsremainedsteadyyear-over-yearwithroughly65%,40%,and 20% of large-, mid-, and small-cap companies, respectively, offering such programs
• Stockdeferralprograms(includingvoluntaryandmandatoryprograms)declinedsomewhatthis year due to the change in sample set. Large-cap companies continue to have significantly more mandatory stock deferral requirements and thus higher prevalence overall of stock deferral programs
• Thisyear,theprevalenceofannuallimitsondirectorcompensationincreasedslightlyto55%of companies. Approximately 70%, 60%, and 30% of large-, mid-, and small-cap companies, respectively, have shareholder-approved limits on annual director compensation in the applicable equity plan
• Aboutone-thirdofcompanieswithlimitsapplythemtototaldirectorcompensationandnot just equity, which is a significant increase from 15% two years ago. More than half of companies adding limits for the first time apply them to total director compensation

3© 2018 FW Cook
oVerView anD methoDoLoGY
Research SampleThis study is based on a sample of 300 U.S. public companies equally divided among small-, mid-, and large-cap size segments (100 companies per segment) and further classified into five sectors: Energy, Financial Services, Industrials, Retail, and Technology (60 companies per sector) based on Standard & Poor’s Global Industry Classification Standard (“GICS”) codes. Approximately 88% of this year’s sample companies were constituents of last year’s sample, allowing for meaningful year-over-year comparisons. For a complete list of the companies included in this study, refer to the List of Companies Surveyed at the end of the report.
Market capitalization and trailing 12-month revenue as of April 30, 2018 are summarized below:
Director compensation program details were sourced from companies’ proxy statements and/or annual reports, generally filed with the Securities and Exchange Commission (“SEC”) in the one-year period ending May 31, 2018.
Market Capitalization ($M) Trailing 12-Month Revenue ($M)
size 25th percentile median 75th percentile 25th percentile median 75th percentile
small-cap $325 $548 $740 $169 $410 $893
mid-cap $1,467 $2,178 $3,467 $852 $1,665 $3,393
Large-cap $11,266 $20,525 $47,446 $4,688 $10,259 $25,092
sector 25th percentile median 75th percentile 25th percentile median 75th percentile
energy $744 $2,278 $14,973 $682 $1,350 $7,290
Financial services $848 $3,201 $11,634 $250 $753 $3,961
industrials $728 $2,571 $12,682 $873 $2,794 $7,744
retail $686 $2,091 $8,474 $1,797 $4,074 $11,392
technology $671 $2,333 $11,320 $349 $1,460 $3,167

4© 2018 FW Cook
oVerView anD methoDoLoGY
MethodologyThe study analyzes compensation for board and committee service (with the latter focused on the three most common standing committees of the board: audit, compensation, and nominating/governance). The specific pay components presented in this study include:
• Annual cash retainers and meeting fees for board service
• Equity compensation, in the form of stock options or full-value stock awards (i.e., restricted shares/units, deferred
stock units, and fully vested stock)
• Annual cash retainers and meeting fees for committee member and chair service
• Additional compensation for serving as a non-executive chair or lead director
The report also presents our findings on equity vesting practices, the prevalence of stock ownership guidelines and compensation deferral provisions, as well as the prevalence, design, and magnitude of shareholder-approved limits on annual compensation per director.
The following assumptions were used to facilitate competitive comparisons:
• Each director attends nine board meetings annually (consistent with last year’s study)
• Each director is a member of one committee and attends six committee meetings per year (consistent with last year’s
study)
• If denominated as a number of shares (rather than as a fixed-dollar value), then equity compensation is valued using
closing stock prices as of April 30, 2018
• All equity compensation is annualized over a five-year period (e.g., if a company makes a “larger than normal” equity
grant upon initial election to the board followed by smaller annual grants, then our analysis includes the five-year
average value of the initial grant and the four subsequent annual grants)
• Stock options are valued using each individual company’s publicly disclosed Accounting Standards Codification
(“ASC”) Topic 718 assumptions to align option values used in this study with their accounting costs, assuming an
April 30, 2018 grant date

5© 2018 FW Cook
2017 2018 2017 2018 2017 2018 Small-Cap Mid-Cap Large-Cap
Total Compensation By Size($000)
Total Compensation By Sector($000)
Energy Financial Industrials Retail Technology Services
$0$50
$100$150
$200$250$300$350
$0$50
$100$150
$200$250$300$350
$213$175
$200 $204$251
+4%from prior
year
+4%from prior
year
+2%from prior
year
+2%from prior
year
-3%from prior
year
$150 $152$202 $205
$274 $275
totaL BoarD compensation
Total Compensation – Pay LevelsTotal director compensation levels continue to be influenced by company size. At the median, large-cap companies provide total pay of $275,000 per director versus $205,000 at mid-cap companies and $152,000 at small-cap companies. Year-over-year, total compensation levels were generally stable. Large-cap companies increased just 0.2%, following a 5.4% increase the prior year. Among mid-cap companies, median total values increased by 1.9%, which increased from last year’s increase of 0.8%. Small-cap companies increased by 1.2%, following a 3.7% increase the prior year. Over the past five years, the annualized increase in director compensation has been approximately 3% at large-cap and mid-cap companies and 2% for small-cap companies.
Technology companies continue to provide the highest median total pay compared to other sectors ($251,000) and Financial Services companies continue to provide the lowest median total pay ($175,000). The highest growth in median pay occurred in the Financial Services and Industrials sectors (+4% for both).
75th percentile $289 $226 $264 $245 $317
median $213 $175 $200 $204 $251
25th percentile $180 $86 $154 $173 $187
2017 2018 2017 2018 2017 2018 Small-Cap Mid-Cap Large-Cap
Total Compensation By Size($000)
Total Compensation By Sector($000)
Energy Financial Industrials Retail Technology Services
$0$50
$100$150
$200$250$300$350
$0$50
$100$150
$200$250$300$350
$213$175
$200 $204$251
+4%from prior
year
+4%from prior
year
+2%from prior
year
+2%from prior
year
-3%from prior
year
$150 $152$202 $205
$274 $275
2018:
75th percentile $188 $250 $311
median $152 $205 $275
25th percentile $91 $172 $242

6© 2018 FW Cook
totaL BoarD compensation
Total Compensation – Cash vs. EquityCompensation for board service typically consists of both cash and equity. The charts below illustrate average pay mix by company size and sector, with the emphasis on equity generally increasing since last year. Across all size and sector categories, companies continue to favor delivering equity compensation in the form of full-value awards over stock options.
Across size segments, companies provide more than half of compensation in equity, with equity weighting increasing with company size and total pay. Among all three size sectors, we observe a trend of increasing the weighting of equity as a percentage of total compensation, which on average represents 62% of total pay across all companies in the sample this year.
The higher-paying sectors tend to place a greater weighting on equity, with Technology companies providing approximately 71% of total compensation in the form of equity. Financial Services companies place the lowest emphasis on equity (just over half of total compensation, on average).
Percentage Equity 2016 2017 2018
53% 54% 57%
58% 58% 61%
62% 62% 65%Large-Cap
Mid-Cap
Small-Cap
Technology
Retail
Industrials
Financial Services
Energy
Cash vs. Equity By Size
Cash vs. Equity By Sector
Average Cash/Equity Composition Cash Full-Value Stock Awards Stock Options
Average Cash/Equity Composition Cash Full-Value Stock Awards Stock Options
39% 60% 1%
47% 52% 1%
43% 52% 5%
37% 58% 5%
29% 61% 10%
43% 52% 5%
39% 55% 6%
35% 62% 3%Large-Cap
Mid-Cap
Small-Cap
Technology
Retail
Industrials
Financial Services
Energy
Cash vs. Equity By Size
Cash vs. Equity By Sector
Average Cash/Equity Composition Cash Full-Value Stock Awards Stock Options
Average Cash/Equity Composition Cash Full-Value Stock Awards Stock Options
39% 60% 1%
47% 52% 1%
43% 52% 5%
37% 58% 5%
29% 61% 10%
43% 52% 5%
39% 55% 6%
35% 62% 3%

7© 2018 FW Cook
Large-Cap
Mid-Cap
Small-Cap
Technology
Retail
Industrials
Financial Services
Energy
Board Cash Structure By Size
Board Cash Structure By Sector
Retainers Only Meeting Fees Only
Retainers & Meeting Fees No Cash (Equity Only)
Retainers Only Meeting Fees Only
Retainers & Meeting Fees No Cash (Equity Only)
72% 28%
65% 32%3%
85% 15%
87% 10% 3%
85% 15%
72% 2% 26%
79% 21%
85% 13% 2%
BoarD cash compensation
Cash Compensation Pay StructureCash compensation for board service is typically provided through an annual board retainer, board meeting fees, or a combination of both. Across size and industry segments, retainer-only programs continue to be the most prevalent. There is a continued trend of companies simplifying their programs by eliminating board meeting fees, with the number of companies in the sample providing retainer-only programs increasing from 74% in 2016 to 79% this year. Some companies continue to provide compensation for years with abnormally high activity by instituting pre-set thresholds that require a specific number of meetings to occur before per-meeting fees are paid.
Retainer-only programs are the majority practice regardless of industry sector.
Percentage of Companies With Retainers Only
2016 2017 2018
68% 70% 72%
73% 77% 79%
81% 81% 85%

8© 2018 FW Cook
BoarD cash compensation
Board Cash RetainersBoard retainers have remained relatively stable year-over-year. For small-cap and mid-cap companies, the median board retainer remained flat at $50,000 and $70,000, respectively, while large-cap companies saw a 6% increase in the median board retainer to $90,000.
Median board retainers remained flat for the Energy and Technology sectors for the second year in a row, while the Retail sector experienced a 7% increase, the Industrials sector a 19% increase, and the Financial Services sector a 2% decrease. The significant increase in Industrials follows a 4% decrease the previous year and is influenced by the change in sample composition.
2018:
75th percentile $65,000 $80,000 $110,000
median $50,000 $70,000 $90,000
25th percentile $36,000 $58,750 $65,000
75th percentile $90,000 $87,625 $100,000 $85,000 $71,250
median $75,000 $65,625 $77,500 $72,500 $60,000
25th percentile $60,000 $43,750 $50,000 $50,000 $45,000
2017 2018 2017 2018 2017 2018 Small-Cap Mid-Cap Large-Cap
Board Cash Retainers By Size
Board Cash Retainers By Sector
Energy Financial Industrials Retail Technology Services
$0
$20,000
$40,000
$60,000
$80,000
$100,000
$0
$20,000
$40,000
$60,000
$80,000
$100,000
$50,000 $50,000
$70,000 $70,000
$85,000 $90,000
$75,000$65,625
$77,500$72,500
$60,000
Flatfrom prior
year
-2%from prior
year
+19%from prior
year
+7%from prior
year
Flatfrom prior
year

9© 2018 FW Cook
BoarD cash compensation
Board Meeting FeesThe prevalence of board meeting fees has remained stable at small-cap and mid-cap companies but has declined at large-cap companies compared to last year. Of the total sample, 21% use board meeting fees versus 22% in 2017 and 24% in 2016.
Meeting fee prevalence continues to be influenced by size, with small-cap companies having the largest prevalence and large-cap companies having the smallest. The magnitude of board meeting fees also increases with company size: the median value is $1,500 at small-cap companies, $1,600 at mid-cap companies, and $2,000 at large-cap companies.
Unchanged from last year, the median board meeting fee is $1,500 in the Energy and Financial Services sectors and $2,000 in each of the other three sectors.
*Prevalencestatisticsreflectcompaniesthatpayafeestartingwiththefirstmeetinginayear;acrosstheentiresample,an additional 3% of companies (4% last year) provide a fee starting after a pre-set minimum number of meetings per year
Board Meeting Fees By Size
prevalence* 25th percentile median 75th percentile
small-cap 28% $1,000 $1,500 $2,000
mid-cap 21% $1,500 $1,600 $2,000
Large-cap 13% $1,500 $2,000 $2,750
Prior Year Meeting Fee Prevalence*
28%
20%
17%
Board Meeting Fees By Sector
prevalence* 25th percentile median 75th percentile
energy 28% $1,500 $1,500 $2,000
Financial services 35% $1,000 $1,500 $1,500
industrials 15% $1,500 $2,000 $2,500
retail 10% $2,000 $2,000 $2,500
technology 15% $2,000 $2,000 $2,875
Prior Year Meeting Fee Prevalence*
32%
33%
17%
15%
12%

10© 2018 FW Cook
eqUitY awarD tYpesFull-value stock awards (i.e., restricted stock/units, deferred stock units, or fully vested stock) remain the most prevalent equity grant type in director compensation programs across all company sizes and sectors. Option-only programs remain a minority practice following a decline across the sample over the last several years. This year, we observe a slight decrease in small-cap companies providing equity compensation in only full-value awards, but this is driven by a change in the sample set rather than a trend in small-cap companies moving to delivering equity compensation in stock options.
When segmented by industry, full-value awards remain the majority practice. Technology sector companies have the highest prevalence of options in their equity programs (15%), followed by companies in the Industrial sector (12%).
Prior Year Full- Value Only Use
85%
84%
91%Large-Cap
Mid-Cap
Small-Cap
Technology
Retail
Industrials
Financial Services
Energy
Equity Award Types By Size
Equity Award Types By Sector
Full-Value Stock Only Options Only
Full-Value & Options No Equity
Full-Value Stock Only Options Only
Full-Value & Options No Equity
90% 5% 5%
87% 2% 3% 8%
83% 2% 10% 5%
92% 3% 5%
83% 7% 8% 2%
82% 4% 7% 7%
85% 2% 9% 4%
94% 3%2% 1%Large-Cap
Mid-Cap
Small-Cap
Technology
Retail
Industrials
Financial Services
Energy
Equity Award Types By Size
Equity Award Types By Sector
Full-Value Stock Only Options Only
Full-Value & Options No Equity
Full-Value Stock Only Options Only
Full-Value & Options No Equity
90% 5% 5%
87% 2% 3% 8%
83% 2% 10% 5%
92% 3% 5%
83% 7% 8% 2%
82% 4% 7% 7%
85% 2% 9% 4%
94% 3%2% 1%

11© 2018 FW Cook
eqUitY awarD DenominationCompanies continue to define annual equity awards primarily as a fixed-dollar value rather than as a fixed number of shares across all company sizes and sectors. Dollar-denominated awards provide the same proxy-disclosed grant value on an annual basis despite stock price movement. This year, we observe that approximately 90% of small-cap and mid-capcompaniesuseafixed-dollarapproachforfullvalueawards;thispercentageincreasesto97%forlarge-capcompanies.
The share-denominated approach is used more commonly for stock options than for full-value stock awards, although it is still a minority practice for stock options overall. Share-denomination of stock options has declined significantly across most size and sector groups, although it remains a majority practice among mid-cap companies and Technology companies.
*Some companies grant both full-value stock awards and options, so percentages add to greater than 100%
Equity Award Denomination By Sector: Percentage of Companies
Full-Value stock (Used by 93% of Companies)* options (Used by 9% of Companies)*
Dollar Value number of shares Dollar Value number of shares
energy 96% 4% 67% 33%
Financial services 91% 9% 67% 33%
industrials 93% 7% 71% 29%
retail 90% 10% 100% 0%
technology 91% 9% 22% 78%
Equity Award Denomination By Size: Percentage of Companies
Full-Value stock (Used by 93% of Companies)* options (Used by 9% of Companies)*
Dollar Value number of shares Dollar Value number of shares
small-cap 92% 8% 64% 36%
mid-cap 87% 13% 45% 55%
Large-cap 97% 3% 80% 20%

12© 2018 FW Cook
eqUitY compensation VaLUesYear-over-year, median annual equity compensation values increased by 8% for small-cap companies and 3% for large-cap companies, while median equity compensation for mid-cap companies remained flat at $125,000.
Equity compensation continues to be highest among Technology companies and lowest among Financial Services companies. We observe the largest increase in median equity value in the Retail sector, which is up 8% year-over-year. Median equity value increased by 4% in the Energy, Financial Services, and Industrials sectors and by 1% for the Technology sector.
2018:
75th percentile $120,000 $160,000 $224,461
median $93,750 $125,000 $165,000
25th percentile $52,500 $99,994 $140,000
75th percentile $190,000 $140,000 $150,000 $150,000 $225,000
median $145,000 $93,750 $125,000 $125,000 $171,138
25th percentile $100,000 $42,500 $90,000 $100,000 $122,500
+6% from prior year
+4% from prior year
+19% from prior year
+5% from prior year
+6% from prior year
2017 2018 2017 2018 2017 2018 Small-Cap Mid-Cap Large-Cap
Equity Compensation Value By Size
Equity Compensation Value By Sector
Energy Financial Industrials Retail Technology Services
$0
$50,000
$100,000
$150,000
$200,000
$250,000
$0
$50,000
$100,000
$150,000
$200,000
$250,000
+4%from prior
year
+4%from prior
year+4% from prior year
+8%from prior
year
+1%from prior
year
$165,000$160,000
$125,000$125,000$93,750$86,966
$145,000
$93,750$125,000 $125,000
$171,138

13© 2018 FW Cook
eqUitY VestinG practicesAcross size and industry sectors, equity awards most commonly vest within one-year from grant. Among the sample, approximately 25% of companies have immediate vesting and approximately 60% have vesting one year after grant. The prevalence of immediate vesting increases with size, with the highest prevalence among large-cap companies (33%) and the lowest prevalence among small-cap companies (18%). Awards with longer vesting periods tend to vest in installments, rather than cliff vest.
Large-Cap
Mid-Cap
Small-Cap
Equity Compensation Vesting Periods By Size
Immediate 1 Year
2 Years ≥3 Years
18% 65% 16%
24% 61%
1%
1% 14%
33% 53% 14%
14© 2018 FW Cook
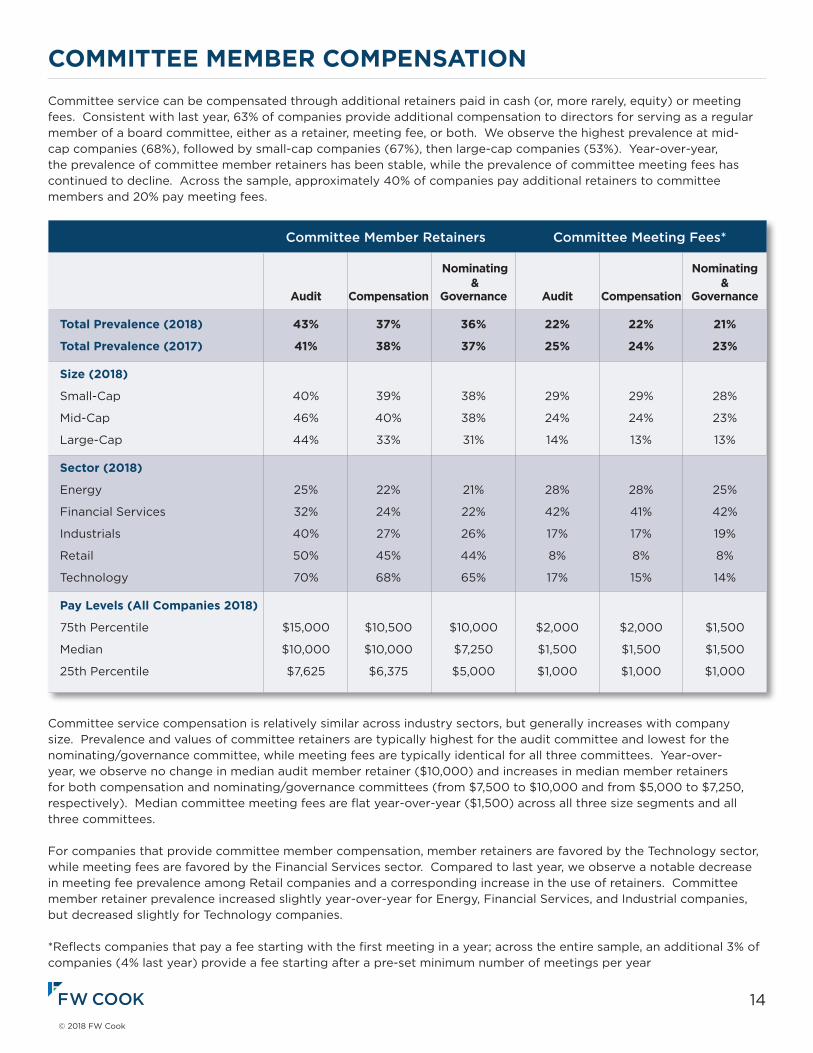
committee memBer compensationCommittee service can be compensated through additional retainers paid in cash (or, more rarely, equity) or meeting fees. Consistent with last year, 63% of companies provide additional compensation to directors for serving as a regular member of a board committee, either as a retainer, meeting fee, or both. We observe the highest prevalence at mid-cap companies (68%), followed by small-cap companies (67%), then large-cap companies (53%). Year-over-year, the prevalence of committee member retainers has been stable, while the prevalence of committee meeting fees has continued to decline. Across the sample, approximately 40% of companies pay additional retainers to committee members and 20% pay meeting fees.
Committee service compensation is relatively similar across industry sectors, but generally increases with company size. Prevalence and values of committee retainers are typically highest for the audit committee and lowest for the nominating/governance committee, while meeting fees are typically identical for all three committees. Year-over-year, we observe no change in median audit member retainer ($10,000) and increases in median member retainers for both compensation and nominating/governance committees (from $7,500 to $10,000 and from $5,000 to $7,250, respectively). Median committee meeting fees are flat year-over-year ($1,500) across all three size segments and all three committees.
For companies that provide committee member compensation, member retainers are favored by the Technology sector, while meeting fees are favored by the Financial Services sector. Compared to last year, we observe a notable decrease in meeting fee prevalence among Retail companies and a corresponding increase in the use of retainers. Committee member retainer prevalence increased slightly year-over-year for Energy, Financial Services, and Industrial companies, but decreased slightly for Technology companies.
*Reflectscompaniesthatpayafeestartingwiththefirstmeetinginayear;acrosstheentiresample,anadditional3%ofcompanies (4% last year) provide a fee starting after a pre-set minimum number of meetings per year
Committee Member Retainers Committee Meeting Fees*
nominating nominating & & audit compensation Governance audit compensation Governance
total prevalence (2018) 43% 37% 36% 22% 22% 21%
total prevalence (2017) 41% 38% 37% 25% 24% 23%
size (2018)
Small-Cap 40% 39% 38% 29% 29% 28%
Mid-Cap 46% 40% 38% 24% 24% 23%
Large-Cap 44% 33% 31% 14% 13% 13%
sector (2018)
Energy 25% 22% 21% 28% 28% 25%
Financial Services 32% 24% 22% 42% 41% 42%
Industrials 40% 27% 26% 17% 17% 19%
Retail 50% 45% 44% 8% 8% 8%
Technology 70% 68% 65% 17% 15% 14%
pay Levels (all companies 2018)
75th Percentile $15,000 $10,500 $10,000 $2,000 $2,000 $1,500
Median $10,000 $10,000 $7,250 $1,500 $1,500 $1,500
25th Percentile $7,625 $6,375 $5,000 $1,000 $1,000 $1,000

15© 2018 FW Cook
committee chair compensationConsistent with prior years, nearly all companies provide additional compensation to committee chairs to recognize the substantial time required to lead a committee. Similar to committee member retainers, committee chair retainers tend to be highest for the audit committee and lowest for the nominating/governance committee, which recognizes the different time commitment expectations between committees. Similar to last year, 26% of companies providing chair retainers to both the audit and compensation committee provide the same amount, highlighting the increased importance and complexity of the compensation committee chair role. Only 9% of companies providing chair retainers to all three committees provide the same level of retainer (rather than differentiating).
The table below shows the prevalence and magnitude of retainers paid to directors who chair the audit, compensation, and nominating/governance committees. The vast majority of companies use cash for their chair retainers, although a small minority (less than 5% of companies providing chair retainers) use equity either solely or in combination with cash.
Year-over-year, median committee chair retainers were flat for audit and compensation committees, and higher for nominating/governance (up from $11,500 to $15,000). Across industry sectors, median retainers are between $20,000 to $25,000 for audit chair, $15,000 to $20,000 for compensation chair, and $10,000 to $15,000 for nominating/governance chair. Retail and Technology companies continue to provide the highest committee chair retainers. This year, we observe an increase at the median for nominating/governance committee chairs in the Financial Services and Technology sectors.
Less than 2% of companies in the research sample provide a higher meeting fee to committee chairs than to regular committee members (in lieu of, or in addition to, incremental cash or equity retainers).
Committee Chair Retainers (Inclusive of Any Member Retainers)
audit compensation nominating & Governance
percentile 25th median 75th 25th median 75th 25th median 75th
size
Small-Cap $11,000 $18,500 $22,500 $10,000 $12,000 $15,000 $7,500 $10,000 $12,875
Mid-Cap $16,500 $20,000 $27,250 $15,000 $15,000 $21,125 $10,000 $12,000 $15,500
Large-Cap $20,000 $25,000 $35,000 $15,000 $20,000 $25,000 $15,000 $15,000 $20,000
sector
Energy $15,000 $20,000 $25,000 $15,000 $15,000 $20,000 $10,000 $10,000 $15,000
Financial Services $11,478 $20,000 $25,000 $10,000 $15,000 $20,000 $7,500 $15,000 $20,000
Industrials $16,750 $20,000 $25,000 $12,000 $15,000 $20,000 $10,000 $10,000 $15,000
Retail $20,000 $25,000 $30,000 $15,000 $20,000 $22,625 $10,000 $15,000 $18,000
Technology $17,250 $25,000 $40,000 $12,500 $17,500 $30,000 $10,000 $15,000 $20,000
all companies 2018 $15,000 $20,000 $28,000 $12,000 $15,000 $20,000 $10,000 $15,000 $17,500
Prevalence 96% 94% 92%

16© 2018 FW Cook
non-eXecUtiVe BoarD chair anD LeaD Director compensation
Non-Executive Board Chair RetainerThere were 144 non-executive board chairs identified in this year’s study, of which 136 (94%) are provided additional compensation over regular board members. Incremental compensation for non-executive chairs is provided in cash, equity, or a combination of both. The values shown below represent only the companies that provide additional compensation to their non-executive board chair. Such additional retainers are highly differentiated based on factors including responsibility and expected time commitment, incumbent background (e.g., former CEO), and board structure. Year-over-year changes in the data vary by size segment and are influenced by the change in the sample and the number of companies that provide board chair retainers. Compared to last year, the median board chair retainer was flat at small-cap companies ($50,000), decreased at mid-cap companies (from $112,000 to $100,000), and increased at large-cap companies (from approximately $143,000 to $150,000).
Consistent with the prior year, companies in the Energy and Retail sectors provide the highest additional compensation for non-executive board chair service, while companies in the Financial Services and Technology sectors provide the lowest.
# of occurrences 53 47 36
75th percentile $92,300 $145,000 $192,500
median $50,000 $100,000 $150,000
25th percentile $30,000 $73,725 $100,000
# of occurrences 27 30 27 23 29
75th percentile $182,500 $125,000 $150,000 $150,000 $112,000
median $125,000 $71,225 $100,000 $125,000 $85,000
25th percentile $81,000 $35,000 $53,750 $50,000 $60,000
Small-Cap Mid-Cap Large-Cap
Non-Executive Board Chair Retainers By Size
Non-Executive Board Chair Retainers By Sector
Energy Financial Industrials Retail Technology Services
$0
$40,000
$80,000
$120,000
$160,000
$200,000
$0
$40,000
$80,000
$120,000
$160,000
$200,000
$50,000
$100,000
$150,000
$125,000
$71,225$100,000
$125,000
$85,000

17© 2018 FW Cook
Lead Director RetainerOf the 157 lead directors in this year’s study, 139 (89%) receive additional compensation for their service. Lead director retainers are less differentiated than other elements of director compensation, with a median value ranging from $15,000 at small-cap companies to $30,000 at large-cap companies.
When segmented by sector, there is little differentiation in magnitude: the median lead director retainer across all five sectors is $25,000.
non-eXecUtiVe BoarD chair anD LeaD Director compensation
# of occurrences 31 43 65
75th percentile $25,000 $32,500 $35,000
median $15,000 $25,000 $30,000
25th percentile $14,000 $20,000 $25,000
# of occurrences 27 28 25 32 27
75th percentile $30,000 $35,000 $30,000 $36,250 $40,000
median $25,000 $25,000 $25,000 $25,000 $25,000
25th percentile $25,000 $15,000 $23,750 $20,000 $20,000
Small-Cap Mid-Cap Large-Cap
Lead Director Retainers By Size
Lead Director Retainers By Sector
Energy Financial Industrials Retail Technology Services
$0
$10,000
$20,000
$30,000
$40,000
$0
$10,000
$20,000
$30,000
$40,000
$25,000 $25,000 $25,000 $25,000 $25,000
$15,000
$25,000
$25,000$30,000
Small-Cap Mid-Cap Large-Cap
Lead Director Retainers By Size
Lead Director Retainers By Sector
Energy Financial Industrials Retail Technology Services
$0
$10,000
$20,000
$30,000
$40,000
$0
$10,000
$20,000
$30,000
$40,000
$25,000 $25,000 $25,000 $25,000 $25,000
$15,000
$25,000
$25,000$30,000

18© 2018 FW Cook
stock ownership GUiDeLines anD retention reqUirementsDirector stock ownership guidelines are in place for a majority of the sample, particularly at large-cap and mid-cap companies, and have increased in prevalence year-over-year among large-cap and small-cap companies. Companies may also have stock retention requirements in the form of: (1) granting equity as deferred stock units that mandatorily settle after retirement from the board (often observed at large-cap companies) or (2) requiring retention of a percentage of “net shares” acquired, which is also known as a “retention ratio.”
Across all companies in the survey, 81% of companies have ownership guidelines and 35% have retention requirements.
Retention RequirementsStock retention requirements continue to be a minority practice but are most prevalent among large-cap companies where they typically take the form of equity awards that only settle after retirement from the board. For small-cap and mid-cap companies, the requirement more often provides for mandatory retention until a required ownership level is achieved. A retention ratio of 100% of net shares is the most common across all three size sectors.
*Combination means the use of a retention requirement in addition to an ownership guideline (note: methodology was expanded in this year’s report to include retention requirements in the form of deferred stock units)**Calculated out of companies disclosing retention requirements***Calculated out of companies disclosing retention ratios
Stock Retention Requirements
small-cap mid-cap Large-cap overall
prevalence 28% 29% 49% 35%
Length of retention**
Until Retirement 29% 28% 57% 42%
Until Ownership Guideline Met 64% 62% 35% 50%
Fixed Years 7% 10% 8% 8%
Vehicle for requirement**
Retention Ratio 79% 82% 48% 65%
Deferred Stock Units 21% 18% 52% 35%
retention ratio***
100% 46% 50% 58% 52%
75% 9% 8% 4% 7%
50% 45% 29% 38% 37%
Other 0% 13% 0% 4%
Large-Cap Small-CapMid-Cap
Retention Requirement
Only 4%
Combination*45%
Ownership Guidelines Only 46%
None 5%
Retention Requirement
Only 1%
Combination*28%
Ownership Guidelines Only 54%
None 17%
Retention Requirement
Only 4%
Combination*24%
Ownership Guidelines Only 47%
None 25%
19© 2018 FW Cook
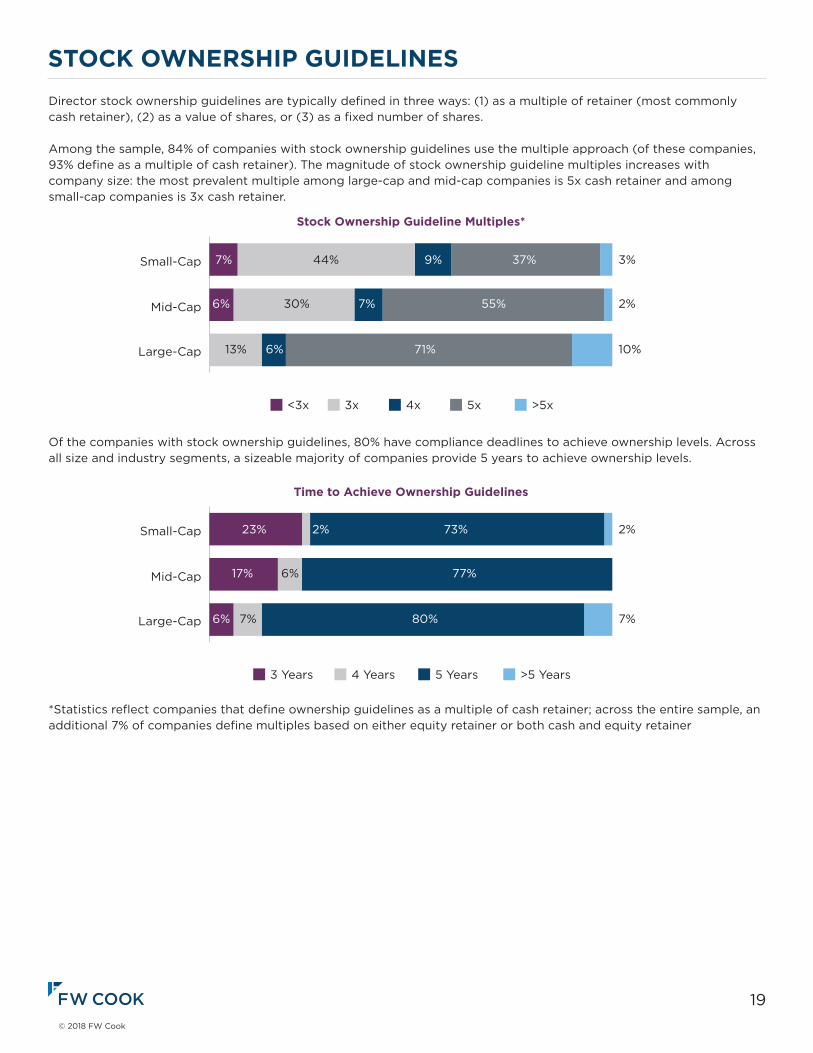
stock ownership GUiDeLinesDirector stock ownership guidelines are typically defined in three ways: (1) as a multiple of retainer (most commonly cash retainer), (2) as a value of shares, or (3) as a fixed number of shares.
Among the sample, 84% of companies with stock ownership guidelines use the multiple approach (of these companies, 93% define as a multiple of cash retainer). The magnitude of stock ownership guideline multiples increases with company size: the most prevalent multiple among large-cap and mid-cap companies is 5x cash retainer and among small-cap companies is 3x cash retainer.
Of the companies with stock ownership guidelines, 80% have compliance deadlines to achieve ownership levels. Across all size and industry segments, a sizeable majority of companies provide 5 years to achieve ownership levels.
*Statisticsreflectcompaniesthatdefineownershipguidelinesasamultipleofcashretainer;acrosstheentiresample,anadditional 7% of companies define multiples based on either equity retainer or both cash and equity retainer
Large-Cap
Mid-Cap
Small-Cap
Stock Ownership Guideline Multiples*
<3x 3x 4x 5x >5x
44% 37%9% 3%
30% 7% 55% 2%
6%
7%
6%
13% 71% 10%
Large-Cap
Mid-Cap
Small-Cap
3 Years 4 Years 5 Years >5 Years
2% 73% 2%
6% 77%
7%
23%
17%
6% 80% 7%
Time to Achieve Ownership Guidelines
Large-Cap
Mid-Cap
Small-Cap
Stock Ownership Guideline Multiples*
<3x 3x 4x 5x >5x
44% 37%9% 3%
30% 7% 55% 2%
6%
7%
6%
13% 71% 10%
Large-Cap
Mid-Cap
Small-Cap
3 Years 4 Years 5 Years >5 Years
2% 73% 2%
6% 77%
7%
23%
17%
6% 80% 7%
Time to Achieve Ownership Guidelines

20© 2018 FW Cook
compensation DeFerraLsUnchanged from last year, approximately 41% of companies that pay cash retainers/fees provide for some form of voluntary cash deferral. Of the companies that provide voluntary cash deferrals, approximately two-thirds provide for “cash-to-cash” deferral by which cash may be deferred into alternative investments such as those under a company’s employee 401(k) plan, and the same percentage allow directors to defer cash into a company stock unit account (approximately 40% provide both). Such deferrals are typically distributed after retirement from the board.
Of companies that award equity annually, 34% provide for deferral of equity grants beyond the vesting period (“stock-to-stock”deferral);21%allowthisonavoluntarybasis,whiletheremaining13%grantequitythatismandatorilydeferreduntil retirement from the board. Compared to last year, the prevalence of stock-to-stock deferrals somewhat decreased among the sample primarily due to changes in the company set year-over-year.
*Includes companies that permit deferral of either cash-to-cash, cash-to-stock, or both
Cash* Stock Cash* Stock Cash* Stock Small-Cap Mid-Cap Large-Cap
Prevalence of Cash and Stock Deferral Programs By Size
Elective Mandatory
19%13%6%7%
34%6%
28%
55%
26%
29%
64%
40%

21© 2018 FW Cook
sharehoLDer-approVeD Limits on annUaL Director compensation In recent years, there has been a trend to include meaningful limits on annual compensation per director in shareholder-approved equity plans. Such limits can apply to equity compensation only (expressed as a dollar value or number of shares/options)ortototalcompensation(cashandequity);thelatterispreferableandisviewedasprovidingmorecomplete protection against a potential lawsuit, since case law does not seem to distinguish between cash and equity. However,recentlegaldevelopmentsindicatethattheprotectionprovidedbyalimitmaybemorelimitedthanwasbelieved last year.
We examined the research sample to understand the prevalence and magnitude of annual per-director pay limits. Year-over-year, we observe a less pronounced increase in the number of companies having such limits (up from 51% to 55%, compared to last year’s more significant increase from 32% to 51%). While equity-only limits continue to be more common, total pay limits are growing in use, increasing this year from 26% to 34% of companies and accounting for 55% of new limits among the sample companies. This year, we observe an increase in equity limits expressed as a dollar value, which makes sense because fixed-share limits do not ultimately restrict grant value. Some companies raise or nullify the limit in special cases, such as a director’s first year of service or if a director serves as the board chair or lead director, although such exceptions are used by less than 10% of companies with limits.
*Calculated out of companies disclosing limits**Calculated out of companies with equity-only limits
Annual Limits on Non-Employee Director Compensation
small-cap mid-cap Large-cap overall
prevalence 31% 63% 70% 55%
application of Limit*
Total Compensation 19% 41% 34% 34%
Equity Only 81% 59% 66% 66%
Denomination of equity Limit**
Dollar-Denominated 60% 68% 80% 71%
Share-Denominated 32% 27% 18% 24%
Both 8% 5% 2% 5%
22© 2018 FW Cook
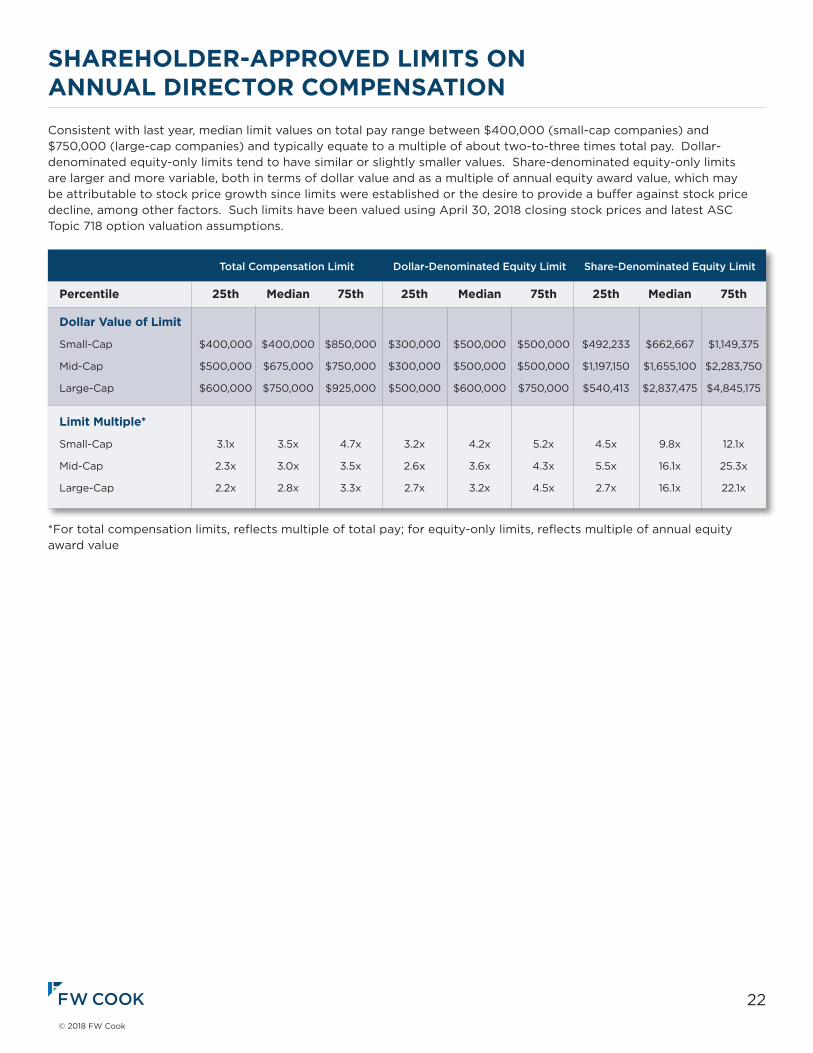
sharehoLDer-approVeD Limits on annUaL Director compensation Consistent with last year, median limit values on total pay range between $400,000 (small-cap companies) and $750,000 (large-cap companies) and typically equate to a multiple of about two-to-three times total pay. Dollar-denominated equity-only limits tend to have similar or slightly smaller values. Share-denominated equity-only limits are larger and more variable, both in terms of dollar value and as a multiple of annual equity award value, which may be attributable to stock price growth since limits were established or the desire to provide a buffer against stock price decline, among other factors. Such limits have been valued using April 30, 2018 closing stock prices and latest ASC Topic 718 option valuation assumptions.
*Fortotalcompensationlimits,reflectsmultipleoftotalpay;forequity-onlylimits,reflectsmultipleofannualequityaward value
Total Compensation Limit Dollar-Denominated Equity Limit Share-Denominated Equity Limit
percentile 25th median 75th 25th median 75th 25th median 75th
Dollar Value of Limit
Small-Cap $400,000 $400,000 $850,000 $300,000 $500,000 $500,000 $492,233 $662,667 $1,149,375
Mid-Cap $500,000 $675,000 $750,000 $300,000 $500,000 $500,000 $1,197,150 $1,655,100 $2,283,750
Large-Cap $600,000 $750,000 $925,000 $500,000 $600,000 $750,000 $540,413 $2,837,475 $4,845,175
Limit multiple*
Small-Cap 3.1x 3.5x 4.7x 3.2x 4.2x 5.2x 4.5x 9.8x 12.1x
Mid-Cap 2.3x 3.0x 3.5x 2.6x 3.6x 4.3x 5.5x 16.1x 25.3x
Large-Cap 2.2x 2.8x 3.3x 2.7x 3.2x 4.5x 2.7x 16.1x 22.1x
23© 2018 FW Cook
List oF companies sUrVeYeD1-800-FLOWERS.COM3MAbercrombie & FitchAccess NationalAcxiomAdobe SystemsAdvance Auto PartsAegionAlamo GroupAllstateAmazon.comAmerican Eagle OutfittersAmerican Midstream PartnersAmerican SoftwareAmkor TechnologyAnadarko PetroleumAnalog DevicesApacheApartment Investment & ManagementApproach ResourcesArcBestArmstrong World IndustriesAtlasAirWorldwideHoldingsAutoZoneAxcelis TechnologiesB. Riley FinancialBanc of CaliforniaBarnes & NobleBasic Energy ServicesBB&TBeacon Roofing SupplyBed Bath & BeyondBeldenBGC PartnersBig 5 Sporting GoodsBig LotsBloomin’ BrandsBookingHoldingsBristow GroupBryn Mawr BankBuild-A-Bear WorkshopBurlington StoresCACadence Design SystemsCaleresCallon PetroleumCamden NationalCARBO CeramicsCare.comCarrizo Oil & Gas
Cass Information SystemsCathay General BancorpCentral Pacific FinancialChesapeake EnergyChevronChildren’s PlaceCincinnati FinancialCitrix SystemsCNO Financial GroupCognexCognizant Technology SolutionsColfaxColumbia SportswearComericaConcho ResourcesConn’sConocoPhillipsContainer Store GroupCoreLogicCore-MarkHoldingCorEnergy Infrastructure TrustCowenCreeCSG Systems InternationalCSW IndustrialsCTSCumminsDeereDelekUSHoldingsDevon EnergyDick’s Sporting GoodsDigimarcDillard’sDollar GeneralDonegal GroupDonnelley Financial SolutionsDoverDuke RealtyEllington FinancialEMCOREEnergenEnnisEnPro IndustriesEra GroupExpeditors International of WashingtonExterranExxon MobilF5 NetworksFBL Financial GroupFinish Line

24© 2018 FW Cook
List oF companies sUrVeYeDFirst BanCorp.First Defiance FinancialFluorFoot LockerFossil GroupFrancesca’sHoldingsFred’sFreightCar AmericaFuelCell EnergyGAMCO InvestorsGameStopGeneral DynamicsGeneral ElectricGenesis EnergyGerman American BancorpGibraltar IndustriesGlobal PartnersGreen BancorpGreen DotGreen PlainsGriffonGuaranty BancorpGulfport EnergyHalliburtonHanesbrandsHartfordFinancialServicesGroupHavertyFurnitureHealthcareRealtyTrustHelixEnergySolutionsGroupHeritageCommerceHeritageFinancialHessHFFHomeDepotHubGroupIBERIABANKInnerWorkingsInsteel IndustriesIntelIntuitInvescoIron MountainItronJacobsEngineeringGroupJuniperNetworksKelly ServicesKimball ElectronicsKirkland’sKLA-TencorKohl’s
Korn/Ferry InternationalL.B. FosterLam ResearchLaredo PetroleumLaSalleHotelPropertiesLattice SemiconductorLayne ChristensenLife StorageLincoln NationalLockheed MartinLowe’sMack-Cali RealtyMacy’sMammoth Energy ServicesMarathon OilMarathon PetroleumMarineMaxMatrix ServiceMAXIMUSMeridian BancorpMesa LaboratoriesMetLifeMGIC InvestmentMicron TechnologyMistras GroupModel NMorgan StanleyNational Oilwell VarcoNatural Gas Services GroupNCRNetAppNetflixNewpark ResourcesNoble EnergyNordstromNorthern Oil & GasNorthrop GrummanNutrisystemOffice DepotOmega FlexONEOKOneSpanOracleOverstock.comPBF EnergyPC ConnectionPDC EnergyPenn VirginiaPenske Automotive GroupPGT Innovations

25© 2018 FW Cook
List oF companies sUrVeYeDPHIPier 1 ImportsPinnacle EntertainmentPioneer Energy Services.Pioneer Natural ResourcesPiperJaffrayPlug PowerPreformed Line ProductsPrincipal Financial GroupQ2HoldingsQEP ResourcesQuantumR.R. Donnelley & SonsRadiant LogisticsRapid7RealPageRedHatRegal BeloitRent-A-CenterResolute EnergyResources ConnectionRHRibbon CommunicationsRockwell CollinsRollinsRosetta StoneRoss StoresRowanRPCRyder SystemSallyBeautyHoldingsScholasticSEACORHoldingsSelect Energy ServicesSemGroupServiceSource InternationalShoe CarnivalSigma DesignsSilverBow ResourcesSiriusXMHoldingsSkyWestSM EnergySpirit AirlinesStamps.comStanley Black & DeckerStock Yards BancorpSuperior Energy ServicesSykes EnterprisesT. Rowe Price GroupTake-Two Interactive Software
Tanger Factory Outlet CentersTarga ResourcesTargetTCF FinancialTDAmeritradeHoldingTempur Sealy InternationalTennantTetra TechTETRA TechnologiesTextronThermonGroupHoldingsTJXTompkins FinancialTractor SupplyTransoceanTravelersTrimbleTriumph GroupTTECHoldingsTTM TechnologiesTuesday MorningU.S. BancorpUnder ArmourUnited Financial BancorpUnited Parcel ServiceUnited RentalsValero EnergyViadViasatViavi SolutionsVirtu FinancialVornado Realty TrustW&T OffshoreWaste ConnectionsWaste ManagementWells FargoWesBancoWESCO InternationalWestern DigitalWilliams-SonomaWoodwardWorkivaWorld Fuel ServicesWPX EnergyXcerraXO GroupXylemZions BancorporationZoe’s KitchenZynga

26© 2018 FW Cook
companY proFiLeFw cook is an independent consulting firm specializing in executive and director compensation and related corporate governance matters. Formed in 1973, our firm has served more than 3,000 companies of divergent size and business focusfromourofficesinNewYork,Chicago,LosAngeles,SanFrancisco,Atlanta,HoustonandBoston.Wecurrentlyserve as the independent advisor to the compensation committees at a substantial number of the most prominent companies in the U.S.
Our office locations:
website: www.fwcook.com
AuthorsThisreportwasauthoredbyTamarButenandAlexaKierzkowski,withassistancefromJacobPoarchandJessicaChulya. Questions and comments should be directed to Ms. Buten at (713) 427-8342 or [email protected] or to Ms. Kierzkowski at (310) 734-0110 or [email protected].
new York685 Third Avenue28th FloorNew York, NY 10017212-986-6330
chicago190 LaSalle StreetSuite 2120Chicago, IL 60603312-332-0910
Los angeles11100 Santa Monica Blvd. Suite 300Los Angeles, CA 90025310-277-5070
san Francisco135 Main StreetSuite 1750San Francisco, CA 94105415-659-0201
atlanta3344 Peachtree Road, NE Suite 1700Atlanta, GA 30326404-439-1001
houstonTwo Allen Center1200 Smith StreetSuite 1100Houston,TX77002713-427-8300
Boston34 Washington StreetSuite 230WellesleyHills,MA02481781-591-3400