Corporate Board Governance and Director Compensation · PDF fileCorporate Board Governance and...
107
Corporate Board Governance and Director Compensation in Canada A Review of 2011 In Partnership with Patrick O’Callaghan and Associates
Transcript of Corporate Board Governance and Director Compensation · PDF fileCorporate Board Governance and...

Corporate Board Governance and Director Compensation in Canada
A Review of 2011
In Partnership with Patrick O’Callaghan and Associates

$110.00 per copy © Korn/Ferry International, December 2011All rights reserved. No part of the contents of this report may be reproduced or transmittedin any form or by any means without the written permission of the Publisher.
This report is also available in French.

Corporate Board Governance and Director Compensation in Canada A Review of 2011 | 1
TABLE OF CONTENTS
The Surveyed Companies 3
Special Report: Retirement Age and Term Policies – A New Focus 6
Board Independence 21
Board Composition 27
Board Size 35
Board Assessments, Director Selection and Director Development 39
Meetings and Attendance 43
Board Committees 49
Director Compensation 53
Board Chair Compensation 61
Lead Director Compensation 65
Committee Chair Compensation 67
Committee Member Compensation 71
Stock-Based Compensation 75
Compensation Summary 79
Director Share Ownership 83
Company Data 87
Endnotes 98
Korn/Ferry International 101
Patrick O’Callaghan and Associates 103
Women On Board 104

The Surveyed Companies
2 | Corporate Board Governance and Director Compensation in Canada A Review of 2011

Corporate Board Governance and Director Compensation in Canada A Review of 2011 | 3
here we refer to “equities”, we are referring to all members of the research sample that are not income trusts. In this
sixth year that we have included income trusts in our analysis, approximately 13% of the sample fall into this category. The reduction in this category (down from 20% last year and a high of 26% in 2007) can likely be attributed to changes in income tax rules affecting trusts that took place in January 2011.
• Thedataiscollectedfrompubliclytradedequities and income trusts that were on one or more of the following lists:
* The Financial Post Top 250 (June 2011) * The Report on Business Top 250 (July 2011) * The S&P/TSX Composite Index (at any time during 2010)
• Wedrawdatafromannualreports,management proxy circulars and annual information forms for fiscalyear-endsinlate2010,orthefirstfewmonths of 2011. All references to “2010” data include data for year-ends in early 2011.
• AllfiguresreportedinUnitedStatesdollarshavebeen converted to Canadian dollars at an exchange rate of 1.03, which was the average exchange rate for 2010.
• Allfractionshavebeenroundedoff tothenearest whole number, thus all totals do not add up to exactly 100%.
• WherethisreportusescomparativeU.S.data,itis drawn from the following sources:
* 2010-2011 Director Compensation Survey, a publication of the National Association of Corporate Directors in collaboration with Pearl Meyer & Partners. This study is based on 1,400 companieswithfiscalyearendsbetweenFebruary 1, 2009, and January 31, 2010 with revenues over US$50million.
* 2011 Public Company Governance Survey, a publication of the National Association of Corporate Directors. This study is based on insights from 1,300 public company directors and the proxy data from 2,400 public companies.
The Most Comprehensive Canadian Governance Study
We are pleased to present the most comprehensive review of public issuer governance data available in Canada. This nineteenth annual report examines governance in Canadian companies and income trusts and includes our
special report, Retirement Age and Term Policies – A New Focus. Our commitment is to provide directors and trustees with accurate and relevant Canadian data across a wide spectrum.
W
Percent Income Trusts Percent Equities All
<500M 5% 95% 13%
500M to 1B 18% 82% 17%
1B to 5B 18% 82% 42%
>5B 6% 94% 28%
All 13% 87% 100%
Breakdown of Asset Size Groups in the Research Sample, by Board Type

4 | Corporate Board Governance and Director Compensation in Canada A Review of 2011
Percent Income Trusts Percent Equities All
Consumer Discretionary 8% 92% 13%
Consumer Staple 8% 92% 4%
Energy 16% 84% 20%
Financials 27% 73% 18%
Health Care 33% 67% 2%
Industrials 12% 88% 11%
Information Technology 0 100% 2%
Materials 0 100% 24%
Telecommunication Services 20% 80% 2%
Utilities 22% 78% 3%
All 13% 87%
Breakdown of Industry Groups in the Research Sample, Comparing Equities and Income Trusts
<500M 500M to 1B 1B to 5B >5B All Percent**
Consumer Discretionary 5 10 14 9 38 13%
Consumer Staple 0 2 7 4 13 4%
Energy 9 6 28 18 61 20%
Financials 3 5 20 27 55 18%
Health Care 1 3 1 1 6 2%
Industrials 6 5 16 6 33 11%
Information Technology 1 1 4 1 7 2%
Materials 14 18 29 11 72 24%
Telecommunication Services 1 0 2 2 5 2%
Utilities 0 0 4 5 9 3%
All 40 50 125 84 299 99%
Percent* 13% 17% 42% 28% 100%
Breakdown of Research Sample by Assets and Industry Group
* Asset group as a percentage of total. ** Industry group as a percentage of total.

Corporate Board Governance and Director Compensation in Canada A Review of 2011 | 5
Terminology and Standards Used Throughout this Report
Special Report: Retirement Age and Term Policies - A New Focus
Korn/Ferry International and Patrick O’Callaghan and Associates surveyed 154 board chairs, directors and CEOs to produce this special report, which can be found on pages 7 to 18. Respondents were either personally interviewed or completed an on-line survey.
• Size: Most tables in this report compare results between companies and income trusts within asset groups. The short forms “M” for millions of dollars and “B” for billions of dollars are used in the tables.
• Comparisons: Where tables present data by year, thedataisgivenfor2010,2009and2001orthefirstyear we began tracking the particular subject. This allows readers to compare between the two most recent years, and also to see how the subject has changed over time.
• Regulatory Documents: Where we use “CSA disclosure requirements”, we are referring to the Canadian Securities Administrators’ National Instrument 58-101, Disclosure of Corporate Governance Practices. Where we use “CSA governance guidelines”, we are referring to the Canadian Securities Administrators’ National Policy 58-201, Corporate Governance Guidelines.
• Independent Directors: Where we refer to directors as “independent”, we are basing the categorization on the company’s assignment of the term to individual directors under the definitionintheCSAdisclosurerequirements.
• Directors and Trustees: With the inclusion of income trusts, we are now including organizations with both directors and trustees. For the sake of brevity in this document, where we refer to “director”, we are referring to both directors and trustees.
• Types of Organizations: Where we use “company” we are referring to any member of the research sample as a whole, which could be either an equity or an income trust.
• Income Trust Names: In some cases, income trusts presented governance data for a board other than its own board of trustees (e.g., for the board of an “Administrator” or “Manager”). The name cited is always the name we have drawn from one of the three sources we used to compile the research sample.
• Retainers: Whenever the term “retainer” is used alone, it refers to whatever combination of cash and shares is paid to directors by the company as a retainerforservices,unlesswereferspecificallytothe “cash portion of a retainer” or the “share portion of a retainer”.
• Compensation based on Shares, Trust Units and Equivalents: Where we discuss compensation in the form of shares, trust units, deferred share units, etc.,weuse“shares”unlessreferringtoonespecifictype of compensation in this group. This does not include compensation in the form of stock or trust options.

6 | Corporate Board Governance and Director Compensation in Canada A Review of 2011 | Special Report
Special Report 2011
Corporate Board Governance and Director Compensation in Canada A Review of 2011 | Special Report | 7
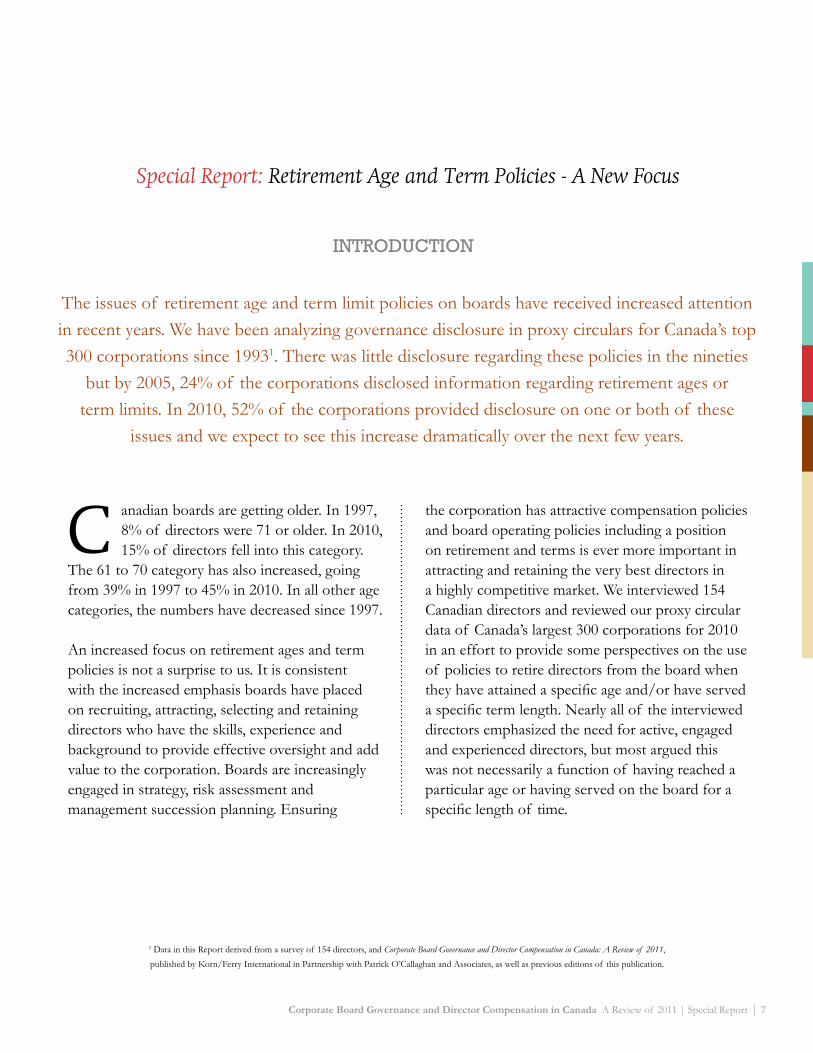
anadian boards are getting older. In 1997, 8% of directors were 71 or older. In 2010, 15% of directors fell into this category.
The 61 to 70 category has also increased, going from 39% in 1997 to 45% in 2010. In all other age categories, the numbers have decreased since 1997.
An increased focus on retirement ages and term policies is not a surprise to us. It is consistent with the increased emphasis boards have placed on recruiting, attracting, selecting and retaining directors who have the skills, experience and background to provide effective oversight and add value to the corporation. Boards are increasingly engaged in strategy, risk assessment and management succession planning. Ensuring
the corporation has attractive compensation policies and board operating policies including a position on retirement and terms is ever more important in attracting and retaining the very best directors in a highly competitive market. We interviewed 154 Canadian directors and reviewed our proxy circular data of Canada’s largest 300 corporations for 2010 in an effort to provide some perspectives on the use of policies to retire directors from the board when theyhaveattainedaspecificageand/orhaveservedaspecifictermlength.Nearlyallof theintervieweddirectors emphasized the need for active, engaged and experienced directors, but most argued this was not necessarily a function of having reached a particular age or having served on the board for a specificlengthof time.
Special Report: Retirement Age and Term Policies - A New Focus
The issues of retirement age and term limit policies on boards have received increased attention in recent years. We have been analyzing governance disclosure in proxy circulars for Canada’s top 300 corporations since 19931. There was little disclosure regarding these policies in the nineties
but by 2005, 24% of the corporations disclosed information regarding retirement ages or term limits. In 2010, 52% of the corporations provided disclosure on one or both of these
issues and we expect to see this increase dramatically over the next few years.
INTRODUCTION
1 Data in this Report derived from a survey of 154 directors, and Corporate Board Governance and Director Compensation in Canada: A Review of 2011,
published by Korn/Ferry International in Partnership with Patrick O’Callaghan and Associates, as well as previous editions of this publication.
C

8 | Corporate Board Governance and Director Compensation in Canada A Review of 2011 | Special Report
What they emphasized was the need for board renewal. A retirement age and/or term limit should be considered as one of a number of methods to refresh and add new experience to the board. The strongest theme that emerged is that there is not a single perfect age or policy that applies to all corporations. Directors emphasized that the history, culture and complexity of thecompanyandthespecificstrategicchallenges confronting the corporation, are key considerations in implementing such policies. Board chair leadership, director performance and the current age diversity of the board are equally important.
In 2010, 25% of Canada’s top 300 boards had a retirement age for directors and 23% had no retirement age (the remaining 52% did not disclose this information). For the actual practices of the corporations that disclosed their retirement age policy for 2010, please see the appendix on pages 12 to 18 at the end of this Special Report.
Current Practice - Retirement Age
2010 2009 2008 2007 2006 2005
Retirement from the board at age 65 <1% 0 0 0 0 0
Retirement from the board at age 70 12% 14% 11% 13% 9% 9%
Retirement from the board at age 71 <1% 1% <1% <1% <1% <1%
Retirement from the board at age 72 6% 5% 5% 3% 3% 3%
Retirement from the board at age 73 1% 0 0 0 0 0
Retirement from the board at age 75 4% 5% 5% 4% 3% 3%
Formal policy, age not specified <1% <1% <1% 1% 1% 1%
Specify there is no director retirement age 23% 18% 14% 14% 5% 5%
Combined retirement age/term limit 1% 0 <1% <1% 3% 3%
No disclosure 52% 56% 64% 63% 76% 76%
Director Retirement Ages

Corporate Board Governance and Director Compensation in Canada A Review of 2011 | Special Report | 9
Retirement Ages
While the most common retirement age is 70, many of the interviewed directors indicated that their boards were examining the possibility of extending their retirement age. The most frequently mentioned target ages were 72 and 75. Directors indicated that an extension of the retirement age was important if they were to be competitive in recruiting CEOs in their early to mid sixties who were preparing to retire or who had just retired.
Directors who supported the use of a retirement age made the following arguments:
• Boardsneedtohaveamechanisminplacethat ensures board renewal. A retirement age provides a clear expectation for directors and assists the board in planning for transition in an explicit manner. They argued that it is extremely difficulttoaskadirectortoresign,andhaving an explicit policy removes the awkwardness around transition.
• Retirementagesdonothavetobeabsoluteand many corporations provide for annual extensions or exceptions beyond the retirement ages in specificcases.
• Withoutaretirementage,thereistoomuch dependence on the board chair’s ability to transition directors off the board at an appropriate time. While some board chairs are skilled in this area, they are seen to be more the exception than the rule. Therefore a retirement age removes this pressure from the board chair and provides a clear transition point. It also provides for consistent practice when board leadership changes.
• Directorsacknowledgedthatindividualdirector evaluation has become more prevalent and ideally might replace the need for retirement ages at some point. But most felt that director evaluation processesarenotyetrefinedormatureenough to depend on them for board renewal versus a retirement age.
• Afixedretirementagemakesiteasierfortheboardto plan its composition over a longer period of time. Mandatory retirement age is a great tool to drive renewal of the board. No one is irreplaceable, and with a policy in place you can plan for orderly and adequate succession on the board.
• Directorsmentionedthattherealperformanceproblems such as lack of preparation or attendance are relatively straightforward to address. The most difficultsituationsarewhereadirectoriswelllikedand has made a contribution historically, but whose performance has diminished or whose performance is just average; whose skills and background no longerfittheboard’schangingcompositionneeds;or who has become too close to management. Participants felt that while a strong chair can deal with an extreme performance issue, it is much more difficulttoaskawell-likeddirectortoleaveforalessobvious reason. Having a retirement age provides the chair and the director with a way to deal with the situation gracefully.
No Retirement Age
Directors who supported a no retirement age policy made the following arguments:
• Itdoesn’tmakesensetoloseexperienceddirectorswho are adding value to the board because of an arbitrary retirement age.
• Havingnoretirementagehelpstoattractabroaderrange of candidates, especially recently retired CEOs because of the potential to have a longer tenureontheboard.Potentialdirectorsfindanoretirement age policy attractive, and a factor when comparingboardopportunities.Havingafixed retirementagedoesnotreflectthechanging demographic of a healthy, engaged baby boomer generation moving into their mid sixties.

10 | Corporate Board Governance and Director Compensation in Canada A Review of 2011 | Special Report
• Aboardwithastrongandeffectiveindividual director evaluation process does not need a retirement age because directors are retired based on their performance, not on their age. Action can be taken in a timely fashion and there is no need to carry a director beyond their ability to make a significantcontributiontotheboard.
• Boardsaredoingamuchmorecomprehensivereview of the skills, experience and background that arerequiredforaboard.Undertakingthisprocessleads directors and/or board chairs to recognize it may be time for an individual director to move off the board.
• Theroleof aneffectiveboardchairistocoachdirectors and advise them when it is time for them to retire. Board chairs now recognize this is one of their critical roles and are becoming more skilled in undertaking this function.
As disclosure about retirement practices on boards has increased, some boards have gone beyond just stating what their practices are, and are providing narrative to help shareholders understand their position on this issue. Intheir2007informationcircular,TELUSCorporationprovided a very comprehensive discussion for their decision to end their use of retirement age for directors:
The Board removed the requirement that directors retire at the age of 70. This decision was based on an extensive review led by the Corporate Governance Committee. The Corporate Governance Committee examined the purpose for the requirement, the correlation between a director’s age and effectiveness, and the need for regular Board rejuvenation. It considered the profile and age of the current directors and their years of service, the Board renewal that has taken place organically, the robust annual evaluation of directors already in place, the need to keep crucial talent on the Board beyond age 70, the expectation of increased competition for qualified directors among large public companies, and the fact that five out of the 12 directors would reach age 70 before the 2010 annual general meeting including relatively new directors who would have served on the Board for well under ten years at that time. Maintaining a mandatory retirement age of 70 would cause the Company to lose qualified directors who
would have served on the Board for a relatively short tenure. The Corporate Governance Committee considered alternatives such as raising the mandatory retirement age to 72 or another age, setting maximum terms of service and creating an explicit discretion to waive the requirement on an exception basis.
Ultimately, the Corporate Governance Committee concluded that, with a vigorous evaluation process in place, mandatory retirement is not the optimal means of ensuring Board renewal and age is not the optimal means of ensuring director effectiveness, and that with the present tenure and profile of the Board, maintaining a mandatory retirement age at 70 or another age is not in the best interests of the Company. This assessment was supported by data on market trends which indicate that more companies are waiving retirement age in order to retain board talent, shifting towards a reliance on competence assessment rather than age, and increasing the average age of directors to overcome increasing difficulty in recruiting current CEOs from other businesses to serve on boards.
Current Practice - Term Limits
Few boards disclose their practices on term limits. We believe that this is because there is a very low percentage of boards with term limits. In 2010, only 14% of Canada’s top 300 corporations addressed the issue in their annual circulars, with 3% having a term limit and 11% stating they did not. Few of the corporate directors we surveyed for this special report had term limits although they were all familiar with them with respecttonot-for-profitboardsonwhichtheyweremembers.Theyindicatedthatmostof thenot-for-profitboards had terms rather than retirement ages. This is often because directors are prepared to provide their adviceandcounseltonot-for-profitsforalimitedperiodof time and generally without remuneration.
The major Canadian banks often lead the way on various corporate governance practices and over the past few years a number of the banks have introduced term limits in addition to their retirement age policy. We expect that those banks without term limits will likely introduce them within the next few years.

Corporate Board Governance and Director Compensation in Canada A Review of 2011 | Special Report | 11
Term limits are often introduced in combination with a retirement age policy where a director leaves the board when reaching the age or the term limit, whichever comesfirst.Essentiallytheadvantageof termlimits versus retirement age applies when a director is appointed at a relatively young age. For examples of actual policies, see the appendix at the end of this special report.
The advantages and disadvantages for term limits are essentially identical to those for retirement age. On the upside, term limits provide ongoing board renewal and on the downside, they can cause the board to lose a valued director prematurely.
Retirement Age and Terms - Future Considerations
As the focus on board effectiveness continues to grow, boards are concentrating on ensuring they have the board composition policies and procedures that meet the needs of the corporation and are consistent with its strategic objectives. Our survey participants were split on the role that retirement age and term limits play in this process. Some feel retirement age and term policies are an essential way to ensure that renewal happens and to focus the board on engaging in the composition planning and nomination process. Others feel they are a hindrance to optimal board composition in that they remove valuable, contributing directors at an arbitrary date. Regardless of the stance, in most cases the reasoning is tied to board composition needs and leadership far more than to a belief that after reaching a certain age or tenure, an individual is no longer a capable director.
With this dichotomy in practices and opinions, what should boards be doing? The most intuitive answer may be that with strong individual director assessment coupled with an experienced and effective board chair, retirement and term limits may not be necessary. However, many directors we interviewed indicated that while individual director evaluation has come a long way in recent years, few boards truly have a robust enough evaluation process coupled with a board chair who has
the experience and inclination to deal with the more subtle and awkward director performance issues.
There is clearly no single right answer that applies to all boards. Reaching a decision may involve some uncomfortable discussion. However, it is a discussion thatisnecessaryinordertogettoadecisionthatfitstheboard’s needs. Some of the questions a board might wish to ask itself include:
• Doesourboardregularlyundertakeacarefulreviewof its current and future composition needs and adjust board succession and recruitment plans objectively?Isboardcompositionplanningflexibleenough to react to changes in strategy and director performance?
• Doesthepresenceorlackof aretirementortermlimit affect our ability to attract new directors? Does it send the appropriate signal to investors regarding our ability to manage director performance and board succession planning?
• Isourindividualdirectorassessmentprogram,including its follow-up component, truly robust enough to identify and address problems with director performance and contribution? Is our board culture such that directors participate in this assessment without reservation and are prepared to support the results?
• Doesourboardchairhavetheexperience,thewilland the support of the board to handle the most obvious performance problems, and especially the moresubtleanddifficultdecisionsregardingdirectorperformance?
• Wouldweaskawell-likeddirectorwhodoesn’twantto leave the board to do so if there were a valid reason, even if there is no extreme performance problem? Do personal relationships and respect for a director preclude making the best decision with regard to board composition needs?
• Howdowevalueandbalanceregularrotationof fresh perspectives with long term experience and institutional knowledge on the board?

12 | Corporate Board Governance and Director Compensation in Canada A Review of 2011 | Special Report
Appendix: Retirement and Term Limit Policies
Disclosed in Proxy Circular Data for Fiscal 20102
Company Retirement Term Limit No No Retirement Term Age Limit
ACE Aviation Holdings Inc. 75* Aecon Group Inc. X XAg Growth International Inc. 70 Agnico-Eagle Mines Limited X Agrium Inc. 72 Air Canada 75 AltaGas Ltd. 75 Alamos Gold Inc. X ARC Energy Trust 70 Astral Media Inc. X ATCO Ltd. 70 Aurizon Mines Ltd. X Bank of Montreal 70
Bank of Nova Scotia 70
Barrick Gold Corporation 72 Baytex Energy Corp. X BCE Inc. X
Bell Aliant Regional Communications Income Fund X Boardwalk Real Estate Investment Trust
15 years for new directors (effective Jan 1/2010) and 20 years for current directors and chair.
Ten years, in certain circumstances, the ten year term limit can be extended.
Nine years, may be extended under certain circumstances.
Scotiabank implemented new term limits in December 2010 (to become effective April 2011). Existing directors will retire at the earlier of ten years from April 1, 2011 or age 70, provided that if an existing director has not served a ten year term at the time of achieving age 70, their term will be extended for additional years in order to complete a minimum ten year term. For new directors, retirement will be the earlier of age 70 or 15 years, provided that if a director has not served a ten year term at the time of achieving age 70, their term will be extended for additional years in order to complete a minimum ten year term.
2 Derived from Corporate Board Governance and Director Compensation in Canada: A Review of 2011, published by Korn/Ferry International in Partnership with Patrick O’Callaghan and Associates. Does not include those corporations that did not disclose their director retirement and/or term limit policies.
* Board states that it can make exemptions to the retirement age policy.

Corporate Board Governance and Director Compensation in Canada A Review of 2011 | Special Report | 13
Appendix: Retirement and Term Limit Policies
Disclosed in Proxy Circular Data for Fiscal 20102 (Continued)
Company Retirement Term Limit No No Retirement Term Age Limit
Bombardier Inc. 72 BPO Properties Ltd. X XBrookfield Asset Management Inc. X Brookfield Properties Corporation X Calfrac Well Services Ltd. X Calloway Real Estate Investment Trust X Cameco Corporation 72 XCanada Bread Company, Limited XCanadian Apartment Properties Real Estate Investment Trust X Canadian Imperial Bank of Commerce X
Canadian National Railway Company 75 XCanadian Natural Resources Limited 75 XCanadian Oil Sands Limited 72 Canadian Pacific Railway Limited 72 Canadian Real Estate Investment Trust X Canadian Utilities Limited 70 Canadian Western Bank 75 Canfor Corporation X Catalyst Paper Corporation 70 CCL Industries Inc. X Centerra Gold Inc. 72
15 years, but the Corporate Governance Committee has the power to determine that it is in the best interests of CIBC to recommend for re-election a director who has served the maximum period.
2 Derived from Corporate Board Governance and Director Compensation in Canada: A Review of 2011, published by Korn/Ferry International in Partnership with Patrick O’Callaghan and Associates. Does not include those corporations that did not disclose their director retirement and/or term limit policies.
* Board states that it can make exemptions to the retirement age policy.

14 | Corporate Board Governance and Director Compensation in Canada A Review of 2011 | Special Report
Appendix: Retirement and Term Limit Policies
Disclosed in Proxy Circular Data for Fiscal 20102 (Continued)
Company Retirement Term Limit No No Retirement Term Age Limit
CGI Group Inc. X XChartwell Seniors Housing Real Estate Investment Trust X Cineplex Galaxy Income Fund X CML Healthcare Income Fund X Cogeco Cable Inc. 72 COGECO Inc. 72 Cominar Real Estate Investment Trust X Corus Entertainment Inc. X Crescent Point Energy Corp. 75 Davis + Henderson Income Fund X Detour Gold Corporation X XDollarama Inc. X DundeeWealth Inc. XEldorado Gold Corporation 73 Emera Inc. 70 Empire Company Limited 70 3 Enbridge Inc. 70 4 EnCana Corporation 71 Enerplus Resources Fund 72 XEnsign Energy Services Inc. 73* Equinox Minerals Limited X Finning International Inc. 70* First Capital Realty Inc. X XFirstService Corporation X Fortis Inc. 70 Forzani Group Ltd. (The) 72Franco-Nevada Corporation 72 XFreehold Royalties Ltd. X
12 years, or age 70, whichever comesfirst.
2 Derived from Corporate Board Governance and Director Compensation in Canada: A Review of 2011, published by Korn/Ferry International in Partnership with Patrick O’Callaghan and Associates. Does not include those corporations that did not disclose their director retirement and/or term limit policies.
3Unlessthememberisalinealdescendentof JohnWilliamSobey.
4 Retirement age is increasing to 73 in 2011 and a director may be asked to remain on the board for an additional two years if the Board unanimously approves the extension; however, that director would not be eligible to serve as Chair of the Board or Chair of any of the Board’s four standing committees.
* Board states that it can make exemptions to the retirement age policy.

Corporate Board Governance and Director Compensation in Canada A Review of 2011 | Special Report | 15
Appendix: Retirement and Term Limit Policies
Disclosed in Proxy Circular Data for Fiscal 20102 (Continued)
Company Retirement Term Limit No No Retirement Term Age Limit
Gammon Gold Inc. X Gildan Activewear Inc. 72 Goldcorp Inc. X Groupe Aeroplan Inc. 75* H&R Real Estate Investment Trust 75 Harry Winston Diamond Corporation XHome Capital Group Inc. XHudBay Minerals Inc. 70 Husky Energy Inc. XIamgold Corporation XIESI-BFC Ltd. XImperial Oil Limited 70 Industrial Alliance Insurance and Financial Services Inc. 70 Inmet Mining Corporation X XInnVest Real Estate Investment Trust XIntact Financial Corporation 70 Inter Pipeline Fund XIvanhoe Mines Ltd. XKeyera Facilities Income Fund XKinross Gold Corporation 70 Laurentian Bank of Canada XLinamar Corporation 70*
2 Derived from Corporate Board Governance and Director Compensation in Canada: A Review of 2011, published by Korn/Ferry International in Partnership with Patrick O’Callaghan and Associates. Does not include those corporations that did not disclose their director retirement and/or term limit policies.
* Board states that it can make exemptions to the retirement age policy.

16 | Corporate Board Governance and Director Compensation in Canada A Review of 2011 | Special Report
Appendix: Retirement and Term Limit Policies
Disclosed in Proxy Circular Data for Fiscal 20102 (Continued)
Company Retirement Term Limit No No Retirement Term Age Limit
MacDonald, Dettwiler and Associates Ltd. XMagna International Inc. X XMajor Drilling Group International Inc. 70 Manitoba Telecom Services Inc. 72 Manulife Financial Corporation 72 Maple Leaf Foods Inc. XMethanex Corporation X XMetro Inc. 70 NAL Energy Corporation 72 National Bank of Canada
New Gold Inc. X XNexen Inc. 75 X Nordion Inc. 70* Northgate Minerals Corporation XNorth West Company Fund 70 Onex Corporation 72 Pacific Rubiales Energy Corp. X5 XParkland Income Fund 70* Pason Systems Inc. XPembina Pipeline Corporation 70 X Pengrowth Energy Trust Penn West Energy Trust 656 Peyto Energy Trust 75 Potash Corporation of Saskatchewan Inc. 70
15 years, exceptional circumstances may allow for a director to be reelected beyond the term limit.
15 years
2 Derived from Corporate Board Governance and Director Compensation in Canada: A Review of 2011, published by Korn/Ferry International in Partnership with Patrick O’Callaghan and Associates. Does not include those corporations that did not disclose their director retirement and/or term limit policies.
5 There is no set retirement age for directors although directors are expected, but not required, to retire at the age of 80. Reviewed on a case-by-case basis.
6 At this age directors offer their resignation and annually thereafter.
* Board states that it can make exemptions to the retirement age policy.

Corporate Board Governance and Director Compensation in Canada A Review of 2011 | Special Report | 17
Appendix: Retirement and Term Limit Policies
Disclosed in Proxy Circular Data for Fiscal 20102 (Continued)
Company Retirement Term Limit No No Retirement Term Age Limit
Precision Drilling Corporation X Primaris Retail Real Estate Investment Trust X XProgress Energy Resources Corp. 70 Provident Energy Trust X XRogers Communications Inc. X RONA Inc. 70 Royal Bank of Canada 70* Rubicon Minerals Corporation XSavanna Energy Services Corp.
Sears Canada Inc. 70 ShawCor Ltd. NotSpecified XSherritt International Corporation X XShoppers Drug Mart Corporation X Silver Wheaton Corp. X Sino-Forest Corporation X SNC-Lavalin Group Inc. 70 Stantec Inc. X7 XSun Life Financial Inc. 70 XSuncor Energy Inc. NotSpecified Superior Plus Corp. X
12 years, but the board has discretion to waive this requirement.
2 Derived from Corporate Board Governance and Director Compensation in Canada: A Review of 2011, published by Korn/Ferry International in Partnership with Patrick O’Callaghan and Associates. Does not include those corporations that did not disclose their director retirement and/or term limit policies.
7 Although the board has not adopted a formal policy regarding the retirement age of directors, it believes that once a director reaches the age of 72 his or her continued service on the board should be reviewed by both the Corporate Governance and Compensation Committees and the board of directors as a whole.
* Board states that it can make exemptions to the retirement age policy.

18 | Corporate Board Governance and Director Compensation in Canada A Review of 2011 | Special Report
Appendix: Retirement and Term Limit Policies
Disclosed in Proxy Circular Data for Fiscal 20102 (Continued)
Company Retirement Term Limit No No Retirement Term Age Limit
Talisman Energy Inc. 70
Teck Resources Limited 75 TELUS Corporation X Thomson Reuters Corporation X XTim Hortons Inc. X Toromont Industries Ltd. 72 Toronto-Dominion Bank 70
Torstar Corporation 70 TransAlta Corporation 72 Transat A.T. Inc. X TransCanada Corporation 70 Transcontinental Inc. X Trican Well Service Ltd. 70 Vermilion Energy Inc. 70 XWajax Income Fund 70* West Fraser Timber Co. Ltd. 70* WestJet Airlines Ltd. X Yamana Gold Inc. 75 Yellow Media Inc. X
If director has not served ten year term, the board may make a one time decision to extend director’s service until the end of the ten years term or age 75, whichevercomesfirst.
15 years
7 years
2 Derived from Corporate Board Governance and Director Compensation in Canada: A Review of 2011, published by Korn/Ferry International in Partnership with Patrick O’Callaghan and Associates. Does not include those corporations that did not disclose their director retirement and/or term limit policies.
* Board states that it can make exemptions to the retirement age policy.
Ten years, board has discretion to recommend renewal. Chair is reviewed every three years with a possible extension of Chair’s position up to a further three years.

Corporate Board Governance and Director Compensation in Canada
A Review of 2011
Corporate Board Governance and Director Compensation in Canada A Review of 2011 | 19

20 | Corporate Board Governance and Director Compensation in Canada A Review of 2011
Board Independence

Corporate Board Governance and Director Compensation in Canada A Review of 2011 | 21
• Thiswasthesixthyearthatcompanieshavedisclosed their composition using the term “independent” under the disclosure requirements of the Canadian Securities Administrators (the “CSA”).
• In2010,94%of oursamplehadamajorityof independent directors compared to 93% for the previous four years. This percentage has stayed relatively stable at between 92% and 94% since boardsfirstbeganreportingindependencein2005.1
• Largerboardshavebeenthemostconsistently independentsince2005.Inthe$1Bto$5Bandover $5Bcategories,thepercentageof boardswitha majority of independent directors has remained between92%and96%,whilethe$500Mto$1B andunder$500Mcategorieshavefluctuatedbetween 84% and 97% with a majority of independent directors.
<500M 500M to 1B 1B to 5B >5B All
2010 95% 90% 96% 94% 94%
2009 92% 88% 95% 95% 93%
2005 84% 94% 95% 92% 92%
Percentage of Sample with a Majority of Independent Directors
Equities Income Trusts All
Majority Independent 2010 94% 97% 94%
2009 93% 97% 93%
Equal Independent/Non-Independent 2010 4% 0 3%
2009 3% 2% 2%
Minority Independent 2010 2% 3% 2%
2009 5% 2% 4%
Board Independence Levels, by Board Type
1 2011 Public Company Governance Survey, published by the National Association of Corporate Directors.
Key Findings
• Thelevelof independenceonCanadianboardshasbeenrelativelystablewithbetween92% and94%reportingamajorityof independentdirectorssinceboardsfirststartedreporting under the CSA guidelines six years ago
• In2010,54%of boardshadanindependentchairand32%hadaleaddirector,compared to29%of U.S.boardswithanindependentchairand65%withaleaddirector
• 15%of companiescombinedtheChair/CEOin2010,comparedtotheUnitedStates, where 70% of the largest 200 companies combined the Chair/CEO role

22 | Corporate Board Governance and Director Compensation in Canada A Review of 2011
• Bell Aliant Regional Communications Income Fund
• Canaccord Financial Inc.
• Canada Bread Company, Limited
• Craig Wireless Systems Ltd.
• Dollarama Inc.
• E-L Financial Corporation Limited
• European Goldfields Limited
• Genworth MI Canada Inc.
• High River Gold Mines Ltd.
• IGM Financial Inc.
• Kirkland Lake Gold Inc.
• Linamar Corporation
• Martinrea International Inc.
• Power Corporation of Canada
• Sears Canada Inc.
• Senvest Capital Inc.
• Velan Inc.
Boards Without a Majority of Independent Directors
Independent Director Meetings
• TheCSAguidelinesrecommendthattheindependentdirectorsholdregularlyscheduledmeetingsatwhich non-independent directors and members of management are not present. Ninety-six percent of boards reported they held meetings of only the independent directors.
• Eightypercentof boardsdisclosedthenumberof meetingsheldbytheindependentdirectors.Theaverage number of meetings per year has been seven for the past three years.
Equities Income Trusts All
Average 2010 7 8 7
2009 7 9 7
Median 2010 6 6 6
2009 7 7 7
Range 2010 0 to 35 3 to 16 0 to 35
2009 0 to 21 0 to 48 0 to 48
Number of Meetings of Only Independent Directors, by Board Type

Corporate Board Governance and Director Compensation in Canada A Review of 2011 | 23
Inside Directors
• Wedefineaninsidedirectorasadirectorwhoisan employee of the company on whose board that director sits.
• Theaveragenumberof insidedirectorsisone,asit has been for the past four years. In addition, the median is one, as it has been for the past eight years. The only asset category to average more than one insideriscompanieswithover$5billioninassets,which averages two inside directors.
• Equityboardscontinuetoaveragetwoinside directors while income trusts average one inside director. These numbers have not changed over the past six years.
• Twelvepercentof boardshadmorethantwoinsidedirectors in 2010. This is the same number as last year and compares to 11% in 2008 and 24% in 2001. Most of these are larger boards, with 75% of the boards with more than two directors coming from companieswithmorethan$1billioninassets.
• Fourpercentof companiesinoursamplethisyearhad no inside directors. Of these companies, 58% of them were income trusts.
• Boardswithasignificantlyhigherthanaverage number of inside directors were:
5 Insiders Power Financial Corporation (19)
4 Insiders Barrick Gold Corporation (14) Dorel Industries Inc. (10) E-L Financial Corporation Limited (10) Empire Company Limited (17) Kirkland Lake Gold Inc. (7) PacificRubialesEnergyCorp.(12) Power Corporation of Canada (19) Rogers Communications Inc. (18) Shaw Communications Inc. (16) Transcontinental Inc. (13)
( Numbers in brackets indicate total number of directors on the board.)
Independent Board Leadership
• TheCSAgovernanceguidelinesstatethatboardchairs should be independent directors, and where this is not appropriate, the board should appoint an independent lead director.
• Independentboardleadershippracticesdiffer betweenCanadianandU.S.boardswithmore Canadian boards using an independent chair and moreU.S.boardsusingleaddirectors:
* In 2010, 54% of boards had an independent chair, compared to 29%2intheUnitedStates.
* Thirty-two percent of boards had a lead director, compared with 65%3 in the UnitedStates.
• Thewayboardsestablishindependentleadership has remained relatively stable since reporting on independence began in 2005. During this period:
* Between 51% and 54% had an independent chair.
* Between 29% and 34% had a lead director.
• Fifteenpercentof boardshadnoindependent leadership, down from 16% last year and 20% six years ago.
• Fifteenpercentof boardshadnoindependent leadership in 2010. Of this group:
* 30% had a combined CEO/chair;
* 30% had an executive chair;
* 36% had an outside but non-independent chair; and
* 4% had no chair.
2 2011 Public Company Governance Survey, published by the National Association of Corporate Directors.3 2011 Public Company Governance Survey, published by the National Association of Corporate Directors.

24 | Corporate Board Governance and Director Compensation in Canada A Review of 2011
Equities Income Trusts All
Independent Chair 2010 52% 68% 54%
2009 48% 72% 52%
Lead Director 2010 33% 21% 32%
2009 37% 21% 32%
Neither 2010 15% 13% 15%
2009 18% 7% 16%
Independent Board Leadership, by Board Type
Board Chairs
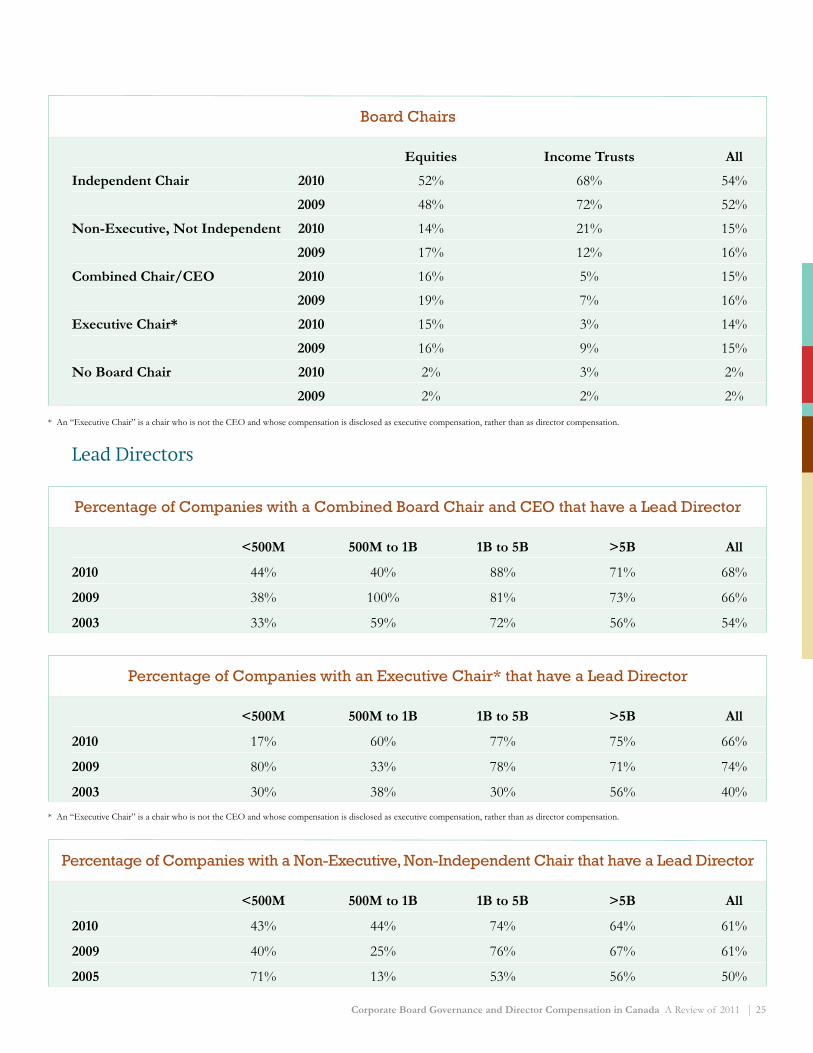
• Thepercentageof boardswithacombinedChair/CEOcontinuestoslowlydecline.In2010,15%combinedthetwo roles, which is the lowest number since we have tracked this information. In 2009, 16% combined the roles, and the decline has been evident since 52% of boards had a Chair/CEO in 1993.
• Of theboardsthatcombinetheCEOandchair,68%hadaleaddirectorcomparedto66%inthepreviousyear.
• IntheUnitedStates,70%4 of the largest 200 companies combined the Chair/CEO role, which is a decrease from 76% the previous year.
<500M 500M to 1B 1B to 5B >5B All
2010 76% 90% 87% 83% 85%
2009 67% 90% 87% 85% 84%
2001 57% 53% 68% 71% 62%
Percentage of Sample that have Separated the Board Chair and CEO
4 2010-2011 Director Compensation Report, published by the National Association of Corporate Directors
Corporate Board Governance and Director Compensation in Canada A Review of 2011 | 25
Equities Income Trusts All
Independent Chair 2010 52% 68% 54%
2009 48% 72% 52%
Non-Executive, Not Independent 2010 14% 21% 15%
2009 17% 12% 16%
Combined Chair/CEO 2010 16% 5% 15%
2009 19% 7% 16%
Executive Chair* 2010 15% 3% 14%
2009 16% 9% 15%
No Board Chair 2010 2% 3% 2%
2009 2% 2% 2%
Board Chairs
Lead Directors
<500M 500M to 1B 1B to 5B >5B All
2010 44% 40% 88% 71% 68%
2009 38% 100% 81% 73% 66%
2003 33% 59% 72% 56% 54%
Percentage of Companies with a Combined Board Chair and CEO that have a Lead Director
<500M 500M to 1B 1B to 5B >5B All
2010 17% 60% 77% 75% 66%
2009 80% 33% 78% 71% 74%
2003 30% 38% 30% 56% 40%
Percentage of Companies with an Executive Chair* that have a Lead Director
<500M 500M to 1B 1B to 5B >5B All
2010 43% 44% 74% 64% 61%
2009 40% 25% 76% 67% 61%
2005 71% 13% 53% 56% 50%
Percentage of Companies with a Non-Executive, Non-Independent Chair that have a Lead Director
* An “Executive Chair” is a chair who is not the CEO and whose compensation is disclosed as executive compensation, rather than as director compensation.
* An “Executive Chair” is a chair who is not the CEO and whose compensation is disclosed as executive compensation, rather than as director compensation.

Board Composition
26 | Corporate Board Governance and Director Compensation in Canada A Review of 2011
Corporate Board Governance and Director Compensation in Canada A Review of 2011 | 27
Director Biographies
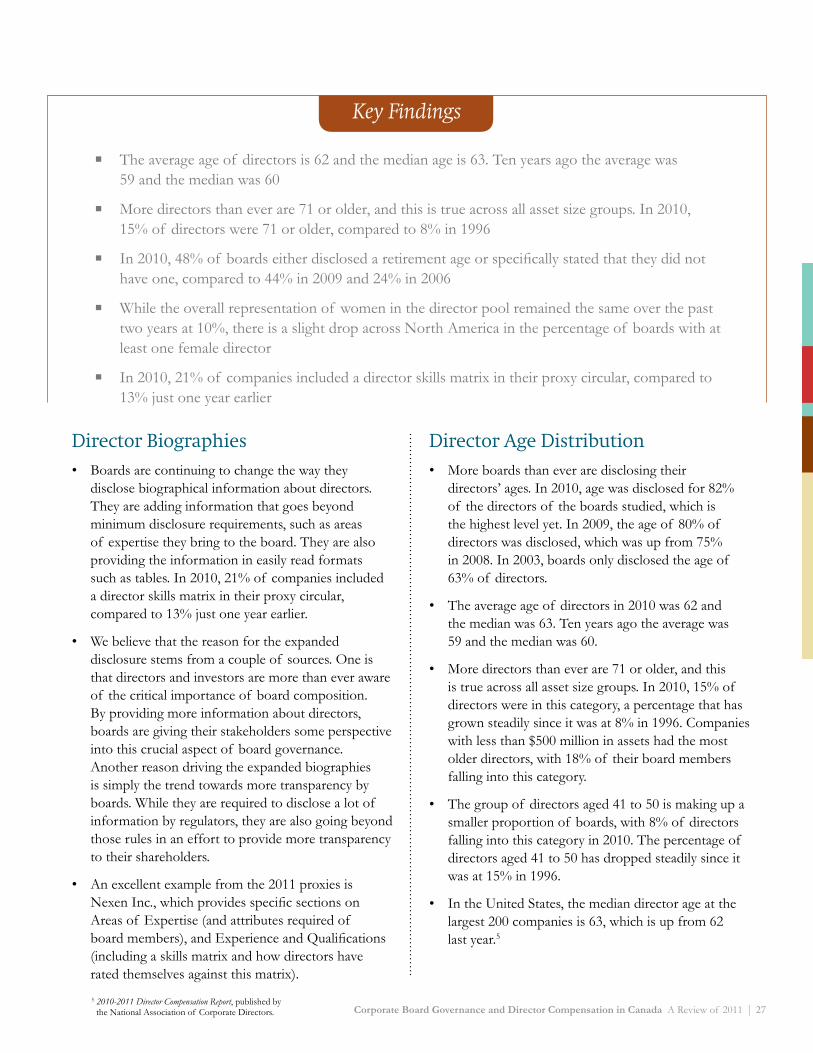
• Boardsarecontinuingtochangethewaythey disclose biographical information about directors. They are adding information that goes beyond minimum disclosure requirements, such as areas of expertise they bring to the board. They are also providing the information in easily read formats such as tables. In 2010, 21% of companies included a director skills matrix in their proxy circular, compared to 13% just one year earlier.
• Webelievethatthereasonfortheexpanded disclosure stems from a couple of sources. One is that directors and investors are more than ever aware of the critical importance of board composition. By providing more information about directors, boards are giving their stakeholders some perspective into this crucial aspect of board governance. Another reason driving the expanded biographies is simply the trend towards more transparency by boards. While they are required to disclose a lot of information by regulators, they are also going beyond those rules in an effort to provide more transparency to their shareholders.
• Anexcellentexamplefromthe2011proxiesis NexenInc.,whichprovidesspecificsectionson Areas of Expertise (and attributes required of boardmembers),andExperienceandQualifications(including a skills matrix and how directors have rated themselves against this matrix).
Director Age Distribution
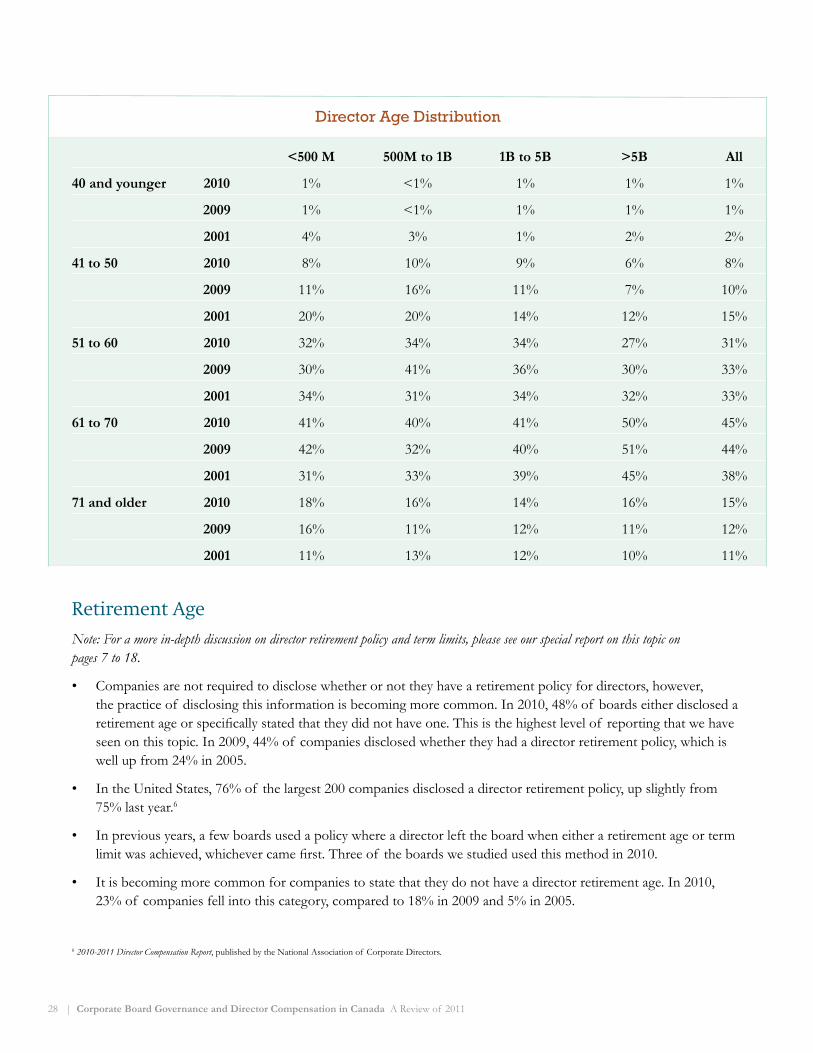
• Moreboardsthaneveraredisclosingtheir directors’ ages. In 2010, age was disclosed for 82% of the directors of the boards studied, which is the highest level yet. In 2009, the age of 80% of directors was disclosed, which was up from 75% in 2008. In 2003, boards only disclosed the age of 63% of directors.
• Theaverageageof directorsin2010was62and the median was 63. Ten years ago the average was 59 and the median was 60.
• Moredirectorsthaneverare71orolder,andthisis true across all asset size groups. In 2010, 15% of directors were in this category, a percentage that has grown steadily since it was at 8% in 1996. Companies withlessthan$500millioninassetshadthemostolder directors, with 18% of their board members falling into this category.
• Thegroupof directorsaged41to50ismakingupasmaller proportion of boards, with 8% of directors falling into this category in 2010. The percentage of directors aged 41 to 50 has dropped steadily since it was at 15% in 1996.
• IntheUnitedStates,themediandirectorageatthelargest 200 companies is 63, which is up from 62 last year.5
5 2010-2011 Director Compensation Report, published by the National Association of Corporate Directors.
Key Findings
• Theaverageageof directorsis62andthemedianageis63.Tenyearsagotheaveragewas 59 and the median was 60
• Moredirectorsthaneverare71orolder,andthisistrueacrossallassetsizegroups.In2010, 15% of directors were 71 or older, compared to 8% in 1996
• In2010,48%of boardseitherdisclosedaretirementageorspecificallystatedthattheydidnothave one, compared to 44% in 2009 and 24% in 2006
• Whiletheoverallrepresentationof womeninthedirectorpoolremainedthesameoverthepasttwo years at 10%, there is a slight drop across North America in the percentage of boards with at least one female director
• In2010,21%of companiesincludedadirectorskillsmatrixintheirproxycircular,comparedto13% just one year earlier
28 | Corporate Board Governance and Director Compensation in Canada A Review of 2011
<500 M 500M to 1B 1B to 5B >5B All
40 and younger 2010 1% <1% 1% 1% 1%
2009 1% <1% 1% 1% 1%
2001 4% 3% 1% 2% 2%
41 to 50 2010 8% 10% 9% 6% 8%
2009 11% 16% 11% 7% 10%
2001 20% 20% 14% 12% 15%
51 to 60 2010 32% 34% 34% 27% 31%
2009 30% 41% 36% 30% 33%
2001 34% 31% 34% 32% 33%
61 to 70 2010 41% 40% 41% 50% 45%
2009 42% 32% 40% 51% 44%
2001 31% 33% 39% 45% 38%
71 and older 2010 18% 16% 14% 16% 15%
2009 16% 11% 12% 11% 12%
2001 11% 13% 12% 10% 11%
Director Age Distribution
Retirement Age
Note: For a more in-depth discussion on director retirement policy and term limits, please see our special report on this topic on pages 7 to 18.
• Companiesarenotrequiredtodisclosewhetherornottheyhavearetirementpolicyfordirectors,however, the practice of disclosing this information is becoming more common. In 2010, 48% of boards either disclosed a retirementageorspecificallystatedthattheydidnothaveone.Thisisthehighestlevelof reportingthatwehaveseen on this topic. In 2009, 44% of companies disclosed whether they had a director retirement policy, which is well up from 24% in 2005.
• IntheUnitedStates,76%of thelargest200companiesdisclosedadirectorretirementpolicy,upslightlyfrom75% last year.6
• Inpreviousyears,afewboardsusedapolicywhereadirectorlefttheboardwheneitheraretirementageortermlimitwasachieved,whichevercamefirst.Threeof theboardswestudiedusedthismethodin2010.
• Itisbecomingmorecommonforcompaniestostatethattheydonothaveadirectorretirementage.In2010,23% of companies fell into this category, compared to 18% in 2009 and 5% in 2005.
6 2010-2011 Director Compensation Report, published by the National Association of Corporate Directors.

Corporate Board Governance and Director Compensation in Canada A Review of 2011 | 29
Gender
• Forthelasttwoyears,womenhavecomprised10%of thedirectorsof theboardswestudied.Inthe17years we have tracked this information, 10% is the highest level reached. Prior to 2008, the percentage varied between 6% and 9%.
• Whiletheoverallrepresentationof womeninthedirectorpoolremainedthesameoverthepasttwoyears,thereis a slight drop across North America in the percentage of boards with at least one female director. In Canada, 52%of boardshadatleastonefemaledirector,adecreaseof 1%fromlastyear.IntheUnitedStates,67%of boards have at least one female director, which is a drop from 69% the previous year.7
• Fifty-threepercentof equityboardshadatleastonefemaledirector,comparedto55%in2009and54%in2008.
• Thepercentageof womensittingonincometrustboardscontinuedtoincreasethisyear.Forty-sevenpercent of income trust boards had at least one female director in 2010, compared to 45% in 2009 and 42% in 2008.
• Tenpercentof boardshadthreeormorefemaledirectors,aslightdecreasefrom11%oneyearearlier. IntheUnitedStates,thiscategoryhasimproved,with12%of boardsreportingthreeormorefemale directors compared to 10% the previous year.8
7 2011 Public Company Governance Survey, published by the National Association of Corporate Directors.8 2011 Public Company Governance Survey, published by the National Association of Corporate Directors.
2010 2009 2005
Retirement from the board at age 65 <1% 0 0
Retirement from the board at age 70 12% 14% 9%
Retirement from the board at age 71 <1% 1% <1%
Retirement from the board at age 72 6% 5% 3%
Retirement from the board at age 73 1% 0 0
Retirement from the board at age 75 4% 5% 3%
Formal policy, age not specified <1% <1% 1%
Specify there is no director retirement age 23% 18% 5%
Combined retirement age/term limit 1% 0 3%
No disclosure 52% 56% 76%
Director Retirement Ages

30 | Corporate Board Governance and Director Compensation in Canada A Review of 2011
<500M 500M to 1B 1B to 5B >5B All
2010 22% 34% 51% 80% 52%
2009 32% 31% 48% 86% 53%
2001 18% 32% 60% 80% 44%
Boards with at Least One Female Director
2010 2009 2001
Consumer Discretionary 82% 85% 64%
Consumer Staple 92% 87% 65%
Energy 34% 43% 29%
Financials 60% 57% 55%
Health Care 100% 63% 33%
Industrials 42% 42% 38%
Information Technology 57% 40% 23%
Materials 32% 33% 33%
Telecommunication Services 80% 100% 82%
Utilities 100% 89% 100%
All 52% 53% 44%
Boards with at Least One Female Director, by Industry
2010 2009 2003
Board Chair 2% 2% 1%
Lead Director 2% 2% 2%
Audit Committee Chair 7% 6% 6%
Compensation Committee Chair 6% 7% 4%
Governance Committee Chair 8% 10% 6%
Percentage of Key Board Leadership Roles Held by Female Directors*
* Percentage of individuals in the role for whom we know gender.

Corporate Board Governance and Director Compensation in Canada A Review of 2011 | 31
Number of Female Directors Percentage of Boards
2010 2009 2001
1 28% 28% 27%
2 15% 14% 12%
3 6% 8% 3%
4 2% 2% 2%
5 2% 1% 1%
6 0 <1% 0
Female Directors
Number of Female Directors Percentage of Boards
Equities Income Trusts All
1 2010 26% 39% 28%
2009 26% 38% 28%
2 2010 16% 8% 15%
2009 16% 5% 14%
3 2010 7% 0 6%
2009 9% 2% 8%
4 2010 2% 0 2%
2009 3% 0 2%
5 2010 2% 0 2%
2009 1% 0 1%
6 2010 0 0 0
2009 <1% 0 <1%
Female Directors on Equity and Income Trust Boards
32 | Corporate Board Governance and Director Compensation in Canada A Review of 2011
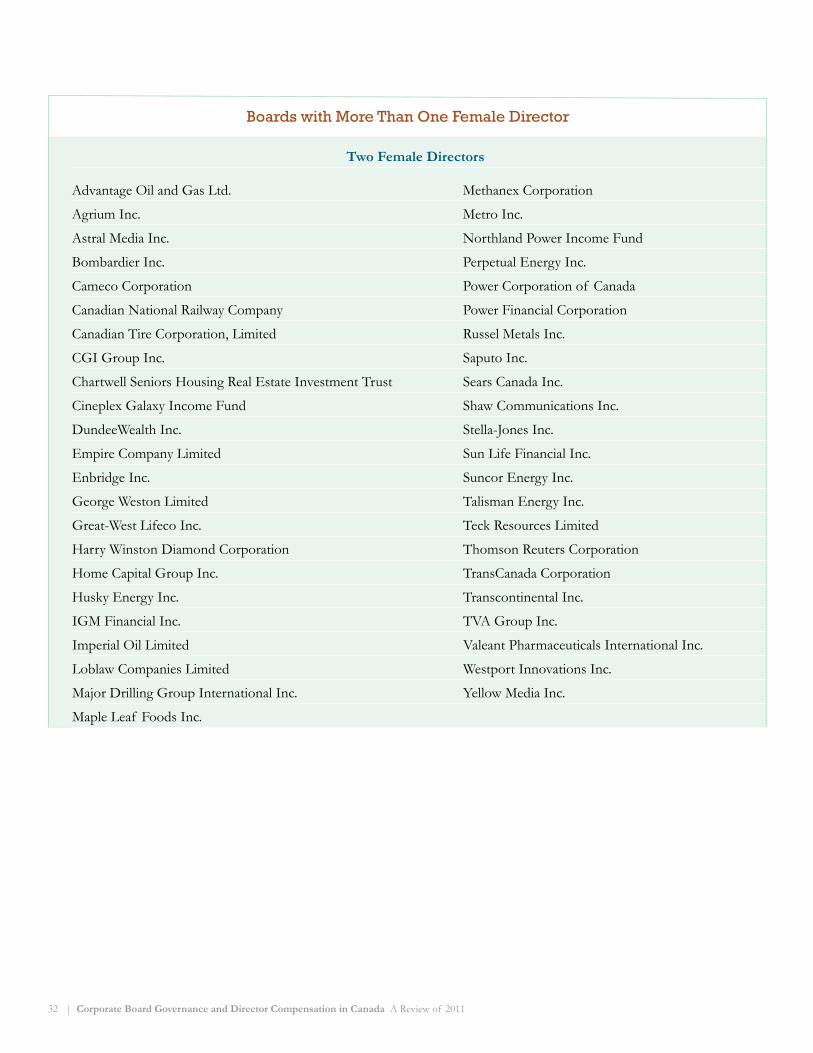
Boards with More Than One Female Director
Two Female Directors
Advantage Oil and Gas Ltd. Methanex Corporation
Agrium Inc. Metro Inc.
Astral Media Inc. Northland Power Income Fund
Bombardier Inc. Perpetual Energy Inc.
Cameco Corporation Power Corporation of Canada
Canadian National Railway Company Power Financial Corporation
Canadian Tire Corporation, Limited Russel Metals Inc.
CGI Group Inc. Saputo Inc.
Chartwell Seniors Housing Real Estate Investment Trust Sears Canada Inc.
Cineplex Galaxy Income Fund Shaw Communications Inc.
DundeeWealth Inc. Stella-Jones Inc.
Empire Company Limited Sun Life Financial Inc.
Enbridge Inc. Suncor Energy Inc.
George Weston Limited Talisman Energy Inc.
Great-West Lifeco Inc. Teck Resources Limited
Harry Winston Diamond Corporation Thomson Reuters Corporation
Home Capital Group Inc. TransCanada Corporation
Husky Energy Inc. Transcontinental Inc.
IGM Financial Inc. TVA Group Inc.
Imperial Oil Limited Valeant Pharmaceuticals International Inc.
Loblaw Companies Limited Westport Innovations Inc.
Major Drilling Group International Inc. Yellow Media Inc.
Maple Leaf Foods Inc.

Corporate Board Governance and Director Compensation in Canada A Review of 2011 | 33
Boards with More Than One Female Director
Three Female Directors
Bank of Nova Scotia Manulife Financial Corporation
BCE Inc. Open Text Corporation
CanadianPacificRailwayLimited PotashCorporationof SaskatchewanInc.
CanadianUtilitiesLimited RoyalBankof Canada
EnCana Corporation ShawCor Ltd.
Indigo Books & Music Inc. SNC-Lavalin Group Inc.
Industrial Alliance Insurance and Financial Services Inc. Tim Hortons Inc.
Intact Financial Corporation TMX Group Inc.
Manitoba Telecom Services Inc. TransAlta Corporation
Four Female Directors
Bank of Montreal Rogers Communications Inc.
Canadian Imperial Bank of Commerce Shoppers Drug Mart Corporation
Emera Inc. Torstar Corporation
Five Female Directors
Corus Entertainment Inc. National Bank of Canada
Jean Coutu Group (PJC) Inc. Toronto-Dominion Bank
Laurentian Bank of Canada

Board Size
34 | Corporate Board Governance and Director Compensation in Canada A Review of 2011

Corporate Board Governance and Director Compensation in Canada A Review of 2011 | 35
9 2011 Public Company Governance Survey, published by the National Association of Corporate Directors.
• Theaverageandmedianboardsizehavebothbeenatninesince2005.
• Therehasbeenlittlechangeinaverageboardsizeacrossallassetcategoriesoverthepastfewyears. Ineachcategory,theaveragehasremainedthesameorfluctuatedbyasingledigitsince2003.
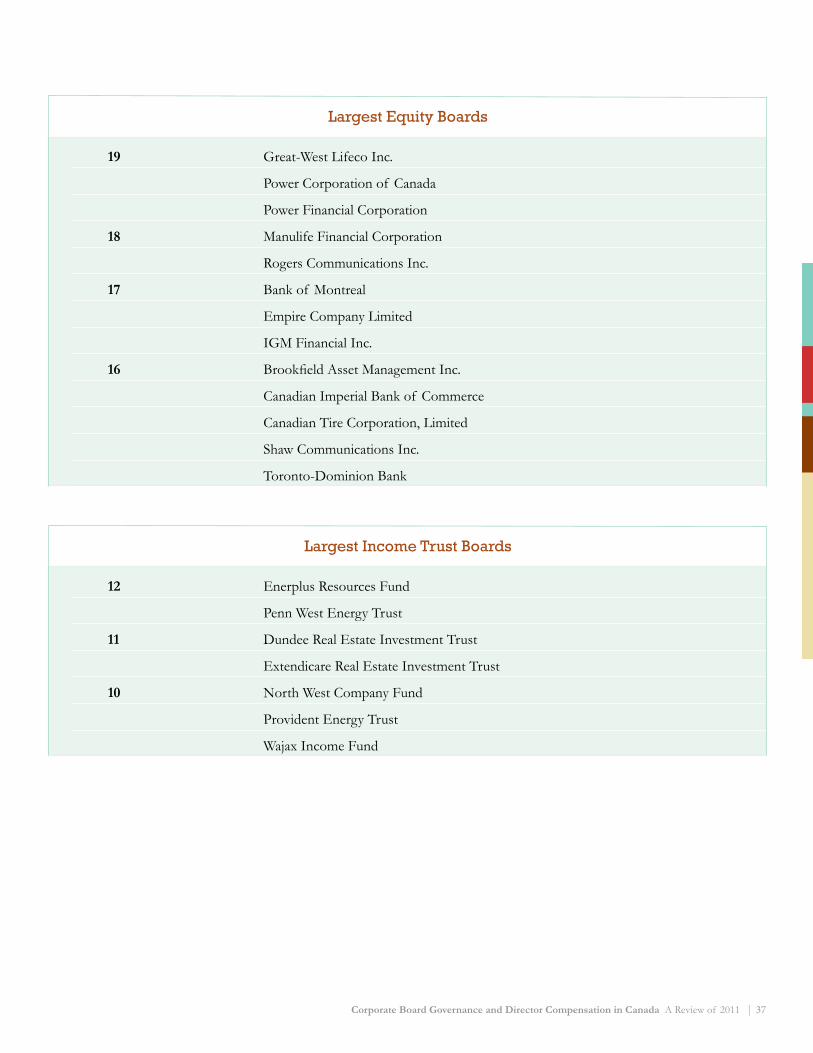
• Forthesecondyearinarow,thelargestboardsnumbered19directors.Priorto2009,thelargestboards in the study had more than 20 members in every year since we began tracking this data in 1993.
• IntheUnitedStates,theaveragenumberof directorsonaboardisninemembers,whichisanincrease from eight members the previous year, but a return to the same average of nine members two years previous.9
Equities Income Trusts All
Average 10 8 9
Median 9 8 9
Range 3 to 19 4 to 12 3 to 19
Number of Directors on a Board, by Board Type
<500M 500M to 1B 1B to 5B >5B All
2010 7 8 9 12 9
2009 7 8 9 12 9
2001 8 9 11 14 10
Average Number of Board Members
Key Findings
• Canadianboardshaveaveragedninemembersforsixyears,afteraveragingtenmembersfor the eight years prior
• Forthesecondyearinarow,thelargestboardsnumbered19directors.Priorto2009, the largest boards in the study had more than 20 members in every year since we began tracking this data in 1993

36 | Corporate Board Governance and Director Compensation in Canada A Review of 2011
Board Size Equities Income Trusts All
5 or less 5% 10% 6%
6 to 9 53% 71% 56%
10 to 12 24% 18% 24%
13 to 15 12% 0 10%
16 to 19 5% 0 4%
Percentage of Boards in Board Size Categories, by Board Type
Board Size <500M 500M to 1B 1B to 5B >5B All
5 or less 25% 10% 2% 0 6%
6 to 9 70% 72% 65% 25% 56%
10 to 12 5% 18% 24% 36% 24%
13 to 15 0 0 9% 24% 10%
16 to 19 0 0 0 15% 4%
Percentage of Boards in Board Size Categories
Corporate Board Governance and Director Compensation in Canada A Review of 2011 | 37
19 Great-West Lifeco Inc.
Power Corporation of Canada
Power Financial Corporation
18 Manulife Financial Corporation
Rogers Communications Inc.
17 Bank of Montreal
Empire Company Limited
IGM Financial Inc.
16 BrookfieldAssetManagementInc.
Canadian Imperial Bank of Commerce
Canadian Tire Corporation, Limited
Shaw Communications Inc.
Toronto-Dominion Bank
Largest Equity Boards
12 Enerplus Resources Fund
Penn West Energy Trust
11 Dundee Real Estate Investment Trust
Extendicare Real Estate Investment Trust
10 North West Company Fund
Provident Energy Trust
Wajax Income Fund
Largest Income Trust Boards

Board Assessments, Director Selection and Director Development
38 | Corporate Board Governance and Director Compensation in Canada A Review of 2011

Corporate Board Governance and Director Compensation in Canada A Review of 2011 | 39
2010 2009 2001
Board Assessment 91% 90% 72%
Committee Assessment 83% 82% 59%
Individual Director Assessment 84% 84% 61%
Percentage of Boards with Assessment Process
10 2011 Public Company Governance Survey, published by the National Association of Corporate Directors.11 2011 Public Company Governance Survey, published by the National Association of Corporate Directors.12 2011 Public Company Governance Survey, published by the National Association of Corporate Directors.
Board Assessment
• In2010,91%of companieshadaboardassessmentprocess, up slightly from 90% in 2009. In 2001, only 71% of companies assessed the board’s performance.
• IntheUnitedStates,91%of companiesconduct full board assessments, which is a slight increase from 90% last year.10
Committee Assessment
• In2010,83%of companieshadacommittee assessment process, up slightly from 82% in 2009. In 2001, only 59% of companies assessed committee performance.
• IntheUnitedStates,83%of boardsconduct committee assessments, up from 81% last year.11
• Moreboardsaredisclosingthefactthattheyassesscommittee chairs. In 2010, 22% of boards with a committee assessment process in place stated that it included an assessment of each committee chair, up from 19%, 14% and 11% respectively in the previous three years.
Individual Director Assessment
• Forthepastthreeyears,84%of companieshad an individual director assessment process. In 2001, only 61% assessed individual directors.
• IntheUnitedStates,45%of boardsconduct individual director assessments, down from 49% last year.12
Key Findings
• 91%of companieshadaboardassessmentprocess
• 83%of companieshadacommitteeassessmentprocess
• 84%of companieshadanindividualdirectorassessmentprocess
• Overthepastfewyearsthereisacorrespondingincreaseinboardsusingbothquestionnaires and individual meetings and a decrease in those using only a questionnaire
40 | Corporate Board Governance and Director Compensation in Canada A Review of 2011
Board Chair and Lead Director Assessment
• Companiesarenotrequiredtodisclosewhetherornottheyassesstheperformanceof theirboardchairsorleaddirectors, yet more and more are providing this information:
* In 2010, 36% of boards with a non-executive chair reported a chair assessment, compared with 34%, 29% and 28% respectively in the previous three years. Large companies are more likely to disclose thisinformation.Fifty-threepercentof boardswithnon-executivechairswithmorethan$5billioninassets statedthattheyassessedtheirchairs,comparedwith27%withlessthan$500million,23%with$500million to$1billionand33%with$1billionto$5billion.
* In 2010, 7% of boards with lead directors reported they assessed the lead director’s performance, compared with 4%, 8% and 8% respectively in the previous three years.
Assessment Methodology
• Moreboardsarereportinghowtheyconducttheirassessments:
* Of those companies that conducted a board assessment, 86% of them described the process used in 2010, compared with 81%, 79% and 77% respectively in the previous three years.
* Of those companies that conducted committee assessments, 87% of them described the process used in 2010, compared with 81%, 80% and 75% respectively in the previous three years.
* Of those companies that conducted individual director assessments, 87% described the process used in 2010, compared with 81%, 80% and 78% respectively in the previous three years.
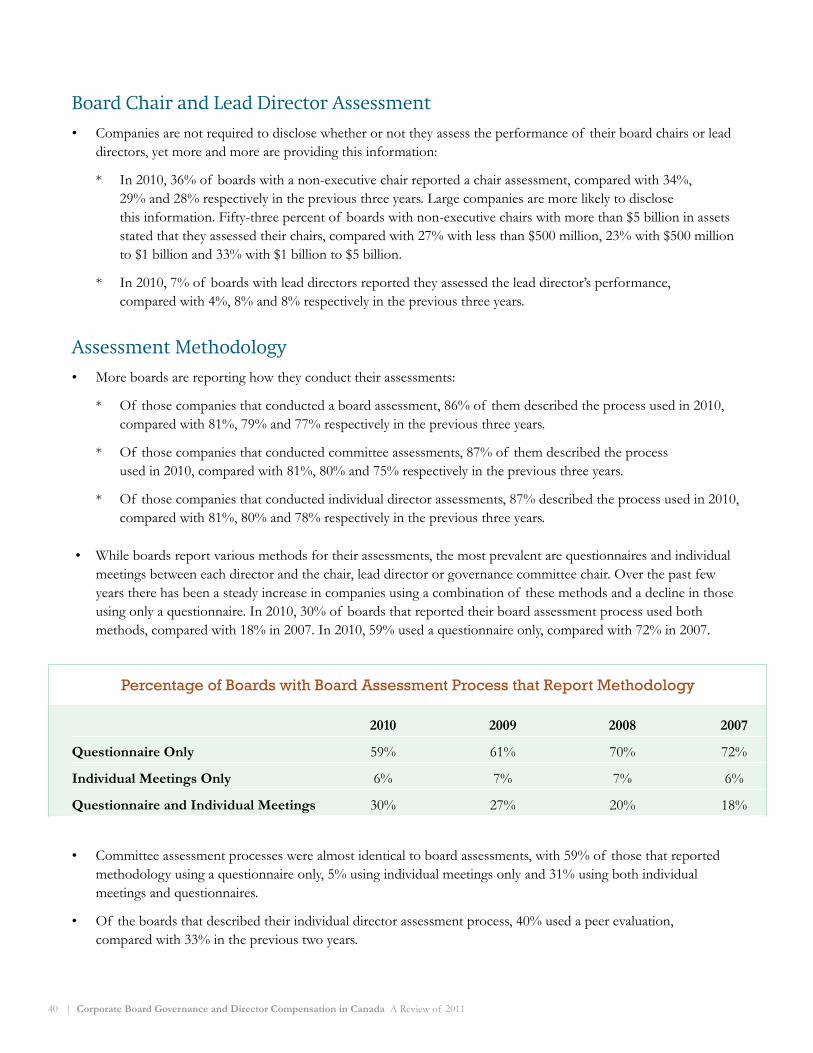
• Whileboardsreportvariousmethodsfortheirassessments,themostprevalentarequestionnairesandindividualmeetings between each director and the chair, lead director or governance committee chair. Over the past few years there has been a steady increase in companies using a combination of these methods and a decline in those using only a questionnaire. In 2010, 30% of boards that reported their board assessment process used both methods, compared with 18% in 2007. In 2010, 59% used a questionnaire only, compared with 72% in 2007.
• Committeeassessmentprocesseswerealmostidenticaltoboardassessments,with59%of thosethatreportedmethodology using a questionnaire only, 5% using individual meetings only and 31% using both individual meetings and questionnaires.
• Of theboardsthatdescribedtheirindividualdirectorassessmentprocess,40%usedapeerevaluation, compared with 33% in the previous two years.
2010 2009 2008 2007
Questionnaire Only 59% 61% 70% 72%
Individual Meetings Only 6% 7% 7% 6%
Questionnaire and Individual Meetings 30% 27% 20% 18%
Percentage of Boards with Board Assessment Process that Report Methodology

Corporate Board Governance and Director Compensation in Canada A Review of 2011 | 41
Director Selection
• UndertheCanadianSecuritiesAdministratorsgovernancedisclosurerequirements,issuersmustdescribetheirnomination process. We are continuing to see the disclosure of skills matrices in proxies and/or companies outlining their directors’ areas of expertise within the director biographies.
• In2010,32%of boardsidentifiedtheuseof amatrixintheirdirectorselectionprocess,comparedto 23% last year. Twenty-one percent included the matrix in their proxy circular, compared to 13% in 2009.
• Boardsatlargercompaniesweremorelikelytodisclosetheirdirectorskillsmatrixintheirproxies. Thirty-twopercentof thosewithover$5billioninassetsprovidedthesematrices,comparedwith25%of thosewith$1to$5billion,8%of thosewith$500millionto$1billionandnonewithlessthan$500million.
Director Development
• TheCanadianSecuritiesAdministratorsgovernancedisclosurerulesrequireissuerstodescribewhatmeasures, if any, a board takes to provide orientation and continuing education for its directors.
• Forthepastthreeyears,98%to99%of companiesprovidedsomedetailontheirorientationpractices, and 94% to 98% provided some detail on their continuing education practices.
• Detailsandspecificitemsvarygreatlyfromcompanytocompany.Oneverydescriptiveexampleisthatof Agrium Inc.:
Continuing education is provided through a number of methods, including visits to our sites and facilities (which all of our directors are encouraged to attend to familiarize themselves with our business and to become acquainted with senior plant personnel and high potential employees), an annual comprehensive dedicated off-site strategy session, presentations from management, employees and outside experts to the Board and its Committees on topics of interest and developing issues within their respective responsibilities, and ongoing distribution of relevant information. The CG&N Committee, in consultation with the CEO and the Board Chair, also develops and maintains an evergreen list of continuing education topics which is periodically discussed with the Board members. This list includes topics of interest relating to the Corporation’s businesses, operations and strategy, regulatory developments, compliance initiatives, as well as international geopolitical and economic reviews.
(Two directors) have completed the Directors’ Education Program developed by the Institute of Corporate Directors (ICD) and the Joseph L. Rotman School of Management, University of Toronto.
In 2010, educational sessions offered to Board members included a presentation on International Financial Reporting Standards by our external auditors, economic presentations specific to agribusiness presented by investment professionals, political and economic updates on international agribusiness markets, a site visit to certain Agrium facilities, and numerous internal presentations and updates on a broad range of topics relating to our industry, businesses, operations and practices, including enterprise risk management, financial reporting and public disclosure developments, recent developments and emerging trends in corporate governance, environmental governance, major project governance and best practices, executive compensation practices, and information technology.
In 2011, the Board also adopted formal external continuing education guidelines for our directors pursuant to which the Board explicitly encourages, and the Corporation provides funding for, the directors to attend external forums, conferences and education programs in order to maintain and update their knowledge of our industry, its regulatory environment, and other topical areas of interest to enhance their continuing development as directors and stewards of the Corporation. 13
13 Agrium Inc. Notice of Annual General Meeting of Shareholders and Management Proxy Circular, March 22, 2011.

Meetings and Attendance
42 | Corporate Board Governance and Director Compensation in Canada A Review of 2011

Corporate Board Governance and Director Compensation in Canada A Review of 2011 | 43
Equities Income Trusts All
Board Meetings
Average Board Meeting Attendance Rate 96% 97% 96%
Percentage of Directors with 100% Attendance Rate at Board Meetings 78% 76% 78%
Percentage of Directors with 75% to 99% Attendance Rate at Board Meetings 20% 23% 20%
Committee Meetings
Average Committee Meeting Attendance Rate 97% 98% 97%
Percentage of Directors with 100% Attendance Rate at Committee Meetings 86% 88% 87%
Percentage of Directors with 75% to 99% Attendance Rate at Committee Meetings 10% 10% 10%
Board and Committee Meeting Attendance
Key Findings
• Theoverallboardmeetingattendancerateis96%,with78%of directorshavingaperfect attendance record
• Attendanceisevenbetteratcommitteemeetingswheretheaverageattendanceis97% and 87% of members have perfect attendance
• Theaveragenumberof boardmeetingshasstayedrelativelyconstant,ateithernineor ten per year since 1997
Attendance Records
• Ninety-eightpercentof companiesprovidedboardmeeting attendance records for each director.
• Whilecommitteemeetingattendanceisnot mandatory disclosure, many boards provide this information. However, fewer boards are reporting committee meeting attendance in recent years. In 2010 and 2009, 84% of the boards studied disclosed committee meeting attendance for some or all board committees. This is down from 89% to 90% in the three previous years.
• Overall,Canadiandirectorsmaintainaverygoodattendance rate at board meetings, with 78% attending 100% of board meetings and an overall meeting attendance rate of 96%.
• Committeemeetingsareevenbetterattended,with87% of directors attending 100% of committee meetings and an overall committee meeting attendance rate of 97%.

44 | Corporate Board Governance and Director Compensation in Canada A Review of 2011
Board Meetings
• Ninety-eightpercentof theboardsreportedthenumberof boardmeetingsheld.
• Theaveragenumberof boardmeetingsheldin2010wasnineandthemedianwaseight.Forthepreviousfouryears, the average number of board meetings was ten and the median was nine.
• IntheUnitedStates,boardsmetanaverageof sixtimesinpersonin2010,inadditiontoanaverageof threetelephone meetings.14
• Equityboardsheldanaverageof ninemeetingsin2010andthemediannumberof boardmeetingsheldwaseight. Income trust boards held an average of ten meetings in 2010 and the median number of board meetings held was nine.
• Twenty-fivepercentof equityboardsheldelevenormoreboardmeetingsin2010,comparedto33%in2009.Forty percent of income trust boards held eleven or more board meetings in 2010, compared to 38% in 2009.
14 2011 Public Company Governance Survey, published by the National Association of Corporate Directors.
Average Median Range Companies Reporting
2010 9 8 2 to 35 98%
2009 10 9 2 to 48 99%
2001 9 8 2 to 24 42%
Board Meetings Held
Equities Income Trusts All
Average 9 10 9
Median 8 9 8
Range 2 to 35 4 to 22 2 to 35
Board Meetings Held, by Board Type

Corporate Board Governance and Director Compensation in Canada A Review of 2011 | 45
Committee Meetings
• Wecontinuetoseeanincreaseinboardsreportingthenumberof meetingsheldbytheircompensationand governance committees.
• Auditcommitteesaveragedsixmeetingsin2010,comparedtoanaverageof fivemeetingsforcompensationcommittees and four meetings for governance committees.
Number of Meetings Equities Income Trusts All
3 or fewer <1% 0 <1%
4 to 6 24% 27% 24%
7 to 10 51% 32% 49%
11 to 15 19% 32% 20%
16 to 20 5% 5% 5%
21 or more 1% 3% 1%
Board Meeting Frequency Distribution*, by Board Type
Number of Meetings <500M 500M to 1B 1B to 5B >5B All
3 or fewer 0 0 1% 0 <1%
4 to 6 44% 37% 22% 12% 24%
7 to 10 38% 43% 51% 54% 49%
11 to 15 15% 14% 19% 28% 20%
16 to 20 2% 4% 6% 4% 5%
21 or more 0 2% 1% 2% 1%
Board Meeting Frequency Distribution*
* Percentages are based only on those boards that disclosed meeting frequency.
* Percentages are based only on those boards that disclosed meeting frequency.

46 | Corporate Board Governance and Director Compensation in Canada A Review of 2011
Average Median Range Boards Reporting*
Audit Committee
2010 6 5 0 to 25 89%
2009 6 5 1 to 18 88%
2003 6 5 1 to 12 66%
Compensation/HR Committee
2010 5 4 1 to 17 90%
2009 5 4 0 to 22 89%
2003 4 4 1 to 16 65%
Governance Committee
2010 4 4 0 to 19 91%
2009 4 4 0 to 13 89%
2003 4 3 0 to 16 67%
Committee Meetings Held by Major Committees
Average Median Range Boards Reporting*
Audit Committee
Equities 6 5 0 to 25 90%
Income Trusts 5 5 4 to 8 87%
All 6 5 0 to 25 89%
Compensation/HR Committee
Equities 5 4 1 to 17 90%
Income Trusts 4 4 1 to 10 88%
All 5 4 1 to 17 90%
Governance Committee
Equities 4 4 0 to 14 91%
Income Trusts 4 4 1 to 19 88%
All 4 4 0 to 19 91%
Committee Meetings Held by Major Committees, by Board Type
* Percent of boards with the named committee type.
* Percent of boards with the named committee type.

Corporate Board Governance and Director Compensation in Canada A Review of 2011 | 47

Board Committees
48 | Corporate Board Governance and Director Compensation in Canada A Review of 2011

Corporate Board Governance and Director Compensation in Canada A Review of 2011 | 49
Key Findings
• Forthepastsixyears,boardshaveaveragedfourcommitteeseach
• In2010,90%of companieswithlessthan$500millioninassetshadagovernancecommittee,compared to 80% one year earlier
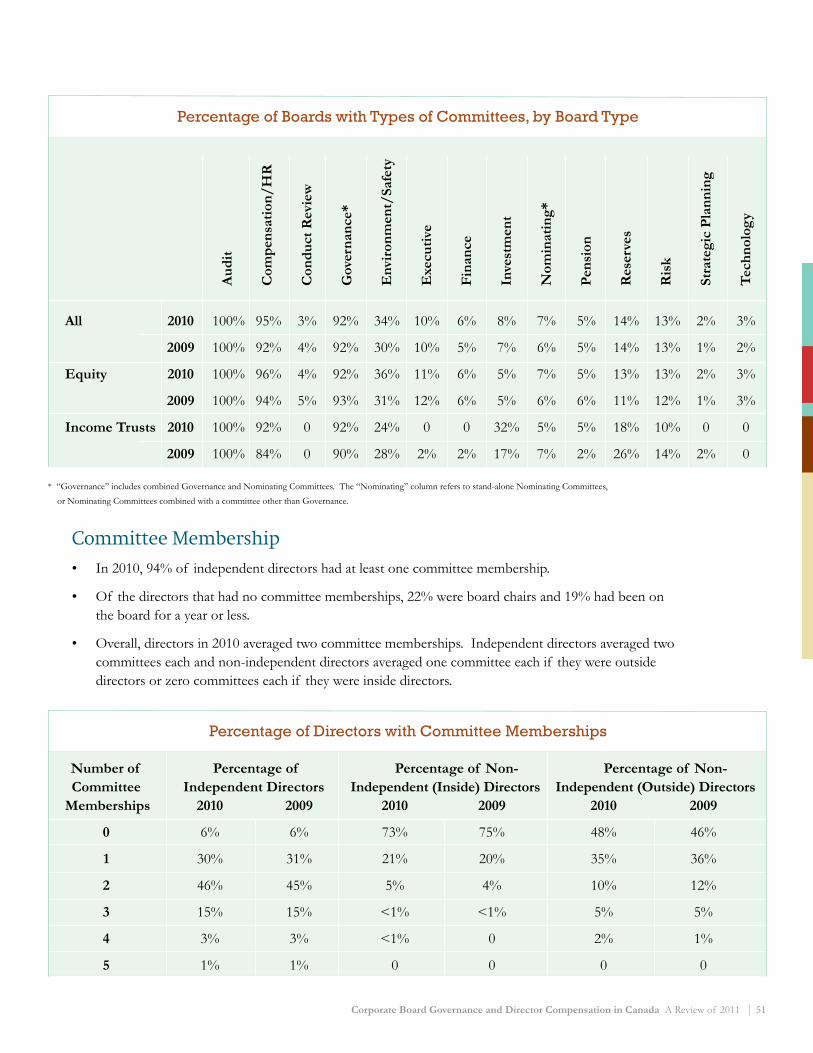
• In2010,94%of independentdirectorshadatleastonecommitteemembership
• Directorsin2010averagedtwocommitteememberships
15 2010-2011 Director Compensation Report, published by the National Association of Corporate Directors.16 2010-2011 Director Compensation Report, published by the National Association of Corporate Directors.17 2010-2011 Director Compensation Report, published by the National Association of Corporate Directors.
Equities Income Trusts All
Average 4 3 4
Median 4 3 4
Range 1 to 7 1 to 6 1 to 7
Number of Board Committees, by Board Type
Board Committees
• Forthesixthyearinarow,boardshaveaveragedfour committees each.
• Since2005,theaverageandmediannumberof committees for equity boards has been at four, while for income trust boards it has been at three.
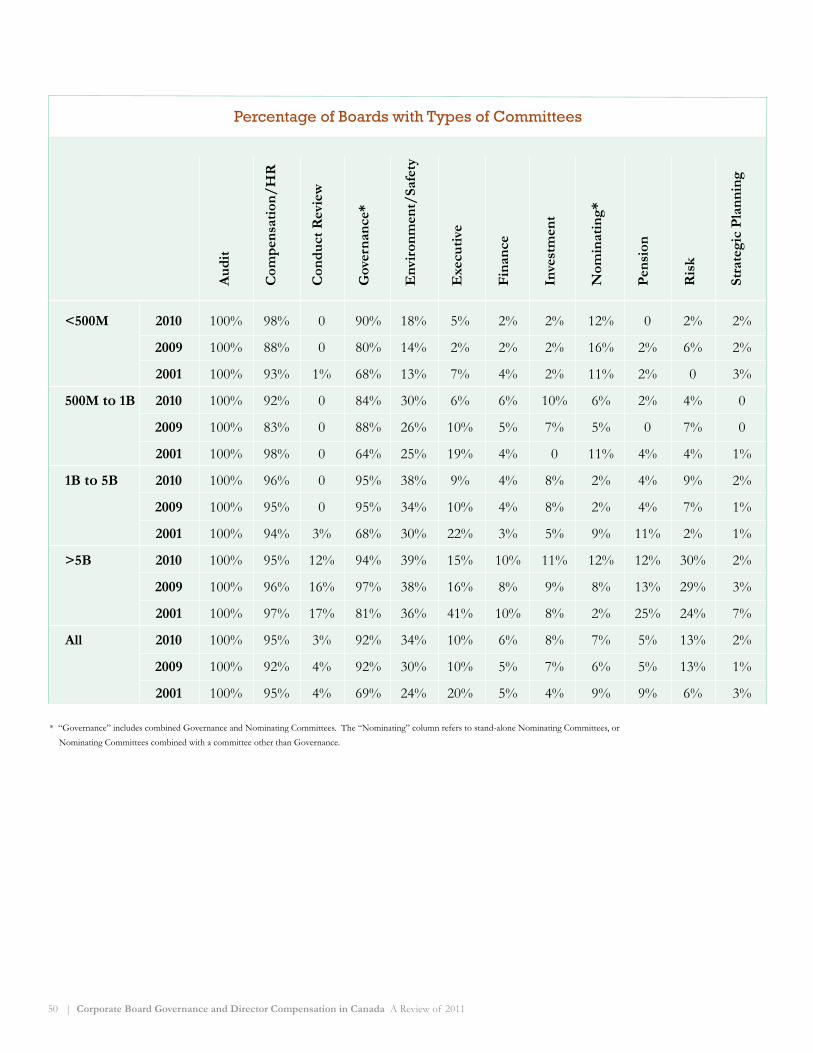
• Whiletheoverallincidenceof boardswith governance committees has remained at 92% for the past three years, there has been a noticeable increase at the smallest companies. In 2010, 90% of companieswithlessthan$500millioninassetshad a governance committee, compared with 80% in2009and78%in2008.IntheUnitedStates,97% of the largest 200 companies have a nominating/governance committee.15
• In2010,34%of boardshadanenvironment/safetycommittee, an increase from 30% over 2009. This category is at the highest level that we have seen it since 2008 and has shown a steady increase from 21%in1993.IntheUnitedStates,4%of thelargest200 companies have an environment health/safety committee. 16
• Executivecommitteeshavebeenregainingsomepopularity. In 1993, the earliest year for which we have data, 43% of boards had an executive committee. This dropped to 8% by 2008, and is upto10%forthelasttwoyears.IntheUnitedStates, 47% of the boards at the largest 200 companies have an executive committee. 17
50 | Corporate Board Governance and Director Compensation in Canada A Review of 2011
* “Governance” includes combined Governance and Nominating Committees. The “Nominating” column refers to stand-alone Nominating Committees, or
Nominating Committees combined with a committee other than Governance.
<500M 2010 100% 98% 0 90% 18% 5% 2% 2% 12% 0 2% 2%
2009 100% 88% 0 80% 14% 2% 2% 2% 16% 2% 6% 2%
2001 100% 93% 1% 68% 13% 7% 4% 2% 11% 2% 0 3%
500M to 1B 2010 100% 92% 0 84% 30% 6% 6% 10% 6% 2% 4% 0
2009 100% 83% 0 88% 26% 10% 5% 7% 5% 0 7% 0
2001 100% 98% 0 64% 25% 19% 4% 0 11% 4% 4% 1%
1B to 5B 2010 100% 96% 0 95% 38% 9% 4% 8% 2% 4% 9% 2%
2009 100% 95% 0 95% 34% 10% 4% 8% 2% 4% 7% 1%
2001 100% 94% 3% 68% 30% 22% 3% 5% 9% 11% 2% 1%
>5B 2010 100% 95% 12% 94% 39% 15% 10% 11% 12% 12% 30% 2%
2009 100% 96% 16% 97% 38% 16% 8% 9% 8% 13% 29% 3%
2001 100% 97% 17% 81% 36% 41% 10% 8% 2% 25% 24% 7%
All 2010 100% 95% 3% 92% 34% 10% 6% 8% 7% 5% 13% 2%
2009 100% 92% 4% 92% 30% 10% 5% 7% 6% 5% 13% 1%
2001 100% 95% 4% 69% 24% 20% 5% 4% 9% 9% 6% 3%
Percentage of Boards with Types of Committees
Aud
it
Com
pens
atio
n/H
R
Con
duct
Rev
iew
Gov
erna
nce*
Env
iron
men
t/Sa
fety
Exe
cutiv
e
Fin
ance
Inve
stm
ent
Nom
inat
ing*
Pen
sion
Ris
k
Stra
tegi
c P
lann
ing
Corporate Board Governance and Director Compensation in Canada A Review of 2011 | 51
* “Governance” includes combined Governance and Nominating Committees. The “Nominating” column refers to stand-alone Nominating Committees,
or Nominating Committees combined with a committee other than Governance.
All 2010 100% 95% 3% 92% 34% 10% 6% 8% 7% 5% 14% 13% 2% 3%
2009 100% 92% 4% 92% 30% 10% 5% 7% 6% 5% 14% 13% 1% 2%
Equity 2010 100% 96% 4% 92% 36% 11% 6% 5% 7% 5% 13% 13% 2% 3%
2009 100% 94% 5% 93% 31% 12% 6% 5% 6% 6% 11% 12% 1% 3%
Income Trusts 2010 100% 92% 0 92% 24% 0 0 32% 5% 5% 18% 10% 0 0
2009 100% 84% 0 90% 28% 2% 2% 17% 7% 2% 26% 14% 2% 0
Percentage of Boards with Types of Committees, by Board Type
Aud
it
Com
pens
atio
n/H
R
Con
duct
Rev
iew
Gov
erna
nce*
Env
iron
men
t/Sa
fety
Exe
cutiv
e
Fin
ance
Inve
stm
ent
Nom
inat
ing*
Pen
sion
Res
erve
s
Ris
k
Stra
tegi
c P
lann
ing
Tec
hnol
ogy
Number of Percentage of Percentage of Non- Percentage of Non- Committee Independent Directors Independent (Inside) Directors Independent (Outside) Directors Memberships 2010 2009 2010 2009 2010 2009
0 6% 6% 73% 75% 48% 46%
1 30% 31% 21% 20% 35% 36%
2 46% 45% 5% 4% 10% 12%
3 15% 15% <1% <1% 5% 5%
4 3% 3% <1% 0 2% 1%
5 1% 1% 0 0 0 0
Percentage of Directors with Committee Memberships
Committee Membership
• In2010,94%of independentdirectorshadatleastonecommitteemembership.
• Of thedirectorsthathadnocommitteememberships,22%wereboardchairsand19%hadbeenon the board for a year or less.
• Overall,directorsin2010averagedtwocommitteememberships.Independentdirectorsaveragedtwo committees each and non-independent directors averaged one committee each if they were outside directors or zero committees each if they were inside directors.
Director Compensation
52 | Corporate Board Governance and Director Compensation in Canada A Review of 2011

Corporate Board Governance and Director Compensation in Canada A Review of 2011 | 53
18 2010-2011 Director Compensation Report, published by the National Association of Corporate Directors.19 2010-2011 Director Compensation Report, published by the National Association of Corporate Directors.
Introduction
• Inordertothoroughlyaccountforthe compensation paid to directors, we combine the cash amounts with values of shares, trust units or share/trust unit equivalents such as deferred share units. We refer collectively to all compensation in the form of shares, trust units or share/trust unit equivalents as “shares” or “share compensation”.
• Whereaboardhasnotgivenacashvalueof shareequivalents, we have calculated based on the number of sharesawardedandthefiscalyear-endclosingprice.
• Wehavenotestimatedthevalueof stockoptions.However, we do report on the number of boards that grant stock options to directors in the “Stock-Based Compensation” section, which begins on page 75.
Annual Retainers
• Theincreaseinaveragedirectorretainerbetween2009 and 2010 was 10%, compared to 4% one year prior and 14% two years ago.
• IntheUnitedStates,thelargest200companies saw an increase of 5% in median total direct compensation.18
• Themedianretainervalueis$60,000,whichisa$10,000increaseover2009.Themedianretainervaluehasincreasedby$5,000onequityboardsandincreasedby$1,039onincometrustboards.
• In2010,asin2009,theaveragedirectorretaineronan equity board was 41% higher than on an income trust board.
• In2010,17%of companiespaidaretainerworth$125,000ormore,comparedto13%in2009.
• Thepercentageof companiespayingaretainerworth$25,000orlessdroppedfrom20%in2009 to 11% in 2010.
• IntheUnitedStatesin2010,thecombinedaveragecash retainer and value of share awards for the largest200companieswasUS$190,000.19
Key Findings
• Thetrendof payingdirectorswithonlyanannualretainercontinuestogrow.In2010,28%of companies chose this option, compared with 26% in 2009 and 25% in 2008. This category has grown annually since it was at 8% in 2003. There is a corresponding decrease in paying both a retainer and meeting fee. In 2010, 70% chose this option, compared with 73% in 2009 and 72% in 2008. This category has decreased steadily from 89% in 2003
• Theaverage2010retainerof $79,060wasa10%increaseoverthe2009average
• Theaveragedirectorretaineronanequityboardin2010was41%higherthanonan income trust board
• In2010,17%of companiespaidaretainerworth$125,000ormore,comparedto13%in2009
• Annualretainersaresignificantlyhigherif theyincludeamandatoryportioninsharesor share equivalents

54 | Corporate Board Governance and Director Compensation in Canada A Review of 2011
Equities Income Trusts All
Average $82,055 $58,340 $79,060
Median $60,000 $45,000 $60,000
Range $7,800to$390,030 $20,000to$128,000 $7,800to$390,030
Annual Board Retainer, by Board Type
<500M 500M to 1B 1B to 5B >5B All
2010 $40,010 $49,204 $72,390 $123,940 $79,060
2009 $34,696 $51,050 $65,615 $114,514 $71,512
2001* $12,567 $13,544 $17,366 $25,974 $17,044
Average Annual Board Retainer
<500M 500M to 1B 1B to 5B >5B All
$25,000 or less 2010 36% 16% 7% 2% 11%
2009 53% 26% 14% 3% 20%
$25,001 to $75,000 2010 51% 64% 59% 24% 49%
2009 35% 50% 57% 27% 45%
$75,001 to $125,000 2010 13% 14% 21% 35% 23%
2009 6% 17% 21% 35% 22%
$125,001 to $175,000 2010 0 2% 11% 27% 13%
2009 0 2% 2% 24% 8%
Over $175,000 2010 0 0 2% 12% 4%
2009 0 0 5% 11% 5%
No Retainer 2010 0 4% 1% 0 1%
2009 6% 5% 2% 0 2%
Retainer Distribution
* 2001 amounts do not include the value of all compensation in shares or share units.
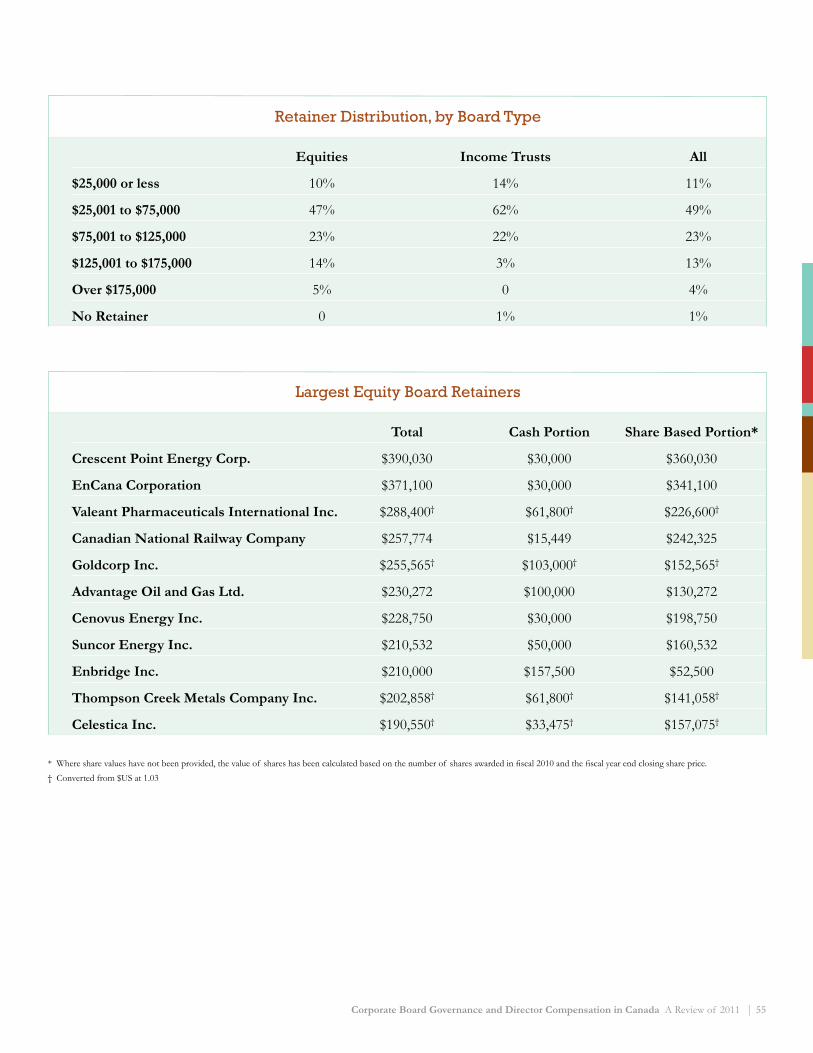
Corporate Board Governance and Director Compensation in Canada A Review of 2011 | 55
Equities Income Trusts All
$25,000 or less 10% 14% 11%
$25,001 to $75,000 47% 62% 49%
$75,001 to $125,000 23% 22% 23%
$125,001 to $175,000 14% 3% 13%
Over $175,000 5% 0 4%
No Retainer 0 1% 1%
Retainer Distribution, by Board Type
Total Cash Portion Share Based Portion*
Crescent Point Energy Corp. $390,030 $30,000 $360,030
EnCana Corporation $371,100 $30,000 $341,100
Valeant Pharmaceuticals International Inc. $288,400† $61,800† $226,600†
Canadian National Railway Company $257,774 $15,449 $242,325
Goldcorp Inc. $255,565† $103,000† $152,565†
Advantage Oil and Gas Ltd. $230,272 $100,000 $130,272
Cenovus Energy Inc. $228,750 $30,000 $198,750
Suncor Energy Inc. $210,532 $50,000 $160,532
Enbridge Inc. $210,000 $157,500 $52,500
Thompson Creek Metals Company Inc. $202,858† $61,800† $141,058†
Celestica Inc. $190,550† $33,475† $157,075†
Largest Equity Board Retainers
*Wheresharevalueshavenotbeenprovided,thevalueof shareshasbeencalculatedbasedonthenumberof sharesawardedinfiscal2010andthefiscalyearendclosingshareprice.
†Convertedfrom$USat1.03
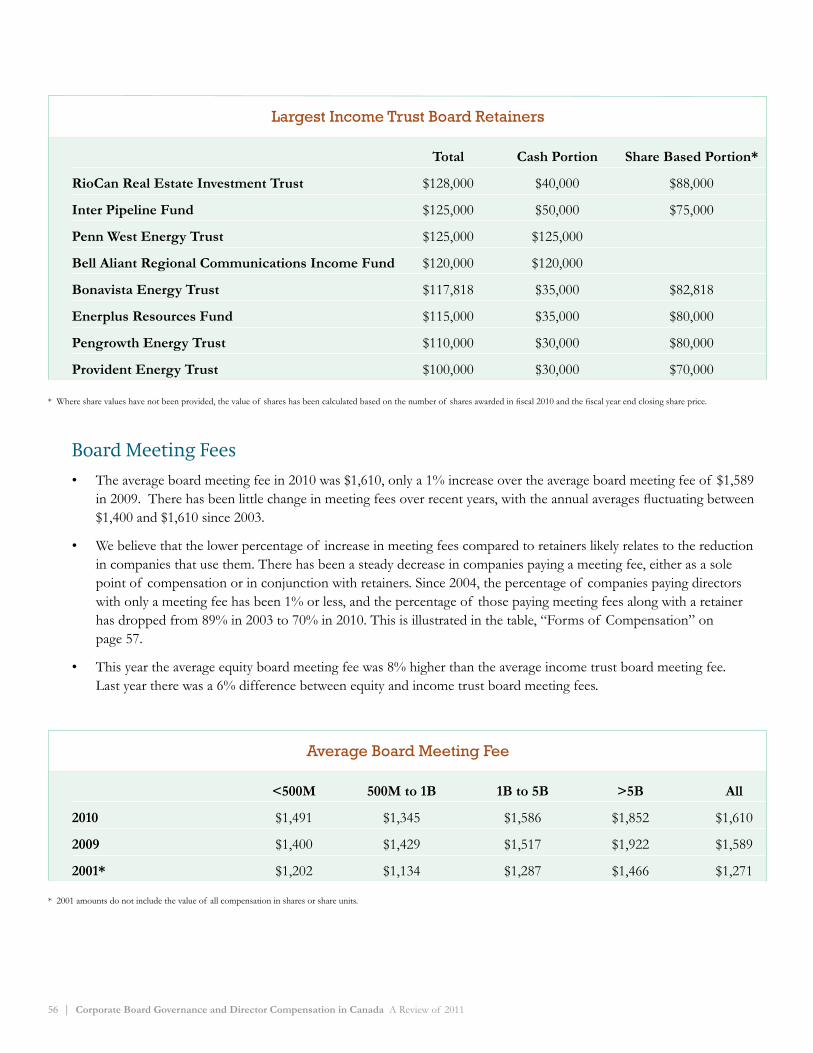
56 | Corporate Board Governance and Director Compensation in Canada A Review of 2011
Total Cash Portion Share Based Portion*
RioCan Real Estate Investment Trust $128,000 $40,000 $88,000
Inter Pipeline Fund $125,000 $50,000 $75,000
Penn West Energy Trust $125,000 $125,000
Bell Aliant Regional Communications Income Fund $120,000 $120,000
Bonavista Energy Trust $117,818 $35,000 $82,818
Enerplus Resources Fund $115,000 $35,000 $80,000
Pengrowth Energy Trust $110,000 $30,000 $80,000
Provident Energy Trust $100,000 $30,000 $70,000
Largest Income Trust Board Retainers
*Wheresharevalueshavenotbeenprovided,thevalueof shareshasbeencalculatedbasedonthenumberof sharesawardedinfiscal2010andthefiscalyearendclosingshareprice.
* 2001 amounts do not include the value of all compensation in shares or share units.
Board Meeting Fees
• Theaverageboardmeetingfeein2010was$1,610,onlya1%increaseovertheaverageboardmeetingfeeof $1,589in2009.Therehasbeenlittlechangeinmeetingfeesoverrecentyears,withtheannualaveragesfluctuatingbetween$1,400and$1,610since2003.
• Webelievethatthelowerpercentageof increaseinmeetingfeescomparedtoretainerslikelyrelatestothereductionin companies that use them. There has been a steady decrease in companies paying a meeting fee, either as a sole point of compensation or in conjunction with retainers. Since 2004, the percentage of companies paying directors with only a meeting fee has been 1% or less, and the percentage of those paying meeting fees along with a retainer has dropped from 89% in 2003 to 70% in 2010. This is illustrated in the table, “Forms of Compensation” on page 57.
• Thisyeartheaverageequityboardmeetingfeewas8%higherthantheaverageincometrustboardmeetingfee. Last year there was a 6% difference between equity and income trust board meeting fees.
<500M 500M to 1B 1B to 5B >5B All
2010 $1,491 $1,345 $1,586 $1,852 $1,610
2009 $1,400 $1,429 $1,517 $1,922 $1,589
2001* $1,202 $1,134 $1,287 $1,466 $1,271
Average Board Meeting Fee
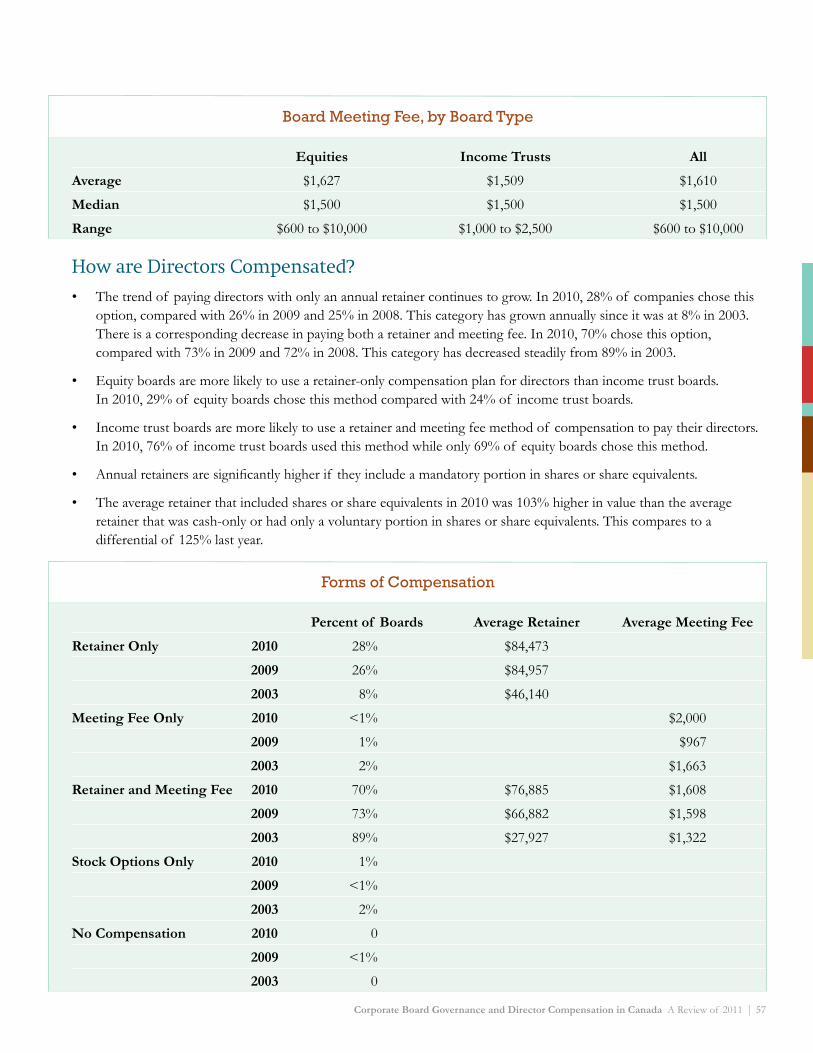
Percent of Boards Average Retainer Average Meeting Fee
Retainer Only 2010 28% $84,473
2009 26% $84,957
2003 8% $46,140
Meeting Fee Only 2010 <1% $2,000
2009 1% $967
2003 2% $1,663
Retainer and Meeting Fee 2010 70% $76,885 $1,608
2009 73% $66,882 $1,598
2003 89% $27,927 $1,322
Stock Options Only 2010 1%
2009 <1%
2003 2%
No Compensation 2010 0
2009 <1%
2003 0
Forms of Compensation
Corporate Board Governance and Director Compensation in Canada A Review of 2011 | 57
How are Directors Compensated?
• Thetrendof payingdirectorswithonlyanannualretainercontinuestogrow.In2010,28%of companieschosethisoption, compared with 26% in 2009 and 25% in 2008. This category has grown annually since it was at 8% in 2003. There is a corresponding decrease in paying both a retainer and meeting fee. In 2010, 70% chose this option, compared with 73% in 2009 and 72% in 2008. This category has decreased steadily from 89% in 2003.
• Equityboardsaremorelikelytousearetainer-onlycompensationplanfordirectorsthanincometrustboards. In 2010, 29% of equity boards chose this method compared with 24% of income trust boards.
• Incometrustboardsaremorelikelytousearetainerandmeetingfeemethodof compensationtopaytheirdirectors.In 2010, 76% of income trust boards used this method while only 69% of equity boards chose this method.
• Annualretainersaresignificantlyhigherif theyincludeamandatoryportioninsharesorshareequivalents.
• Theaverageretainerthatincludedsharesorshareequivalentsin2010was103%higherinvaluethantheaverage retainer that was cash-only or had only a voluntary portion in shares or share equivalents. This compares to a differential of 125% last year.
Equities Income Trusts All
Average $1,627 $1,509 $1,610
Median $1,500 $1,500 $1,500
Range $600to$10,000 $1,000to$2,500 $600to$10,000
Board Meeting Fee, by Board Type

58 | Corporate Board Governance and Director Compensation in Canada A Review of 2011
Percent of Boards Average Retainer Average Meeting Fee
Retainer Only All 28% $84,473
Equities 29% $87,285
Income Trusts 24% $57,757
Meeting Fee Only All <1% $2,000
Equities <1% $2,000
Income Trusts 0
Retainer and Meeting Fee All 70% $76,885 $1,608
Equities 69% $79,847 $1,625
Income Trusts 76% $58,501 $1,509
Stock Options Only All 1%
Equities 1%
Income Trusts 0
No Compensation All 0
Equities 0
Income Trusts 0
Forms of Compensation, by Board Type
Mandatory Shares in Retainer No Mandatory Shares in Retainer
Average Median Average Median
All $105,882 $100,000 $52,055 $40,000
Equities $109,611 $100,000 $53,177 $40,000
Income Trusts $75,349 $57,440 $45,381 $35,000
Average and Median Board Retainers, Including Cash and Shares, by Board Type
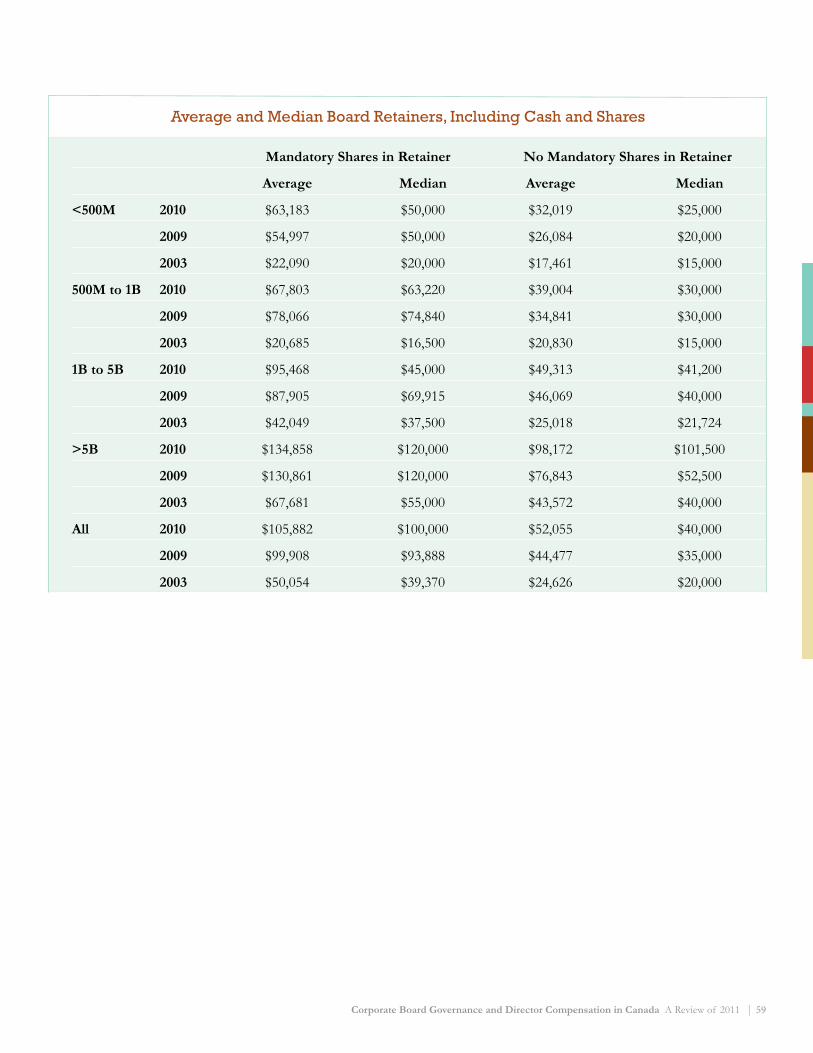
Corporate Board Governance and Director Compensation in Canada A Review of 2011 | 59
Mandatory Shares in Retainer No Mandatory Shares in Retainer
Average Median Average Median
<500M 2010 $63,183 $50,000 $32,019 $25,000
2009 $54,997 $50,000 $26,084 $20,000
2003 $22,090 $20,000 $17,461 $15,000
500M to 1B 2010 $67,803 $63,220 $39,004 $30,000
2009 $78,066 $74,840 $34,841 $30,000
2003 $20,685 $16,500 $20,830 $15,000
1B to 5B 2010 $95,468 $45,000 $49,313 $41,200
2009 $87,905 $69,915 $46,069 $40,000
2003 $42,049 $37,500 $25,018 $21,724
>5B 2010 $134,858 $120,000 $98,172 $101,500
2009 $130,861 $120,000 $76,843 $52,500
2003 $67,681 $55,000 $43,572 $40,000
All 2010 $105,882 $100,000 $52,055 $40,000
2009 $99,908 $93,888 $44,477 $35,000
2003 $50,054 $39,370 $24,626 $20,000
Average and Median Board Retainers, Including Cash and Shares

Board Chair Compensation
60 | Corporate Board Governance and Director Compensation in Canada A Review of 2011

Corporate Board Governance and Director Compensation in Canada A Review of 2011 | 61
Key Findings
• The2010averagenon-executivechairretainerof $217,909was10%higherthanin2009, after increases between 2% and 4% in the previous three years
• In2010,13%of boardchairretainersweremorethan$350,000,comparedto10%in2009 and 8% in 2008
• Theaveragenon-executivechairretainerin2010was$132,305forincometrustboardsandforequityboardswas77%higherat$233,926
• Asisthecasewithdirectorretainers,non-executivechairretainersarelargerwhenthere is a mandatory portion in shares or share equivalents
Introduction
• AllcompensationinthissectionrepresentsboardchairswhoarenotCEOs.Wedefine“executivechairs” as those board chairs whose compensation is disclosed as executive compensation, and “non-executive chairs” as those chairs whose compensation is disclosed as director compensation.
• Forthefifthyearinarow,wehaveexcluded executive chairs from our analysis and are only providing data for non-executive chairs. The decision to exclude data for executive chairs was taken in light of the small number of executive chairs included in our sample and the high variability in compensation for executive chairs, making it difficulttoidentifypatternsordrawsensible conclusions from the data available.
Non-Executive Chairs
• The2010averagenon-executivechairretainer of $217,909was10%higherthanin2009,afterincreases between 2% and 4% in the previous three years.Thiswasthefirstdouble-digitincreasein this category since a 26% increase between 2003 and 2004.
• Thereissteadygrowthinthecategoryof boardsthatpaytheirchairsmorethan$350,000.In2010,13% fell into this category, compared to 10% in 2009 and 8% in 2008.
• Whenlookingattheoverallaveragecashandshare/deferredshareunit(DSU)portionsof non-executive chair compensation, the average cash portion increased by 7% from the 2009 average, while the valueof theshare/DSUportionincreasedby8%.
• In2010,theaveragenon-executivechairretainerwas77% higher on equity boards than on income trust boards, compared to a 75% differential last year.
• Asisthesituationwithdirectorretainers, non-executive chair retainers are larger when there is a mandatory portion in shares or share equivalents. The average retainer that included shares or share equivalents in 2010 was 61% higher in value than the average retainer that was cash-only or had only a voluntary portion in shares or share equivalents. This compares to a differential of 76% last year.

62 | Corporate Board Governance and Director Compensation in Canada A Review of 2011
Equities Income Trusts All
Average $233,926 $132,305 $217,909
Median $206,000 $107,500 $200,000
Range $36,000to$902,585 $25,000to$439,000 $25,000to$902,585
Non-Executive Chair Retainer, by Board Type
Total Cash Portion Share Based Portion*
Goldcorp Inc. $902,585† $750,020† $152,565†
Canadian National Railway Company $769,788 $123,588 $646,200
Teck Resources Limited $659,132 $360,000 $299,132
Thomson Reuters Corporation $618,000† $618,000†
Bombardier Inc. $600,000 $600,000
EnCana Corporation $591,100 $250,000 $341,100
Saputo Inc. $500,000 $500,000
Largest Non-Executive Equity Board Chair Retainers
* 2001 amounts do not include the value of all compensation in shares.
*Wheresharevalueshavenotbeenprovided,thevalueof shareshasbeencalculatedbasedonthenumberof sharesawardedinfiscal2010andthefiscalyearendclosingshareprice.
†Convertedfrom$USat1.03.
<500M 500M to 1B 1B to 5B >5B All
2010 $96,379 $125,477 $192,846 $336,980 $217,909
2009 $87,324 $125,277 $176,972 $312,953 $198,861
2001* $63,318 $68,789 $128,045 $162,872 $111,445
Average Annual Non-Executive Chair Retainer
Mandatory Shares in Retainer No Mandatory Shares in Retainer
Average Median Average Median
All $269,838 $230,758 $167,098 $127,500
Equities $288,323 $267,500 $180,225 $160,000
Income Trusts $168,165 $145,000 $98,836 $75,000
Average and Median Non-Executive Chair Retainers, Including Cash and Shares, by Board Type

Corporate Board Governance and Director Compensation in Canada A Review of 2011 | 63
Total Cash Portion Share Based Portion*
RioCan Real Estate Investment Trust $439,000 $175,000 $264,000
Penn West Energy Trust $250,000 $250,000
Pengrowth Energy Trust $235,000 $75,000 $160,000
Parkland Income Fund $226,213 $78,960 $147,253
Enerplus Resources Fund $220,000 $120,000 $100,000
Dundee Real Estate Investment Trust $193,600 $100,000 $93,600
Largest Non-Executive Income Trust Board Chair Retainers
2010 2009 2008
$50,000 or less 6% 8% 8%
$50,001 to $150,000 25% 32% 34%
$150,001 to $250,000 28% 23% 19%
$250,001 to $350,000 15% 16% 17%
Over $350,000 13% 10% 8%
No Retainer 14% 11% 14%
Non-Executive Board Chair Retainer Distribution*
*Wheresharevalueshavenotbeenprovided,thevalueof shareshasbeencalculatedbasedonthenumberof sharesawardedinfiscal2010andthefiscalyearendclosingshareprice.
* Percentages are of boards with a non-executive chair.

Lead Director Compensation
64 | Corporate Board Governance and Director Compensation in Canada A Review of 2011

Corporate Board Governance and Director Compensation in Canada A Review of 2011 | 65
• Seventy-sevenpercentof boardswithaleaddirectorpaidanadditionalfeetotheleaddirectorin2010, compared with 73% in 2009 and only 38% in 2002.
• Largercompaniesaremorelikelytopayaleaddirectorretainer.In2010,84%of companieswithmore than$1billioninassetsthathadaleaddirectorpaidanadditionalretainertotheleaddirector,comparedwith52%of companieswithassetsof lessthan$1billion.
• Seventy-sevenpercentof equityboardswithaleaddirectorpaidanadditionalfeetotheleaddirector, compared to 75% of income trust boards.
• In2010,therewasa10%increaseintheaverageleaddirectorretainer,followinga1%decreasein2009 anda13%decreasein2008.The2010averageof $37,329isstillbelowthe2007highof $39,337.
2010 2009 2003
Average $37,329 $33,825 $26,111
Median $23,750 $20,000 $15,000
Range $2,500to$257,500 $3,000to$285,000 $1,500to$105,113
Lead Director Additional Retainer*, Including Cash and Shares
Equities Income Trusts All
Average $38,667 $24,329 $37,329
Median $28,875 $15,000 $23,750
Range $2,500to$257,500 $7,800to$80,000 $2,500to$257,500
Lead Director Additional Retainer*, Including Cash and Shares, by Board Type
* Additional to director retainer.
* Additional to director retainer.
Key Findings
• 77%of boardswithaleaddirectorpaidanadditionalfeetotheleaddirector
• Largercompaniesaremorelikelytopayaleaddirectorretainer
• Theaverageleaddirectorretainerforequityboardsin2010was$38,667andforincometrustboardswas$24,329
• In2010,therewasa10%increaseintheaverageleaddirectorretainer,followinga1%decrease in2009anda13%decreasein2008.The2010averageof $37,329isstillbelowthe2007high of $39,337

Committee Chair Compensation
66 | Corporate Board Governance and Director Compensation in Canada A Review of 2011

Corporate Board Governance and Director Compensation in Canada A Review of 2011 | 67
Equities Income Trusts All
Average $14,299 $11,964 $13,997
Median $10,300 $10,000 $10,000
Range $2,000to$250,000 $2,500to$45,000 $2,000to$250,000
Committee Chair Retainer, by Board Type
Key Findings
• 89%of companiespaidacommitteechairretainerthatwashigherthanthecommitteememberretainer
• Theaverageequityboardcommitteechairretainerwas$14,299comparedto$11,964atincome trust boards
• 80%of firmspaidahigherretainertothechairof theauditcommitteethantoothercommitteechairs
• Overthepastfiveyears,committeechairretainershavegrownby70%atcompanieswithlessthan$500millioninassets,whichismorethandoubletherateof growththananyothercategory
• Theaveragepremiumauditcommitteechairretainerwas56%higherthantheaverageretainerpaid to other committee chairs, or at companies that did not pay a premium for chairing the audit committee
• Aftermanyyearsof seeingboardspayhigherretainerstochairsof auditcommitteesthantoothercommittees, we are starting to see more boards where directors also receive a premium for chairing compensation committees. In 2010, 13% of boards with a compensation committee paid a higher retainer to that committee chair than some other committees, compared to 9% in 2009 and 5% in 2008 and 2007
Committee Chair Retainer• In2010,89%of companiespaidacommitteechair
retainer that was higher than the committee member retainer. For the previous two years, this statistic was 91%.
• IntheUnitedStates,93%of thelargest200 companies paid a committee chair retainer.
• Eighty-eightpercentof equityboardspaida committee chair retainer, compared to 95% of income trust boards.
• Theaverage2010committeechairretainerwas 3% higher than in 2009, following a 1% increase last year and 7% increases in the previous two years.
• Averagecommitteechairretainershaveshownagreatdealof year-to-yearfluctuation,ratherthansteady growth, so it is helpful to look at change over alongerperiod.Comparedtofiveyearsago,theyare20% higher and the bulk of this growth comes from smaller companies. At companies with less than $500millioninassets,theincreaseis70%overfiveyears, compared to increases of 12% at companies inthe$500Mto$1Bcategoryand33%inthe$1B to$5Bcategory.Averagecommitteechairretainerswentdownatcompanieswithmorethan$5billionin assets, which experienced a 6% decrease over the pastfiveyears.
• In2010,theaverageequityboardcommitteechairretainer was 20% higher than the average income trust board committee chair retainer. This differs from 2009 when the differential was 14% over the previous year.

68 | Corporate Board Governance and Director Compensation in Canada A Review of 2011
* 2001 amounts do not include the value of all compensation in shares or share units.
<500M 500M to 1B 1B to 5B >5B All
2010 $10,709 $9,421 $13,152 $18,088 $13,997
2009 $9,046 $9,853 $12,394 $18,446 $13,567
2001* $3,641 $3,869 $4,753 $13,484 $6,952
Average Annual Committee Chair Retainer
Differential Committee Chair Retainers• Aftermanyyearsof seeingboardspayhigherretainerstochairsof auditcommitteesthantoothercommittees,
we are starting to see more boards where directors also receive a premium for chairing compensation committees. In 2010, 13% of boards with a compensation committee paid a higher retainer to that committee chair than some other committees, compared to 9% in 2009 and 5% in 2008 and 2007.
• Largercompaniesaremuchmorelikelytopayacompensationcommitteepremium.In2010,84%of thosethatpaid apremiumtocompensationcommitteechairshadassetsof morethan$1billion,and16%wereatsmallercompanies.
• Othercommitteechairsthatboardsarestartingtocompensatewithhigheramountsarethosethatleadrisk, governance and environment/health/safety committees. In 2010, 8% of risk committee chairs received a premium retainer, as well as 4% of governance and environment/health/safety committee chairs.
• Auditcommitteechairsarestillthemostlikelytoreceiveahigherretainer.In2010,80%of companiespaid a higher retainer to audit committee chairs than other committee chairs. For the previous three years, thispercentagefluctuatedbetween76%and78%.
• Thisyear,theaveragepremiumauditcommitteechairretainerwas56%higherthanthenon-auditchairretainer. For the previous four years, this percentage ranged between 60% and 66%.
• In2010,therewasa1%increaseintheaveragepremiumauditcommitteechairretainerover2009andthis follows increases over the previous years of 2%, 5% and 8% consecutively.
• In2010,84%of incometrustboardspaidapremiumauditcommitteechairretainer,adecreaseof 2%overlastyear.Seventy-nine percent of equity boards paid such a premium, a 4% increase over last year.
• Theaveragepremiumauditcommitteechairretaineratequityboardswas19%higherthanatincometrustboards.This is an increase of 8% over last year.
• IntheUnitedStates,themedianauditcommitteechairretaineratthelargest200companieswasUS$20,000.21
21 2010-2011 Director Compensation Report, published by the National Association of Corporate Directors.
* “Non-Audit” includes audit committees at those companies that do not pay a premium for audit committee membership.
All 80% $17,545 $11,253
Equities 79% $17,924 $11,377
Income Trusts 84% $15,093 $9,397
Average Premium Audit Committee and Non-Audit* Committee Chair Retainer, by Board Type
Percentage that Pay a Premium Audit Committee
Chair Retainer
Average Audit Committee Chair Retainer at Companies
that Pay a PremiumAverage Non-Audit
Chair Retainer

Corporate Board Governance and Director Compensation in Canada A Review of 2011 | 69
Audit Committee Non-Audit Committee
Average 2010 $17,545 $11,253
2009 $17,432 $10,569
2003 $12,561 $7,254
Median 2010 $15,000 $9,500
2009 $15,000 $7,500
2003 $10,000 $5,000
Range 2010 $3,250to$70,000 $2,000to$250,000
2009 $3,000to$75,000 $2,000to$250,000
2003 $3,000to$75,000 $1,000to$250,000
Premium Audit Committee Chair Retainer vs. Non-Audit* Committee Chair Retainer
* “Non-Audit” includes audit committees at those companies that do not pay a premium for audit committee membership.
Committee Chair Meeting Fee
• In2010,4%of companiespaidahighermeetingfeetocommitteechairsthantocommitteemembers.Thisisadecrease from 5% over the previous four years. Four percent of equity boards and 5% of income trust boards paid a higher meeting fee to committee chairs.
• Theaveragecommitteechairmeetingfeein2010was$2,634comparedto$2,606in2009.Theaverageequityboardcommitteechairmeetingfeewas$2,689,andtheaverageincometrustboardcommitteechairmeetingfeewas$2,250.
• IntheUnitedStates,3%of thelargest200companiespaidhighermeetingfeestocommitteechairs,comparedto6% to 10% in all smaller company size categories.22
22 2010-2011 Director Compensation Report, published by the National Association of Corporate Directors.
* “Non-Audit” includes audit committees at those companies that do not pay a premium for audit committee membership.
<500M 62% $13,148 $8,531
500M to 1B 82% $11,924 $7,141
1B to 5B 80% $17,817 $9,391
>5B 87% $21,835 $15,646
All 80% $17,545 $11,253
Average Premium Audit Committee and Non-Audit* Committee Chair Retainer, by Board Size
% of Asset Group that Pay a Premium Audit Committee
Chair Retainer
Average Audit Committee Chair Retainer at Companies
that Pay a PremiumAverage Non-Audit
Committee Chair Retainer

Committee Member Compensation
70 | Corporate Board Governance and Director Compensation in Canada A Review of 2011

Corporate Board Governance and Director Compensation in Canada A Review of 2011 | 71
Equities Income Trusts All
Average $5,812 $6,859 $5,887
Median $5,000 $5,000 $5,000
Range $1,000to$25,750 $1,500to$20,000 $1,000to$25,750
Committee Member Retainer, by Board Type
23 2010-2011 Director Compensation Report, published by the National Association of Corporate Directors.
Key Findings
• Theaveragecommitteememberretainerforequityboardsin2010was$5,812,andforincome trustboardswas$6,859
• Theaveragecommitteemeetingfeeforequityboardsin2010was$1,580,andforincometrust boardswas$1,482
• 24%of thecompaniessurveyedpaidahighercommitteeretainerforauditcommitteemembers than for other committees
• Overthepastfiveyears,committeememberretainershavegrownby47%atcompanieswithless than$500millioninassets,whichismorethanthreetimestherateof growththanany other category
Committee Member Retainer • Theaverage2010committeememberretainerof
$5,887isadecreaseof lessthan1%over2009, following another 1% decrease in the previous year.
• Aswithcommitteechairretainers,committee memberretainershavefluctuatedovertheyearsrather than showing a steady growth pattern, so it is helpful to look at them over a longer period. Comparedtofiveyearsago,theyare16%higher,and as with committee chair retainers, the bulk of the growth comes from the smallest companies. Atcompanieswithlessthan$500millioninassets,committee member retainers are 47% higher than fiveyearsago.The$500Mto$1Bcategorysawa6%decreaseoverfiveyears,andthe$1Bto$5Bandtheover$5Bcategorieshadrespectiveincreasesof 9%and 13%.
• Of thecompaniesthatpaidcommitteemembercompensation, 34% paid both a retainer and meeting fee and 12% paid a retainer only. This breakdown has been relatively stable for the last seven years, with the percentage paying a retainer and meeting fee varying between 34% and 36%, and the percentage paying only retainers varying between 8% and 12%.
• IntheUnitedStates,39%of thelargest200 companies paid a committee member meeting retainer.23

72 | Corporate Board Governance and Director Compensation in Canada A Review of 2011
* 2001 amounts do not include the value of all compensation in shares or share units.
<500M 500M to 1B 1B to 5B >5B All
2010 $4,776 $3,827 $5,253 $6,967 $5,887
2009 $6,597 $4,167 $5,573 $6,475 $5,898
2001* $2,402 $2,073 $2,871 $3,635 $3,065
Average Committee Member Retainer
* 2001 amounts do not include the value of all compensation in shares or share units.
<500M 500M to 1B 1B to 5B >5B All
2010 $1,340 $1,334 $1,596 $1,739 $1,568
2009 $1,382 $1,426 $1,524 $1,784 $1,561
2001* $961 $1,051 $1,192 $1,317 $1,120
Average Committee Member Meeting Fee
Committee Member Meeting Fee • In2010,theaveragecommitteemeetingfeeincreasedbylessthan1%overthe2009average.Overtheprevious
fiveyears,theannualincreaseincommitteemeetingfeesrangedbetween1%and4%.
• In2010,theaveragecommitteemeetingfeeonanequityboardwas7%higherthanonanincometrustboard,which is the same percentage as the previous year.
• Of theboardsthatpaidsomeformof committeemembercompensation,46%paidcommitteemembersameeting fee only, which is slightly lower than 48% in 2009.
• Twelvepercentof companiesthatpaidcommitteemeetingfeespaidahighermeetingfeetoauditcommitteemembers in 2010 compared with 8% in 2009 and 9% in 2008.
• IntheUnitedStates,44%of thelargest200companiespaidacommitteemembermeetingfee.24
Equities Income Trusts All
Average $1,580 $1,482 $1,568
Median $1,500 $1,500 $1,500
Range $500to$4,000 $1,000to$2,000 $500to$4,000
Committee Member Meeting Fees, by Board Type
24 2010-2011 Director Compensation Report, published by the National Association of Corporate Directors.
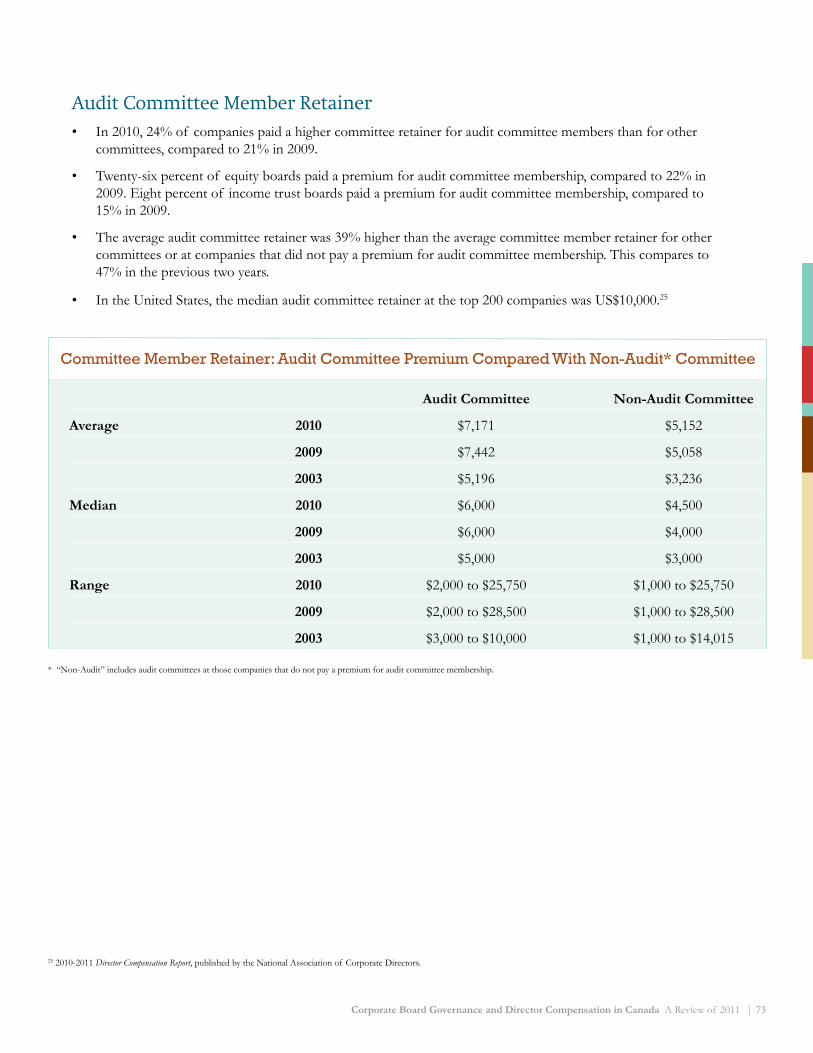
Corporate Board Governance and Director Compensation in Canada A Review of 2011 | 73
* “Non-Audit” includes audit committees at those companies that do not pay a premium for audit committee membership.
Audit Committee Member Retainer • In2010,24%of companiespaidahighercommitteeretainerforauditcommitteemembersthanforother
committees, compared to 21% in 2009.
• Twenty-sixpercentof equityboardspaidapremiumforauditcommitteemembership,comparedto22%in2009. Eight percent of income trust boards paid a premium for audit committee membership, compared to 15% in 2009.
• Theaverageauditcommitteeretainerwas39%higherthantheaveragecommitteememberretainerforothercommittees or at companies that did not pay a premium for audit committee membership. This compares to 47% in the previous two years.
• IntheUnitedStates,themedianauditcommitteeretaineratthetop200companieswasUS$10,000.25
Audit Committee Non-Audit Committee
Average 2010 $7,171 $5,152
2009 $7,442 $5,058
2003 $5,196 $3,236
Median 2010 $6,000 $4,500
2009 $6,000 $4,000
2003 $5,000 $3,000
Range 2010 $2,000to$25,750 $1,000to$25,750
2009 $2,000to$28,500 $1,000to$28,500
2003 $3,000to$10,000 $1,000to$14,015
Committee Member Retainer: Audit Committee Premium Compared With Non-Audit* Committee
25 2010-2011 Director Compensation Report, published by the National Association of Corporate Directors.

Stock-Based Compensation
74 | Corporate Board Governance and Director Compensation in Canada A Review of 2011

Corporate Board Governance and Director Compensation in Canada A Review of 2011 | 75
Key Findings
• In2010,85%of equityboardsand68%of incometrustboardshadatleastoneformof stock-based compensation for their directors
• Theuseof stock-basedcompensationincreasedto83%from81%thepreviousyear
• In2010,23%of companiesprovideddirectorswithstockoptionsortrustunitrights
• Thelargerthecompany,themorelikelyitistohavebothmandatoryandoptionalshare compensationfordirectors.In2010,57%of companieswithmorethan$5billioninassets usedthismethod,comparedto8%atboardswithlessthan$500millioninassets
<500M 500M to 1B 1B to 5B >5B All
2010 82% 68% 82% 94% 83%
2009 66% 69% 82% 95% 81%
2001 59% 64% 67% 83% 67%
Percentage of Companies with a Stock Component in Director Compensation
26 2010-2011 Director Compensation Report, published by the National Association of Corporate Directors.
Introduction • Weconsideracompanytohavestock-based
compensation when, during the year in question, directors receive at least one of stock or trust unit options, shares or trust units, or “share equivalents” (typically a form of deferred share or trust units).
• Weconsideracompanytohavestockoption compensation for directors in 2010 when options were actually granted to directors during the fiscalyear.
Forms of Stock-Based Compensation• In2010,83%of companiesusedsomeformof
stock-based compensation for directors, which is an increase of 2% over 2009. This category has fluctuated,withbetween77%and83%of companies using stock-based compensation in each of the past six years.
• In2010,85%of equityboardshadatleastoneformof stock-based compensation for their directors, compared with 68% of income trust boards.
• In2010,23%of companiesprovideddirectorswithstock options or trust unit rights. Over the past four yearsthispercentagehasfluctuatedbetween20%and 26%.
• TherehasbeenanincreaseincompaniesusingshareequivalentslikeDSUs,atthesametimeastherehas been a decrease in actual stock awards. In 2010, 15% of companies used stock awards for director compensation, compared to 25% ten years earlier. In 2010, 60% of companies compensated directors with share equivalents, compared to 28% ten years ago.
• IntheUnitedStates,directorcompensationatthelargest 200 companies includes full-value equity at 91% of the boards and stock options at 27%.26

76 | Corporate Board Governance and Director Compensation in Canada A Review of 2011
Equities 15% 25% 62% 14%
Income Trusts 16% 8% 47% 32%
All 15% 23% 60% 17%
Percentage of Companies with Various Types of Stock-Based Director Compensation, by Board Type
Shares/Trust Units Stock Options/ Share Equivalents None Trust Unit Rights
Totals are more than 100% because some companies provide more than one form of stock-based compensation.
2010 15% 23% 60% 17%
2009 15% 20% 58% 19%
2001 26% 67% 39% 33%
Percentage of Companies with Various Types of Stock-Based Director Compensation
Shares/Trust Units Stock Options/ Share Equivalents None Trust Unit Rights
Totals are more than 100% because some companies provide more than one form of stock-based compensation.
Mandatory vs. Voluntary Compensation in Shares or Share Equivalents • Themostprevalentwayof providingsharecompensationtodirectorsistomakeaportionof compensation
in shares or share equivalents mandatory, and to allow an option to take a further portion in the same manner. In 2010, 30% of boards chose this method, compared to 5% in 2002.
• Thelargerthecompany,themorelikelyitistohavebothmandatoryandoptionalsharecompensationfor directors.In2010,57%of companieswithmorethan$5billioninassetsusedthismethod,comparedto8% atboardswithlessthan$500millioninassets.

Corporate Board Governance and Director Compensation in Canada A Review of 2011 | 77
2010 2009 2002Option to take all or part of compensation in shares or share equivalents 17% 17% 19%
Must take all or part of compensation in shares or share equivalents, no option of taking a further portion in the same manner 19% 19% 8%
At least a portion of compensation must be in share or share equivalents 30% 28% 5%
Percentage of Companies with Compensation in Shares or Share Equivalents
<500M 500M to 1B 1B to 5B >5B AllOption to take all or part of compensation in shares or share equivalents 13% 2% 23% 20% 17%
Must take all or part of compensation in shares or share equivalents, no option of taking a further portion in the same manner 18% 18% 23% 13% 19%
At least a portion of compensation must be in share or share equivalents 8% 16% 26% 57% 30%
Percentage of Companies with Compensation in Shares or Share Equivalents, by Asset Size
Equities Income Trusts AllOption to take all or part of compensation in shares or share equivalents 17% 18% 17%
Must take all or part of compensation in shares or share equivalents, no option of taking a further portion in the same manner 16% 34% 19%
At least a portion of compensation must be in share or share equivalents 34% 8% 30%
Percentage of Companies with Compensation in Shares or Share Equivalents, by Board Type

Compensation Summary
78 | Corporate Board Governance and Director Compensation in Canada A Review of 2011

Corporate Board Governance and Director Compensation in Canada A Review of 2011 | 79
<500M 500M to 1B 1B to 5B >5B All
Director Retainer 2010 $40,010 $49,204 $72,390 $123,940 $79,060
2009 $34,696 $51,050 $65,615 $114,514 $71,512
2001* $12,567 $13,544 $17,366 $25,974 $17,044
Board Meeting 2010 $1,491 $1,345 $1,586 $1,852 $1,610
2009 $1,400 $1,429 $1,517 $1,922 $1,589
2001* $1,202 $1,134 $1,287 $1,466 $1,271
Non-Exec Chair Retainer 2010 $96,379 $125,477 $192,846 $336,980 $217,909
2009 $87,324 $125,277 $176,972 $312,953 $198,861
2001* $63,318 $68,789 $128,045 $162,872 $111,445
Committee Chair Retainer 2010 $10,709 $9,421 $13,152 $18,088 $13,997
2009 $9,046 $9,853 $12,394 $18,446 $13,567
2001* $3,641 $3,869 $4,753 $13,484 $6,952
Committee Member Retainer 2010 $4,776 $3,827 $5,253 $6,967 $5,887
2009 $6,597 $4,167 $5,573 $6,475 $5,898
2001* $2,402 $2,073 $2,871 $3,635 $3,065
Committee Member Meeting 2010 $1,340 $1,334 $1,596 $1,739 $1,568
2009 $1,382 $1,426 $1,524 $1,784 $1,561
2001* $961 $1,051 $1,192 $1,317 $1,120
Telephone Meeting 2010 $1,023 $757 $881 $909 $871
2009 $850 $762 $884 $920 $863
2001* $570 $708 $654 $666 $627
Average Compensation, by Asset Size
* 2001 amounts do not include the value of all compensation in shares or share units.
Key Findings
• In2010,themostsignificantchangewesawwasthe10%increaseinbothaveragedirector retainersto$79,060andaveragenon-executivechairretainersto$217,909
• Meetingfeesforbothboardandcommitteemeetingsshowedminimalyearoveryearchange
• Comparingdirectorcompensationforequityandincometrustboardsin2010revealsthat meeting fees are very comparable, while director retainers are 41% higher and non-executive chair retainers are 77% higher at equity boards

80 | Corporate Board Governance and Director Compensation in Canada A Review of 2011
Equities Income Trusts All
Director Retainer 2010 $82,055 $58,340 $79,060
2009 $75,918 $53,886 $71,512
Board Meeting 2010 $1,627 $1,509 $1,610
2009 $1,610 $1,512 $1,589
Non-Exec Chair Retainer 2010 $233,926 $132,305 $217,909
2009 $220,894 $126,465 $198,861
Committee Chair Retainer 2010 $14,299 $11,964 $13,997
2009 $13,938 $12,169 $13,567
Committee Member Retainer 2010 $5,812 $6,859 $5,887
2009 $5,870 $6,060 $5,898
Committee Member Meeting 2010 $1,580 $1,482 $1,568
2009 $1,584 $1,474 $1,561
Telephone Meeting 2010 $873 $861 $871
2009 $852 $909 $863
Average Compensation, by Board Type

Corporate Board Governance and Director Compensation in Canada A Review of 2011 | 81

Director Share Ownership
82 | Corporate Board Governance and Director Compensation in Canada A Review of 2011

Corporate Board Governance and Director Compensation in Canada A Review of 2011 | 83
Director Shareholding • In2010,94%of directorsownedand/orcontrolledsharesinthecompaniesonwhoseboardstheysit.
For the past six years, more than 90% of directors fell into this category each year.
• Ninety-fourpercentof directorsonequityboardsand96%of directorsonincometrustboardsowned and/or controlled shares in the companies on whose boards they sit.
• Of thosedirectorsthatdidnotownand/orcontrolsharesin2010,32%hadbeenontheirboardsfor less than one year.
<500M 500M to 1B 1B to 5B >5B All
2010 87% 89% 95% 98% 94%
2009 85% 91% 96% 99% 95%
2001 81% 86% 89% 93% 87%
Percentage of Directors Who Own and / or Control Shares or Share Equivalents in
the Companies on Whose Boards They Sit
Key Findings
• 94%of directorsownedand/orcontrolledsharesinthecompaniesonwhoseboardstheysat in2010.Thisfigurehasbeenabove90%forthepastsixyears
• In2010,67%of boardshadanexplicitshareholdingguideline
• Shareholdingguidelinesexpressedasadollarvalueequaltoamultipleof theannualretainerhavegrowninpopularityconsistentlyforthepastfiveyears.In2005,51%of boardswith shareholding guidelines used this model, and this percentage has increased each year since then and is 70% in 2010
• In2010,of thosecompaniesrequiringdirectorstoholdstock,65%requiredthestockbevaluedat least three times their annual retainer, while 22% required directors to hold four times or more, and 13% required less than three times

84 | Corporate Board Governance and Director Compensation in Canada A Review of 2011
2010 2009 2001
Specified guideline only 67% 66% 13%
Including mandatory deferred share units that must be held until the director leaves the board 74% 73% 18%
Percentage of Boards with a Director Shareholding Guideline
• While,historically,equityboardshavebeenmuchmorelikelythanincometrustboardstohaveeitheranexplicitor implicit shareholding guideline, the gap between the two continues to narrow.
Percentage of Boards with a Director Shareholding Guideline, by Board Type
Equities Income Trusts All
Specified guideline only 2010 67% 68% 67%
2009 68% 57% 66%
2008 68% 52% 64%
2007 66% 47% 62%
2006 60% 37% 54%
Including mandatory deferred share units that must be held until the director leaves the board 2010 75% 82% 74%
2009 74% 71% 73%
2008 74% 61% 71%
2007 71% 54% 67%
2006 68% 41% 61%
Director Shareholding Guidelines• Whendirectorcompensationincludesamandatoryportionindeferredshareunitsthatmustbeheldaslong
as the director remains on the board, we consider this to be an implicit director shareholding guideline.
• In2010thenumberof boardswithanexplicitshareholdingguidelineincreasedto67%,up1%fromthe previous year, and up from 13% in 2001.

Corporate Board Governance and Director Compensation in Canada A Review of 2011 | 85
• Thepercentageof companiesrequiringdirectorstoholdvariousmultiplesof theannualdirectorretainerremained relatively stable in 2010 over 2009. We continue to see companies shifting away from requiring directors to hold multiples greater than three times their retainers. In 2003, 56% of companies required directors to hold a multiple of four or more, while in 2010 only 22% of companies fell into this category. Over the same time period, companies requiring directors to hold a multiple of six or eight times their retainer value has dropped from 15% to 1%.
• Shareholdingguidelinesexpressedasadollarvalueequaltoamultipleof theannualretainerhavegrowninpopularityconsistentlyforthepastfiveyears.In2005,51%of boardswithshareholdingguidelinesusedthismodel, and this percentage has increased each year since then and sits at 70% in 2010.
• Atthesametime,thepracticeof settingshareownershipguidelineswithaspecificnumberof shareshas declined, going from 22% in 2005 down to 11% in 2010.
2010 2009 2003
Dollar value equal to a multiple of the annual director retainer 70% 69% 48%
Specific number of shares or share units 11% 15% 30%
Specific dollar value 18% 16% 19%
Highest of two of the variables listed above 0 0 2%
Multiple of annual retainer plus another item 2% <1% 0
Types of Director Share Ownership Guidelines, Shown as a Percentage of all Companies
With a Specific Director Share Ownership Guideline

86 | Corporate Board Governance and Director Compensation in Canada A Review of 2011
2010 2009 2003
Equal to the retainer value 4% 3% 4%
Two times the retainer value 8% 8% 13%
Two and a half times the retainer value 1% 0 0
Three times the retainer value 65% 62% 27%
Four times the retainer value 5% 5% 6%
Five times the retainer value 16% 20% 35%
Six times the retainer value 1% 2% 13%
Eight times the retainer value 0 0 2%
Breakdown of Director Shareholding Guidelines Stated as a Dollar Value Equal to a Multiple
of the Annual Director Retainer
2010 2009 2003
Average value $240,656 $212,511 $137,933
Median value $180,000 $150,000 $108,850
Range of values $5,875to$1,023,300 $5,000to$855,000 $6,250to$490,525
Value* of Director Share Ownership Guidelines
*Whereaguidelinespecifiedanumberof sharesorshareunits,avaluewascalculatedbasedonthefiscalyear-endclosingpriceof theshare.If acompanyhadmorethanoneclass of shareanddidnotspecifyoneclassintheshareholdingguideline,thecalculationwasbasedontheclassof sharewiththeloweryear-endclosingprice.Whereaguidelinespecified a value equal to a multiple of the annual retainer, the value was calculated using the retainer amount for 2010.

Corporate Board Governance and Director Compensation in Canada A Review of 2011 | 87
The following pages contain data collected from annual reports, management proxy circulars and
annualinformationformsregardingfiscalyear-endsinlate2010andearly2011.Itisinalphabetical
order by company name.
Company Data
Any additional explanation required for entries is detailed in the Company Data Endnotes on pages 98 to 100.
Stock compensation is an increasingly important part of director compensation. It is represented in the Appendix as follows:
• Req’d: “X” in this column indicates that directors must take all or some of their compensation in either shares or share equivalents.
• Elect: “X” in this column indicates that directors can elect to take all or some of their cash compensation in the form of shares or share equivalents.
• Options: Values of stock options are not stated, however we do indicate which companies grantedstockoptionstodirectorsinfiscal2010.
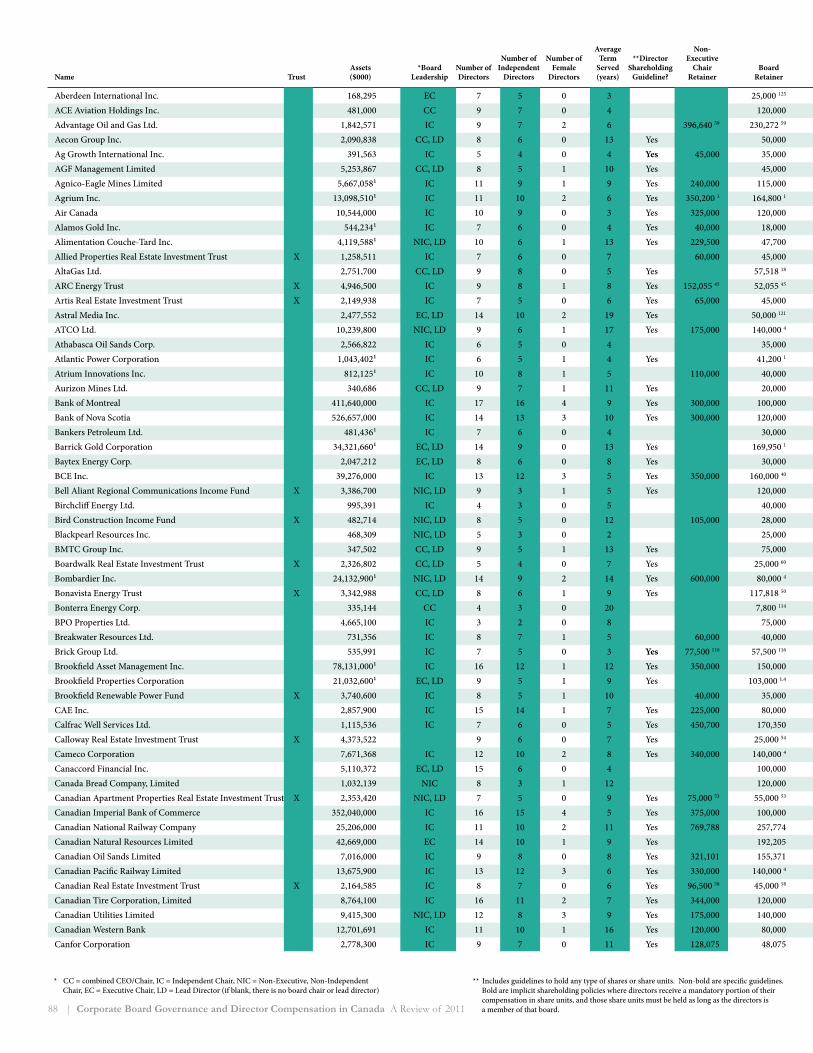
88 | Corporate Board Governance and Director Compensation in Canada A Review of 2011
** Includes guidelines to hold any type of shares or share units. Non-bold are specific guidelines. Bold are implicit shareholding policies where directors receive a mandatory portion of their compensation in share units, and those share units must be held as long as the directors is a member of that board.
* CC = combined CEO/Chair, IC = Independent Chair, NIC = Non-Executive, Non-Independent Chair, EC = Executive Chair, LD = Lead Director (if blank, there is no board chair or lead director)
Average Non- Number of Number of Term **Director Executive Lead Committee Chair Fee Stock Component Assets *Board Number of Independent Female Served Shareholding Chair Board Board Director Name Trust ($000) Leadership Directors Directors Directors (years) Guideline? Retainer Retainer Meeting Fee Retainer Committee Retainer Committee Meeting Fee Regular: Retainer Bold: Meeting Fees Req’d Elect Options
Aberdeen International Inc. 168,295 EC 7 5 0 3 25,000 125 XACE Aviation Holdings Inc. 481,000 CC 9 7 0 4 120,000 5,000 10,000 49 10,000 20,000 49 Advantage Oil and Gas Ltd. 1,842,571 IC 9 7 2 6 396,640 59 230,272 59 X Aecon Group Inc. 2,090,838 CC, LD 8 6 0 13 Yes 50,000 1,500 4,000 1,500 6,000 Ag Growth International Inc. 391,563 IC 5 4 0 4 Yes 45,000 35,000 1,500 1,500 5,000 10,000 ² X X AGF Management Limited 5,253,867 CC, LD 8 5 1 10 Yes 45,000 20,000 2,000 4,000 2 3,000 14 4,000 15,000 ² 6,000 14 X Agnico-Eagle Mines Limited 5,667,058¹ IC 11 9 1 9 Yes 240,000 115,000 10,000 25,000 ² XAgrium Inc. 13,098,510¹ IC 11 10 2 6 Yes 350,200 1 164,800 1 1,030 1 3,605 1 1,030 1 1,545 1,2 6,695 1 15,450 1,2 10,300 1,5 X X Air Canada 10,544,000 IC 10 9 0 3 Yes 325,000 120,000 5,000 10,000 43,49 10,000 20,000 43,49 X Alamos Gold Inc. 544,234¹ IC 7 6 0 4 Yes 40,000 18,000 1,000 1,000 6,000 10,600 ² XAlimentation Couche-Tard Inc. 4,119,588¹ NIC, LD 10 6 1 13 Yes 229,500 47,700 1,530 28,875 3,060 1,530 2,040 2 5,775 11,295 ² X X Allied Properties Real Estate Investment Trust X 1,258,511 IC 7 6 0 7 60,000 45,000 2,500 5,000 ² XAltaGas Ltd. 2,751,700 CC, LD 9 8 0 5 Yes 57,518 18 1,250 60,000 3,500 1,000 8,250 18,500 ² X ARC Energy Trust X 4,946,500 IC 9 8 1 8 Yes 152,055 45 52,055 45 6,028 12,500 30,000 ² 22,500 5 X Artis Real Estate Investment Trust X 2,149,938 IC 7 5 0 6 Yes 65,000 45,000 2,000 76 2,000 2,000 76 5,000 15,000 ² XAstral Media Inc. 2,477,552 EC, LD 14 10 2 19 Yes 50,000 121 15,000 7,500 15,000 ² X ATCO Ltd. 10,239,800 NIC, LD 9 6 1 17 Yes 175,000 140,000 4 2,000 4,35 50,000 7,500 2 1,500 4 8,500 20,000 ² X X Athabasca Oil Sands Corp. 2,566,822 IC 6 5 0 4 35,000 6,000 Atlantic Power Corporation 1,043,402¹ IC 6 5 1 4 Yes 41,200 1 1,545 1 1,545 1 10,300 1,2,14 X Atrium Innovations Inc. 812,125¹ IC 10 8 1 5 110,000 40,000 1,500 1,500 7,000 10,000 ² Aurizon Mines Ltd. 340,686 CC, LD 9 7 1 11 Yes 20,000 1,200 6,000 1,200 6,000 10,000 ² XBank of Montreal 411,640,000 IC 17 16 4 9 Yes 300,000 100,000 2,000 1,500 25,000 40,000 ² 15,000 19 X X Bank of Nova Scotia 526,657,000 IC 14 13 3 10 Yes 300,000 120,000 2,000 3,000 6,000 16 2,000 20,000 40,000 16 25,000 10 X X Bankers Petroleum Ltd. 481,436¹ IC 7 6 0 4 30,000 10,000 XBarrick Gold Corporation 34,321,660¹ EC, LD 14 9 0 13 Yes 169,950 1 30,900¹ 3,090 1,2 10,300 1 20,600 1,2 X X Baytex Energy Corp. 2,047,212 EC, LD 8 6 0 8 Yes 30,000 1,500 20,000 1,500 5,000 20,000 ² BCE Inc. 39,276,000 IC 13 12 3 5 Yes 350,000 160,000 40 40 40 X X Bell Aliant Regional Communications Income Fund X 3,386,700 NIC, LD 9 3 1 5 Yes 120,000 80,000 72 30,000 37,41 Birchcliff Energy Ltd. 995,391 IC 4 3 0 5 40,000 1,000 1,000 XBird Construction Income Fund X 482,714 NIC, LD 8 5 0 12 105,000 28,000 1,500 7,800 5,000 6,500 11,000 ² Blackpearl Resources Inc. 468,309 NIC, LD 5 3 0 2 25,000 XBMTC Group Inc. 347,502 CC, LD 9 5 1 13 Yes 75,000 X XBoardwalk Real Estate Investment Trust X 2,326,802 CC, LD 5 4 0 7 Yes 25,000 60 1,500 60 20,000 60 5,000 60 1,500 60 8,000 60 15,000 2,60 X Bombardier Inc. 24,132,900¹ NIC, LD 14 9 2 14 Yes 600,000 80,000 4 2,500 4 5,000 4 2,500 4 10,000 4 20,000 ² X Bonavista Energy Trust X 3,342,988 CC, LD 8 6 1 9 Yes 117,818 50 1,400 15,000 4,000 7,500 2 1,400 6,000 15,000² X Bonterra Energy Corp. 335,144 CC 4 3 0 20 7,800 114 BPO Properties Ltd. 4,665,100 IC 3 2 0 8 75,000 Breakwater Resources Ltd. 731,356 IC 8 7 1 5 60,000 40,000 1,000 1,000 5,000 15,000 ² XBrick Group Ltd. 535,991 IC 7 5 0 3 Yes 77,500 116 57,500 116 1,250 1,250 6,000 10,000 ² X X Brookfield Asset Management Inc. 78,131,000¹ IC 16 12 1 12 Yes 350,000 150,000 15,000 25,000 ² X X Brookfield Properties Corporation 21,032,600¹ EC, LD 9 5 1 9 Yes 103,000 1,4 20,600 1 10,300 1,2,4 20,600 1,2,4 X Brookfield Renewable Power Fund X 3,740,600 IC 8 5 1 10 40,000 35,000 5,000 CAE Inc. 2,857,900 IC 15 14 1 7 Yes 225,000 80,000 10,000 15,000 25,000² X X Calfrac Well Services Ltd. 1,115,536 IC 7 6 0 5 Yes 450,700 170,350 1,500 1,500 2,500 2 5,000 10,000² X Calloway Real Estate Investment Trust X 4,373,522 9 6 0 7 Yes 25,000 54 1,000 1,000 1,500 2 5,000 10,000² 7,500 33 X Cameco Corporation 7,671,368 IC 12 10 2 8 Yes 340,000 140,000 4 1,500 4 5,000 4 1,500 4 2,000 2,4 11,000 4 20,000 2,4,5 X Canaccord Financial Inc. 5,110,372 EC, LD 15 6 0 4 100,000 1,500 40,000 1,500 10,000 20,000 ² XCanada Bread Company, Limited 1,032,139 NIC 8 3 1 12 120,000 1,500 1,500 1,000 112 10,000 15,000 ² Canadian Apartment Properties Real Estate Investment Trust X 2,353,420 NIC, LD 7 5 0 9 Yes 75,000 53 55,000 53 10,000 7,000 X Canadian Imperial Bank of Commerce 352,040,000 IC 16 15 4 5 Yes 375,000 100,000 2,000 5,000 31 2,000 25,000 31 40,000 2,31 X X Canadian National Railway Company 25,206,000 IC 11 10 2 11 Yes 769,788 257,774 1,545 3,605 1,545 19,054 X X Canadian Natural Resources Limited 42,669,000 EC 14 10 1 9 Yes 192,205 1,500 4,500 1,500 7,500 15,000 ² X X Canadian Oil Sands Limited 7,016,000 IC 9 8 0 8 Yes 321,101 155,371 1,500 4,000 7,000 2 1,500 8,000 34 20,000 ² 12,000 33 X Canadian Pacific Railway Limited 13,675,900 IC 13 12 3 6 Yes 330,000 140,000 4 1,500 4 3,500 4 7,000 2,4 1,500 4 10,500 4 15,500 ² X X Canadian Real Estate Investment Trust X 2,164,585 IC 8 7 0 6 Yes 96,500 58 45,000 58 1,600 1,600 5,000 10,000 ² X Canadian Tire Corporation, Limited 8,764,100 IC 16 11 2 7 Yes 344,000 120,000 2,000 2,000 2,750 2 11,000 30,000 ² X Canadian Utilities Limited 9,415,300 NIC, LD 12 8 3 9 Yes 175,000 140,000 2,000 35 50,000 7,500 2 1,500 8,500 20,000 ² X X Canadian Western Bank 12,701,691 IC 11 10 1 16 Yes 120,000 80,000 1,500 4,000 8,000 2 1,500 3,000 2 7,500 15,000 ² X X Canfor Corporation 2,778,300 IC 9 7 0 11 Yes 128,075 48,075 1,000 32 3,000 1,000 32 6,000 X

Corporate Board Governance and Director Compensation in Canada A Review of 2011 | 89
Average Non- Number of Number of Term **Director Executive Lead Committee Chair Fee Stock Component Assets *Board Number of Independent Female Served Shareholding Chair Board Board Director Name Trust ($000) Leadership Directors Directors Directors (years) Guideline? Retainer Retainer Meeting Fee Retainer Committee Retainer Committee Meeting Fee Regular: Retainer Bold: Meeting Fees Req’d Elect Options
All amounts include cash and the value of shares and/or share units.
Aberdeen International Inc. 168,295 EC 7 5 0 3 25,000 125 XACE Aviation Holdings Inc. 481,000 CC 9 7 0 4 120,000 5,000 10,000 49 10,000 20,000 49 Advantage Oil and Gas Ltd. 1,842,571 IC 9 7 2 6 396,640 59 230,272 59 X Aecon Group Inc. 2,090,838 CC, LD 8 6 0 13 Yes 50,000 1,500 4,000 1,500 6,000 Ag Growth International Inc. 391,563 IC 5 4 0 4 Yes 45,000 35,000 1,500 1,500 5,000 10,000 ² X X AGF Management Limited 5,253,867 CC, LD 8 5 1 10 Yes 45,000 20,000 2,000 4,000 2 3,000 14 4,000 15,000 ² 6,000 14 X Agnico-Eagle Mines Limited 5,667,058¹ IC 11 9 1 9 Yes 240,000 115,000 10,000 25,000 ² XAgrium Inc. 13,098,510¹ IC 11 10 2 6 Yes 350,200 1 164,800 1 1,030 1 3,605 1 1,030 1 1,545 1,2 6,695 1 15,450 1,2 10,300 1,5 X X Air Canada 10,544,000 IC 10 9 0 3 Yes 325,000 120,000 5,000 10,000 43,49 10,000 20,000 43,49 X Alamos Gold Inc. 544,234¹ IC 7 6 0 4 Yes 40,000 18,000 1,000 1,000 6,000 10,600 ² XAlimentation Couche-Tard Inc. 4,119,588¹ NIC, LD 10 6 1 13 Yes 229,500 47,700 1,530 28,875 3,060 1,530 2,040 2 5,775 11,295 ² X X Allied Properties Real Estate Investment Trust X 1,258,511 IC 7 6 0 7 60,000 45,000 2,500 5,000 ² XAltaGas Ltd. 2,751,700 CC, LD 9 8 0 5 Yes 57,518 18 1,250 60,000 3,500 1,000 8,250 18,500 ² X ARC Energy Trust X 4,946,500 IC 9 8 1 8 Yes 152,055 45 52,055 45 6,028 12,500 30,000 ² 22,500 5 X Artis Real Estate Investment Trust X 2,149,938 IC 7 5 0 6 Yes 65,000 45,000 2,000 76 2,000 2,000 76 5,000 15,000 ² XAstral Media Inc. 2,477,552 EC, LD 14 10 2 19 Yes 50,000 121 15,000 7,500 15,000 ² X ATCO Ltd. 10,239,800 NIC, LD 9 6 1 17 Yes 175,000 140,000 4 2,000 4,35 50,000 7,500 2 1,500 4 8,500 20,000 ² X X Athabasca Oil Sands Corp. 2,566,822 IC 6 5 0 4 35,000 6,000 Atlantic Power Corporation 1,043,402¹ IC 6 5 1 4 Yes 41,200 1 1,545 1 1,545 1 10,300 1,2,14 X Atrium Innovations Inc. 812,125¹ IC 10 8 1 5 110,000 40,000 1,500 1,500 7,000 10,000 ² Aurizon Mines Ltd. 340,686 CC, LD 9 7 1 11 Yes 20,000 1,200 6,000 1,200 6,000 10,000 ² XBank of Montreal 411,640,000 IC 17 16 4 9 Yes 300,000 100,000 2,000 1,500 25,000 40,000 ² 15,000 19 X X Bank of Nova Scotia 526,657,000 IC 14 13 3 10 Yes 300,000 120,000 2,000 3,000 6,000 16 2,000 20,000 40,000 16 25,000 10 X X Bankers Petroleum Ltd. 481,436¹ IC 7 6 0 4 30,000 10,000 XBarrick Gold Corporation 34,321,660¹ EC, LD 14 9 0 13 Yes 169,950 1 30,900¹ 3,090 1,2 10,300 1 20,600 1,2 X X Baytex Energy Corp. 2,047,212 EC, LD 8 6 0 8 Yes 30,000 1,500 20,000 1,500 5,000 20,000 ² BCE Inc. 39,276,000 IC 13 12 3 5 Yes 350,000 160,000 40 40 40 X X Bell Aliant Regional Communications Income Fund X 3,386,700 NIC, LD 9 3 1 5 Yes 120,000 80,000 72 30,000 37,41 Birchcliff Energy Ltd. 995,391 IC 4 3 0 5 40,000 1,000 1,000 XBird Construction Income Fund X 482,714 NIC, LD 8 5 0 12 105,000 28,000 1,500 7,800 5,000 6,500 11,000 ² Blackpearl Resources Inc. 468,309 NIC, LD 5 3 0 2 25,000 XBMTC Group Inc. 347,502 CC, LD 9 5 1 13 Yes 75,000 X XBoardwalk Real Estate Investment Trust X 2,326,802 CC, LD 5 4 0 7 Yes 25,000 60 1,500 60 20,000 60 5,000 60 1,500 60 8,000 60 15,000 2,60 X Bombardier Inc. 24,132,900¹ NIC, LD 14 9 2 14 Yes 600,000 80,000 4 2,500 4 5,000 4 2,500 4 10,000 4 20,000 ² X Bonavista Energy Trust X 3,342,988 CC, LD 8 6 1 9 Yes 117,818 50 1,400 15,000 4,000 7,500 2 1,400 6,000 15,000² X Bonterra Energy Corp. 335,144 CC 4 3 0 20 7,800 114 BPO Properties Ltd. 4,665,100 IC 3 2 0 8 75,000 Breakwater Resources Ltd. 731,356 IC 8 7 1 5 60,000 40,000 1,000 1,000 5,000 15,000 ² XBrick Group Ltd. 535,991 IC 7 5 0 3 Yes 77,500 116 57,500 116 1,250 1,250 6,000 10,000 ² X X Brookfield Asset Management Inc. 78,131,000¹ IC 16 12 1 12 Yes 350,000 150,000 15,000 25,000 ² X X Brookfield Properties Corporation 21,032,600¹ EC, LD 9 5 1 9 Yes 103,000 1,4 20,600 1 10,300 1,2,4 20,600 1,2,4 X Brookfield Renewable Power Fund X 3,740,600 IC 8 5 1 10 40,000 35,000 5,000 CAE Inc. 2,857,900 IC 15 14 1 7 Yes 225,000 80,000 10,000 15,000 25,000² X X Calfrac Well Services Ltd. 1,115,536 IC 7 6 0 5 Yes 450,700 170,350 1,500 1,500 2,500 2 5,000 10,000² X Calloway Real Estate Investment Trust X 4,373,522 9 6 0 7 Yes 25,000 54 1,000 1,000 1,500 2 5,000 10,000² 7,500 33 X Cameco Corporation 7,671,368 IC 12 10 2 8 Yes 340,000 140,000 4 1,500 4 5,000 4 1,500 4 2,000 2,4 11,000 4 20,000 2,4,5 X Canaccord Financial Inc. 5,110,372 EC, LD 15 6 0 4 100,000 1,500 40,000 1,500 10,000 20,000 ² XCanada Bread Company, Limited 1,032,139 NIC 8 3 1 12 120,000 1,500 1,500 1,000 112 10,000 15,000 ² Canadian Apartment Properties Real Estate Investment Trust X 2,353,420 NIC, LD 7 5 0 9 Yes 75,000 53 55,000 53 10,000 7,000 X Canadian Imperial Bank of Commerce 352,040,000 IC 16 15 4 5 Yes 375,000 100,000 2,000 5,000 31 2,000 25,000 31 40,000 2,31 X X Canadian National Railway Company 25,206,000 IC 11 10 2 11 Yes 769,788 257,774 1,545 3,605 1,545 19,054 X X Canadian Natural Resources Limited 42,669,000 EC 14 10 1 9 Yes 192,205 1,500 4,500 1,500 7,500 15,000 ² X X Canadian Oil Sands Limited 7,016,000 IC 9 8 0 8 Yes 321,101 155,371 1,500 4,000 7,000 2 1,500 8,000 34 20,000 ² 12,000 33 X Canadian Pacific Railway Limited 13,675,900 IC 13 12 3 6 Yes 330,000 140,000 4 1,500 4 3,500 4 7,000 2,4 1,500 4 10,500 4 15,500 ² X X Canadian Real Estate Investment Trust X 2,164,585 IC 8 7 0 6 Yes 96,500 58 45,000 58 1,600 1,600 5,000 10,000 ² X Canadian Tire Corporation, Limited 8,764,100 IC 16 11 2 7 Yes 344,000 120,000 2,000 2,000 2,750 2 11,000 30,000 ² X Canadian Utilities Limited 9,415,300 NIC, LD 12 8 3 9 Yes 175,000 140,000 2,000 35 50,000 7,500 2 1,500 8,500 20,000 ² X X Canadian Western Bank 12,701,691 IC 11 10 1 16 Yes 120,000 80,000 1,500 4,000 8,000 2 1,500 3,000 2 7,500 15,000 ² X X Canfor Corporation 2,778,300 IC 9 7 0 11 Yes 128,075 48,075 1,000 32 3,000 1,000 32 6,000 X
Stock Component: “Options” indicates if directors received stock options. “Req’d” indicates if directors are required to take all or a portion of their compensation in shares or share equivalents. “Elect” indicates if directors may choose to take all or a portion of their compensation in shares or share equivalents.

90 | Corporate Board Governance and Director Compensation in Canada A Review of 2011
** Includes guidelines to hold any type of shares or share units. Non-bold are specific guidelines. Bold are implicit shareholding policies where directors receive a mandatory portion of their compensation in share units, and those share units must be held as long as the directors is a member of that board.
* CC = combined CEO/Chair, IC = Independent Chair, NIC = Non-Executive, Non-Independent Chair, EC = Executive Chair, LD = Lead Director (if blank, there is no board chair or lead director)
Average Non- Number of Number of Term **Director Executive Lead Committee Chair Fee Stock Component Assets *Board Number of Independent Female Served Shareholding Chair Board Board Director Name Trust ($000) Leadership Directors Directors Directors (years) Guideline? Retainer Retainer Meeting Fee Retainer Committee Retainer Committee Meeting Fee Regular: Retainer Bold: Meeting Fees Req’d Elect Options
Canyon Services Group Inc. 271,310 IC 7 5 0 3 Yes 42,875 37,875 1,000 1,000 2,000 5,000 ² X Capstone Mining Corp. 650,677 1 IC 8 6 1 3 60,000 30,000 1,200 1,200 7,500 20 15,000 ² XCardiome Pharma Corp. 84,794 1 NIC, LD 7 5 1 6 103,000 1 25,750 1 3,090 ¹ 77,250 ¹ 3,090 1 15,450 1 25,750 1,2,14 XCascades Inc. 3,724,000 EC, LD 13 7 1 21 Yes 50,909 1,500 2,000 2,000 10,000 ² 2,500 2 X Catalyst Paper Corporation 1,696,200 IC 10 9 0 2 Yes 160,000 60,000 2,000 5,000 1,500 2,000 2 10,000 20,000 ² X CCL Industries Inc. 1,622,411 EC, LD 10 7 0 9 Yes 69,620 4 2,000 4 12,500 2,000 4 7,500 4 12,500 ² X X Celestica Inc. 3,196,708 1 IC 7 5 1 6 Yes 319,300 1 190,550 1 2,575 1,99 2,575 1,99 10,300 1,14,28 20,600 1,2 X X Celtic Exploration Ltd. 723,025 IC 5 4 0 8 XCenovus Energy Inc. 22,095,000 IC 9 8 1 1 Yes 478,750 228,750 1,500 1,500 7,500 15,000 ² X X Centerra Gold Inc. 1,438,572 1 IC 11 8 1 3 Yes 45,000 71 1,250 1,250 1,750 2 3,000 6,000 ² X X CGI Group Inc. 4,607,191 EC, LD 14 10 2 13 Yes 50,000 4 1,500 4 15,000 2,000 4 2,500 4 10,000 12,500 ² X XChartwell Seniors Housing Real Estate Investment Trust X 2,676,767 IC 8 6 2 6 Yes 80,000 51,52 32,500 51,52 1,500 52 1,500 52 12,500 51,52 X Chemtrade Logistics Income Fund X 485,911 IC 4 4 0 7 Yes 40,000 1,500 1,500 X Chorus Aviation Inc. 1,211,877 IC 9 8 1 2 91,250 104 50,000 104 2,500 5,000 2 7,500 15,000 ² Churchill Corporation (The) 876,099 IC 10 9 0 6 Yes 220,000 110,000 1,500 1,500 5,000 10,000 ² X CI Financial Corp. 3,265,266 EC, LD 9 6 0 10 Yes 82,500 101 20,000 ² Cineplex Galaxy Income Fund X 1,291,668 IC 9 8 2 1 75,000 50,000 15,000 ² Cinram International Income Fund X 657,980 1 IC 7 6 0 2 Yes 140,000 40,000 5,000 10,000 ² X CML Healthcare Income Fund X 932,806 IC 7 7 1 3 80,000 35,000 98 1,000 1,000 5,000 10,000 ² Cogeco Cable Inc. 2,702,819 IC 8 7 1 10 Yes 75,000 38,000 3 1,000 1,000 1,500 2 6,000 7,500 ² X COGECO Inc. 2,744,656 IC 8 7 1 10 Yes 75,000 38,000 3 1,000 1,000 1,500 2 6,000 7,500 ² X Colossus Minerals Inc. 165,720 CC 6 4 0 3 22,000 1,000 1,000 2,000 2 5,000 10,000 ² XCominar Real Estate Investment Trust X 1,985,900 IC 9 5 1 8 Yes 75,000 25,000 1,500 1,500 5,000 10,000 ² Corus Entertainment Inc. 2,059,255 NIC, LD 10 7 5 8 Yes 35,000 1,500 5,000 1,000 1,500 2 6,000 10,000 ² X Cott Corporation 1,575,076 1 IC, LD 11 10 1 4 Yes 236,900 1 133,900 1,30 30,900 1,30 10,300 1,30 15,450 1,2,30 X X Craig Wireless Systems Ltd. 63,367 EC 4 2 0 3 25,000 1,000 500 1,000 2 4,000 7,500 ² XCrescent Point Energy Corp. 7,866,102 IC 7 5 0 7 Yes 453,251 73 390,030 73 1,500 1,500 4,000 10,000 ² X Crew Energy Inc. 998,070 IC 5 4 0 5 XDavis + Henderson Income Fund X 933,521 IC 6 6 1 6 Yes 65,000 30,000 1,500 1,200 4,000 8,000 ² Daylight Energy Ltd. 2,193,568 IC 8 7 0 5 Yes 215,920 128,320 2,000 10,000 2,000 20,000 30,000 ² X Denison Mines Corp. 981,048 1 NIC, LD 9 5 1 7 Yes 60,000 30,000 1,200 15,000 1,200 5,000 10,000 ² XDetour Gold Corporation 1,230,264 EC, LD 10 7 1 2 20,000 1,500 15,000 1,500 5,000 10,000 ² XDollarama Inc. 1,311,131 CC, LD 8 4 0 5 30,000 1,000 5,000 XDorel Industries Inc. 2,158,839 1 LD 10 6 1 13 Yes 40,000 1,500 20,000 2,000 3,000 2 1,500 5,000 10,000 ² X Dundee Corporation 4,058,453 IC 12 9 0 12 Yes 415,000 61 65,000 1,500 5,000 2 1,500 10,000 35,000 ² 15,000 14 X X Dundee Precious Metals Inc. 813,352 IC 11 7 0 13 Yes 45,000 127 127 127 X X XDundee Real Estate Investment Trust X 2,316,824 NIC 11 7 1 6 Yes 193,600 57,440 1,500 1,500 17,480 14,47,48 22,480 2,48 X X DundeeWealth Inc. 2,419,651 NIC, LD 12 10 2 6 Yes 245,000 45,000 1,500 125,000 5,000 2 1,500 15,000 35,000 ² 10,000 41 X E-L Financial Corporation Limited 9,267,419 CC 10 5 0 8 20,000 1,180 1,180 3,250 ² Eastern Platinum Limited 1,160,784 1 IC 8 6 0 4 280,000 60,000 XEldorado Gold Corporation 3,893,306 1 IC 8 7 0 7 Yes 225,000 103 170,000 103 1,500 1,500 8,000 12,000 ² X XEmera Inc. 6,329,100 IC 12 11 4 3 Yes 220,000 102 60,000 1,750 3,000 5,000 2 1,750 8,000 15,000 2,37 X X Empire Company Limited 6,555,400 IC 17 10 2 13 Yes 215,000 53,750 4 2,000 4 3,000 4 5,000 2,4 2,000 4 10,000 15,000 2,10 X Enbridge Inc. 30,120,000 IC 12 11 2 7 Yes 450,000 4 210,000 4 10,000 4 25,000 ² 15,000 5 X X EnCana Corporation 35,040,600 1 IC 11 10 3 5 Yes 591,100 371,100 1,500 1,500 7,500 15,000 ² X X Enerplus Resources Fund X 5,835,172 IC 12 11 0 6 Yes 220,000 115,000 1,500 1,500 10,000 20,000 23 X Ensign Energy Services Inc. 2,244,220 NIC 9 6 1 13 Yes 72,361 1,250 2,500 1,250 5,000 10,000 ² X X Equinox Minerals Limited 3,339,564 1 IC 6 5 0 4 Yes 300,000 150,000 15,000 20,000 ² X X Equitable Group Inc. 4,453,466 IC 9 8 1 5 Yes 92,229 49,729 1,200 115 1,200 115 5,000 15,000 ² X European Goldfields Limited 740,377 1 CC 8 4 0 3 Yes 79,500 100 7,950 100 X Evertz Technologies Limited 409,862 EC 5 3 0 8 12,000 800 3,000 800 5,000 10,000 ² XExtendicare Real Estate Investment Trust X 1,698,010 IC 11 10 1 13 Yes 154,000 63 54,000 63 2,000 5,000 2 2,000 5,000 25,000 ² 10,000 62 X Fairfax Financial Holdings Limited 32,690,346 1 CC, LD 6 5 0 7 Yes 75,000 10,000 5,000 10,000 ² Finning International Inc. 3,613,600 NIC, LD 10 8 1 5 Yes 280,000 100,000 1,500 40,000 3,000 6,000 2 1,500 10,000 20,000 ² X X First Capital Realty Inc. 4,120,713 EC 8 6 1 8 Yes 66,264 1,500 5,000 2 1,500 7,500 33 10,000 ² X First Majestic Silver Corp. 321,468 IC 7 5 0 8 58,300 30,800 1,000 1,000 1,200 2 5,500 16,500 ² XFirst Quantum Minerals Ltd. 5,416,358 1 CC, LD 9 6 0 7 Yes 123,600 1 20,600 ¹ 20,600 1,2,14 FirstService Corporation 1,163,427 1 IC 8 6 0 12 Yes 87,500 35,000 1,750 1,750 5,000 10,000 ² XFlint Energy Services Ltd. 983,622 IC 8 7 0 5 Yes 185,000 100,000 1,500 1,500 5,000 7,500² X Fort Chicago Energy Partners LP 3,118,579 IC 9 8 1 7 91,486 96 61,486 4,96 1,500 4 1,500 4 7,500 15,000 2,4 X

Corporate Board Governance and Director Compensation in Canada A Review of 2011 | 91
Average Non- Number of Number of Term **Director Executive Lead Committee Chair Fee Stock Component Assets *Board Number of Independent Female Served Shareholding Chair Board Board Director Name Trust ($000) Leadership Directors Directors Directors (years) Guideline? Retainer Retainer Meeting Fee Retainer Committee Retainer Committee Meeting Fee Regular: Retainer Bold: Meeting Fees Req’d Elect Options
All amounts include cash and the value of shares and/or share units.
Canyon Services Group Inc. 271,310 IC 7 5 0 3 Yes 42,875 37,875 1,000 1,000 2,000 5,000 ² X Capstone Mining Corp. 650,677 1 IC 8 6 1 3 60,000 30,000 1,200 1,200 7,500 20 15,000 ² XCardiome Pharma Corp. 84,794 1 NIC, LD 7 5 1 6 103,000 1 25,750 1 3,090 ¹ 77,250 ¹ 3,090 1 15,450 1 25,750 1,2,14 XCascades Inc. 3,724,000 EC, LD 13 7 1 21 Yes 50,909 1,500 2,000 2,000 10,000 ² 2,500 2 X Catalyst Paper Corporation 1,696,200 IC 10 9 0 2 Yes 160,000 60,000 2,000 5,000 1,500 2,000 2 10,000 20,000 ² X CCL Industries Inc. 1,622,411 EC, LD 10 7 0 9 Yes 69,620 4 2,000 4 12,500 2,000 4 7,500 4 12,500 ² X X Celestica Inc. 3,196,708 1 IC 7 5 1 6 Yes 319,300 1 190,550 1 2,575 1,99 2,575 1,99 10,300 1,14,28 20,600 1,2 X X Celtic Exploration Ltd. 723,025 IC 5 4 0 8 XCenovus Energy Inc. 22,095,000 IC 9 8 1 1 Yes 478,750 228,750 1,500 1,500 7,500 15,000 ² X X Centerra Gold Inc. 1,438,572 1 IC 11 8 1 3 Yes 45,000 71 1,250 1,250 1,750 2 3,000 6,000 ² X X CGI Group Inc. 4,607,191 EC, LD 14 10 2 13 Yes 50,000 4 1,500 4 15,000 2,000 4 2,500 4 10,000 12,500 ² X XChartwell Seniors Housing Real Estate Investment Trust X 2,676,767 IC 8 6 2 6 Yes 80,000 51,52 32,500 51,52 1,500 52 1,500 52 12,500 51,52 X Chemtrade Logistics Income Fund X 485,911 IC 4 4 0 7 Yes 40,000 1,500 1,500 X Chorus Aviation Inc. 1,211,877 IC 9 8 1 2 91,250 104 50,000 104 2,500 5,000 2 7,500 15,000 ² Churchill Corporation (The) 876,099 IC 10 9 0 6 Yes 220,000 110,000 1,500 1,500 5,000 10,000 ² X CI Financial Corp. 3,265,266 EC, LD 9 6 0 10 Yes 82,500 101 20,000 ² Cineplex Galaxy Income Fund X 1,291,668 IC 9 8 2 1 75,000 50,000 15,000 ² Cinram International Income Fund X 657,980 1 IC 7 6 0 2 Yes 140,000 40,000 5,000 10,000 ² X CML Healthcare Income Fund X 932,806 IC 7 7 1 3 80,000 35,000 98 1,000 1,000 5,000 10,000 ² Cogeco Cable Inc. 2,702,819 IC 8 7 1 10 Yes 75,000 38,000 3 1,000 1,000 1,500 2 6,000 7,500 ² X COGECO Inc. 2,744,656 IC 8 7 1 10 Yes 75,000 38,000 3 1,000 1,000 1,500 2 6,000 7,500 ² X Colossus Minerals Inc. 165,720 CC 6 4 0 3 22,000 1,000 1,000 2,000 2 5,000 10,000 ² XCominar Real Estate Investment Trust X 1,985,900 IC 9 5 1 8 Yes 75,000 25,000 1,500 1,500 5,000 10,000 ² Corus Entertainment Inc. 2,059,255 NIC, LD 10 7 5 8 Yes 35,000 1,500 5,000 1,000 1,500 2 6,000 10,000 ² X Cott Corporation 1,575,076 1 IC, LD 11 10 1 4 Yes 236,900 1 133,900 1,30 30,900 1,30 10,300 1,30 15,450 1,2,30 X X Craig Wireless Systems Ltd. 63,367 EC 4 2 0 3 25,000 1,000 500 1,000 2 4,000 7,500 ² XCrescent Point Energy Corp. 7,866,102 IC 7 5 0 7 Yes 453,251 73 390,030 73 1,500 1,500 4,000 10,000 ² X Crew Energy Inc. 998,070 IC 5 4 0 5 XDavis + Henderson Income Fund X 933,521 IC 6 6 1 6 Yes 65,000 30,000 1,500 1,200 4,000 8,000 ² Daylight Energy Ltd. 2,193,568 IC 8 7 0 5 Yes 215,920 128,320 2,000 10,000 2,000 20,000 30,000 ² X Denison Mines Corp. 981,048 1 NIC, LD 9 5 1 7 Yes 60,000 30,000 1,200 15,000 1,200 5,000 10,000 ² XDetour Gold Corporation 1,230,264 EC, LD 10 7 1 2 20,000 1,500 15,000 1,500 5,000 10,000 ² XDollarama Inc. 1,311,131 CC, LD 8 4 0 5 30,000 1,000 5,000 XDorel Industries Inc. 2,158,839 1 LD 10 6 1 13 Yes 40,000 1,500 20,000 2,000 3,000 2 1,500 5,000 10,000 ² X Dundee Corporation 4,058,453 IC 12 9 0 12 Yes 415,000 61 65,000 1,500 5,000 2 1,500 10,000 35,000 ² 15,000 14 X X Dundee Precious Metals Inc. 813,352 IC 11 7 0 13 Yes 45,000 127 127 127 X X XDundee Real Estate Investment Trust X 2,316,824 NIC 11 7 1 6 Yes 193,600 57,440 1,500 1,500 17,480 14,47,48 22,480 2,48 X X DundeeWealth Inc. 2,419,651 NIC, LD 12 10 2 6 Yes 245,000 45,000 1,500 125,000 5,000 2 1,500 15,000 35,000 ² 10,000 41 X E-L Financial Corporation Limited 9,267,419 CC 10 5 0 8 20,000 1,180 1,180 3,250 ² Eastern Platinum Limited 1,160,784 1 IC 8 6 0 4 280,000 60,000 XEldorado Gold Corporation 3,893,306 1 IC 8 7 0 7 Yes 225,000 103 170,000 103 1,500 1,500 8,000 12,000 ² X XEmera Inc. 6,329,100 IC 12 11 4 3 Yes 220,000 102 60,000 1,750 3,000 5,000 2 1,750 8,000 15,000 2,37 X X Empire Company Limited 6,555,400 IC 17 10 2 13 Yes 215,000 53,750 4 2,000 4 3,000 4 5,000 2,4 2,000 4 10,000 15,000 2,10 X Enbridge Inc. 30,120,000 IC 12 11 2 7 Yes 450,000 4 210,000 4 10,000 4 25,000 ² 15,000 5 X X EnCana Corporation 35,040,600 1 IC 11 10 3 5 Yes 591,100 371,100 1,500 1,500 7,500 15,000 ² X X Enerplus Resources Fund X 5,835,172 IC 12 11 0 6 Yes 220,000 115,000 1,500 1,500 10,000 20,000 23 X Ensign Energy Services Inc. 2,244,220 NIC 9 6 1 13 Yes 72,361 1,250 2,500 1,250 5,000 10,000 ² X X Equinox Minerals Limited 3,339,564 1 IC 6 5 0 4 Yes 300,000 150,000 15,000 20,000 ² X X Equitable Group Inc. 4,453,466 IC 9 8 1 5 Yes 92,229 49,729 1,200 115 1,200 115 5,000 15,000 ² X European Goldfields Limited 740,377 1 CC 8 4 0 3 Yes 79,500 100 7,950 100 X Evertz Technologies Limited 409,862 EC 5 3 0 8 12,000 800 3,000 800 5,000 10,000 ² XExtendicare Real Estate Investment Trust X 1,698,010 IC 11 10 1 13 Yes 154,000 63 54,000 63 2,000 5,000 2 2,000 5,000 25,000 ² 10,000 62 X Fairfax Financial Holdings Limited 32,690,346 1 CC, LD 6 5 0 7 Yes 75,000 10,000 5,000 10,000 ² Finning International Inc. 3,613,600 NIC, LD 10 8 1 5 Yes 280,000 100,000 1,500 40,000 3,000 6,000 2 1,500 10,000 20,000 ² X X First Capital Realty Inc. 4,120,713 EC 8 6 1 8 Yes 66,264 1,500 5,000 2 1,500 7,500 33 10,000 ² X First Majestic Silver Corp. 321,468 IC 7 5 0 8 58,300 30,800 1,000 1,000 1,200 2 5,500 16,500 ² XFirst Quantum Minerals Ltd. 5,416,358 1 CC, LD 9 6 0 7 Yes 123,600 1 20,600 ¹ 20,600 1,2,14 FirstService Corporation 1,163,427 1 IC 8 6 0 12 Yes 87,500 35,000 1,750 1,750 5,000 10,000 ² XFlint Energy Services Ltd. 983,622 IC 8 7 0 5 Yes 185,000 100,000 1,500 1,500 5,000 7,500² X Fort Chicago Energy Partners LP 3,118,579 IC 9 8 1 7 91,486 96 61,486 4,96 1,500 4 1,500 4 7,500 15,000 2,4 X
Stock Component: “Options” indicates if directors received stock options. “Req’d” indicates if directors are required to take all or a portion of their compensation in shares or share equivalents. “Elect” indicates if directors may choose to take all or a portion of their compensation in shares or share equivalents.

92 | Corporate Board Governance and Director Compensation in Canada A Review of 2011
** Includes guidelines to hold any type of shares or share units. Non-bold are specific guidelines. Bold are implicit shareholding policies where directors receive a mandatory portion of their compensation in share units, and those share units must be held as long as the directors is a member of that board.
* CC = combined CEO/Chair, IC = Independent Chair, NIC = Non-Executive, Non-Independent Chair, EC = Executive Chair, LD = Lead Director (if blank, there is no board chair or lead director)
Average Non- Number of Number of Term **Director Executive Lead Committee Chair Fee Stock Component Assets *Board Number of Independent Female Served Shareholding Chair Board Board Director Name Trust ($000) Leadership Directors Directors Directors (years) Guideline? Retainer Retainer Meeting Fee Retainer Committee Retainer Committee Meeting Fee Regular: Retainer Bold: Meeting Fees Req’d Elect Options
Fortis Inc. 12,903,000 IC 11 10 1 5 Yes 190,000 75,000 1,500 1,500 15,000 X X Fortress Paper Ltd. 290,766 CC 6 4 0 2 Yes 42,000 4,500 124 2,000 1,000 5,000 10,000 ² X X Forzani Group Ltd. (The) 740,115 NIC, LD 8 6 0 9 Yes 319,700 68,940 1,500 15,000 1,500 7,500 19 15,000 ² X Franco-Nevada Corporation 2,067,206 ¹ IC 7 6 0 3 Yes 40,000 30,000 10,000 X Freehold Royalties Ltd. 407,460 IC 8 5 0 11 Yes 90,000 50,000 1,500 1,500 7,000 14,000 ² X Gabriel Resources Ltd. 661,892 NIC, LD 10 7 0 2 75,000 40,000 1,000 2 6,000 10,000 ² 7,500 14 XGammon Gold Inc. 843,970 IC 9 7 0 1 Yes 175,000 75,000 10,000 15,000 2,14 X X XGenesis Land Development Corp. 354,866 IC 7 6 0 2 128 128 128 128 128 128 XGenworth MI Canada Inc. 5,398,201 CC, LD 9 3 0 1 Yes 55,000 1,500 5,000 10,000 ² X X George Weston Limited 20,854,000 EC, LD 12 8 2 9 Yes 100,000 2,000 50,000 4,000 5,000 2 2,000 10,000 43 30,000 ² 15,000 39 25,000 41 X X Gildan Activewear Inc. 1,360,836 ¹ IC 9 8 1 8 Yes 206,000 ¹ 72,100 ¹ 1,288 ¹ 5,150 ¹ 1,288 ¹ 9,270 ¹ 20,600 1,2 15,450 1,5 X X Gluskin Sheff + Associates Inc. 117,337 EC 10 7 1 9 Yes 50,000 1,500 1,500 25,000 X GMP Capital Inc. 1,441,612 IC 10 7 0 5 Yes 80,000 50,000 5,000 10,000 30,000 ² Goldcorp Inc. 29,032,610 ¹ NIC, LD 10 8 1 4 Yes 902,585 1,80 255,565 1,80 1,545 ¹ 103,000 ¹ 1,545 ¹ 10,300 ¹ 20,600 1,2 15,450 1,14 X Golden Star Resources Ltd. 825,499 ¹ IC 7 6 0 7 175,100 ¹ 113,300 ¹ 10,300 ¹ 20,600 1,2 Grande Cache Coal Corporation 434,379 IC 6 5 0 7 50,000 30,000 1,500 1,500 10,000 15,000 ² XGreat Basin Gold Ltd. 818,043 NIC 8 5 0 7 50,000 2,000 23 5,000 14,68 7,500 23 3,000 19 XGreat-West Lifeco Inc. 131,514,000 NIC 19 10 2 7 Yes 198,288 98,288 30 2,000 30 3,000 2,30 2,000 30 10,000 29 30,000 ² 50,000 28 X X Groupe Aeroplan Inc. 5,146,052 IC 9 8 1 3 Yes 200,000 61,009 1,500 2,500 5,000 2 1,500 7,500 15,000 ² X X Guyana Goldfields Inc. 165,464 LD 7 4 0 6 20,000 74 H&R Real Estate Investment Trust X 5,546,975 IC 6 5 0 13 Yes 45,000 2,000 70 22,500 2,000 70 5,000 33,69 10,000 ² XHarry Winston Diamond Corporation 1,666,037 ¹ CC, LD 9 7 2 5 Yes 77,746 1,500 1,500 5,000 15,000 ² X X High River Gold Mines Ltd. 812,332 IC 6 3 0 1 39,375 28,125 1,125 2,250 7,500 2 1,125 4,500 16,875 ² Home Capital Group Inc. 7,712,239 IC 8 7 2 10 Yes 120,000 60,000 5,000 30,000 2,38 X HudBay Minerals Inc. 2,173,086 IC 8 7 0 1 Yes 335,000 80,000 1,500 1,500 10,000 30,000 ² X X Husky Energy Inc. 29,133,000 NIC 15 10 2 7 Yes 85,000 5,000 10,000 2 7,000 15,000 ² X Iamgold Corporation 3,599,795 ¹ IC 10 9 0 8 Yes 220,000 46,120 2,500 2,500 3,000 X IESI-BFC Ltd. 3,492,202 ¹ IC 7 5 0 5 Yes 200,000 135,000 10,000 14,19 20,000 ² X IGM Financial Inc. 8,892,563 NIC 17 7 2 10 Yes 175,000 75,000 1,750 2,000 2 1,750 5,000 20,000 ² X X IMAX Corporation 359,561¹ NIC 9 7 0 10 200,000 20,000 111 1,500 1,200 8,000 ² X XImperial Metals Corporation 440,041 IC, LD 5 4 0 6 Yes 76,000 122 40,000 1,000 1,000 X Imperial Oil Limited 20,580,000 CC 7 5 2 5 Yes 174,640 26 25 20,000 24 25 10,000 X Indigo Books & Music Inc. 516,180 CC, LD 11 9 3 5 Yes 20,000 123 2,000 123 3,000 123 2,000 123 7,500 123 15,000 2,123 3,500 123 X Industrial Alliance Insurance and Financial Services Inc. 20,102,000 IC 13 12 3 9 Yes 200,000 45,000 1,500 3,000 5,000 2 1,500 3,000 10,000 ² 7,500 20,69 X Inmet Mining Corporation 3,262,576 IC 11 10 0 7 Yes 325,000 115,000 1,500 1,500 10,000 25,000 ² X X InnVest Real Estate Investment Trust X 1,800,033 NIC 6 4 0 7 55,000 45,000 1,000 1,000 10,000 12,500 ² X Intact Financial Corporation 12,148,900 IC 11 10 3 6 Yes 225,000 60,000 1,500 3,000 23 1,500 5,000 10,000 10,23 X X Inter Pipeline Fund X 4,712,200 NIC, LD 9 5 0 4 Yes 125,000 1,500 1,500 10,000 15,000 ² X Ithaca Energy Inc. 578,706 ¹ IC 8 7 0 3 95,508 55,713 XIvanhoe Energy Inc. 421,872 ¹ CC, LD 9 5 0 5 Yes 41,200 ¹ 1,030 ¹ 41,200 ¹ 1,030¹ 10,300 1,2,27 XIvanhoe Mines Ltd. 3,314,952 ¹ CC, LD 14 12 1 5 Yes 40,000 2,000 150,000 2,000 20,000 19 40,000 2,97 XJaguar Mining Inc. 596,654 ¹ IC 6 4 0 6 Yes 202,500 103,500 7,500 4,500 39 9,500 39 17,500 ² 12,500 41 15,000 14 X X Jean Coutu Group (PJC) Inc. 1,045,400 EC 13 7 5 15 Yes 25,000 2,000 2,500 2,000 5,000 10,000 ² X Just Energy Group Inc. 1,588,644 EC, LD 9 5 1 6 Yes 50,000 2,000 50,000 5,000 2 2,000 5,000 15,000 ² 10,000 9,75 X X Keyera Facilities Income Fund X 1,972,004 IC 8 7 1 6 Yes 130,000 65,000 15,000 30,000 45,000 ² X Kinross Gold Corporation 16,889,013 ¹ IC 11 9 1 7 Yes 385,000 160,000 15,000 20,000 23 30,000 70,000 23 X Kirkland Lake Gold Inc. 162,207 EC 7 3 0 6 12,000 2,000 14 5,000 2 6,000 14 10,000 ² Labrador Iron Ore Royalty Corporation 680,791 IC 7 4 0 12 50,000 25,000 1,200 1,200 10,000 20,000 ² Lake Shore Gold Corp. 1,124,318 IC 7 6 0 3 Yes 75,000 50,000 1,500 1,500 5,000 15,000 ² XLaurentian Bank of Canada 23,800,003 IC 13 12 5 5 Yes 160,000 60,000 6,000 8 7,500 X Linamar Corporation 1,807,600 EC 6 3 1 18 Yes 30,000 1,500 1,000 1,500 2,500 Lions Gate Entertainment Corp. 1,755,591 ¹ CC, LD 12 10 1 8 Yes 41,200 ¹ 1,442 ¹ 53,560 ¹ 1,442 ¹ 10,300¹ 15,450 1,2 X X Loblaw Companies Limited 15,919,000 EC, LD 13 8 2 5 Yes 100,000 2,000 50,000 4,000 5,000 2 2,000 10,000 43 30,000 ² 15,000 42 25,000 41 X X Lundin Mining Corporation 3,948,390 ¹ NIC, LD 8 6 0 9 200,000 90,000 5,000 15,000 2 10,000 5 10,000 25,000 ² 20,000 5 MacDonald, Dettwiler and Associates Ltd. 1,371,834 IC 9 8 0 6 Yes 175,000 77,500 4 1,500 4 5,000 4 1,500 2,500 2,4 10,000 17,500 ² X X Magna International Inc. 14,314,940 ¹ NIC, LD 9 7 1 12 Yes 206,000 ¹ 154,500 ¹ 2,060 ¹ 257,500 ¹ 25,750 ¹ 2,060 ¹ 51,500 ¹ 36,050 1,39 X X XMajor Drilling Group International Inc. 482,265 IC 8 7 2 5 Yes 150,000 50,000 2,000 2,000 5,000 15,000 ² 10,000 14 X XManitoba Telecom Services Inc. 2,875,300 IC 10 9 3 8 Yes 275,000 83 120,000 83 20,000 55,000 ² X X Manulife Financial Corporation 217,672,000 IC 18 17 3 9 Yes 350,000 110,000 4 2,000 4 5,000 4 8,000 2,4,9,37 1,500 4 5,000 46 30,000 2,4,9,37 X Maple Leaf Foods Inc. 2,996,795 NIC, LD 12 9 2 10 Yes 300,000 120,000 30,000 1,500 10,000 15,000 2 X

Corporate Board Governance and Director Compensation in Canada A Review of 2011 | 93
Average Non- Number of Number of Term **Director Executive Lead Committee Chair Fee Stock Component Assets *Board Number of Independent Female Served Shareholding Chair Board Board Director Name Trust ($000) Leadership Directors Directors Directors (years) Guideline? Retainer Retainer Meeting Fee Retainer Committee Retainer Committee Meeting Fee Regular: Retainer Bold: Meeting Fees Req’d Elect Options
All amounts include cash and the value of shares and/or share units.
Fortis Inc. 12,903,000 IC 11 10 1 5 Yes 190,000 75,000 1,500 1,500 15,000 X X Fortress Paper Ltd. 290,766 CC 6 4 0 2 Yes 42,000 4,500 124 2,000 1,000 5,000 10,000 ² X X Forzani Group Ltd. (The) 740,115 NIC, LD 8 6 0 9 Yes 319,700 68,940 1,500 15,000 1,500 7,500 19 15,000 ² X Franco-Nevada Corporation 2,067,206 ¹ IC 7 6 0 3 Yes 40,000 30,000 10,000 X Freehold Royalties Ltd. 407,460 IC 8 5 0 11 Yes 90,000 50,000 1,500 1,500 7,000 14,000 ² X Gabriel Resources Ltd. 661,892 NIC, LD 10 7 0 2 75,000 40,000 1,000 2 6,000 10,000 ² 7,500 14 XGammon Gold Inc. 843,970 IC 9 7 0 1 Yes 175,000 75,000 10,000 15,000 2,14 X X XGenesis Land Development Corp. 354,866 IC 7 6 0 2 128 128 128 128 128 128 XGenworth MI Canada Inc. 5,398,201 CC, LD 9 3 0 1 Yes 55,000 1,500 5,000 10,000 ² X X George Weston Limited 20,854,000 EC, LD 12 8 2 9 Yes 100,000 2,000 50,000 4,000 5,000 2 2,000 10,000 43 30,000 ² 15,000 39 25,000 41 X X Gildan Activewear Inc. 1,360,836 ¹ IC 9 8 1 8 Yes 206,000 ¹ 72,100 ¹ 1,288 ¹ 5,150 ¹ 1,288 ¹ 9,270 ¹ 20,600 1,2 15,450 1,5 X X Gluskin Sheff + Associates Inc. 117,337 EC 10 7 1 9 Yes 50,000 1,500 1,500 25,000 X GMP Capital Inc. 1,441,612 IC 10 7 0 5 Yes 80,000 50,000 5,000 10,000 30,000 ² Goldcorp Inc. 29,032,610 ¹ NIC, LD 10 8 1 4 Yes 902,585 1,80 255,565 1,80 1,545 ¹ 103,000 ¹ 1,545 ¹ 10,300 ¹ 20,600 1,2 15,450 1,14 X Golden Star Resources Ltd. 825,499 ¹ IC 7 6 0 7 175,100 ¹ 113,300 ¹ 10,300 ¹ 20,600 1,2 Grande Cache Coal Corporation 434,379 IC 6 5 0 7 50,000 30,000 1,500 1,500 10,000 15,000 ² XGreat Basin Gold Ltd. 818,043 NIC 8 5 0 7 50,000 2,000 23 5,000 14,68 7,500 23 3,000 19 XGreat-West Lifeco Inc. 131,514,000 NIC 19 10 2 7 Yes 198,288 98,288 30 2,000 30 3,000 2,30 2,000 30 10,000 29 30,000 ² 50,000 28 X X Groupe Aeroplan Inc. 5,146,052 IC 9 8 1 3 Yes 200,000 61,009 1,500 2,500 5,000 2 1,500 7,500 15,000 ² X X Guyana Goldfields Inc. 165,464 LD 7 4 0 6 20,000 74 H&R Real Estate Investment Trust X 5,546,975 IC 6 5 0 13 Yes 45,000 2,000 70 22,500 2,000 70 5,000 33,69 10,000 ² XHarry Winston Diamond Corporation 1,666,037 ¹ CC, LD 9 7 2 5 Yes 77,746 1,500 1,500 5,000 15,000 ² X X High River Gold Mines Ltd. 812,332 IC 6 3 0 1 39,375 28,125 1,125 2,250 7,500 2 1,125 4,500 16,875 ² Home Capital Group Inc. 7,712,239 IC 8 7 2 10 Yes 120,000 60,000 5,000 30,000 2,38 X HudBay Minerals Inc. 2,173,086 IC 8 7 0 1 Yes 335,000 80,000 1,500 1,500 10,000 30,000 ² X X Husky Energy Inc. 29,133,000 NIC 15 10 2 7 Yes 85,000 5,000 10,000 2 7,000 15,000 ² X Iamgold Corporation 3,599,795 ¹ IC 10 9 0 8 Yes 220,000 46,120 2,500 2,500 3,000 X IESI-BFC Ltd. 3,492,202 ¹ IC 7 5 0 5 Yes 200,000 135,000 10,000 14,19 20,000 ² X IGM Financial Inc. 8,892,563 NIC 17 7 2 10 Yes 175,000 75,000 1,750 2,000 2 1,750 5,000 20,000 ² X X IMAX Corporation 359,561¹ NIC 9 7 0 10 200,000 20,000 111 1,500 1,200 8,000 ² X XImperial Metals Corporation 440,041 IC, LD 5 4 0 6 Yes 76,000 122 40,000 1,000 1,000 X Imperial Oil Limited 20,580,000 CC 7 5 2 5 Yes 174,640 26 25 20,000 24 25 10,000 X Indigo Books & Music Inc. 516,180 CC, LD 11 9 3 5 Yes 20,000 123 2,000 123 3,000 123 2,000 123 7,500 123 15,000 2,123 3,500 123 X Industrial Alliance Insurance and Financial Services Inc. 20,102,000 IC 13 12 3 9 Yes 200,000 45,000 1,500 3,000 5,000 2 1,500 3,000 10,000 ² 7,500 20,69 X Inmet Mining Corporation 3,262,576 IC 11 10 0 7 Yes 325,000 115,000 1,500 1,500 10,000 25,000 ² X X InnVest Real Estate Investment Trust X 1,800,033 NIC 6 4 0 7 55,000 45,000 1,000 1,000 10,000 12,500 ² X Intact Financial Corporation 12,148,900 IC 11 10 3 6 Yes 225,000 60,000 1,500 3,000 23 1,500 5,000 10,000 10,23 X X Inter Pipeline Fund X 4,712,200 NIC, LD 9 5 0 4 Yes 125,000 1,500 1,500 10,000 15,000 ² X Ithaca Energy Inc. 578,706 ¹ IC 8 7 0 3 95,508 55,713 XIvanhoe Energy Inc. 421,872 ¹ CC, LD 9 5 0 5 Yes 41,200 ¹ 1,030 ¹ 41,200 ¹ 1,030¹ 10,300 1,2,27 XIvanhoe Mines Ltd. 3,314,952 ¹ CC, LD 14 12 1 5 Yes 40,000 2,000 150,000 2,000 20,000 19 40,000 2,97 XJaguar Mining Inc. 596,654 ¹ IC 6 4 0 6 Yes 202,500 103,500 7,500 4,500 39 9,500 39 17,500 ² 12,500 41 15,000 14 X X Jean Coutu Group (PJC) Inc. 1,045,400 EC 13 7 5 15 Yes 25,000 2,000 2,500 2,000 5,000 10,000 ² X Just Energy Group Inc. 1,588,644 EC, LD 9 5 1 6 Yes 50,000 2,000 50,000 5,000 2 2,000 5,000 15,000 ² 10,000 9,75 X X Keyera Facilities Income Fund X 1,972,004 IC 8 7 1 6 Yes 130,000 65,000 15,000 30,000 45,000 ² X Kinross Gold Corporation 16,889,013 ¹ IC 11 9 1 7 Yes 385,000 160,000 15,000 20,000 23 30,000 70,000 23 X Kirkland Lake Gold Inc. 162,207 EC 7 3 0 6 12,000 2,000 14 5,000 2 6,000 14 10,000 ² Labrador Iron Ore Royalty Corporation 680,791 IC 7 4 0 12 50,000 25,000 1,200 1,200 10,000 20,000 ² Lake Shore Gold Corp. 1,124,318 IC 7 6 0 3 Yes 75,000 50,000 1,500 1,500 5,000 15,000 ² XLaurentian Bank of Canada 23,800,003 IC 13 12 5 5 Yes 160,000 60,000 6,000 8 7,500 X Linamar Corporation 1,807,600 EC 6 3 1 18 Yes 30,000 1,500 1,000 1,500 2,500 Lions Gate Entertainment Corp. 1,755,591 ¹ CC, LD 12 10 1 8 Yes 41,200 ¹ 1,442 ¹ 53,560 ¹ 1,442 ¹ 10,300¹ 15,450 1,2 X X Loblaw Companies Limited 15,919,000 EC, LD 13 8 2 5 Yes 100,000 2,000 50,000 4,000 5,000 2 2,000 10,000 43 30,000 ² 15,000 42 25,000 41 X X Lundin Mining Corporation 3,948,390 ¹ NIC, LD 8 6 0 9 200,000 90,000 5,000 15,000 2 10,000 5 10,000 25,000 ² 20,000 5 MacDonald, Dettwiler and Associates Ltd. 1,371,834 IC 9 8 0 6 Yes 175,000 77,500 4 1,500 4 5,000 4 1,500 2,500 2,4 10,000 17,500 ² X X Magna International Inc. 14,314,940 ¹ NIC, LD 9 7 1 12 Yes 206,000 ¹ 154,500 ¹ 2,060 ¹ 257,500 ¹ 25,750 ¹ 2,060 ¹ 51,500 ¹ 36,050 1,39 X X XMajor Drilling Group International Inc. 482,265 IC 8 7 2 5 Yes 150,000 50,000 2,000 2,000 5,000 15,000 ² 10,000 14 X XManitoba Telecom Services Inc. 2,875,300 IC 10 9 3 8 Yes 275,000 83 120,000 83 20,000 55,000 ² X X Manulife Financial Corporation 217,672,000 IC 18 17 3 9 Yes 350,000 110,000 4 2,000 4 5,000 4 8,000 2,4,9,37 1,500 4 5,000 46 30,000 2,4,9,37 X Maple Leaf Foods Inc. 2,996,795 NIC, LD 12 9 2 10 Yes 300,000 120,000 30,000 1,500 10,000 15,000 2 X
Stock Component: “Options” indicates if directors received stock options. “Req’d” indicates if directors are required to take all or a portion of their compensation in shares or share equivalents. “Elect” indicates if directors may choose to take all or a portion of their compensation in shares or share equivalents.
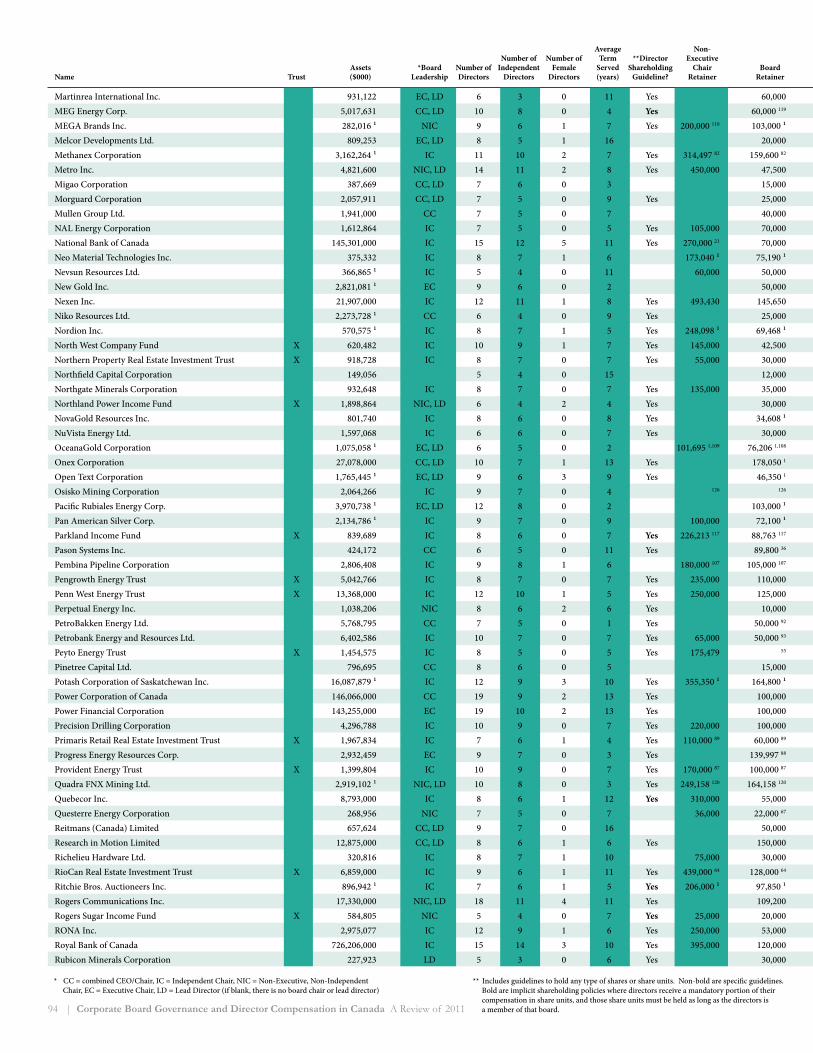
94 | Corporate Board Governance and Director Compensation in Canada A Review of 2011
** Includes guidelines to hold any type of shares or share units. Non-bold are specific guidelines. Bold are implicit shareholding policies where directors receive a mandatory portion of their compensation in share units, and those share units must be held as long as the directors is a member of that board.
* CC = combined CEO/Chair, IC = Independent Chair, NIC = Non-Executive, Non-Independent Chair, EC = Executive Chair, LD = Lead Director (if blank, there is no board chair or lead director)
Average Non- Number of Number of Term **Director Executive Lead Committee Chair Fee Stock Component Assets *Board Number of Independent Female Served Shareholding Chair Board Board Director Name Trust ($000) Leadership Directors Directors Directors (years) Guideline? Retainer Retainer Meeting Fee Retainer Committee Retainer Committee Meeting Fee Regular: Retainer Bold: Meeting Fees Req’d Elect Options
Martinrea International Inc. 931,122 EC, LD 6 3 0 11 Yes 60,000 1,500 6,000 4,000 118 1,500 6,000 XMEG Energy Corp. 5,017,631 CC, LD 10 8 0 4 Yes 60,000 119 1,500 10,000 1,000 1,200 1,500 2 X XMEGA Brands Inc. 282,016 ¹ NIC 9 6 1 7 Yes 200,000 110 103,000 ¹ 5,150 1 7,725 1,2 10,300 1 15,450 1,2 X X Melcor Developments Ltd. 809,253 EC, LD 8 5 1 16 20,000 1,200 2,500 1,200 5,000 7,500 ² Methanex Corporation 3,162,264 ¹ IC 11 10 2 7 Yes 314,497 82 159,600 82 2,500 2,500 5,000 X X Metro Inc. 4,821,600 NIC, LD 14 11 2 8 Yes 450,000 47,500 1,750 20,000 2,500 6 5,000 2 1,750 6 5,000 10,000 ² X X Migao Corporation 387,669 CC, LD 7 6 0 3 15,000 1,000 1,000 1,000 XMorguard Corporation 2,057,911 CC, LD 7 5 0 9 Yes 25,000 1,500 8,000 1,500 4,000 8,000² XMullen Group Ltd. 1,941,000 CC 7 5 0 7 40,000 1,200 3,000 1,000 5,000 1,200 NAL Energy Corporation 1,612,864 IC 7 5 0 5 Yes 105,000 70,000 1,500 1,500 10,000 15,000 23 X National Bank of Canada 145,301,000 IC 15 12 5 11 Yes 270,000 21 70,000 15,000 20,000 2 37,500 45,000 ² X X Neo Material Technologies Inc. 375,332 IC 8 7 1 6 173,040 ¹ 75,190 ¹ 2,060 ¹ 1,030 ¹ 2,060 1,2 2,060 ¹ 5,150 ¹ 20,600 1,2 X Nevsun Resources Ltd. 366,865 ¹ IC 5 4 0 11 60,000 50,000 XNew Gold Inc. 2,821,081 ¹ EC 9 6 0 2 50,000 15,000 ² X XNexen Inc. 21,907,000 IC 12 11 1 8 Yes 493,430 145,650 1,800 9,100 1,800 14,400 19,700 ² X X Niko Resources Ltd. 2,273,728 ¹ CC 6 4 0 9 Yes 25,000 Nordion Inc. 570,575 ¹ IC 8 7 1 5 Yes 248,098 ¹ 69,468 ¹ 1,488¹ 1,985¹ 3,970 1,13 1,488 ¹ 4,962¹ 14,886 1,13 X X North West Company Fund X 620,482 IC 10 9 1 7 Yes 145,000 42,500 1,500 1,500 8,000 12,000 ² X X Northern Property Real Estate Investment Trust X 918,728 IC 8 7 0 7 Yes 55,000 30,000 1,500 1,500 1,500 10,000 15,000 ² Northfield Capital Corporation 149,056 5 4 0 15 12,000 12,000² Northgate Minerals Corporation 932,648 IC 8 7 0 7 Yes 135,000 35,000 1,500 3,000 2 1,500 6,000 12,000 ² XNorthland Power Income Fund X 1,898,864 NIC, LD 6 4 2 4 Yes 30,000 1,500 15,000 5,000 1,500 10,000 20,000 ² NovaGold Resources Inc. 801,740 IC 8 6 0 8 Yes 34,608 ¹ 1,184 ¹ 1,184 ¹ 6,386 1,14,19 10,506 1,2 5,150 1,81 X X XNuVista Energy Ltd. 1,597,068 IC 6 6 0 7 Yes 30,000 1,400 7,500 4,000 6,000 2 1,400 7,500 15,000 ² OceanaGold Corporation 1,075,058 ¹ EC, LD 6 5 0 2 101,695 1,109 76,206 1,108 XOnex Corporation 27,078,000 CC, LD 10 7 1 13 Yes 178,050 1 2,060 ¹ 41,200 4,635 ¹ 7,725 1,77 2,060 ¹ 10,300 ¹ 15,450 1,77 X X Open Text Corporation 1,765,445 ¹ EC, LD 9 6 3 9 Yes 46,350 1 10,300 ¹ 8,240 ¹ 25,750 1,2 10,300 1,14 14,420 ¹ 36,050 1,2 20,600 1,14 X XOsisko Mining Corporation 2,064,266 IC 9 7 0 4 126 126 126 126 126 126 XPacific Rubiales Energy Corp. 3,970,738 ¹ EC, LD 12 8 0 2 103,000 ¹ 77,250 ¹ XPan American Silver Corp. 2,134,786 ¹ IC 9 7 0 9 100,000 72,100 ¹ 1,030 ¹ 10,300 ¹ 6,180 1,2 1,030 ¹ 5,150 ¹ 14,420 1,2 3,090 1,19 X XParkland Income Fund X 839,689 IC 8 6 0 7 Yes 226,213 117 88,763 117 1,500 1,500 10,000 33 15,000 ² 2,500 X Pason Systems Inc. 424,172 CC 6 5 0 11 Yes 89,800 36 1,000 1,000 X XPembina Pipeline Corporation 2,806,408 IC 9 8 1 6 180,000 107 105,000 107 1,200 5,000 2 1,200 10,000 18,000 ² X Pengrowth Energy Trust X 5,042,766 IC 8 7 0 7 Yes 235,000 110,000 1,500 5,000 10,000 2 1,500 10,000 12,000 ² 15,000 14 X Penn West Energy Trust X 13,368,000 IC 12 10 1 5 Yes 250,000 125,000 1,500 20,000 65 1,500 7,500 15,000 ² Perpetual Energy Inc. 1,038,206 NIC 8 6 2 6 Yes 10,000 1,500 1,500 5,000 10,000 ² PetroBakken Energy Ltd. 5,768,795 CC 7 5 0 1 Yes 50,000 92 5,000 14, 91 10,000 2 7,500 14,91 12,500 ² X XPetrobank Energy and Resources Ltd. 6,402,586 IC 10 7 0 7 Yes 65,000 50,000 93 5,000 10,000 2 7,500 14,91 12,500 ² X XPeyto Energy Trust X 1,454,575 IC 8 5 0 5 Yes 175,479 55 Pinetree Capital Ltd. 796,695 CC 8 6 0 5 15,000 1,000 1,000 5,000 ² XPotash Corporation of Saskatchewan Inc. 16,087,879 ¹ IC 12 9 3 10 Yes 355,350 ¹ 164,800 ¹ 5,150 1,2,14 1,545 1,15 10,300 ¹ 15,450 1,2,14 X Power Corporation of Canada 146,066,000 CC 19 9 2 13 Yes 100,000 2,000 5,000 6,000 2 2,000 15,000 25,000 ² 250,000 28 X X Power Financial Corporation 143,255,000 EC 19 10 2 13 Yes 100,000 2,000 5,000 6,000 2 2,000 15,000 25,000 ² X X Precision Drilling Corporation 4,296,788 IC 10 9 0 7 Yes 220,000 100,000 1,250 1,250 2,500 2 7,500 15,000 ² X X Primaris Retail Real Estate Investment Trust X 1,967,834 IC 7 6 1 4 Yes 110,000 89 60,000 89 1,500 1,500 8,500 10,000 ² 7,500 90 X Progress Energy Resources Corp. 2,932,459 EC 9 7 0 3 Yes 139,997 88 1,500 1,500 7,500 12,000 ² X Provident Energy Trust X 1,399,804 IC 10 9 0 7 Yes 170,000 87 100,000 87 1,500 5,000 1,500 7,500 10,000 ² X Quadra FNX Mining Ltd. 2,919,102 ¹ NIC, LD 10 8 0 3 Yes 249,158 120 164,158 120 1,500 35,000 1,500 10,000 35,000 ² X Quebecor Inc. 8,793,000 IC 8 6 1 12 Yes 310,000 55,000 2,000 3,000 2,000 3,000 2 8,000 10,000 ² X X Questerre Energy Corporation 268,956 NIC 7 5 0 7 36,000 22,000 67 XReitmans (Canada) Limited 657,624 CC, LD 9 7 0 16 50,000 5,000 ² Research in Motion Limited 12,875,000 CC, LD 8 6 1 6 Yes 150,000 40,000 15,000 94 25,000 23 X X Richelieu Hardware Ltd. 320,816 IC 8 7 1 10 75,000 30,000 1,500 2,000 7,500 X XRioCan Real Estate Investment Trust X 6,859,000 IC 9 6 1 11 Yes 439,000 64 128,000 64 2,500 2,000 5,000 5 15,000 ² X Ritchie Bros. Auctioneers Inc. 896,942 ¹ IC 7 6 1 5 Yes 206,000 ¹ 97,850 ¹ 1,545 ¹ 1,545 ¹ 10,300 ¹ 15,450 1,2 X Rogers Communications Inc. 17,330,000 NIC, LD 18 11 4 11 Yes 109,200 1,500 74,600 1,500 2,000 2 10,000 30,000 ² 20,000 14 2,000 3,000 2,14 X X Rogers Sugar Income Fund X 584,805 NIC 5 4 0 7 Yes 25,000 20,000 1,000 1,000 1,500 2 10,000 ² 2,000 2 X RONA Inc. 2,975,077 IC 12 9 1 6 Yes 250,000 53,000 1,500 2,500 4,000 2 1,500 5,000 10,000 ² X X Royal Bank of Canada 726,206,000 IC 15 14 3 10 Yes 395,000 120,000 2,000 3,000 6,000 2 1,500 10,000 50,000² 25,000 9,10 X X Rubicon Minerals Corporation 227,923 LD 5 3 0 6 Yes 30,000 600 15,000 600 3,465 10,000² X

Corporate Board Governance and Director Compensation in Canada A Review of 2011 | 95
Average Non- Number of Number of Term **Director Executive Lead Committee Chair Fee Stock Component Assets *Board Number of Independent Female Served Shareholding Chair Board Board Director Name Trust ($000) Leadership Directors Directors Directors (years) Guideline? Retainer Retainer Meeting Fee Retainer Committee Retainer Committee Meeting Fee Regular: Retainer Bold: Meeting Fees Req’d Elect Options
All amounts include cash and the value of shares and/or share units.
Martinrea International Inc. 931,122 EC, LD 6 3 0 11 Yes 60,000 1,500 6,000 4,000 118 1,500 6,000 XMEG Energy Corp. 5,017,631 CC, LD 10 8 0 4 Yes 60,000 119 1,500 10,000 1,000 1,200 1,500 2 X XMEGA Brands Inc. 282,016 ¹ NIC 9 6 1 7 Yes 200,000 110 103,000 ¹ 5,150 1 7,725 1,2 10,300 1 15,450 1,2 X X Melcor Developments Ltd. 809,253 EC, LD 8 5 1 16 20,000 1,200 2,500 1,200 5,000 7,500 ² Methanex Corporation 3,162,264 ¹ IC 11 10 2 7 Yes 314,497 82 159,600 82 2,500 2,500 5,000 X X Metro Inc. 4,821,600 NIC, LD 14 11 2 8 Yes 450,000 47,500 1,750 20,000 2,500 6 5,000 2 1,750 6 5,000 10,000 ² X X Migao Corporation 387,669 CC, LD 7 6 0 3 15,000 1,000 1,000 1,000 XMorguard Corporation 2,057,911 CC, LD 7 5 0 9 Yes 25,000 1,500 8,000 1,500 4,000 8,000² XMullen Group Ltd. 1,941,000 CC 7 5 0 7 40,000 1,200 3,000 1,000 5,000 1,200 NAL Energy Corporation 1,612,864 IC 7 5 0 5 Yes 105,000 70,000 1,500 1,500 10,000 15,000 23 X National Bank of Canada 145,301,000 IC 15 12 5 11 Yes 270,000 21 70,000 15,000 20,000 2 37,500 45,000 ² X X Neo Material Technologies Inc. 375,332 IC 8 7 1 6 173,040 ¹ 75,190 ¹ 2,060 ¹ 1,030 ¹ 2,060 1,2 2,060 ¹ 5,150 ¹ 20,600 1,2 X Nevsun Resources Ltd. 366,865 ¹ IC 5 4 0 11 60,000 50,000 XNew Gold Inc. 2,821,081 ¹ EC 9 6 0 2 50,000 15,000 ² X XNexen Inc. 21,907,000 IC 12 11 1 8 Yes 493,430 145,650 1,800 9,100 1,800 14,400 19,700 ² X X Niko Resources Ltd. 2,273,728 ¹ CC 6 4 0 9 Yes 25,000 Nordion Inc. 570,575 ¹ IC 8 7 1 5 Yes 248,098 ¹ 69,468 ¹ 1,488¹ 1,985¹ 3,970 1,13 1,488 ¹ 4,962¹ 14,886 1,13 X X North West Company Fund X 620,482 IC 10 9 1 7 Yes 145,000 42,500 1,500 1,500 8,000 12,000 ² X X Northern Property Real Estate Investment Trust X 918,728 IC 8 7 0 7 Yes 55,000 30,000 1,500 1,500 1,500 10,000 15,000 ² Northfield Capital Corporation 149,056 5 4 0 15 12,000 12,000² Northgate Minerals Corporation 932,648 IC 8 7 0 7 Yes 135,000 35,000 1,500 3,000 2 1,500 6,000 12,000 ² XNorthland Power Income Fund X 1,898,864 NIC, LD 6 4 2 4 Yes 30,000 1,500 15,000 5,000 1,500 10,000 20,000 ² NovaGold Resources Inc. 801,740 IC 8 6 0 8 Yes 34,608 ¹ 1,184 ¹ 1,184 ¹ 6,386 1,14,19 10,506 1,2 5,150 1,81 X X XNuVista Energy Ltd. 1,597,068 IC 6 6 0 7 Yes 30,000 1,400 7,500 4,000 6,000 2 1,400 7,500 15,000 ² OceanaGold Corporation 1,075,058 ¹ EC, LD 6 5 0 2 101,695 1,109 76,206 1,108 XOnex Corporation 27,078,000 CC, LD 10 7 1 13 Yes 178,050 1 2,060 ¹ 41,200 4,635 ¹ 7,725 1,77 2,060 ¹ 10,300 ¹ 15,450 1,77 X X Open Text Corporation 1,765,445 ¹ EC, LD 9 6 3 9 Yes 46,350 1 10,300 ¹ 8,240 ¹ 25,750 1,2 10,300 1,14 14,420 ¹ 36,050 1,2 20,600 1,14 X XOsisko Mining Corporation 2,064,266 IC 9 7 0 4 126 126 126 126 126 126 XPacific Rubiales Energy Corp. 3,970,738 ¹ EC, LD 12 8 0 2 103,000 ¹ 77,250 ¹ XPan American Silver Corp. 2,134,786 ¹ IC 9 7 0 9 100,000 72,100 ¹ 1,030 ¹ 10,300 ¹ 6,180 1,2 1,030 ¹ 5,150 ¹ 14,420 1,2 3,090 1,19 X XParkland Income Fund X 839,689 IC 8 6 0 7 Yes 226,213 117 88,763 117 1,500 1,500 10,000 33 15,000 ² 2,500 X Pason Systems Inc. 424,172 CC 6 5 0 11 Yes 89,800 36 1,000 1,000 X XPembina Pipeline Corporation 2,806,408 IC 9 8 1 6 180,000 107 105,000 107 1,200 5,000 2 1,200 10,000 18,000 ² X Pengrowth Energy Trust X 5,042,766 IC 8 7 0 7 Yes 235,000 110,000 1,500 5,000 10,000 2 1,500 10,000 12,000 ² 15,000 14 X Penn West Energy Trust X 13,368,000 IC 12 10 1 5 Yes 250,000 125,000 1,500 20,000 65 1,500 7,500 15,000 ² Perpetual Energy Inc. 1,038,206 NIC 8 6 2 6 Yes 10,000 1,500 1,500 5,000 10,000 ² PetroBakken Energy Ltd. 5,768,795 CC 7 5 0 1 Yes 50,000 92 5,000 14, 91 10,000 2 7,500 14,91 12,500 ² X XPetrobank Energy and Resources Ltd. 6,402,586 IC 10 7 0 7 Yes 65,000 50,000 93 5,000 10,000 2 7,500 14,91 12,500 ² X XPeyto Energy Trust X 1,454,575 IC 8 5 0 5 Yes 175,479 55 Pinetree Capital Ltd. 796,695 CC 8 6 0 5 15,000 1,000 1,000 5,000 ² XPotash Corporation of Saskatchewan Inc. 16,087,879 ¹ IC 12 9 3 10 Yes 355,350 ¹ 164,800 ¹ 5,150 1,2,14 1,545 1,15 10,300 ¹ 15,450 1,2,14 X Power Corporation of Canada 146,066,000 CC 19 9 2 13 Yes 100,000 2,000 5,000 6,000 2 2,000 15,000 25,000 ² 250,000 28 X X Power Financial Corporation 143,255,000 EC 19 10 2 13 Yes 100,000 2,000 5,000 6,000 2 2,000 15,000 25,000 ² X X Precision Drilling Corporation 4,296,788 IC 10 9 0 7 Yes 220,000 100,000 1,250 1,250 2,500 2 7,500 15,000 ² X X Primaris Retail Real Estate Investment Trust X 1,967,834 IC 7 6 1 4 Yes 110,000 89 60,000 89 1,500 1,500 8,500 10,000 ² 7,500 90 X Progress Energy Resources Corp. 2,932,459 EC 9 7 0 3 Yes 139,997 88 1,500 1,500 7,500 12,000 ² X Provident Energy Trust X 1,399,804 IC 10 9 0 7 Yes 170,000 87 100,000 87 1,500 5,000 1,500 7,500 10,000 ² X Quadra FNX Mining Ltd. 2,919,102 ¹ NIC, LD 10 8 0 3 Yes 249,158 120 164,158 120 1,500 35,000 1,500 10,000 35,000 ² X Quebecor Inc. 8,793,000 IC 8 6 1 12 Yes 310,000 55,000 2,000 3,000 2,000 3,000 2 8,000 10,000 ² X X Questerre Energy Corporation 268,956 NIC 7 5 0 7 36,000 22,000 67 XReitmans (Canada) Limited 657,624 CC, LD 9 7 0 16 50,000 5,000 ² Research in Motion Limited 12,875,000 CC, LD 8 6 1 6 Yes 150,000 40,000 15,000 94 25,000 23 X X Richelieu Hardware Ltd. 320,816 IC 8 7 1 10 75,000 30,000 1,500 2,000 7,500 X XRioCan Real Estate Investment Trust X 6,859,000 IC 9 6 1 11 Yes 439,000 64 128,000 64 2,500 2,000 5,000 5 15,000 ² X Ritchie Bros. Auctioneers Inc. 896,942 ¹ IC 7 6 1 5 Yes 206,000 ¹ 97,850 ¹ 1,545 ¹ 1,545 ¹ 10,300 ¹ 15,450 1,2 X Rogers Communications Inc. 17,330,000 NIC, LD 18 11 4 11 Yes 109,200 1,500 74,600 1,500 2,000 2 10,000 30,000 ² 20,000 14 2,000 3,000 2,14 X X Rogers Sugar Income Fund X 584,805 NIC 5 4 0 7 Yes 25,000 20,000 1,000 1,000 1,500 2 10,000 ² 2,000 2 X RONA Inc. 2,975,077 IC 12 9 1 6 Yes 250,000 53,000 1,500 2,500 4,000 2 1,500 5,000 10,000 ² X X Royal Bank of Canada 726,206,000 IC 15 14 3 10 Yes 395,000 120,000 2,000 3,000 6,000 2 1,500 10,000 50,000² 25,000 9,10 X X Rubicon Minerals Corporation 227,923 LD 5 3 0 6 Yes 30,000 600 15,000 600 3,465 10,000² X
Stock Component: “Options” indicates if directors received stock options. “Req’d” indicates if directors are required to take all or a portion of their compensation in shares or share equivalents. “Elect” indicates if directors may choose to take all or a portion of their compensation in shares or share equivalents.

96 | Corporate Board Governance and Director Compensation in Canada A Review of 2011
** Includes guidelines to hold any type of shares or share units. Non-bold are specific guidelines. Bold are implicit shareholding policies where directors receive a mandatory portion of their compensation in share units, and those share units must be held as long as the directors is a member of that board.
* CC = combined CEO/Chair, IC = Independent Chair, NIC = Non-Executive, Non-Independent Chair, EC = Executive Chair, LD = Lead Director (if blank, there is no board chair or lead director)
Average Non- Number of Number of Term **Director Executive Lead Committee Chair Fee Stock Component Assets *Board Number of Independent Female Served Shareholding Chair Board Board Director Name Trust ($000) Leadership Directors Directors Directors (years) Guideline? Retainer Retainer Meeting Fee Retainer Committee Retainer Committee Meeting Fee Regular: Retainer Bold: Meeting Fees Req’d Elect Options
Russel Metals Inc. 1,437,100 IC 9 8 2 8 Yes 175,000 55,000 4 2,000 4 2,000 4 6,000 12,000 ² 8,600 4,37 X X Saputo Inc. 3,664,309 NIC, LD 12 10 2 10 Yes 500,000 142,520 1,500 68,760 3,000 4,500 2 1,500 7,500 53,760 ² X X Savanna Energy Services Corp. 1,052,368 IC 6 5 0 4 Yes 155,000 125,000 1,500 1,500 10,000 20,000 ² X X Sears Canada Inc. 2,509,800 NIC, LD 8 4 2 3 Yes 60,000 1,500 25,000 5,000 1,500 10,000 20,000 ² Semafo Inc. 599,532 ¹ EC, LD 7 5 0 6 Yes 20,000 1,250 15,000 1,250 5,000 10,000 ² XSenvest Capital Inc. 515,631 CC 6 3 0 27 47,000 Shaw Communications Inc. 10,153,965 EC, LD 16 12 2 10 Yes 65,000 4 1,500 4 75,000 3,000 4 1,500 4 10,000 4 40,000 ² X ShawCor Ltd. 1,231,182 EC, LD 13 10 3 8 Yes 200,000 100,000 4 2,000 4 20,000 5,000 4 10,000 2,4 2,000 4 10,000 4 20,000 ² X X Sherritt International Corporation 10,721,500 CC, LD 9 8 1 7 Yes 50,000 57 10,000 20,000 2,000 56 5,000 15,000 2,10 X Shoppers Drug Mart Corporation 7,122,210 IC 11 10 4 4 Yes 240,000 120,000 10,000 X X Silver Standard Resources Inc. 1,299,878 ¹ IC 7 5 0 3 Yes 226,516 103,258 5,000 10,000 15,000 ² X X Silver Wheaton Corp. 2,714,121 ¹ IC 8 7 0 5 Yes 203,578 78 113,161 78 1,500 1,500 15,000 19 25,000 ² 20,000 10 X Sino-Forest Corporation 5,900,904 ¹ CC, LD 7 5 0 8 Yes 20,000 79 1,500 30,000 5,000 10,000 2 1,500 7,500 20,000 ² X X SNC-Lavalin Group Inc. 8,603,223 IC 12 11 3 6 Yes 280,000 110,000 1,500 1,500 2,250 2 8,000 16,000 ² X X Sprott Inc. 342,037 EC, LD 7 4 0 2 50,000 1,500 30,000 1,500 5,000 20,000 ² XStantec Inc. 1,323,508 IC 9 7 1 8 Yes 161,752 86,752 1,800 1,800 6,000 12,000 ² X Stella-Jones Inc. 521,633 NIC, LD 9 5 2 11 50,000 30,000 5,000 ² Sun Life Financial Inc. 120,859,000 IC 13 12 2 6 Yes 345,000 110,000 1,500 5,000 10,000 2 7,500 9 1,500 20,000 30,000 2,9 X X Suncor Energy Inc. 70,169,000 IC 14 13 2 7 Yes 499,671 210,532 1,500 5,000 6,000 2 1,500 10,000 25,000 ² 15,000 5 X X SunOpta Inc. 627,974 ¹ NIC 9 6 1 10 30,000 1,500 750 7,500 20,000 ² XSuperior Plus Corp. 2,449,600 CC, LD 10 9 1 9 Yes 57,000 17 1,500 35,000 5,000 1,500 14,000 19,000 ² 2,000 X SXC Health Solutions Corp. 840,798 ¹ IC 7 6 0 5 155,272 1,85 129,522 1,85 5,150 1,14 7,210 1,2 10,300 1,14 15,450 1,2 X Talisman Energy Inc. 24,193,000 IC 11 10 2 2 Yes 450,000 4 150,000 4 1,700 4 6,000 4 10,000 2,4 1,700 4 15,000 4 25,000 ² X X Taseko Mines Limited 687,612 NIC 9 5 0 9 50,000 3,000 7,500 ² XTeck Resources Limited 29,209,000 NIC, LD 14 11 2 10 Yes 659,132 161,177 1,500 100,000 6,000 1,500 8,000 20,000 ² X X TELUS Corporation 19,599,000 IC 13 12 1 10 Yes 360,000 139,000 1,500 3,000 6,000 2 1,500 3,000 2 6,000 15,000 ² X X Tembec Inc. 1,104,000 IC 9 7 0 4 Yes 140,000 113 50,000 113 2,000 2,500 15,000 2 7,500 20 2,000 5,000 25,000 ² 15,000 20 X Thompson Creek Metals Company Inc. 2,387,231 ¹ CC, LD 7 6 1 3 Yes 202,858 1,95 1,545 ¹ 83,070 ¹ 1,545 ¹ 7,210 ¹ 25,750 1,2 X Thomson Reuters Corporation 36,596,930 ¹ NIC 15 10 2 9 Yes 618,000 1,44 154,500 ¹ 20,600 ¹ X Tim Hortons Inc. 2,481,516 EC, LD 11 9 3 3 Yes 90,000 1,500 51,000 3,000 1,500 6,000 12,000 ² X TMX Group Inc. 3,281,919 IC 14 13 3 7 Yes 275,000 80,000 1,500 3,000 1,500 10,000 20,000 13 X X Toromont Industries Ltd. 2,269,238 CC, LD 9 7 0 14 Yes 210,000 22 40,000 2,000 33,000 4,000 2,000 9,000 18,000 ² X XToronto-Dominion Bank 619,545,000 IC 16 15 5 8 Yes 300,000 165,000 11 15,000 12 25,000 40,000 ² X X Torstar Corporation 1,573,199 IC 14 13 4 4 Yes 265,000 45,000 4 1,500 4 10,000 3,000 4 1,250 4 6,500 4 10,000 ² X X TransAlta Corporation 9,893,000 IC 11 10 3 7 Yes 305,160 115,280 1,500 1,500 15,000 25,000 ² X X Transat A.T. Inc. 1,189,458 EC, LD 11 8 1 12 Yes 42,000 1,500 10,000 7 3,000 5,000 2 1,500 X X TransCanada Corporation 46,589,000 IC 13 12 2 7 Yes 360,000 142,000 4 1,500 4 4,500 4 1,500 4 10,000 4 3,000 4 X X Transcontinental Inc. 2,594,700 EC, LD 13 9 2 10 Yes 35,000 1,500 3,000 3,000 1,500 6,000 10,000 2,5 X TransForce Inc. 1,623,600 CC, LD 8 7 0 6 Yes 42,000 1,750 40,000 4,500 1,750 10,000 2,500 X Transglobe Energy Corporation 352,158 ¹ IC 7 5 0 10 50,000 35,000 3,000 4,000 2 6,000 12,000 ² XTrican Well Service Ltd. 1,450,722 EC, LD 8 5 0 8 Yes 156,821 127,372 1,200 1,200 5,000² X X Trinidad Drilling Ltd. 1,538,593 IC 6 4 0 6 Yes 160,295 140,295 1,500 20,000 1,500 1,500 7,500 15,000 ² X TVA Group Inc. 514,277 IC 10 9 2 6 180,000 30,000 1,500 1,500 2,000 2 1,500 2,000 2 5,000 8,000 ² Uni-Select Inc. 831,210 ¹ IC 12 10 1 14 90,000 35,000 1,500 1,500 3,000 4,250 2 Uranium One Inc. 3,470,129 ¹ IC 9 6 0 3 Yes 110,000 60,000 1,000 1,000 25,000² XValeant Pharmaceuticals International Inc. 11,118,970 ¹ IC 10 9 2 2 Yes 412,000 1,106 288,400 1,106 10,300 1,106 15,450 1,13,106 12,875 1,14,105,106 15,450 1,106 25,750 1,13,106 20,600 1,14,105,106 X X Valener Inc. 3,666,600 IC 4 4 1 0 2,000 2,000 Vector Aerospace Corporation 432,349 NIC 10 8 0 4 55,000 25,000 1,500 1,500 7,500 10,000 ² Velan Inc. 521,230 EC 8 4 1 19 30,000 1,500 3,000 1,500 5,000 7,500 ² Vermilion Energy Inc. 2,581,716 IC 7 6 0 9 Yes 286,983 66 167,279 66 1,500 1,500 7,000 15,000 ² X Viterra Inc. 6,116,882 IC 13 12 1 3 Yes 275,000 115,000 1,500 4,000 1,500 10,000 20,000 ² 15,000 5 X XWajax Income Fund X 515,338 IC 10 10 1 8 Yes 145,000 50,000 1,500 1,500 6,000 12,000 ² 10,000 5 X XWest Fraser Timber Co. Ltd. 2,815,000 CC, LD 9 8 1 15 Yes 50,000 1,500 30,000 2,000 1,500 10,000 XWestaim Corporation, The 1,270,426 IC 7 5 0 7 110,000 40,000 5,000 4,000 15,000 ² XWestJet Airlines Ltd. 3,562,844 NIC, LD 11 8 0 6 Yes 400,000 84 30,000 1,250 20,000 1,250 7,000 15,000 ² XWestport Innovations Inc. 281,588¹ IC 8 7 2 6 Yes 165,612 ¹ 108,962 ¹ 7,725 1,19,86 8,755 1,2,5 15,450 ¹ 20,600 1,2 X Westshore Terminals Income Fund X 579,186 EC 5 4 0 10 22,500 1,250 1,250 15,000 ² Winpak Ltd. 562,821 ¹ NIC 7 4 0 11 125,000 50,000 5,000 2 1,500 6,000 12,500 ² Yamana Gold Inc. 10,608,218 ¹ CC, LD 11 9 0 4 Yes 155,000 2,000 25,000 1,500 2,000 2,14 10,000 15,000 2,14 X Yellow Media Inc. 9,300,248 IC 11 10 2 5 Yes 260,000 110,000 5,500 8,250 2 11,000 20,000 ²

Corporate Board Governance and Director Compensation in Canada A Review of 2011 | 97
Average Non- Number of Number of Term **Director Executive Lead Committee Chair Fee Stock Component Assets *Board Number of Independent Female Served Shareholding Chair Board Board Director Name Trust ($000) Leadership Directors Directors Directors (years) Guideline? Retainer Retainer Meeting Fee Retainer Committee Retainer Committee Meeting Fee Regular: Retainer Bold: Meeting Fees Req’d Elect Options
All amounts include cash and the value of shares and/or share units.
Russel Metals Inc. 1,437,100 IC 9 8 2 8 Yes 175,000 55,000 4 2,000 4 2,000 4 6,000 12,000 ² 8,600 4,37 X X Saputo Inc. 3,664,309 NIC, LD 12 10 2 10 Yes 500,000 142,520 1,500 68,760 3,000 4,500 2 1,500 7,500 53,760 ² X X Savanna Energy Services Corp. 1,052,368 IC 6 5 0 4 Yes 155,000 125,000 1,500 1,500 10,000 20,000 ² X X Sears Canada Inc. 2,509,800 NIC, LD 8 4 2 3 Yes 60,000 1,500 25,000 5,000 1,500 10,000 20,000 ² Semafo Inc. 599,532 ¹ EC, LD 7 5 0 6 Yes 20,000 1,250 15,000 1,250 5,000 10,000 ² XSenvest Capital Inc. 515,631 CC 6 3 0 27 47,000 Shaw Communications Inc. 10,153,965 EC, LD 16 12 2 10 Yes 65,000 4 1,500 4 75,000 3,000 4 1,500 4 10,000 4 40,000 ² X ShawCor Ltd. 1,231,182 EC, LD 13 10 3 8 Yes 200,000 100,000 4 2,000 4 20,000 5,000 4 10,000 2,4 2,000 4 10,000 4 20,000 ² X X Sherritt International Corporation 10,721,500 CC, LD 9 8 1 7 Yes 50,000 57 10,000 20,000 2,000 56 5,000 15,000 2,10 X Shoppers Drug Mart Corporation 7,122,210 IC 11 10 4 4 Yes 240,000 120,000 10,000 X X Silver Standard Resources Inc. 1,299,878 ¹ IC 7 5 0 3 Yes 226,516 103,258 5,000 10,000 15,000 ² X X Silver Wheaton Corp. 2,714,121 ¹ IC 8 7 0 5 Yes 203,578 78 113,161 78 1,500 1,500 15,000 19 25,000 ² 20,000 10 X Sino-Forest Corporation 5,900,904 ¹ CC, LD 7 5 0 8 Yes 20,000 79 1,500 30,000 5,000 10,000 2 1,500 7,500 20,000 ² X X SNC-Lavalin Group Inc. 8,603,223 IC 12 11 3 6 Yes 280,000 110,000 1,500 1,500 2,250 2 8,000 16,000 ² X X Sprott Inc. 342,037 EC, LD 7 4 0 2 50,000 1,500 30,000 1,500 5,000 20,000 ² XStantec Inc. 1,323,508 IC 9 7 1 8 Yes 161,752 86,752 1,800 1,800 6,000 12,000 ² X Stella-Jones Inc. 521,633 NIC, LD 9 5 2 11 50,000 30,000 5,000 ² Sun Life Financial Inc. 120,859,000 IC 13 12 2 6 Yes 345,000 110,000 1,500 5,000 10,000 2 7,500 9 1,500 20,000 30,000 2,9 X X Suncor Energy Inc. 70,169,000 IC 14 13 2 7 Yes 499,671 210,532 1,500 5,000 6,000 2 1,500 10,000 25,000 ² 15,000 5 X X SunOpta Inc. 627,974 ¹ NIC 9 6 1 10 30,000 1,500 750 7,500 20,000 ² XSuperior Plus Corp. 2,449,600 CC, LD 10 9 1 9 Yes 57,000 17 1,500 35,000 5,000 1,500 14,000 19,000 ² 2,000 X SXC Health Solutions Corp. 840,798 ¹ IC 7 6 0 5 155,272 1,85 129,522 1,85 5,150 1,14 7,210 1,2 10,300 1,14 15,450 1,2 X Talisman Energy Inc. 24,193,000 IC 11 10 2 2 Yes 450,000 4 150,000 4 1,700 4 6,000 4 10,000 2,4 1,700 4 15,000 4 25,000 ² X X Taseko Mines Limited 687,612 NIC 9 5 0 9 50,000 3,000 7,500 ² XTeck Resources Limited 29,209,000 NIC, LD 14 11 2 10 Yes 659,132 161,177 1,500 100,000 6,000 1,500 8,000 20,000 ² X X TELUS Corporation 19,599,000 IC 13 12 1 10 Yes 360,000 139,000 1,500 3,000 6,000 2 1,500 3,000 2 6,000 15,000 ² X X Tembec Inc. 1,104,000 IC 9 7 0 4 Yes 140,000 113 50,000 113 2,000 2,500 15,000 2 7,500 20 2,000 5,000 25,000 ² 15,000 20 X Thompson Creek Metals Company Inc. 2,387,231 ¹ CC, LD 7 6 1 3 Yes 202,858 1,95 1,545 ¹ 83,070 ¹ 1,545 ¹ 7,210 ¹ 25,750 1,2 X Thomson Reuters Corporation 36,596,930 ¹ NIC 15 10 2 9 Yes 618,000 1,44 154,500 ¹ 20,600 ¹ X Tim Hortons Inc. 2,481,516 EC, LD 11 9 3 3 Yes 90,000 1,500 51,000 3,000 1,500 6,000 12,000 ² X TMX Group Inc. 3,281,919 IC 14 13 3 7 Yes 275,000 80,000 1,500 3,000 1,500 10,000 20,000 13 X X Toromont Industries Ltd. 2,269,238 CC, LD 9 7 0 14 Yes 210,000 22 40,000 2,000 33,000 4,000 2,000 9,000 18,000 ² X XToronto-Dominion Bank 619,545,000 IC 16 15 5 8 Yes 300,000 165,000 11 15,000 12 25,000 40,000 ² X X Torstar Corporation 1,573,199 IC 14 13 4 4 Yes 265,000 45,000 4 1,500 4 10,000 3,000 4 1,250 4 6,500 4 10,000 ² X X TransAlta Corporation 9,893,000 IC 11 10 3 7 Yes 305,160 115,280 1,500 1,500 15,000 25,000 ² X X Transat A.T. Inc. 1,189,458 EC, LD 11 8 1 12 Yes 42,000 1,500 10,000 7 3,000 5,000 2 1,500 X X TransCanada Corporation 46,589,000 IC 13 12 2 7 Yes 360,000 142,000 4 1,500 4 4,500 4 1,500 4 10,000 4 3,000 4 X X Transcontinental Inc. 2,594,700 EC, LD 13 9 2 10 Yes 35,000 1,500 3,000 3,000 1,500 6,000 10,000 2,5 X TransForce Inc. 1,623,600 CC, LD 8 7 0 6 Yes 42,000 1,750 40,000 4,500 1,750 10,000 2,500 X Transglobe Energy Corporation 352,158 ¹ IC 7 5 0 10 50,000 35,000 3,000 4,000 2 6,000 12,000 ² XTrican Well Service Ltd. 1,450,722 EC, LD 8 5 0 8 Yes 156,821 127,372 1,200 1,200 5,000² X X Trinidad Drilling Ltd. 1,538,593 IC 6 4 0 6 Yes 160,295 140,295 1,500 20,000 1,500 1,500 7,500 15,000 ² X TVA Group Inc. 514,277 IC 10 9 2 6 180,000 30,000 1,500 1,500 2,000 2 1,500 2,000 2 5,000 8,000 ² Uni-Select Inc. 831,210 ¹ IC 12 10 1 14 90,000 35,000 1,500 1,500 3,000 4,250 2 Uranium One Inc. 3,470,129 ¹ IC 9 6 0 3 Yes 110,000 60,000 1,000 1,000 25,000² XValeant Pharmaceuticals International Inc. 11,118,970 ¹ IC 10 9 2 2 Yes 412,000 1,106 288,400 1,106 10,300 1,106 15,450 1,13,106 12,875 1,14,105,106 15,450 1,106 25,750 1,13,106 20,600 1,14,105,106 X X Valener Inc. 3,666,600 IC 4 4 1 0 2,000 2,000 Vector Aerospace Corporation 432,349 NIC 10 8 0 4 55,000 25,000 1,500 1,500 7,500 10,000 ² Velan Inc. 521,230 EC 8 4 1 19 30,000 1,500 3,000 1,500 5,000 7,500 ² Vermilion Energy Inc. 2,581,716 IC 7 6 0 9 Yes 286,983 66 167,279 66 1,500 1,500 7,000 15,000 ² X Viterra Inc. 6,116,882 IC 13 12 1 3 Yes 275,000 115,000 1,500 4,000 1,500 10,000 20,000 ² 15,000 5 X XWajax Income Fund X 515,338 IC 10 10 1 8 Yes 145,000 50,000 1,500 1,500 6,000 12,000 ² 10,000 5 X XWest Fraser Timber Co. Ltd. 2,815,000 CC, LD 9 8 1 15 Yes 50,000 1,500 30,000 2,000 1,500 10,000 XWestaim Corporation, The 1,270,426 IC 7 5 0 7 110,000 40,000 5,000 4,000 15,000 ² XWestJet Airlines Ltd. 3,562,844 NIC, LD 11 8 0 6 Yes 400,000 84 30,000 1,250 20,000 1,250 7,000 15,000 ² XWestport Innovations Inc. 281,588¹ IC 8 7 2 6 Yes 165,612 ¹ 108,962 ¹ 7,725 1,19,86 8,755 1,2,5 15,450 ¹ 20,600 1,2 X Westshore Terminals Income Fund X 579,186 EC 5 4 0 10 22,500 1,250 1,250 15,000 ² Winpak Ltd. 562,821 ¹ NIC 7 4 0 11 125,000 50,000 5,000 2 1,500 6,000 12,500 ² Yamana Gold Inc. 10,608,218 ¹ CC, LD 11 9 0 4 Yes 155,000 2,000 25,000 1,500 2,000 2,14 10,000 15,000 2,14 X Yellow Media Inc. 9,300,248 IC 11 10 2 5 Yes 260,000 110,000 5,500 8,250 2 11,000 20,000 ²
Stock Component: “Options” indicates if directors received stock options. “Req’d” indicates if directors are required to take all or a portion of their compensation in shares or share equivalents. “Elect” indicates if directors may choose to take all or a portion of their compensation in shares or share equivalents.

98 | Corporate Board Governance and Director Compensation in Canada A Review of 2011
1 ConvertedfromU.S.Dollarsat1.03.
2 Audit Committee.
3 ADirectorwhoservesontheBoardsof bothCogecoCableandCogecoInc.receivesalesserannualretainerfromeachentityintheamountof $24,000.
4 DirectorsnotresidentinCanadaarepaidinU.S.dollars.
5 Human Resources and Compensation Committee.
6 Membersof theExecutiveCommitteedonotreceiveanannualretainerandtheirattendancefeeis$2,000whenthemeetingisheldinpersonandhalf that amount when the meeting is held by telephone.
7 This amount is paid to each of the three lead directors who are also chairs of one committee each.
8 Perannumfixedcompensationforadirectorsittingonmorethanonecommittee,excepttheChairmanof theBoard.
9 Risk Committee.
10 Human Resources Committee.
11 Includes compensation for serving on one committee.
12 Additional committee fee is applied to directors who serve on more than one committee (includes observer attendees).
13 Finance and Audit Committee.
14 Compensation Committee.
15 This amount is a per diem fee provided such meetings were not held the same day as a Board meeting.
16 Audit and Conduct Review Committee.
17 $27,000of thisamountrepresentsthevalueof RSUsgrantedin2010.
18 $22,518of thisamountrepresentsthevalueof RestrictedUnitsgrantedtoDirectorsin2010.
19 Governance and Nominating Committee.
20 Human Resources and Corporate Governance Committee.
21 Inadditiontothisamount,theBankreimbursestheChairmanupto$25,000annuallyforaccommodationexpensesinservingasChairmanof theBoard and for his business promotion activities on behalf of the Bank.
22 AmountstatedisretaineramountpaidtotheChair.ChairisalsoCEOof thecompanyandreceivesadditionalcompensationasanOfficer.
23 Audit and Risk Management Committee.
24 This amount is paid as a retainer for membership on all board committees.
25 Non-employee directors were not paid a fee for attending board and committee meetings on each of the eight regularly scheduled meeting days; however, theywereeligibletoreceiveafeeof $2,000perboardorcommitteemeetingoccurringonanyotherday.
26 $74,640of thisamountrepresentsthevalueof RestrictedStockUnitsawardedtoDirectorsin2010;50%of RSUsvestthreeyearsfromdateof grant and the remaining 50% vests on the seventh anniversary of the grant date.
27 This amount is paid for acting as the Chair of the Nominating and Corporate Governance Committee as well as Chair of the Compensation Committee.
28 Executive Committee.
29 Conduct Review Committee.
30 Amounts paid in the currency of the country of residence of the Director.
31 Committee Chairs do not receive a committee member retainer for membership on the Corporate Governance Committee but receive a member retainer for other committee assignments. Any non-committee chair appointed to the Corporate Governance Committee receives a committee member retainer.
32 $2,000fornon-scheduledmeetings.
33 Corporate Governance and Compensation Committee.
34 Reserves, Marketing Operations and Environmental, Health and Safety Committee.
35 $800permeetingforroutineadministrativematterswherenatureof discussionisbrief.
36 $69,800of thisamountrepresentsthevalueof RSUsawardedin2010;RSUsvestoverathreeyearperiod.
37 Management Resources and Compensation Committee.
38 This amount is paid for acting as the Chair of the Audit Committee for both Home Capital Group Inc. and Home Trust Company.
39 Health and Safety and Environmental Committee.
40 Directorretaineramountforservingononecommitteeof theboardis$160,000;$175,000retainerfordirectorswhoserveontwocommittees;$200,000 retainerforChairof theCorporateGovernanceCommitteeandChairof thePensionFundCommittee;$225,000retainerforChairof theManagement Resources and Compensation Committee and Chair of the Audit Committee.
41 Governance Committee.
42 Environmental Committee.
43 Pension Committee.
44 DeputyChairsof theBoardreceiveUS$309,000.
45 Inadditiontothisamount,theDirectorsreceivedRestrictedShareUnitsranginginvaluebetween$80,124and$212,630.RSUsvestoverathreeyearperiod with one-third vesting annually.
46 Conduct Review and Ethics Committee.
Endnotes

Corporate Board Governance and Director Compensation in Canada A Review of 2011 | 99
47 Governance and Environmental Committee.
48 Thisamountincludes$12,480of DeferredTrustUnits;DTUsvestoverafiveyearperiodwithone-fifthof theDTUsvestingeachyear.
49 Audit, Finance and Risk Committee.
50 $82,818of thisamountrepresentsthevalueof RestrictedTrustUnits(RTUs)awardedin2010;RTUsvestoverathreeyearperiod.
51 UndertheLTIP,eachDirectorisentitledtoreceive12,500LTIPunits,theChairof theboardisentitledtoreceiveanadditional7,500LTIPunitsandthe Chair of each committee is entitled to receive an additional 5,000 LTIP units. No units were awarded under the LTIP in 2010.
52 Chartwelldirectorsareentitledtoelecttoreceivepartorallof theirfeesintheformof DeferredUnits.EffectiveJuly1,2010,Chartwellmatchesall DeferredUnitsearnedonaone-for-onebasis.
53 Directors can elect to receive up to 100% of their board compensation in the form of deferred units, in lieu of cash, which such amount shall be matched by the trust.
54 Trustees can elect to receive up to 100% of their fees in deferred units in lieu of cash; Calloway will then match that amount such that the trustee, will, subject to certain vesting conditions, receive deferred units equal in value to two times the amount of the fees that the trustee elected to have placed in the deferred unit plan.
55 Director retainers range in value and are intended to recognize the time involved in various board activities. Annual retainers are paid in cash with half of theretainerbeingfixedandhalf beingvariable.Totalannualcompensationfordirectorsrangedbetween$105,922and$128,463.
56 Amaximumof $4,000ispaidforcommitteemeetingsinanytwo-dayperiod.
57 Plusapaymentof $150,000inrecognitionof the“Helms-Burton”legislationintheUnitedStates.
58 $16,500of thisamountincludesmonetaryamountspaidtotheTrustees.Trusteesarestronglyencouragedtousetheproceedstowardsthepurchase of CREIT units. The units are purchased on the open market.
59 $130,272of thisamount($196,640inthecaseof theChair)representsthegrantdatefairvalueof RestrictedSharesgrantedundertheRSPIP;RSUsvest over a three year period.
60 Each Trustee may elect to receive between 60% and 100% of the annual retainer paid, together with committee fees, attendance fees, additional fees and retainers to committee chairs in the form of deferred units in lieu of cash, provided that Boardwalk shall match the elected amount for each participant such that the number of deferred units issued to each participant shall be equal in value to two times the elected amount.
61 Inadditiontothisamount,theChairreceivesa$12,000travelallowanceanda$35,000matchingcontributionundertheCompany’sSharePurchasePlan.
62 Human Resources, Governance and Nominating Committee.
63 $19,000of thisamountrepresentsthevalueof UnitAppreciationRightsgrantedtoDirectorsin2010.UARsvestafter3years.
64 $88,000of thisamount($264,000inthecaseof theChair)representsthevalueof theRestrictedEquityUnitsgrantedin2010;REUsvestthreeyears from the date of issue.
65 Acquisitions & Divestments Committee.
66 $142,279of thisamount($176,983inthecaseof theChair),representsthevalueof shareawardsgrantedtoDirectorsin2010;shareawardsvestoverthreeyears.
67 Directorsreceivedbetween$22,000and$28,000infees;however,nodetailonretainers,meetingfees,etc.wasprovided.
68 Technical Committee.
69 Investment Committee.
70 Meetingattendancefeeforinitialmeetingeachquarteris$3,000.AttendancefeesforattendanceatREITTrusteemeetingsarecappedateightmeetings annually for each REIT Trustee. Attendance fees for attendance at Compensation and Governance Committee meetings are capped at two meetings annually for each REIT Trustee. No compensation or meeting attendance fee is paid in connection with the Nominating Committee.
71 Inadditiontothisamount,directorsalsoreceiveannuallyapaymentof 40%of theretainer,chairandmeetingfeespayableinDSUs.
72 LeadIndependentDirectorwasalsoChairof AuditCommitteeandChairof PensionCommitteeandthisamountreflectsthoseadditionalresponsibilities.
73 RestrictedShareswithathreeyearvestingperiodwereawardedtodirectorsin2010;amountsrangedbetween$360,030and$399,251.
74 Cashretainersof $20,000,$25,000and$30,000werepaidtothreeindependentdirectorsof theCompany.
75 ViceChairof theRiskCommitteereceivesanannualfeeof $2,500.
76 Meetingfeeswerepaidatarateof $1,000to$3,000permeeting,dependentuponthelocationof meetingandwhetheritwasattendedinpersonor by teleconference.
77 Audit and Corporate Governance Committee.
78 $73,161of thisamount($113,578inthecaseof theChair)representsthevalueof RestrictedShareRightsgrantedtodirectorsin2010.
79 Inadditiontothisamount,directorsalsoreceiveagrantof DSUsequalto(butnotinsubstitutionfor)theamountof annualretainerfeesearnedbythe respectivenon-executivedirectors(excludingretainerfeesforactingasLeadDirector)andreflectingtheamountof timespentonboard-relatedmatters.
80 $152,565of thisamountrepresentsthevalueof RSUsgrantedtodirectorsin2010.RSUsvestoverathreeyearperiod.
81 Environmental, Health, Safety and Sustainability and Technical Committee.
82 $119,600($164,497inthecaseof theChair)of thisamountreflectsthelongtermincentivereceivedbydirectorsin2010;directorscanelecttoreceive theirLTIintheformof RSUs(whichvestattheendof 2years)orintheformof DSUs.
83 Non-managementDirectorsalsoreceiveacashallowanceof $7,200perannumforthepurposesof obtainingrequiredtelecommunicationsservices and certain other products and services.
84 On February 10, 2009, Mr. Beddoe relinquished his role as Executive Chairman of Westjet in favour of acting solely as Chairman. As compensation for thistransition,Mr.Beddoeistoreceive$25,000permonth,effectiveFebruary2009,foraperiodof fiveyears(inadditiontoanannualretainerof $100,000).
85 $93,472of thisamountrepresentsthevalueof RSUsgrantedin2010;RSUsvestinone-fourthincrementsannuallyoneachgrantdateanniversary.
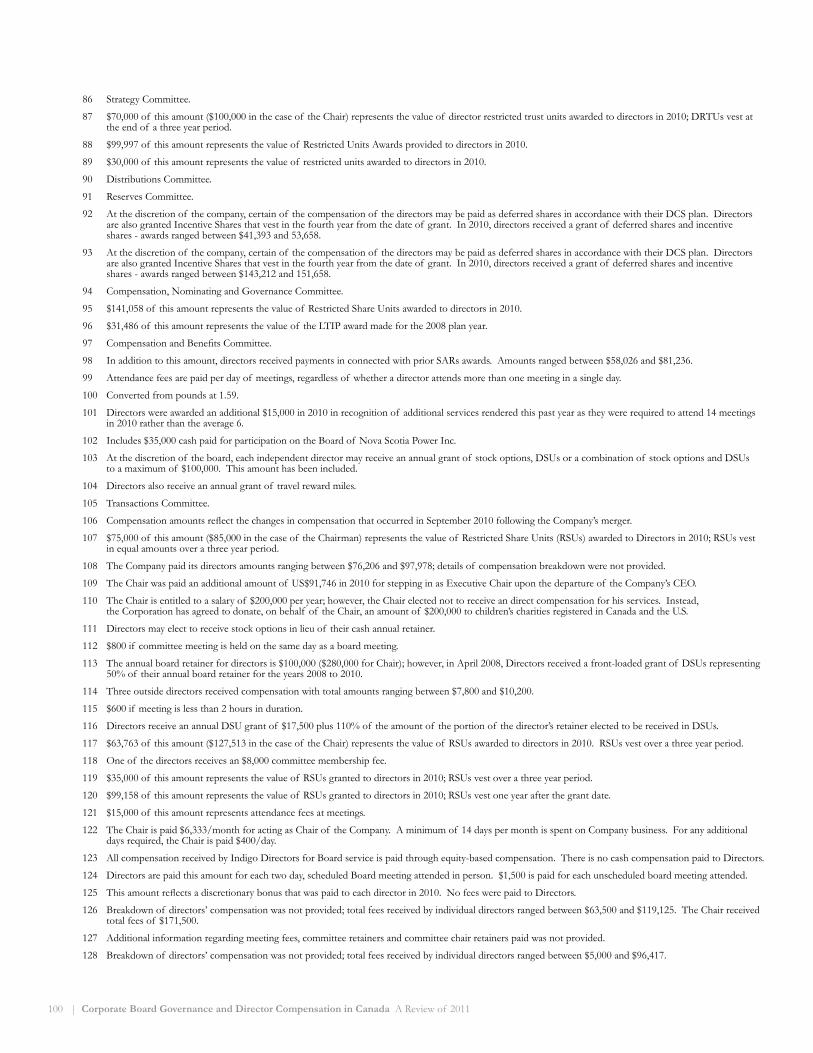
100 | Corporate Board Governance and Director Compensation in Canada A Review of 2011
86 Strategy Committee.
87 $70,000of thisamount($100,000inthecaseof theChair)representsthevalueof directorrestrictedtrustunitsawardedtodirectorsin2010;DRTUsvestat the end of a three year period.
88 $99,997of thisamountrepresentsthevalueof RestrictedUnitsAwardsprovidedtodirectorsin2010.
89 $30,000of thisamountrepresentsthevalueof restrictedunitsawardedtodirectorsin2010.
90 Distributions Committee.
91 Reserves Committee.
92 At the discretion of the company, certain of the compensation of the directors may be paid as deferred shares in accordance with their DCS plan. Directors are also granted Incentive Shares that vest in the fourth year from the date of grant. In 2010, directors received a grant of deferred shares and incentive shares-awardsrangedbetween$41,393and53,658.
93 At the discretion of the company, certain of the compensation of the directors may be paid as deferred shares in accordance with their DCS plan. Directors are also granted Incentive Shares that vest in the fourth year from the date of grant. In 2010, directors received a grant of deferred shares and incentive shares-awardsrangedbetween$143,212and151,658.
94 Compensation, Nominating and Governance Committee.
95 $141,058of thisamountrepresentsthevalueof RestrictedShareUnitsawardedtodirectorsin2010.
96 $31,486of thisamountrepresentsthevalueof theLTIPawardmadeforthe2008planyear.
97 CompensationandBenefitsCommittee.
98 Inadditiontothisamount,directorsreceivedpaymentsinconnectedwithpriorSARsawards.Amountsrangedbetween$58,026and$81,236.
99 Attendance fees are paid per day of meetings, regardless of whether a director attends more than one meeting in a single day.
100 Converted from pounds at 1.59.
101 Directorswereawardedanadditional$15,000in2010inrecognitionof additionalservicesrenderedthispastyearastheywererequiredtoattend14meetings in 2010 rather than the average 6.
102 Includes$35,000cashpaidforparticipationontheBoardof NovaScotiaPowerInc.
103 Atthediscretionof theboard,eachindependentdirectormayreceiveanannualgrantof stockoptions,DSUsoracombinationof stockoptionsandDSUs toamaximumof $100,000.Thisamounthasbeenincluded.
104 Directors also receive an annual grant of travel reward miles.
105 Transactions Committee.
106 CompensationamountsreflectthechangesincompensationthatoccurredinSeptember2010followingtheCompany’smerger.
107 $75,000of thisamount($85,000inthecaseof theChairman)representsthevalueof RestrictedShareUnits(RSUs)awardedtoDirectorsin2010;RSUsvest in equal amounts over a three year period.
108 TheCompanypaiditsdirectorsamountsrangingbetween$76,206and$97,978;detailsof compensationbreakdownwerenotprovided.
109 TheChairwaspaidanadditionalamountof US$91,746in2010forsteppinginasExecutiveChairuponthedepartureof theCompany’sCEO.
110 TheChairisentitledtoasalaryof $200,000peryear;however,theChairelectednottoreceiveandirectcompensationforhisservices.Instead, theCorporationhasagreedtodonate,onbehalf of theChair,anamountof $200,000tochildren’scharitiesregisteredinCanadaandtheU.S.
111 Directors may elect to receive stock options in lieu of their cash annual retainer.
112 $800if committeemeetingisheldonthesamedayasaboardmeeting.
113 Theannualboardretainerfordirectorsis$100,000($280,000forChair);however,inApril2008,Directorsreceivedafront-loadedgrantof DSUsrepresenting 50% of their annual board retainer for the years 2008 to 2010.
114 Threeoutsidedirectorsreceivedcompensationwithtotalamountsrangingbetween$7,800and$10,200.
115 $600if meetingislessthan2hoursinduration.
116 DirectorsreceiveanannualDSUgrantof $17,500plus110%of theamountof theportionof thedirector’sretainerelectedtobereceivedinDSUs.
117 $63,763of thisamount($127,513inthecaseof theChair)representsthevalueof RSUsawardedtodirectorsin2010.RSUsvestoverathreeyearperiod.
118 Oneof thedirectorsreceivesan$8,000committeemembershipfee.
119 $35,000of thisamountrepresentsthevalueof RSUsgrantedtodirectorsin2010;RSUsvestoverathreeyearperiod.
120 $99,158of thisamountrepresentsthevalueof RSUsgrantedtodirectorsin2010;RSUsvestoneyearafterthegrantdate.
121 $15,000of thisamountrepresentsattendancefeesatmeetings.
122 TheChairispaid$6,333/monthforactingasChairof theCompany.Aminimumof 14dayspermonthisspentonCompanybusiness.Foranyadditional daysrequired,theChairispaid$400/day.
123 All compensation received by Indigo Directors for Board service is paid through equity-based compensation. There is no cash compensation paid to Directors.
124 Directorsarepaidthisamountforeachtwoday,scheduledBoardmeetingattendedinperson.$1,500ispaidforeachunscheduledboardmeetingattended.
125 Thisamountreflectsadiscretionarybonusthatwaspaidtoeachdirectorin2010.NofeeswerepaidtoDirectors.
126 Breakdownof directors’compensationwasnotprovided;totalfeesreceivedbyindividualdirectorsrangedbetween$63,500and$119,125.TheChairreceived totalfeesof $171,500.
127 Additional information regarding meeting fees, committee retainers and committee chair retainers paid was not provided.
128 Breakdownof directors’compensationwasnotprovided;totalfeesreceivedbyindividualdirectorsrangedbetween$5,000and$96,417.

Corporate Board Governance and Director Compensation in Canada A Review of 2011 | 101
Korn/Ferry International
Since our inception, clients have trusted Korn/Ferry to help them recruit world-class leadership talent. Building on this heritage, today we are a single source for a wide range of leadership and talent consulting services.
Fromournearly80officesin40countries,weassistorganizationsinattracting,developing,retainingandsustainingtheir people. Services range from executive recruitment to leadership development programs, enterprise learning,
succession planning and recruitment process outsourcing.
MoreclientsaroundtheworldtrustKorn/Ferrythananyotherfirmtodeliveranddevelopthebestexecutives to run their organizations, a responsibility we take seriously and work every day to meet with unsurpassed
integrity and results.
Korn/Ferry Canada,s Board Services Practice
Korn/Ferry’sGlobalBoardServicesteamfieldsacoregroupof Boardsearchspecialistswhofocustheirpracticeactivityonrecruitingdirectorsforcorporations.Theyaresupportedbyseniorprofessionalsacrossthefirmwhoprovide in-depth local knowledge about current and “next generation” director candidates.
InCanada,theKorn/FerryBoardServicesPracticeassistscompaniesintheidentification,qualificationand attractionof directorsfromCanada,theUnitedStatesandelsewherearoundtheworld.ItisKorn/Ferry’smissionto ensure its clients recruit Board members who have the ability and time to make a substantial contribution, and who have a strong track record of achievement.
Canada - Board Services Practice Leaders
• Toronto 416-365-4043 Jeffrey Rosin, President, Canada, [email protected]
• Calgary 403-215-2553BobSutton,OfficeManagingDirectorandSeniorClientPartner, [email protected]
• Montréal 514-788-3086 Jean-Claude Lauzon, Senior Client Partner, [email protected]
• Vancouver604-608-6500KevinMcBurney,OfficeManagingDirectorandSeniorClientPartner, [email protected]
• LouiseWells,Directorof ResearchandAnalysis,2011CorporateBoardGovernanceandDirector Compensation Report (Calgary 403-269-3277)

102 | Corporate Board Governance and Director Compensation in Canada A Review of 2011
The Americas
Atlanta Bogotà BostonBuenos Aires Calgary CaracasChicago Dallas DurangoHouston Irvine LimaLos Angeles Mexico City MiamiMinneapolis Monterrey MontréalNew York Northern Virginia Philadelphia Princeton Quito Rio de JaneiroSan Francisco Santiago São PauloStamford Toronto VancouverWashington, D.C.
Europe, the Middle East and Africa
Amsterdam Athens Brussels Budapest Casablanca CopenhagenDubai Frankfurt GenevaHelsinki Istanbul JohannesburgKiev London LuxembourgLyon Madrid Milan Moscow Oslo Paris Rome Stockholm Vienna Warsaw Zurich
Asia Pacific
Auckland Bangalore Bangkok Beijing Brisbane Guangzhou Hong Kong Jakarta Kuala LumpurMelbourne Mumbai New Delhi Seoul Shanghai Singapore Sydney Taipei Tokyo Wellington
For more information on the Korn/Ferry International family of companies, visit www.kornferry.com.
Korn/Ferry International

Corporate Board Governance and Director Compensation in Canada A Review of 2011 | 103
Patrick O,Callaghan and Associates
Patrick O’Callaghan and Associates specializes in board effectiveness and director recruitment in the public, privateandnot-for-profitsectors.Since1992,PatrickO’CallaghanandAssociateshasprovidedboard
governance advice to organizations in a wide range of industries throughout Canada, including assignments with federal and provincial crown corporations.
Patrick O’Callaghan has been the primary author of the Governance and Compensation Report since 1992, including this year’s Special Survey Report - Retirement Age and Term Policies – A New Focus.
Patrick O,Callaghan and Associates Consulting Services
• Undertakingboard,boardchair,committee,committeechair,andindividualdirectorperformanceevaluationswith a focus on practical methodology and actionable results.
• Definingandclarifyingboardrolesandresponsibilitiesthatfocusonoptimizingtheeffectivenessof theboard.
• Providingdirectorrecruitmentandboardcompositionstrategy(inpartnershipwithKorn/FerryInternational).
PatrickO’Callaghanisafrequentspeakerandseminarleaderoncorporategovernanceissues.Hehasfirst-handexperienceasadirectorof publicandprivateCanadiancorporationsandseveralnot-for-profitorganizations. Mr. O’Callaghan is Board Chair of Women On Board and a member of the Advisory Committee on Senior Level Retention and Compensation for the Treasury Board of Canada.
Patrick O’Callaghan and Associates has completed hundreds of board governance assignments throughout Canada andtheUnitedStates.Thefirm,inpartnershipwithKorn/FerryInternational,annuallyproducesCanada’smostcomprehensive governance review, Corporate Board Governance and Director Compensation in Canada – A Review.
Suite 3300, 1055 Dunsmuir Street P.O. Box 49206, Bentall 4 Vancouver, BC V7X 1K8
Telephone: (604) 685-5880 Fax: (604) 684-1884 Internet: www.poca.net E-mail: [email protected]
104 | Corporate Board Governance and Director Compensation in Canada A Review of 2011
Women On Board
WomenOnBoardpromotestheappointmentof womentoCanadiancorporateboards.Anot-for-profit organization established in 2007, our founders are Patrick O’Callaghan and Associates, Richard Ivey School of Business, and Korn/Ferry International Canada - each having played unique and integral
roles to the formation and ongoing development of Women On Board.
TheflagshipWomenOnBoardMentoringProgramgivesseniorexecutivewomenwithhighpotentialforboardmembership the opportunity to be mentored by leading Canadian board chairs and CEOs. It aims to develop a cadre of women to add to Canada’s talent pool of potential director candidates, to facilitate the appointment of Women On Board mentees to Canadian corporate boards, and to reinforce the commitment of leading Canadian companies to having more women on boards.
Launched in 2007 with 5 mentoring pairs, the program has successfully grown to its present 25 mentoring pairs and 29 alumni members. And now, as part of its commitment to advance its mentees and alumni, Women On Board also hosts the WomenOnBoard Knowledge Series and publishes WomenOnBoard Source.
Women On Board is able to provide these important initiatives because of the invaluable contributions of its men-tors and the generous funding and support of all its sponsors.
Further information about Women On Board can be found at www.womenonboard.ca or by contacting:
Thea M. Miller, Managing Director Women On Board Suite 3300, Four Bentall Centre, 1055 Dunsmuir Street PO Box 49206 Vancouver, British Columbia V7X 1K8
Tel: 604-685-5277 Fax: 604-684-1884 Email: [email protected]