2018 - CENTROTEC SE...Business Performance | 2 First-Half Report /2018 | CENTROTEC Highlights...
26
02 Half-Year Report 2018 CENTROTEC – The European Energy-Saving Company
Transcript of 2018 - CENTROTEC SE...Business Performance | 2 First-Half Report /2018 | CENTROTEC Highlights...
02 Half-Year Report2018
CENTROTEC – The European Energy-Saving Company

Business Performance | 2
Fir
st-
Half
Rep
ort/
20
18
| C
EN
TR
OT
EC
Hig
hlig
hts
Highlights
> Further progress with internationalisation; business in German heating market stabilising
> Group revenue up 4.6% on first half of previous year at EUR 286.4 million (previous year
EUR 273.8 million); international share rises from 47% to 49%
- Climate Systems revenue increased by 3.4% to EUR 197.4 million based on good second quarter
(previous year EUR 190.9 million); stable development in German heating market, CHP business
remains weak
- Gas Flue Systems with 10.0% revenue growth to EUR 62.8 million (previous year EUR 57.1
million); growth in all key areas of segment
- Medical Technology & Engineering Plastics with 1.5% revenue growth to EUR 26.2 million
(previous year EUR 25.8 million); increased revenue for Engineering Plastics
> Operating profit up on previous year
- EBITDA of EUR 19.0 million (previous year EUR 18.0 million)
- Depreciation and amortisation slightly below previous year at EUR 12.0 million (EUR 12.2 million)
- EBIT reaches EUR 7.0 million (previous year EUR 5.8 million)
- Deterioration in net interest and financial result
- EPS of EUR 0.06 (previous year EUR 0.12)
> Positive macroeconomic outlook for all relevant markets
> For the full year, as before revenue is expected to rise to between EUR 600 and 620 million with a
slight year-on-year increase in the operating result (EBIT) to between EUR 30 and 32 million.
Consolidated Key Figures
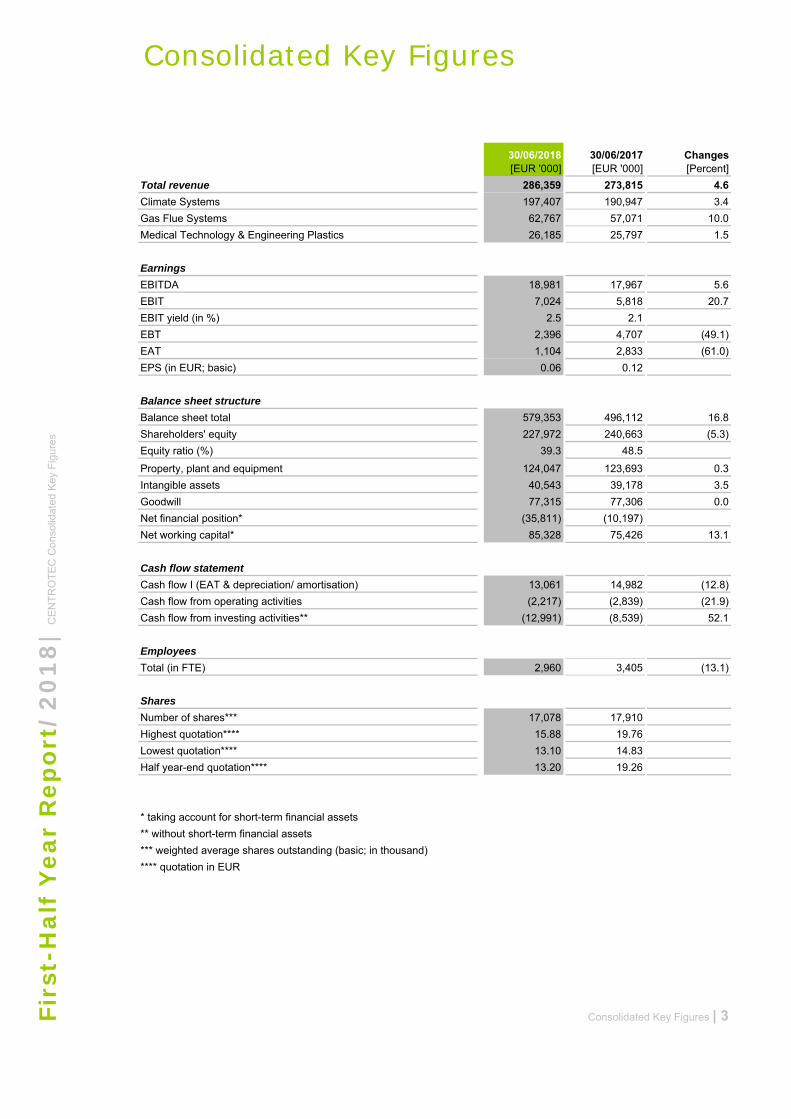
Total revenue 286,359 273,815 4.6
Climate Systems 197,407 190,947 3.4
Gas Flue Systems 62,767 57,071 10.0
Medical Technology & Engineering Plastics 26,185 25,797 1.5
Earnings
EBITDA 18,981 17,967 5.6
EBIT 7,024 5,818 20.7
EBIT yield (in %) 2.5 2.1
EBT 2,396 4,707 (49.1)
EAT 1,104 2,833 (61.0)
EPS (in EUR; basic) 0.06 0.12
Balance sheet structure
Balance sheet total 579,353 496,112 16.8
Shareholders' equity 227,972 240,663 (5.3)
Equity ratio (%) 39.3 48.5
Property, plant and equipment 124,047 123,693 0.3
Intangible assets 40,543 39,178 3.5
Goodwill 77,315 77,306 0.0
Net financial position* (35,811) (10,197)
Net working capital* 85,328 75,426 13.1
Cash flow statement
Cash flow I (EAT & depreciation/ amortisation) 13,061 14,982 (12.8)
Cash flow from operating activities (2,217) (2,839) (21.9)
Cash flow from investing activities** (12,991) (8,539) 52.1
Employees
Total (in FTE) 2,960 3,405 (13.1)
Shares
Number of shares*** 17,078 17,910
Highest quotation**** 15.88 19.76
Lowest quotation**** 13.10 14.83
Half year-end quotation**** 13.20 19.26
* taking account for short-term financial assets
** without short-term financial assets
*** weighted average shares outstanding (basic; in thousand)
**** quotation in EUR
Consolidated Key Figures | 3
30/06/2018[EUR '000]
Changes [Percent]
Firs
t-H
alf
Yea
r R
epor
t/2
01
8|
CE
NT
RO
TE
C C
onso
lidat
ed K
ey F
igur
es
30/06/2017[EUR '000]

1
2
1 2
System supplier for home ventilation, condensing boilers and heat pumps
RESIDENTAL BUILDINGS
The highly efficient Wolf heat pumps open the way for a pioneering form of heating technology for buildings that taps the potential of renewable energies. For the energy renovation of the existing building stock, condensing systems for oil and gas are recommended. They make optimum use of these fossil fuels and thus conserve scant resources. Both alternatives, in combination with a ventilation system with heat recovery of up to 95%, ensure permanently high indoor air quality with maximum energy efficiency.
1 WolfsplitheatpumpwithintegratedhomeventilationsystemofBrink
2 Wolfheatpumpprogram

Business Performance | 5
Fir
st-
Half
Rep
ort/
20
18
|C
EN
TR
OT
EC
Inte
rim G
roup
Man
agem
ent R
epor
t
Interim Group Management Report General economic situation
The overall economic environment in which the CENTROTEC Group – hereinafter also referred to as
CENTROTEC – was stable in the first six months of 2018. Economic growth in Germany continued, and the
same was true of most of the international markets in the group’s focus. However protectionist tendencies in
individual countries and embargoes increasingly pose a threat to global economic development.
Financial performance Revenue
In the first half of the 2018 financial year the CENTROTEC Group increased its revenue by 4.6% to EUR 286.4
million (previous year EUR 273.8 million) thanks to growth achieved in all three corporate segments. The share
of revenue generated internationally came to 49% (previous year 47%). The two most important markets apart
from Germany – the Netherlands and France – brought the highest revenue growth for CENTROTEC
companies, with the rates of increase well into double figures. The growth rates in Spain, China and the USA
were equally above the group average.
In the Climate Systems segment, revenue for the first six months of the current financial year rose 3.4% to
EUR 197.4 million (previous year EUR 190.9 million). Alongside the continuing process of internationalisation in
all product areas specifically of this segment, the growing stabilisation of German heating business as well as
very good capacity utilisation for climate control business served as the bedrock for this growth. In the area of
combined heat and power units, the performance was weaker compared to the previous year. That area is
currently suffering from an unclear regulatory environment which is severely eroding willingness to invest in
natural gas CHPs. In the Climate Systems segment, the growth rates for revenue in almost all relevant
international markets were higher than those for the German home market, which equally delivered revenue
growth.
Revenue by segment Q2 2018 Q2 2017 Delta Q1 – Q2 2018
Q1 – Q2 2017
Delta
[EUR million] % %
Climate Systems 102.9 94.3 9.1 197.4 190.9 3.4
Gas Flue Systems 31.2 29.1 6.9 62.8 57.1 10.0
Medical Technology & Engineering Plastics
13.0 13.1 (0.7) 26.2 25.8 1.5
Total 147.0 136.5 7.7 286.4 273.8 4.6
The Gas Flue Systems segment increased its revenue for the first half by 10.0% to EUR 62.8 million (previous
year EUR 57.1 million). As was already the case in the opening months of the year, it delivered revenue growth

Business Performance | 6
Fir
st-
Half
Rep
ort/
20
18
|C
EN
TR
OT
EC
Inte
rim G
roup
Man
agem
ent R
epor
t
over the first half in almost all relevant markets, including Germany. The most significant revenue growth was
achieved in the national markets France and the Netherlands, which are those of greatest significance for the
Gas Flue Systems segment. All areas of air piping and flue gas ducting as well as roofing technology
contributed to growth.
Revenue for the Medical Technology & Engineering Plastics segment in the first half of 2018 went up 1.5%
year on year to EUR 26.2 million (previous year EUR 25.8 million). This revenue growth, achieved particularly in
the first few months of the financial year, stemmed principally from the Engineering Plastics area.
Earnings
The operating result for the CENTROTEC Group for the first half of 2018 was up on the prior-year figures.
There was a 5.6% rise in EBITDA to EUR 19.0 million (previous year EUR 18.0 million). On that basis, and
thanks to slightly lower depreciation and amortisation, EBIT climbed from EUR 5.8 million in the previous year
to EUR 7.0 million in 2018, and therefore by 20.7%. As was already the case in the first quarter, the first half
saw a largely earnings-neutral shift between personnel expenses and purchased services.
In the Climate Systems segment, despite a negative shift in the product mix in terms of the impact on margins,
EBITDA went up by 13.6% to EUR 7.5 million EUR (previous year EUR 6.6 million). With the level of
depreciation and amortisation remaining constant, EBIT of EUR 0.2 million in the seasonally typically weak first
half was marginally positive, compared with negative EBIT of EUR -0.7 million in the same period of the
previous year.
The Gas Flue Systems segment increased its EBITDA for the first six months of the 2018 financial year by
5.7% to EUR 8.0 million (previous year EUR 7.5 million) thanks to the positive effects of revenue growth. That,
along with the slightly reduced level of depreciation and amortisation, lifted first-half EBIT by 15.6% to EUR 5.0
million (previous year EUR 4.3 million).
The Medical Technology & Engineering Plastics segment posted EBITDA of EUR 3.5 million for the first half
of 2018 and EBIT of EUR 1.8 million. In the first half of the previous year these figures had been slightly higher,
at EUR 3.8 million for EBITDA and EUR 2.2 million for EBIT.
As a consequence of the promissory note loan raised mid-way through last year, the interest burden was higher
and had the effect of diminishing earnings before tax (EBT), as did the largely unrealised fluctuations in the
value of investments that are recognised in the financial result. This took EBT for the first half of 2018 to
EUR 2.4 million, as against EUR 4.7 million in the previous year. Earnings after tax (EAT) came to EUR 1.1
million (previous year EUR 2.8 million). With a reduced number of shares following the share buyback, this
represented earnings per share (EPS) of EUR 0.06 (previous year EUR 0.12).
Net worth and financial position
At June 30, 2018 the balance sheet total for the CENTROTEC Group came to EUR 579.4 million and was
therefore up almost one-fifth on the prior-year figure of EUR 496.1 million, in essence as a result of the
promissory note loan for EUR 90 million raised in mid-2017. Compared with the end of 2017 (EUR 580.5
million) it revealed only a marginal change. EUR. As a result of the share buyback conducted at the end of the
first half of 2018 for a total outlay of EUR 25.4 million, shareholders’ equity declined to EUR 228.0 million
Business Performance | 7
Fir
st-
Half
Rep
ort/
20
18
|C
EN
TR
OT
EC
Inte
rim G
roup
Man
agem
ent R
epor
t
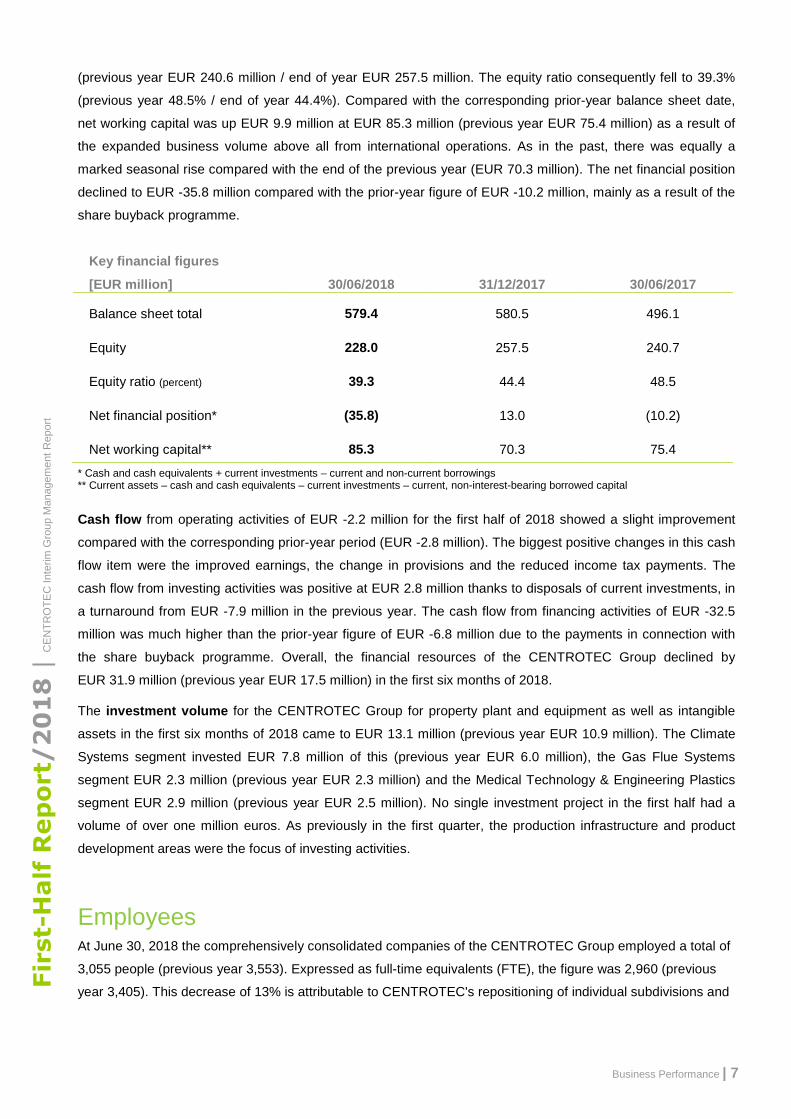
(previous year EUR 240.6 million / end of year EUR 257.5 million. The equity ratio consequently fell to 39.3%
(previous year 48.5% / end of year 44.4%). Compared with the corresponding prior-year balance sheet date,
net working capital was up EUR 9.9 million at EUR 85.3 million (previous year EUR 75.4 million) as a result of
the expanded business volume above all from international operations. As in the past, there was equally a
marked seasonal rise compared with the end of the previous year (EUR 70.3 million). The net financial position
declined to EUR -35.8 million compared with the prior-year figure of EUR -10.2 million, mainly as a result of the
share buyback programme.
Key financial figures
[EUR million] 30/06/2018 31/12/2017 30/06/2017
Balance sheet total 579.4 580.5 496.1
Equity 228.0 257.5 240.7
Equity ratio (percent) 39.3 44.4 48.5
Net financial position* (35.8) 13.0 (10.2)
Net working capital** 85.3 70.3 75.4
* Cash and cash equivalents + current investments – current and non-current borrowings** Current assets – cash and cash equivalents – current investments – current, non-interest-bearing borrowed capital
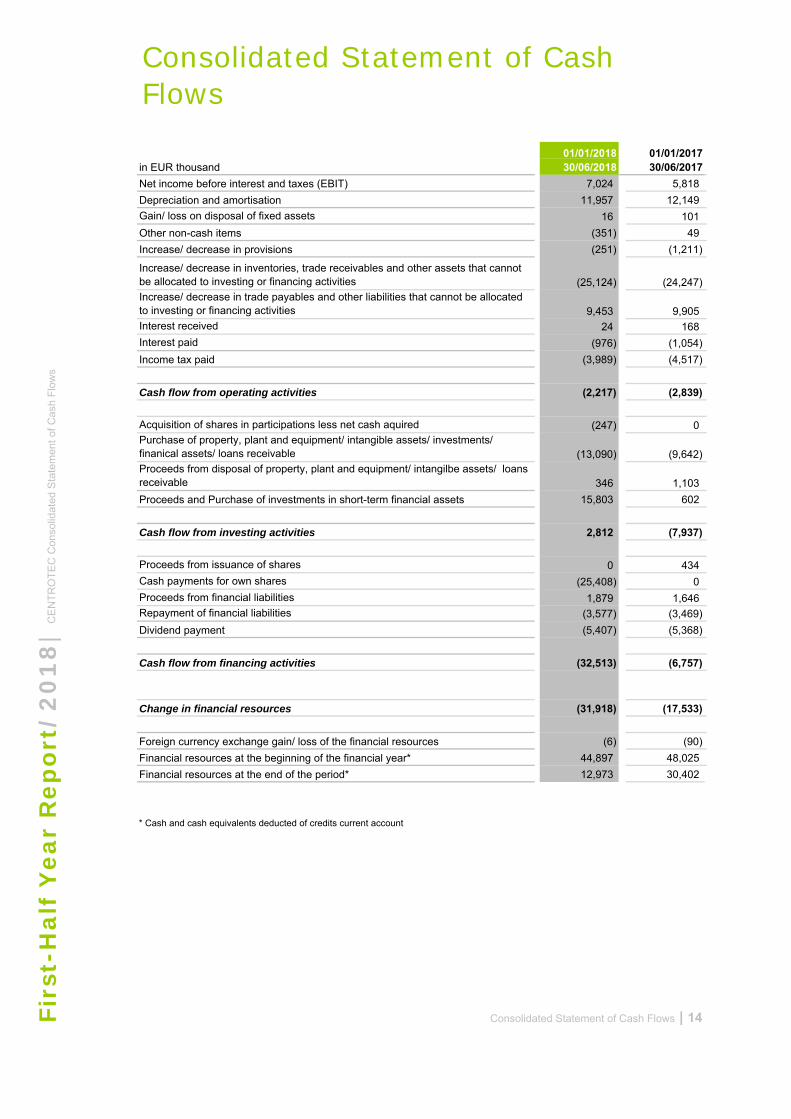
Cash flow from operating activities of EUR -2.2 million for the first half of 2018 showed a slight improvement
compared with the corresponding prior-year period (EUR -2.8 million). The biggest positive changes in this cash
flow item were the improved earnings, the change in provisions and the reduced income tax payments. The
cash flow from investing activities was positive at EUR 2.8 million thanks to disposals of current investments, in
a turnaround from EUR -7.9 million in the previous year. The cash flow from financing activities of EUR -32.5
million was much higher than the prior-year figure of EUR -6.8 million due to the payments in connection with
the share buyback programme. Overall, the financial resources of the CENTROTEC Group declined by
EUR 31.9 million (previous year EUR 17.5 million) in the first six months of 2018.
The investment volume for the CENTROTEC Group for property plant and equipment as well as intangible
assets in the first six months of 2018 came to EUR 13.1 million (previous year EUR 10.9 million). The Climate
Systems segment invested EUR 7.8 million of this (previous year EUR 6.0 million), the Gas Flue Systems
segment EUR 2.3 million (previous year EUR 2.3 million) and the Medical Technology & Engineering Plastics
segment EUR 2.9 million (previous year EUR 2.5 million). No single investment project in the first half had a
volume of over one million euros. As previously in the first quarter, the production infrastructure and product
development areas were the focus of investing activities.
Employees At June 30, 2018 the comprehensively consolidated companies of the CENTROTEC Group employed a total of
3,055 people (previous year 3,553). Expressed as full-time equivalents (FTE), the figure was 2,960 (previous
year 3,405). This decrease of 13% is attributable to CENTROTEC's repositioning of individual subdivisions and

Business Performance | 8
Fir
st-
Half
Rep
ort/
20
18
|C
EN
TR
OT
EC
Inte
rim G
roup
Man
agem
ent R
epor
t
the associated outsourcing of personnel management tasks to external companies. The number of temporary
workers, expressed in FTE, equally fell to 149 (previous year 173).
The personnel expenses of the Group fell correspondingly by 7.4% to EUR 86.6 million in the first half of 2018
(previous year EUR 93.5 million). The personnel expenses ratio, taking account of the costs of temporary
workers, thus declined to 31.3% (previous year 35.2%). The cost of purchased services was correspondingly
higher.
Shares The trading price of CENTROTEC shares (WKN 540 750 or ISIN DE0005407506) suffered notable setbacks in
the course of the first half of 2018. The start of January brought the year-high of EUR 15.88 in XETRA trading
on the German Stock Exchange, with a low point of EUR 13.10 for the first half of 2018 reached shortly before
the end of the period (previous year between EUR 14.83 and 19.76). The shares ended the first half at
EUR 13.20 on June 30, 2018. One year earlier, the corresponding trading price had been EUR 19.26. After the
period under review the price declined further but then stabilised from mid-July in the region of just under
EUR 13. The number of shares traded in the first half initially rose slightly compared with the prior-year period,
then sharply after the share buyback programme in June.
CENTROTEC share price performance and trading volume (XETRA) from Jan to early August 2018; Source: www.ariva.de
18,020,923 no-par value ordinary shares of CENTROTEC Sustainable AG were approved for trading at
German stock exchanges at June 30, 2018. Of these, CENTROTEC bought back a total of 1,764,470 shares by
Business Performance | 9
Fir
st-
Half
Rep
ort/
20
18
|C
EN
TR
OT
EC
Inte
rim G
roup
Man
agem
ent R
epor
t
the end of the first half of 2018 and now holds these as treasury shares. The plan is to retire these in the
second half of the year. This total number of shares multiplied by the closing price of EUR 13.20 at June 30,
2018 gave the CENTROTEC Group market capitalisation of EUR 238 million at the end of the half (previous
year EUR 345 million).
CENTROTEC is not aware of any major developments affecting its share ownership structure compared with
the end of the 2017 financial year. The family of Supervisory Board Chairman Guido A Krass has remained the
principal shareholder of CENTROTEC Sustainable AG since the IPO and did not sell any shares under the
share buyback programme. That group aside, there are no indications that other shareholders hold a
percentage interest in CENTROTEC running into double figures. Nevertheless, changes across the thresholds
that trigger reporting requirements in accordance with Section 26 (1) of the German Securities Trading Act
(WpHG) have been reported by institutional investors in the year to date. Detailed information of such changes
is regularly updated and is available on the homepage of CENTROTEC Sustainable AG at
(http://www.centrotec.de/investor-relations/aktie/veroeffentl-26-abs-1-wphg.html).
Opportunities and risks The opportunities and risks presented in the 2017 Annual Report remain valid. Nor have the assessments, the
methods of risk identification and the measures derived from them for the controlling of risks changed materially
compared with the view presented in the 2017 Group Management Report.
Forecast All in all, the first half of 2018 progressed in line with expectations. On this basis CENTROTEC confirms the
full-year forecast, which anticipates organic revenue growth to between EUR 600 and 620 million and a slightly
higher operating result (EBIT) of between EUR 30 and 32 million.
Brilon, August 2018
The Management Board

1
2
2
1
System supplier for air handling units and combined heat and power solutions
COMMERCIAL BUILDINGS
Ultra-efficient climate control solutions of Wolf create a healthy interior climate. Through heat recovery, they significantly help to save energy and cut heating energy requirements and CO2 emissions.
Combined heat and power plants (CHP) of Wolf form the basis forenergy-efficient and non-central generation of power and heat by means of co-generation at the point of use. Energy sources thus achieve an overall energy efficiency of up to 90%.
1 Wolflarge-scaleairhandlingunit
2 Wolfcombinedheatandpowersystem

Non-current assets
Goodwill 77,315 77,285 77,306
Intangible assets 40,543 39,734 39,178
Property, plant and equipment 124,047 124,017 123,693
Financial investments accountend for using the equity method 64 39 0
Loans and investments 1,272 1,076 1,114
Other financial assets 9 9 10
Other assets 54 78 80
Deferred tax assets 3,536 2,108 3,288
246,840 244,346 244,669
Current assets
Inventories 81,256 71,639 74,514
Trade Receivables 82,058 67,684 75,272
Income tax receivable 3,546 3,219 3,679
Cash and cash equivalents 48,878 59,492 57,592
Other financial assets 109,193 128,237 32,842
Other assets 7,582 5,855 7,544
332,513 336,126 251,443
Assets 579,353 580,472 496,112
Shareholders' equity
Share Capital 18,021 18,021 17,922
Capital reserves 40,659 40,659 38,632
Treasury stock (25,408) 0 0
Retained earnings and profit carryforward 193,596 179,155 182,470
Profit attributable to shareholders of CENTROTEC Sustainable AG 1,104 20,205 2,221
227,972 258,040 241,245
Non-controlling interests presented within equity 0 (559) (582)
227,972 257,481 240,663
Non-current liabilities
Pension provisions 45,706 46,231 44,537
Other provisions 15,446 16,079 17,098
Financial liabilities 147,946 149,484 62,840
Other financial liabilities 642 960 995
Other liabilities 25 25 79
Deferred tax liabilities 6,566 6,862 6,526
216,331 219,641 132,075
Current liabilities
Other provisions 3,707 3,571 3,830
Income tax payable 1,545 1,781 1,310
Financial liabilities 42,978 21,533 34,337
Trade liabilities 32,347 28,856 29,564
Other financial liabilities 20,658 14,068 17,662
Other liabilities 33,815 33,541 36,671
135,050 103,350 123,374
Equity and Liabilities 579,353 580,472 496,112
Consolidated Statement of Financial Position | 11
30/06/2017
30/06/2017
Firs
t-H
alf
Yea
r R
epor
t/2
01
8|
CE
NT
RO
TE
C C
onso
lidat
ed S
tate
men
t of
Fin
anci
al P
ositi
on
Equity and Liabilitiesin EUR thousand
Assetsin EUR thousand
30/06/2018
Consolidated Statement of Financial Position
31/12/2017
30/06/2018 31/12/2017

Revenues 147,006 136,490 286,359 273,815
Cost of purchased materials and services (73,563) (61,907) (142,308) (122,393)
Changes in inventories of finished goods and work in progress 2,096 760 5,359 2,967
Production for own fixed assets capitalised 1,190 860 2,008 1,560
Other income 2,280 2,182 4,333 4,104
Personnel expenses (44,622) (46,497) (86,631) (93,530)
Other expenses (25,169) (23,756) (50,139) (48,556)
EBITDA 9,218 8,132 18,981 17,967
Depreciation and amortisation (5,993) (6,112) (11,957) (12,149)
Operating income (EBIT) 3,225 2,020 7,024 5,818
Interest income 10 69 25 168
Interest expense (1,069) (749) (2,115) (1,443)
Other financial result (1,670) 132 (2,538) 164
Result before income taxes (EBT) 496 1,472 2,396 4,707
Income taxes (170) (16) (1,292) (1,874)
Net income (EAT) 326 1,456 1,104 2,833
attributable to:
Non-controlling interest 48 691 0 612
Shareholders of CENTROTEC Sustainable AG 278 765 1,104 2,221
EPS (Earnings per share in EUR)
Earnings per share (basic) 0.02 0.04 0.06 0.12
Earnings per share (diluted) 0.02 0.04 0.06 0.12
Weighted average shares outstanding (in thousand units; basic) 16,135 17,928 17,078 17,910
Weighted average shares outstanding (in thousand units; diluted) 16,135 17,938 17,078 17,920
Consolidated Income Statement | 12
in EUR thousand
Consolidated Income Statement
Firs
t-H
alf
Yea
r R
epo
rt/
20
18
| CE
NT
RO
TE
C C
on
solid
ate
d I
nco
me
Sta
tem
en
t
01/01/201830/06/2018
01/01/201730/06/2017
01/04/201830/06/2018
01/04/201730/06/2017

Net income (EAT) 326 1,456 1,104 2,833
Items that may be reclassified subsequently to profit or loss
Exchange Rate differences on translation (151) 142 (102) 289
Derivative financial instruments (179) 167 (94) 157
Available-for-sale financial assets 0 98 0 699
Income tax relating to components of other comprehensive income 63 (46) 28 (81)Other comprehensive income for items that may be reclassified subsequently to profit or loss (267) 361 (168) 1,064
Items that will not be reclassified to profit or loss
Remeasurements of defined benefit plans (1) 786 756 1,599
Income tax relating to components of other comprehensive income 1 (230) (221) (468)Other comprehensive income for items that will not be reclassified to profit or loss 0 556 535 1,131
Other comprehensive income (267) 917 367 2,195
Total comprehensive income 59 2,373 1,471 5,028
attributable to:
Non-controlling interest 50 719 0 628
Shareholders of CENTROTEC Sustainable AG 9 1,654 1,471 4,400
Consolidated Statement of Comprehensive Income | 13
01/01/201730/06/2017in EUR thousand
Firs
t-H
alf
Yea
r R
epo
rt/
20
18
| CE
NT
RO
TE
C C
on
solid
ate
d S
tate
me
nt o
f Co
mp
reh
en
sive
Inco
me
Consolidated Statement of Comprehensive Income
01/01/201830/06/2018
01/04/201830/06/2018
01/04/201730/06/2017
Net income before interest and taxes (EBIT) 7,024 5,818
Depreciation and amortisation 11,957 12,149
Gain/ loss on disposal of fixed assets 16 101
Other non-cash items (351) 49
Increase/ decrease in provisions (251) (1,211)
Increase/ decrease in inventories, trade receivables and other assets that cannot be allocated to investing or financing activities (25,124) (24,247)Increase/ decrease in trade payables and other liabilities that cannot be allocated to investing or financing activities 9,453 9,905Interest received 24 168
Interest paid (976) (1,054)
Income tax paid (3,989) (4,517)
Cash flow from operating activities (2,217) (2,839)
Acquisition of shares in participations less net cash aquired (247) 0Purchase of property, plant and equipment/ intangible assets/ investments/ finanical assets/ loans receivable (13,090) (9,642)Proceeds from disposal of property, plant and equipment/ intangilbe assets/ loans receivable 346 1,103
Proceeds and Purchase of investments in short-term financial assets 15,803 602
Cash flow from investing activities 2,812 (7,937)
Proceeds from issuance of shares 0 434
Cash payments for own shares (25,408) 0
Proceeds from financial liabilities 1,879 1,646Repayment of financial liabilities (3,577) (3,469)
Dividend payment (5,407) (5,368)
Cash flow from financing activities (32,513) (6,757)
Change in financial resources (31,918) (17,533)
Foreign currency exchange gain/ loss of the financial resources (6) (90)
Financial resources at the beginning of the financial year* 44,897 48,025
Financial resources at the end of the period* 12,973 30,402
* Cash and cash equivalents deducted of credits current account
Consolidated Statement of Cash Flows | 14
01/01/201830/06/2018
01/01/201730/06/2017in EUR thousand
Consolidated Statement of Cash Flows
Firs
t-H
alf
Yea
r R
epo
rt/2
01
8|
CE
NT
RO
TE
C C
onso
lidat
ed S
tate
men
t of
Cas
h F
low
s
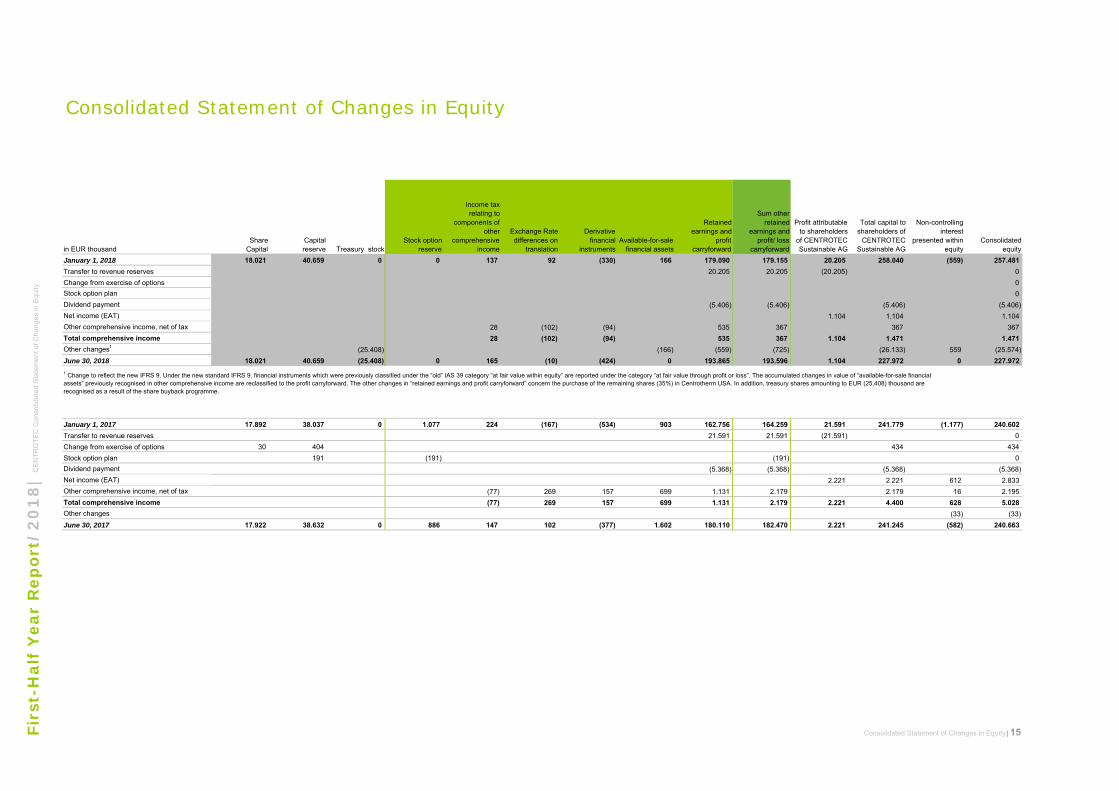
January 1, 2018 18.021 40.659 0 0 137 92 (330) 166 179.090 179.155 20.205 258.040 (559) 257.481
Transfer to revenue reserves 20.205 20.205 (20.205) 0
Change from exercise of options 0
Stock option plan 0
Dividend payment (5.406) (5.406) (5.406) (5.406)
Net income (EAT) 1.104 1.104 1.104
Other comprehensive income, net of tax 28 (102) (94) 535 367 367 367
Total comprehensive income 28 (102) (94) 535 367 1.104 1.471 1.471
Other changes1(25.408) (166) (559) (725) (26.133) 559 (25.574)
June 30, 2018 18.021 40.659 (25.408) 0 165 (10) (424) 0 193.865 193.596 1.104 227.972 0 227.972
January 1, 2017 17.892 38.037 0 1.077 224 (167) (534) 903 162.756 164.259 21.591 241.779 (1.177) 240.602
Transfer to revenue reserves 21.591 21.591 (21.591) 0
Change from exercise of options 30 404 434 434
Stock option plan 191 (191) (191) 0
Dividend payment (5.368) (5.368) (5.368) (5.368)
Net income (EAT) 2.221 2.221 612 2.833
Other comprehensive income, net of tax (77) 269 157 699 1.131 2.179 2.179 16 2.195
Total comprehensive income (77) 269 157 699 1.131 2.179 2.221 4.400 628 5.028
Other changes (33) (33)
June 30, 2017 17.922 38.632 0 886 147 102 (377) 1.602 180.110 182.470 2.221 241.245 (582) 240.663
Consolidated Statement of Changes in Equity | 15
Retained earnings and
profit carryforward
Capitalreservein EUR thousand
Consolidated equity
Stock optionreserve
Income tax relating to
components of other
comprehensive income
Derivative financial
instrumentsTreasury stock
Consolidated Statement of Changes in Equity
Available-for-sale financial assets
1 Change to reflect the new IFRS 9. Under the new standard IFRS 9, financial instruments which were previously classified under the “old” IAS 39 category “at fair value within equity” are reported under the category “at fair value through profit or loss”. The accumulated changes in value of “available-for-sale financial assets” previously recognised in other comprehensive income are reclassified to the profit carryforward. The other changes in “retained earnings and profit carryforward” concern the purchase of the remaining shares (35%) in Centrotherm USA. In addition, treasury shares amounting to EUR (25,408) thousand are recognised as a result of the share buyback programme.
Firs
t-H
alf
Yea
r R
epor
t/2
01
8|
CE
NT
RO
TE
C C
on
solid
ate
d S
tate
me
nt o
f Ch
an
ge
s in
Eq
uity
Total capital to shareholders of
CENTROTEC Sustainable AG
Non-controlling interest
presented within equity
Exchange Rate differences on
translation
Profit attributable to shareholders
of CENTROTEC Sustainable AG
Sum otherretained
earnings andprofit/ loss
carryforwardShare
Capital

Consolidated Segment Reporting(Part of the Notes)
Segment Structure
in EUR thousandIncome Statement
01/01/2018 30/06/2018
01/01/201730/06/2017
01/01/2018 30/06/2018
01/01/201730/06/2017
01/01/2018 30/06/2018
01/01/201730/06/2017
01/01/2018 30/06/2018
01/01/201730/06/2017
01/01/2018 30/06/2018
01/01/201730/06/2017
Revenue from third parties 197,407 190,947 62,767 57,071 26,185 25,797 0 0 286,359 273,815
Revenue from other segments 698 792 3,519 3,557 75 127 (4,292) (4,476) 0 0
Cost of purchased materials and services (96,711) (91,791) (31,924) (26,422) (17,979) (8,658) 4,306 4,478 (142,308) (122,393)
Changes in inventories of finished goods and work in progress 4,066 1,712 277 833 1,016 422 0 0 5,359 2,967
Personnel expenses (69,119) (65,840) (15,725) (17,583) (1,787) (10,107) 0 0 (86,631) (93,530)
Other expenses and income (28,793) (29,175) (10,948) (9,919) (4,057) (3,798) 0 0 (43,798) (42,892)
EBITDA 7,548 6,645 7,966 7,537 3,453 3,783 14 2 18,981 17,967
Depreciation and amortisation (7,351) (7,347) (2,999) (3,241) (1,607) (1,561) 0 0 (11,957) (12,149)
Segment result (EBIT) 197 (702) 4,967 4,296 1,846 2,222 14 2 7,024 5,818
Interest income 11 160 166 160 0 1 (152) (153) 25 168
Interest expenses (1,012) (1,077) (1,012) (264) (243) (255) 152 153 (2,115) (1,443)
Other financial result (36) 0 (2,502) 164 0 0 0 0 (2,538) 164
EBT (840) (1,619) 1,619 4,356 1,603 1,968 14 2 2,396 4,707
Balance sheet key figures
Assets* 293,985 288,850 223,096 148,593 53,905 50,478 (51) 109 570,935 488,030
Financial investments accounted for using the equity method 0 0 0 0 64 0 0 0 64 0
Loans and investmens 1,262 1,104 0 0 10 10 0 0 1,272 1,114
Net working capital 60,321 44,080 5,963 13,844 19,097 17,562 (53) (60) 85,328 75,426
Investments
Total investments in property, plant, equipment and intangible assetss** 7,837 6,045 2,346 2,347 2,908 2,545 0 0 13,091 10,937
* Excl. financial investments accounted for using the equity method, loans and investments, entitlement to income tax rebates as well as deferred tax assets
** Incl. goodwill and figures out of business combinations
Consolidated Segment Reporting | 16
TOTALClimate Systems Gas Flue SystemsMedical Technology &
Engineering Plastics Consolidation
Firs
t-H
alf
Yea
r R
epo
rt/2
01
8|
CE
NT
RO
TE
C C
on
solid
ate
d S
eg
me
nt
Re
po
rtin
g
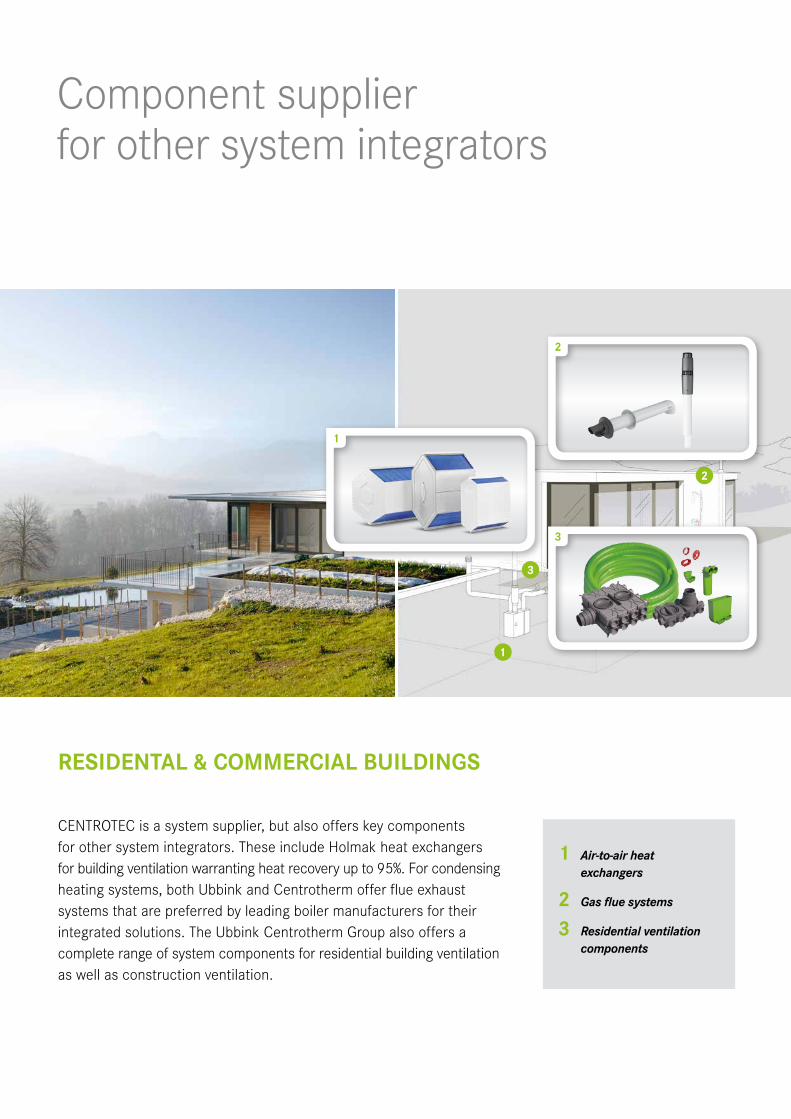
Component supplier for other system integrators
RESIDENTAL & COMMERCIAL BUILDINGS
CENTROTEC is a system supplier, but also offers key components for other system integrators. These include Holmak heat exchangersfor building ventilation warranting heat recovery up to 95%. For condensing heating systems, both Ubbink and Centrotherm offer flue exhaust systems that are preferred by leading boiler manufacturers for their integrated solutions. The Ubbink Centrotherm Group also offers acomplete range of system components for residential building ventilation as well as construction ventilation.
3
1
1
2
3
2
1 Air-to-airheatexchangers
2 Gasfluesystems
3 Residentialventilationcomponents
Notes to the Consolidated Financial Statements |18
Fir
st-
Half
Rep
ort
20
18
| C
EN
TR
OT
EC
Not
es to
the
Con
solid
ated
Fin
anci
al S
tate
men
ts
Notes to the Consolidated Financial
Statements
Corporate information
The CENTROTEC Group – hereinafter also referred to as CENTROTEC – is an international
group focusing on the development, manufacturing and sale of system solutions that promote
energy efficiency and use renewable energies in buildings. In addition to its existing business
activities, CENTROTEC regards its business purpose as including the establishment and
acquisition of new business areas and companies.
The group parent, CENTROTEC Sustainable AG with registered office in Brilon, is listed on the
Frankfurt Stock Exchange under the stock exchange codes CEV, WKN 540750 and ISIN
DE 0005407506. It is entered on the Commercial Register of the Local Court of Arnsberg,
Germany, under the number HRB 2161. The company’s head office is located at Am
Patbergschen Dorn 9, 59929 Brilon, Germany. CENTROTEC Sustainable AG is not part of a
superordinate group, and is the ultimate parent company of the group presented in these
Interim Financial Statements. Further financial and corporate information on CENTROTEC is
available from the above address, or on the homepage www.centrotec.de.
Accounting standards and policies
These Interim Financial Statements at June 30, 2018 have been prepared in accordance with
the International Financial Reporting Standards (IFRS) for interim financial reporting issued by
the International Accounting Standards Board (IASB), as adopted within the European Union
(EU), taking account of Section 315e (1) of German Commercial Code. All IFRS standards,
and in particular IAS 34 (Interim Financial Reporting), that were valid at the reporting date and
the adoption of which was mandatory at that date, have been applied. The accounting policies
explained in the Consolidated Financial Statements for 2017 have likewise been applied in
these Interim Financial Statements, except in the case of amendments to standards to be
adopted for the first time, and apply correspondingly. The First-Half Report should therefore be
read in conjunction with the audited Consolidated Financial Statements at December 31, 2017.
These Interim Financial Statements and the Interim Management Report have not been
audited in accordance with Section 317 of German Commercial Code, nor have they been
subjected to any scrutiny by an independent auditor.
The first-half reporting date for all companies included in the Interim Consolidated Financial
Statements is June 30, 2018. The financial statements have been prepared in euros; unless
otherwise indicated, the amounts quoted are in thousand euros (EUR thousand). For
mathematical reasons, there may be rounding differences of +/- one unit.

Notes to the Consolidated Financial Statements |19
Fir
st-
Half
Rep
ort
20
18
| C
EN
TR
OT
EC
Not
es to
the
Con
solid
ated
Fin
anci
al S
tate
men
ts
The Management Board points out that the future-related statements made in the Interim
Financial Statements are based on current expectations, assumptions and estimates. These
statements are not to be interpreted as guarantees that the forecasts made will prove correct.
Rather, future developments and occurrences are dependent on a wide range of factors that
are subject to risks and uncertainties, the influencing factors of which may lie outside the
sphere of influence of CENTROTEC. Actual developments may therefore depart from any
implicit or explicit future-related statements made.
Corporate and investment structure
The business activities of CENTROTEC are classified according to the segments Climate
Systems, Gas Flue Systems, and Medical Technology & Engineering Plastics. All direct and
indirect subsidiaries of the parent company and group parent are included in the Consolidated
Financial Statements of CENTROTEC. The subsidiary Centrotherm Eco Systems, LLC has
belonged 100% to CENTROTEC since May 1, 2018. The remaining 35% of the shares were
acquired for a purchase price of USD 300 thousand. That aside, there have been no changes
in consolidation since the annual financial statements at December 31, 2017.
Notes to the Interim Financial Statements
- Recognition and measurement aspects
The new IFRS 15, adoption of which has been mandatory since January 1, 2018, has no
significant influence on the net worth, financial position and financial performance of
CENTROTEC. The various business models of the CENTROTEC companies are
fundamentally based on matched maturities between performance and invoicing. Pursuant to
the requirements of IAS 34.16A, revenues are to be broken down in accordance with the
requirements of IFRS 15.114 and IFRS 15.115:
Revenue from third parties by product group, EUR ’000
Climate Systems Gas Flue Systems Medical Technology &
Engineering Plastics
Total
2018 2017 2018 2017 2018 2017 2018 2017
Sale of products 191,625 185,563 62,760 57,064 26,185 25,797 280,570 286,424
Sale of services 5,757 5,358 7 7 0 0 5,764 5,365
Miscellaneous 25 26 0 0 0 0 25 26
Total 197,407 190,947 62,767 57,072 26,185 25,797 286,359 273,815

Notes to the Consolidated Financial Statements |20
Fir
st-
Half
Rep
ort
20
18
| C
EN
TR
OT
EC
Not
es to
the
Con
solid
ated
Fin
anci
al S
tate
men
ts
Revenue from third parties by country, EUR ’000
Climate Systems Gas Flue Systems Medical Technology &
Engineering Plastics
Total
2018 2017 2018 2017 2018 2017 2018 2017
European euro
countries
174,666 167,583 50,985 45,926 17,399 17,577 243,050 231,136
European non-euro
countries
16,290 17,294 5,029 4,642 6,362 6,323 27,680 28,235
Rest of world 6,451 6,070 6,753 6,503 2,424 1,897 15,629 14,445
Total 197,407 190,947 62,767 57,072 26,185 25,797 286,359 273,815
The adoption of the new IFRS 9 meant an amount of EUR 166 thousand that was shown
income-neutrally under “available-for-sale financial assets” until December 31, 2017 was
reclassified to the profit carryforward.
Further detailed notes on the income statement, balance sheet and cash flow statement can be
found in the section “Earnings” and the section “Net worth and financial position” of the Interim
Group Management Report.
- Related party disclosures
Within CENTROTEC, goods and services are purchased by a large number of business
partners. They are also supplied by or to persons or companies who can be classified as
related parties. Transactions with these persons or companies are conducted at arm’s length.
Transactions with related parties were presented comprehensively in the Consolidated
Financial Statements for 2017. All reciprocated services such as the use of infrastructure are
billed on generally accepted market terms (arm’s length principle).
- Reportable security holdings and options
The totals of reportable shares and stock options at June 30, 2018 are shown in the following
table.
Management Board Shares Options
Dr Thomas Kneip 0 0
Bernhard Pawlik 0 0
Dr Christoph Traxler 0 0
Supervisory Board Shares Options
Guido A Krass 2,400,000 0
Dr Bernhard Heiss 77,340 0
Christian C Pochtler, MA 0 0

Notes to the Consolidated Financial Statements |21
Fir
st-
Half
Rep
ort
20
18
| C
EN
TR
OT
EC
Not
es to
the
Con
solid
ated
Fin
anci
al S
tate
men
ts
CENTROTEC Shares Options
Ordinary shares 18,020,923 0
Treasury stock 1,764,470 0
- Contingent liabilities
There has been no significant change in contingent liabilities since the balance sheet date of
December 31, 2017.
- Dividend payments
In May a dividend of EUR 0.30 (previous year EUR 0.30) per dividend-bearing share was
distributed for the 2017 financial year.
- Change in the capital stock and the number of shares
In the second quarter, 1,764,470 own shares were repurchased under a public share buyback
programme. The offer/purchase price was EUR 14.40 per no par value share. CENTROTEC
consequently now has treasury shares amounting to EUR 25,408 thousand. The capital stock
has remained unchanged compared with December 31, 2017.
Significant events occurring after the first-half reporting date
With effect from July 1, 2018 and until the next Annual General Meeting, Andreas Freiherr von
Maltzan is appointed as member of the Supervisory Board in the place of the Supervisory
Board member Dr Bernhard-R Heiss, who resigned with effect from June 30, 2018 on health
grounds. There were no other events of material significance after the first-half reporting date.
Management Board and Supervisory Board
- The members of the Management Board at the reporting date were:
Dr Thomas Kneip, Regensburg, Germany, merchant, CFO
Bernhard Pawlik, Ottobrunn, Germany, Industrial Engineering graduate (since April 1, 2018)
Dr Christoph Traxler, Fulda, Germany, physicist

Notes to the Consolidated Financial Statements |22
Fir
st-
Half
Rep
ort
20
18
| C
EN
TR
OT
EC
Not
es to
the
Con
solid
ated
Fin
anci
al S
tate
men
ts
- The members of the Supervisory Board at the reporting date were:
Guido A Krass, Oberwil-Lieli, Switzerland, entrepreneur (Chairman)
Dr Bernhard Heiss, Munich, Germany, lawyer (until June 30, 2018)
Andreas Freiherr von Maltzan, Munich Germany, entrepreneur (since July 1, 2018)
Christian C Pochtler, MA, Vienna, Austria, entrepreneur
Other particulars
- Corporate Governance Code
The Management Board and Supervisory Board of CENTROTEC Sustainable AG have,
pursuant to Section 161 of German Stock Corporation Law, declared the extent to which they
have complied with and will comply with the recommendations of the Government Commission
on the German Corporate Governance Code. The regularly submitted declarations and
explanations are permanently available on the website of CENTROTEC Sustainable AG.
Brilon, August 2018

Solar thermal – at the heart of modern heating systems
COMMERCIAL BUILDINGS
Innovative solar thermal systems of Wolf with highly effective solarcollectors, a well-insulated hot water tank and an intelligent control system are at the very heart of a modern heating system. By harnessing the sun’s energy, and with no climate-harming emissions, they can cover as much as 60% of the annual energy requirements for hot water.
1 Wolfsolarthermalcollectors
2 Wolfstratificationcylinderandcondensingboilertechnology
2
1
1
2

Responsibility Statement by the Management |24
Fir
st-
Half
Rep
ort
20
18
| C
EN
TR
OT
EC
Res
pons
ibili
ty S
tate
men
t by
the
Man
agem
ent
Responsibility Statement by the Management
In accordance with the German Securities Trading Act (WpHG) in conjunction with German
Commercial Code (HGB), the Management Board declares:
“To the best of our knowledge, and in accordance with the applicable reporting principles for
interim financial reporting, the interim consolidated financial statements give a true and fair
view of the assets, liabilities, financial position and profit or loss of the group, and the interim
management report of the group includes a fair review of the development and performance of
the business and the position of the group, together with a description of the principal
opportunities and risks associated with the expected development of the group for the
remaining months of the financial year.”
The Management Board
Brilon, August 10, 2018

Fir
st-
Half
Rep
ort
20
18
| C
EN
TR
OT
EC
Fin
anci
al C
alen
dar
|Financial Calendar 25
Financial Calendar 2018
August 10 Publication of Q2 2018 Quarterly Report
November 14 Publication of Q3 2018 Quarterly Report
November 26 – 28 German Equity Forum, Frankfurt am Main

CENTROTEC Sustainable AG Am Patbergschen Dorn 9 D-59929 Brilon Phone +49 (0) 2961-96 631 - 111 Fax +49 (0) 2961-96 631- 100 [email protected] www.centrotec.de