
2018 Buckeye Capital Investors Stock Pitch Competition
20
2018 Buckeye Capital Investors Stock Pitch Competition Fall 2017 Notre Dame Investment Club presents: NYSE: YEXT Recommendation: Buy Analysts: James Campion, Julia Reyes, Alina Song
Transcript of 2018 Buckeye Capital Investors Stock Pitch Competition

2018 Buckeye Capital Investors Stock Pitch Competition Fall 2017
Notre Dame Investment Club presents:
NYSE: YEXT
Recommendation: BuyAnalysts:
James Campion, Julia Reyes, Alina Song

Investment Thesis
2
❖ SaaS category leader in a growing industry that is pulling away from competitors in size, network of partner services, and profile of enterprise clients
❖ Strong management team full of seasoned professionals from top enterprise software companies
❖ Expansive pipeline of existing and potential customers signing recurring revenue contracts
❖ Attractive valuation relative to comps creates attraction entry point for a growing technology company capable of continued +30% top line growth
Yext offers an attractive investment opportunity driven by:
Target Price: $22.73Implied Upside: 88.0%

Company Overview
3Sources: Bloomberg, J.P. Morgan, 10-K, Earnings Call
• Offers advertising, monetization, phone, and directory services including business listings on search sites and real-time reputation management
• Yext Knowledge Engine allows companies to sync their digital data to more than 100 services like Apple, Google, Facebook, Bing, Yahoo!, and more
• Offer 4 subscription packages with varying contract lengths; over 100 million licenses
Reign in larger enterprises
through growing sales
team
Proliferate image as “single source of truth” for businesses
Shift customers towards longer
term billing cycles
Improve the already high
retention rate by upselling
existing customers
Third-Party Internet Traffic
Enterprise Marketing Spending
Network Effect
Developments in AI and UI
International Expansion
Howard Lerman – Co-Founder and CEO
Jim Steele – C0-President and CRO
➢ Founded Yext, Confide, & Intwine➢ Stock Ownership: ~$81.1 mm
Brian Distelbrger – Co-Founder and Co-President
➢ Former board member of Food Genius Inc.➢ Stock Ownership: ~$57.6 mm
➢ Former Co-President, CRO, and CCO at Salesforce➢ Joined Yext in 2017
Yext, Inc. Overview Services
Corporate GovernanceGrowth Strategy Drivers
Steve Cakebread– CFO➢ Former CFO at Salesforce and Pandora Media➢ Joined Yext in 2014
• Founded in 2006; Headquartered in New York, NY
• IPO’d in 2017 and raised $115.5 mm; current market cap of $1.14 bn
• Yext provides a simple way for a business to manage and control all of the public facing facts about itself
• The company uses a software-based solution in the cloud
• Yext takes a customer’s company data regarding location, and manages that data to ensure the content that retail consumers see is accurate
• Business concentrated mainly in North America with growth in Asian and European markets
• Named #1 Best Workplace in New York by Fortune

FY 16 FY 17 FY 18 (9 months)
Customer Experience
Sources: J.P. Morgan, Yext Needham Growth Conference
Existing Customers New Enterprise Signings
Success Stories
Drive Revenue from Online Orders
+153
+207
+155
14.45 ROI from online orders
(October 2017)
15% of organic orders come from
Yext-powered local pages
Engage Customers in the Last Mile
Improve Brand Visibility & Web Traffic
63% increase in Get Directions
requests & clicks to call from
129% increase in clicks to call
174% increase in search
impressions for locations.dennys.
com
44% increase in traffic to doctor
pages on Steward.com
4

Location Data Industry Overview
5Sources: J.P. Morgan, IBISWorld
Quick Technology Adoption
Adapting Services to
Build Different Needs
Products Have Low Total Cost of Ownership
Access to a Highly skilled
workforce
Providing Related
Products and Services
Output is Sold Under Contract
Total Addressable Market is approximately $10 billion annually
Industry Outlook
Industry Trends
• Expected to benefit from the sale of software to the market and value-added consulting services.
Competition
Competitive Landscape
Key Success FactorsTotal Addressable Market
-30%
-20%
-10%
0%
10%
20%
30%
40%
50%
60%
70%
80%
0 200 400 600 800
Hea
dco
un
t G
row
th
Size of Company (Est. Headcount)
• Yext competes in a very fragmented market with many competitors, especially in the low end of the market
Threat of Substitutes
• Three options are manual updates, hiring an SEO, or data aggregators
• All are less attractive in an increasingly digital world
100 MN potential business listings
$100/location/yearX =
$10 BnAnnually
The potential business listings will grow over time due to international adoption of technology in emerging markets
Reasons for Undervaluation
6Sources: CapIQ
0
2mm
4mm
6mm
8mm
10mm
12mm
$10
$11
$12
$13
$14
$15
$16
Yext, Inc. (NYSE:YEXT) - Volume Yext, Inc. (NYSE:YEXT) - Share Pricing
- Insider Buy - Insider Sell - Quarterly Earnings Announcement
Market Preference for Profitability Lack of Visibility
Stock Driven by Insider Trades and IPO Lockup
YEXT Headquarters
Comparable Company Headquarters
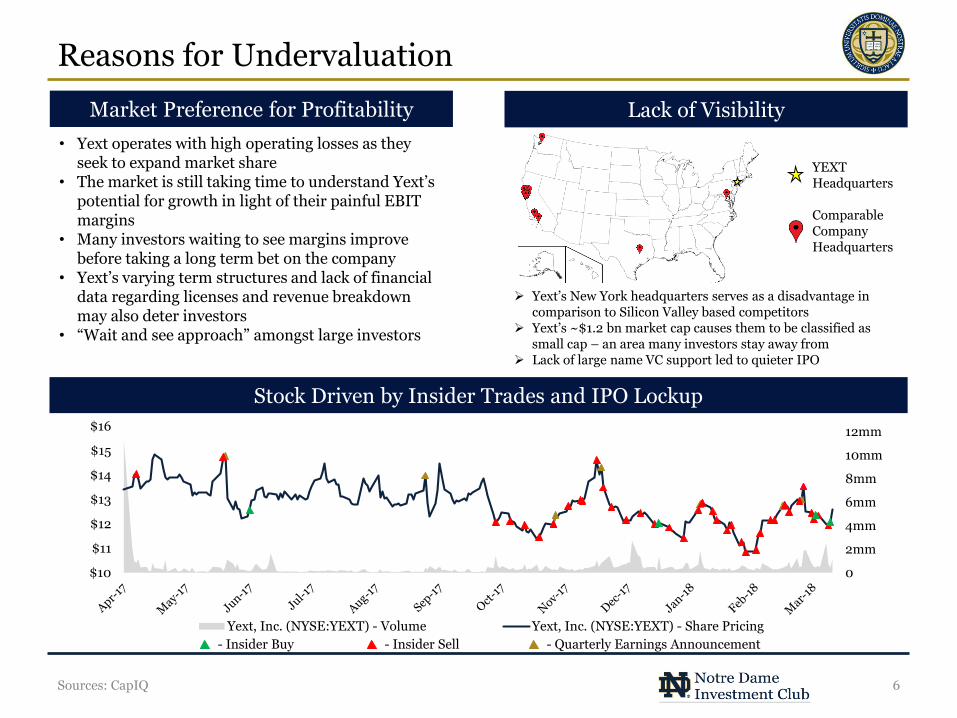
➢ Yext’s New York headquarters serves as a disadvantage in comparison to Silicon Valley based competitors
➢ Yext’s ~$1.2 bn market cap causes them to be classified as small cap – an area many investors stay away from
➢ Lack of large name VC support led to quieter IPO
• Yext operates with high operating losses as they seek to expand market share
• The market is still taking time to understand Yext’spotential for growth in light of their painful EBIT margins
• Many investors waiting to see margins improve before taking a long term bet on the company
• Yext’s varying term structures and lack of financial data regarding licenses and revenue breakdown may also deter investors
• “Wait and see approach” amongst large investors
Business Risks
7Sources: J.P. Morgan, 10-K
High Operating Losses Exposure to Retail Sector
Technological Threat
Reliance on Current Partners
$mm
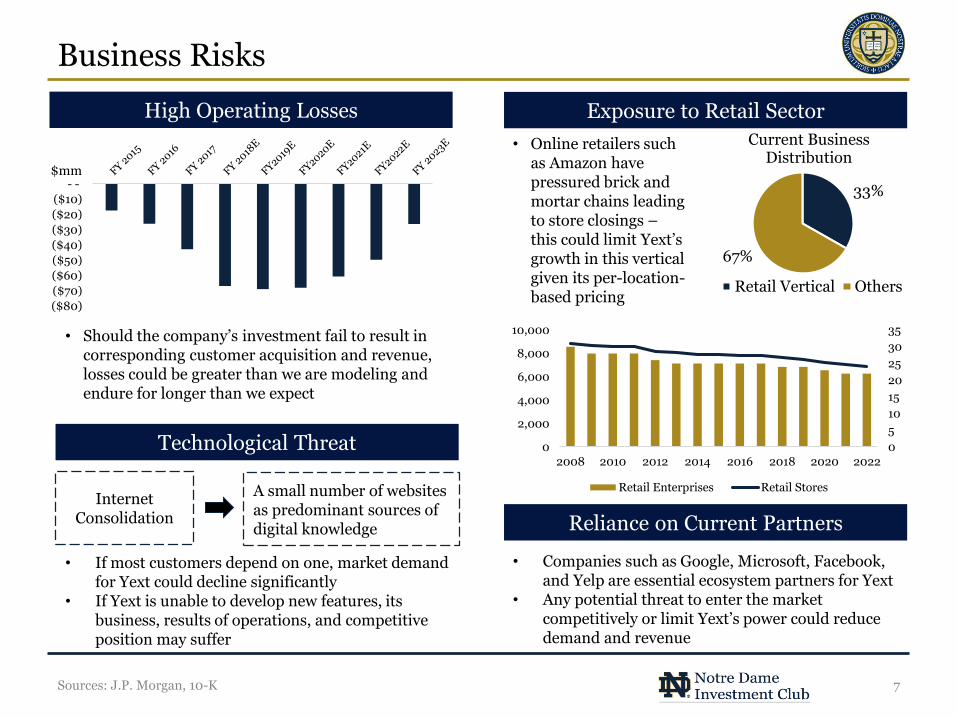
• Online retailers such as Amazon have pressured brick and mortar chains leading to store closings –this could limit Yext’sgrowth in this vertical given its per-location-based pricing
33%
67%
Current Business Distribution
Retail Vertical Others
• Should the company’s investment fail to result in corresponding customer acquisition and revenue, losses could be greater than we are modeling and endure for longer than we expect
• Companies such as Google, Microsoft, Facebook, and Yelp are essential ecosystem partners for Yext
• Any potential threat to enter the market competitively or limit Yext’s power could reduce demand and revenue
• If most customers depend on one, market demand for Yext could decline significantly
• If Yext is unable to develop new features, its business, results of operations, and competitive position may suffer
Internet Consolidation
A small number of websites as predominant sources of digital knowledge
($80)
($70)
($60)
($50)
($40)
($30)
($20)
($10)
- -
0
5
10
15
20
25
30
35
0
2,000
4,000
6,000
8,000
10,000
2008 2010 2012 2014 2016 2018 2020 2022
Retail Enterprises Retail Stores

Comparable Companies Analysis
8Sources: CapIQ
LTM NTM 1 Year Gross Margins Margins
Revenue Revenue Rev. Growth R&D SG&A EBIT LTM NTM
AYX Alteryx, Inc. $37.76 $2,274.02 $2,100.25 $131.61 $178.65 35.75% 83.43 22.30% 74.14% -13.00 16.0x 11.8x
OKTA Okta, Inc. 39.51 4,135.00 3,905.28 259.99 347.10 33.51% 68.94 26.83% 86.46% -44.34 15.0x 11.3x
WDAY Workday, Inc. 133.43 28,287.16 26,510.66 2,143.05 2,688.49 25.45% 70.63 42.49% 42.29% -14.15 12.4x 9.9x
MULE MuleSoft, Inc. 44.24 5,817.60 5,613.43 296.46 411.24 38.72% 72.59 21.79% 77.72% -26.92 18.9x 13.7x
CLDR Cloudera, Inc. 20.07 2,834.55 2,445.04 336.82 437.96 30.03% 56.24 59.96% 110.32% -114.03 7.3x 5.6x
APPN Appian Corporation 26.77 1,626.05 1,552.29 176.74 199.88 13.10% 63.45 19.71% 61.74% -18.00 8.8x 7.8x
CRM salesforce.com, inc. 121.70 89,023.55 86,734.86 10,480.01 12,676.25 20.96% 73.54 14.82% 56.47% 2.25 8.3x 6.8x
ZEN Zendesk, Inc. 48.89 5,054.32 4,807.37 430.49 562.65 30.70% 70.40 26.78% 70.25% -26.63 11.2x 8.5x
COUP Coupa Software Incorporated 47.26 2,601.50 2,351.60 186.78 229.78 23.02% 67.93 23.84% 68.16% -24.07 12.6x 10.2x
TEAM Atlassian Corporation Plc 58.32 13,544.23 12,865.13 740.68 972.27 31.27% 79.35 49.84% 42.05% -12.54 17.4x 13.2x
TWLO Twilio Inc. 41.30 3,891.75 3,600.88 399.02 511.78 28.26% 54.16 30.26% 40.09% -16.19 9.0x 7.0x
DATA Tableau Software, Inc. 84.10 6,857.20 6,002.53 877.06 966.26 10.17% 87.05 38.10% 70.73% -21.77 6.8x 6.2x
NOW ServiceNow, Inc. 173.19 30,256.29 29,650.43 1,933.03 2,553.87 32.12% 74.15 19.53% 59.74% -5.12 15.3x 11.6x
SHOP Shopify Inc. 149.40 15,668.11 14,724.83 673.30 998.85 48.35% 56.48 19.72% 43.19% -7.30 21.9x 14.7x
FSCT ForeScout Technologies, Inc. 30.87 1,184.41 1,020.84 220.87 267.74 21.22% 73.35 21.48% 91.59% -39.72 4.6x 3.8x
SAIL SailPoint Technologies Holdings, Inc. 21.26 1,853.98 1,806.26 186.06 222.28 19.47% 76.03 17.91% 52.78% 5.34 9.7x 8.1x
BL BlackLine, Inc. 40.02 2,129.03 2,016.89 177.03 222.80 25.86% 76.57 13.49% 82.53% -19.45 11.4x 9.1x
PANW Palo Alto Networks, Inc. 187.97 17,264.72 16,166.42 1,988.80 2,421.92 21.78% 71.70 18.31% 59.73% -6.35 8.1x 6.7x
75th Percentile 31.90% 75.56 29.40% 76.82% -8.61 15.3x 11.5x
Mean 27.21% 70.89 27.06% 66.11% -22.33 11.9x 9.2x
Median 27.06% 72.14 22.04% 64.95% -17.09 11.3x 8.8x
25th Percentile 21.36% 68.18 19.57% 53.70% -25.99 8.4x 6.9x
NYSE:YEXT Yext, Inc. $12.09 $1,138.56 $1,020.22 $170.20 $225.09 32.25% 74.09 15.09% 98.15% -39.15 5.99x 4.53x
Implied EV (mean) $2,029.73 $2,075.65
Implied EV (median) $1,919.87 $1,980.40
Implied EV (25th Percentile) $1,430.19 $1,551.03
EV/RevenueTicker Company Name
Latest
Close PriceMarket Cap
(USDmm)
Enterprise Value
(USDmm)
% of Revenue

Long Term Catalysts
9Sources: J.P. Morgan, 10-K
• Economies of Scale• Currently, SG&A comprises 98% of revenue• This number should decline to ~63% according
to internal projections and sell side research• Network Effect
• Relationships with over 100 online publishers makes Yext the leading reliable online source of truth for their clients
• Broader Sales Team• S&M currently makes up ~75% of revenue and
is projected to grow• Over the past year, Yext has aggressively grown
sales team by +25% with employees from enterprise software leaders such as Adobe and salesforce
• Achieved dollar-based net retention consistently above 120% dating back to 2015
• Sell to customers via 1 – 3 year contracts, highlighting customers willingness to lock in long term agreements
• Locations listed in Location Cloud has grown from 466k in 2015 to over 1MM in 2017
• Scale and network led to Winter ’18 release which includes:
• Sentiment Analysis• Competitive Intelligence• Platform support for ATMS and retail kiosks
• International business accounted for 6% of revenue in FY17
• Yext intentionally avoided international growth to dominate US market
• The international network will increase significantly over the coming years and drive revenue growth
• Yext plans to expand mainly into Europe, Japan, and China
• Recently added the ability for customers with locations in China to display information on WeChat in Mandarin
• 2/3 of Yext clients are in the retail, finance & insurance markets
• Recent closures of brick-and-mortar chains puts pressure on this segment of business
• Yext is trying to move into the Healthcare vertical to make up for potential loss of revenue in current markets
Continued Revenue Growth Selling to New Verticals
Value Proposition to Customers International Growth
Provide precise ER
drop-off points
Accurate insurance
information
“Pages” services for physicians

Final Recommendation
10
The Notre Dame Investment Club recommends a buy for Yext, with the expectation for the company to scale as the leader of a growing industry
while continuing to grow top line by +30% while improving EBIT margins
Upside Weight
Revenue Multiple $23.92 98% 50%
Comps $21.54 78% 50%
Blended Implied Share Price $22.73 88.0% 100%
Implied Share Price

Appendix

Revenue Build & Exit Multiple
12
2015 2016 2017 2018 2019 2020 2021 2022 2023
Total Revenue $60 $90 $124 $170 $225 $297 $389 $506 $658
% Change YoY 49.5% 38.6% 36.9% 32.2% 32.0% 31.0% 30.0% 30.0%
North America $88 $119 $156 $204 $264 $338 $430 $539
% of Total Revenue 98.1% 95.5% 91.6% 90.5% 89.0% 87.0% 85.0% 82.0%
International $2 $6 $14 $21 $33 $51 $76 $118
% of Total Revenue 1.9% 4.4% 8.4% 9.5% 11.0% 13.0% 15.0% 18.0%
Enterprise $107 $153 $200 $261 $338 $435 $559
% of Total Revenue 86.0% 90.0% 89.0% 88.0% 87.0% 86.0% 85.0%
Small/Midsize Business $17 $17 $25 $36 $51 $71 $99
% of Total Revenue 14.0% 10.0% 11.0% 12.0% 13.0% 14.0% 15.0%
North America Enterprise $102.1 $140.4 $181.2 $232.6 $294.5 $369.7 $458.3
% of Total Revenue 82.2% 82.5% 80.5% 78.3% 75.7% 73.1% 69.7%
% Growth 37.4% 29.1% 28.4% 26.6% 25.6% 24.0%
International Enterprise $4.7 $11.4 $17.6 $27.3 $42.6 $63.8 $99.2
% of Total Revenue 3.8% 7.5% 8.5% 9.7% 11.3% 12.9% 15.3%
% Growth 141.0% 54.4% 55.2% 55.8% 49.9% 55.4%
North America Small/Midsize Business $16.6 $17.0 $23.8 $33.1 $45.4 $61.6 $82.3
% of Total Revenue 13.4% 9.2% 10.0% 10.7% 11.3% 11.9% 12.3%
% Growth 2.2% 40.0% 39.2% 37.1% 35.6% 33.6%
International Small/Midsize Business $0.8 $1.4 $2.4 $3.9 $6.6 $10.6 $17.8
% of Total Revenue 0.6% 0.8% 1.0% 1.3% 1.7% 2.1% 2.7%
% Growth 84.6% 65.2% 66.7% 67.7% 61.5% 67.1%
Total Revenue $124 $170 $225 $297 $389 $506 $658
% Growth 37.0% 32.2% 32.0% 31.0% 30.0% 30.0%
Revenue Multiple Method
Terminal Year Revenue $658
Exit Multiple 6.9x
Terminal Value $4,531
Discount Factor 0.50
Enterprise Value $2,253
Net Debt - -
Equity Value $2,253
Shares Outstanding 94
Implied Share Price $23.92
WACC
14.0% 14.5% 15.0% 15.5% 16.0%
4.9x $17.77 $17.38 $17.01 $16.64 $16.29
5.9x $21.39 $20.93 $20.48 $20.04 $19.61
6.9x $25.02 $24.48 $23.95 $23.44 $22.94
7.9x $28.65 $28.03 $27.42 $26.83 $26.26
8.9x $32.27 $31.58 $30.89 $30.23 $29.59
Exit
Multi
ple

Income Statement
13
In Millions of Dollars except Per Share 2015 2016 2017 2018 2019 2020 2021 2022 2023
Revenue $60 $90 $124 $170 $225 $297 $389 $506 $658
% Change YoY 49.5% 38.6% 36.9% 32.2% 32.0% 31.0% 30.0% 30.0%
Cost of Goods Sold 25 31 37 44 57 74 95 124 158
Gross Margin $35 $59 $87 $126 $168 $223 $294 $382 $500
% Gross Margin 58.7% 65.4% 70.2% 74.1% 74.5% 75.0% 75.5% 75.5% 76.0%
R&D $12 $16 $19 $26 $38 $56 $82 $116 $164
% Revenue 19.9% 18.1% 15.5% 15.1% 17.0% 19.0% 21.0% 23.0% 25.0%
% Change YoY 35.6% 19.2% 33.0% 48.9% 47.5% 44.8% 42.4% 41.3%
Sales and Marketing 32 50 82 127 $146 $169 $195 $224 $257
% Revenue 52.7% 55.5% 65.6% 74.6% 65.0% 57.0% 50.0% 44.3% 39.2%
% Change YoY 57.6% 63.7% 55.8% 15.2% 15.8% 15.0% 15.0% 15.0%
G&A 9 19 29 40 52 65 78 91 104
% Revenue 15.0% 21.0% 23.5% 23.5% 23.1% 21.9% 20.0% 18.0% 15.8%
% Change YoY 109.8% 55.1% 37.2% 29.8% 25.0% 20.0% 17.0% 14.0%
Total Operating Expenses $53 $85 $130 $193 $237 $291 $354 $431 $526
EBIT ($17) ($26) ($43) ($67) ($69) ($68) ($61) ($50) ($26)
% Operating Margin (28.9%) (29.1%) (34.4%) (39.2%) (30.6%) (22.9%) (15.6%) (9.8%) (4.0%)
Taxes - (0.1) 0.1 0.2 0 0 0 0 0
% Tax Rate 0.4% (0.2%) (0.2%) - - - - - - - - - -
EBIAT ($17) ($26) ($43) ($67) ($69) ($68) ($61) ($50) ($26)
% Profit Margin (28.9%) (29.0%) (34.4%) (39.3%) (30.6%) (22.9%) (15.6%) (9.8%) (4.0%)
Net Working Capital
14
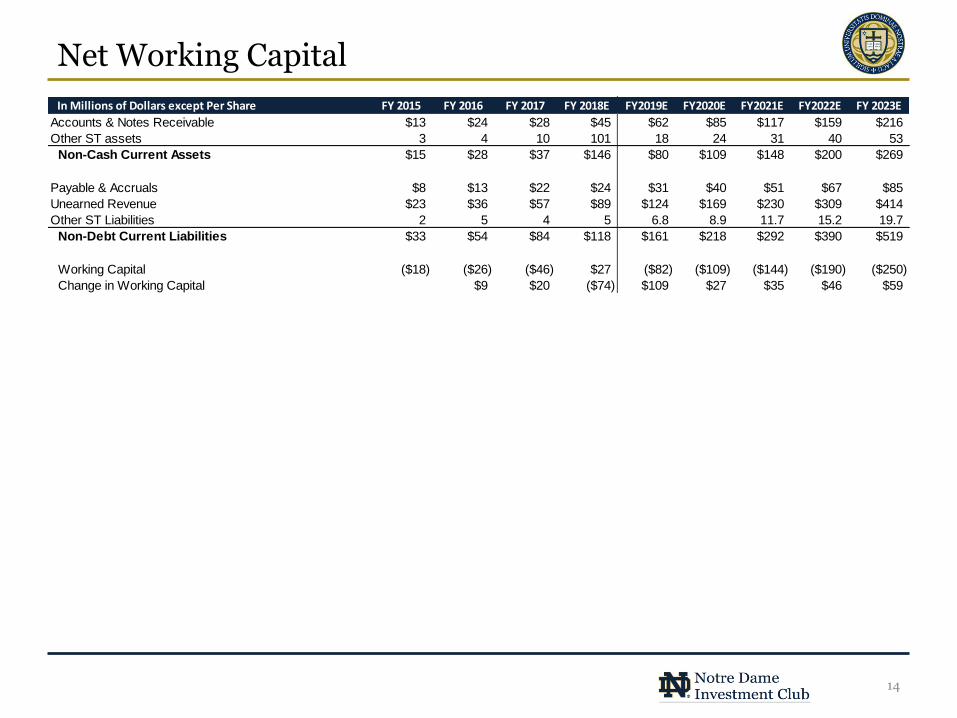
In Millions of Dollars except Per Share FY 2015 FY 2016 FY 2017 FY 2018E FY2019E FY2020E FY2021E FY2022E FY 2023E
Accounts & Notes Receivable $13 $24 $28 $45 $62 $85 $117 $159 $216
Other ST assets 3 4 10 101 18 24 31 40 53
Non-Cash Current Assets $15 $28 $37 $146 $80 $109 $148 $200 $269
Payable & Accruals $8 $13 $22 $24 $31 $40 $51 $67 $85
Unearned Revenue $23 $36 $57 $89 $124 $169 $230 $309 $414
Other ST Liabilities 2 5 4 5 6.8 8.9 11.7 15.2 19.7
Non-Debt Current Liabilities $33 $54 $84 $118 $161 $218 $292 $390 $519
Working Capital ($18) ($26) ($46) $27 ($82) ($109) ($144) ($190) ($250)
Change in Working Capital $9 $20 ($74) $109 $27 $35 $46 $59

PPEIn Millions of Dollars except Per Share FY 2015 FY 2016 FY 2017 FY 2018E FY2019E FY2020E FY2021E FY2022E FY 2023E
Beginning Balance $12 $12 $10 $12 $14 $18 $22
Plus: Capex 2 10 4 4 9 12 16 20 26
Less: D&A (1) (3) (4) (5) (7) (9) (12) (16) (21)
Ending Balance $12 $12 $10 $12 $14 $18 $22 $27
Metrics & Drivers
Revenue $60 $90 $124 $170 $225 $297 $389 $506 $658
Capex as a % of Revenue 3% 11% 3% 2% 4% 4% 4% 4% 4%
Depreciation as a % of Rev 2% 3% 3% 3% 3% 3% 3% 3% 3%
15
Discounted Cash Flow
16
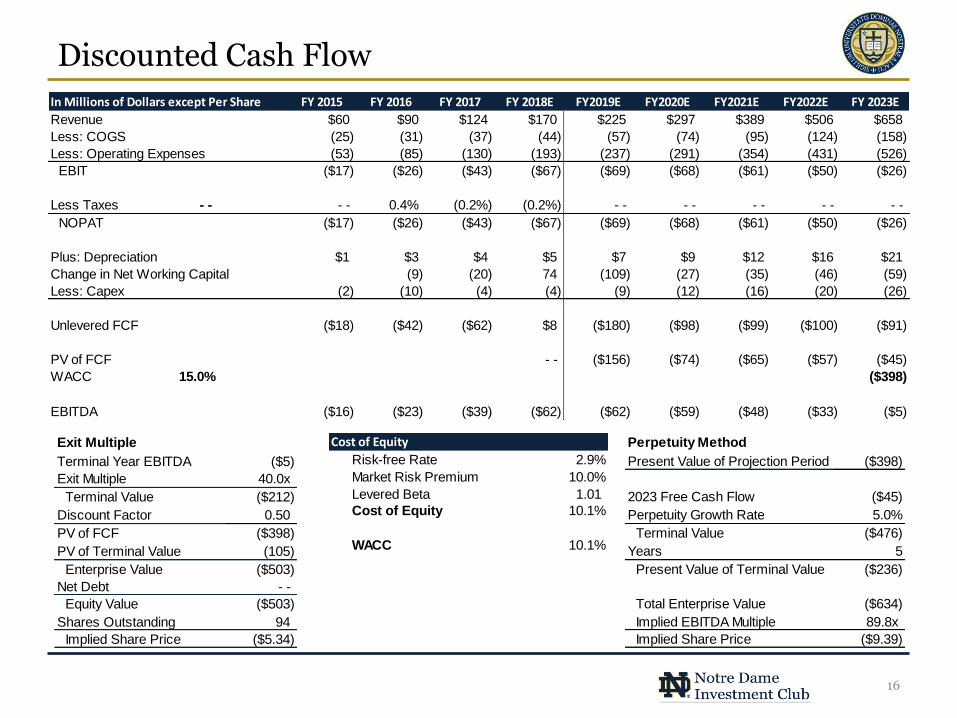
In Millions of Dollars except Per Share FY 2015 FY 2016 FY 2017 FY 2018E FY2019E FY2020E FY2021E FY2022E FY 2023E
Revenue $60 $90 $124 $170 $225 $297 $389 $506 $658
Less: COGS (25) (31) (37) (44) (57) (74) (95) (124) (158)
Less: Operating Expenses (53) (85) (130) (193) (237) (291) (354) (431) (526)
EBIT ($17) ($26) ($43) ($67) ($69) ($68) ($61) ($50) ($26)
Less Taxes - - - - 0.4% (0.2%) (0.2%) - - - - - - - - - -
NOPAT ($17) ($26) ($43) ($67) ($69) ($68) ($61) ($50) ($26)
Plus: Depreciation $1 $3 $4 $5 $7 $9 $12 $16 $21
Change in Net Working Capital (9) (20) 74 (109) (27) (35) (46) (59)
Less: Capex (2) (10) (4) (4) (9) (12) (16) (20) (26)
Unlevered FCF ($18) ($42) ($62) $8 ($180) ($98) ($99) ($100) ($91)
PV of FCF - - ($156) ($74) ($65) ($57) ($45)
WACC 15.0% ($398)
EBITDA ($16) ($23) ($39) ($62) ($62) ($59) ($48) ($33) ($5)
Exit Multiple
Terminal Year EBITDA ($5)
Exit Multiple 40.0x
Terminal Value ($212)
Discount Factor 0.50
PV of FCF ($398)
PV of Terminal Value (105)
Enterprise Value ($503)
Net Debt - -
Equity Value ($503)
Shares Outstanding 94
Implied Share Price ($5.34)
Perpetuity Method
Present Value of Projection Period ($398)
2023 Free Cash Flow ($45)
Perpetuity Growth Rate 5.0%
Terminal Value ($476)
Years 5
Present Value of Terminal Value ($236)
Total Enterprise Value ($634)
Implied EBITDA Multiple 89.8x
Implied Share Price ($9.39)
Cost of Equity
Risk-free Rate 2.9%
Market Risk Premium 10.0%
Levered Beta 1.01
Cost of Equity 10.1%
WACC 10.1%

Yext Multiple Analysis
17
0.0x
1.0x
2.0x
3.0x
4.0x
5.0x
6.0x
7.0x
2019 2020 2021 2022 2023
Imp
lied
Rev
enu
e M
ult
iple
Fiscal Year
Enterprise Value To Projected FY Revenue Multiple
Implied Multiple Assuming No EV Growth: Mult. Assuming 30% Annual EV Growth
Proj. Rev.: $225 $297 $389 $506 $658
Proj. YoY Rev. Growth: 32.2% 32.0% 31.0% 30.0% 30.0%
Even if the EV/Forward Revenue Multiple for Yext does not improve going forward and merely remains the same, the share price of the company will appreciate by 30% a year, or in line with revenue.

Yext’s Competitive Advantage
18Sources: Yext Needham Conferece, J.P. Morgan
Customer Selection Process Pricing / Contract Structure
Competitor Size Comparison
Company Locations / Listings Products Customers / Brands Headcount (Est.) Growth
Yext 925,000 Listings, Reviews, Pages ~40,000 Customers 630 40%
Reputation.com N/A Listings, Reviews - - 289 12%
Hearsay Systems N/A Pages - - 249 13%
Vendasta N/A Listings, Reviews - - 230 18%
Moz 83,000 Listings, Reviews 37,000 Customers 223 (18%)
SweetIQ 541,286 Listings, Reviews, Microsites >200 Brands 117 72%
Brandify 4,500,000 Listings 500 Brands 72 14%
RIO SEO Automation Software N/A Listings, Pages - - 62 - -
Synup N/A Listings, Reviews 47,477 Customers 42 50%
Placeable 1,537,108 Listings, Pages - - 36 (8%)
BrightLocal N/A Listings, Reviews >2,000 Customers 31 11%
• Yext’s offerings are often more affordable, efficient, and easier to implement than substitutes
• Yext provides audits on tentative clients data across third party platforms to highlight what is missing or inaccurate
• When speaking with customers of Yext, J.P. Morgan found that customers appreciated Yext’sconsistency and quality in providing real-time data updates
• Also found that many customers stumbled upon Yext through sources such as LinkedIn or Yellow Pages, which highlights the current lack of marketing exposure
Location Based
Varying Term Structures and Packages
Greater Than 100% Retention Rate Due to Upselling
Base
List Price: $150
Starter
List Price: $350
Professional
List Price: $500
Ultimate
List Price: $900

Advertising Growth
19Sources: IBISWorld
Digital Advertising Spend in the U.S.
Global Advertising Expenditure
0%
5%
10%
15%
20%
25%
20
40
60
80
100
120
140
2016 2017 2018 2019 2020 2021
0%
1%
2%
3%
4%
5%
6%
7%
8%
0
100
200
300
400
500
600
700
2011 2012 2013 2014 2015 2016 2017 2018 2019 2020
North America Asia Pacific Western Europe Latin America
Central and Eastern Europe Middle East & Africa % Change YoY
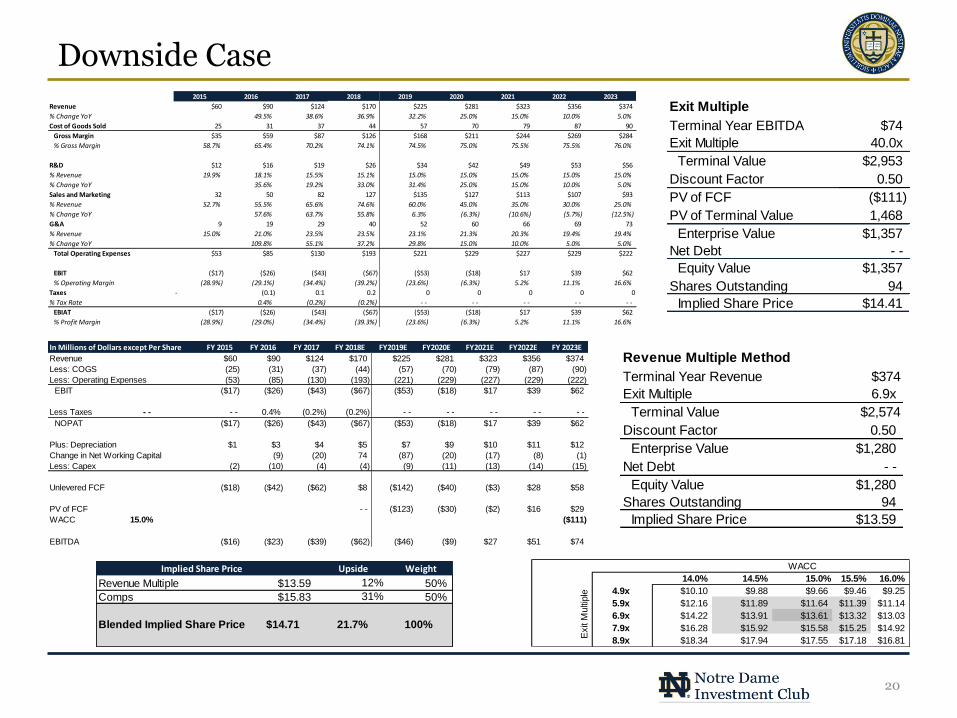
Downside Case2015 2016 2017 2018 2019 2020 2021 2022 2023
Revenue $60 $90 $124 $170 $225 $281 $323 $356 $374
% Change YoY 49.5% 38.6% 36.9% 32.2% 25.0% 15.0% 10.0% 5.0%
Cost of Goods Sold 25 31 37 44 57 70 79 87 90
Gross Margin $35 $59 $87 $126 $168 $211 $244 $269 $284
% Gross Margin 58.7% 65.4% 70.2% 74.1% 74.5% 75.0% 75.5% 75.5% 76.0%
R&D $12 $16 $19 $26 $34 $42 $49 $53 $56
% Revenue 19.9% 18.1% 15.5% 15.1% 15.0% 15.0% 15.0% 15.0% 15.0%
% Change YoY 35.6% 19.2% 33.0% 31.4% 25.0% 15.0% 10.0% 5.0%
Sales and Marketing 32 50 82 127 $135 $127 $113 $107 $93
% Revenue 52.7% 55.5% 65.6% 74.6% 60.0% 45.0% 35.0% 30.0% 25.0%
% Change YoY 57.6% 63.7% 55.8% 6.3% (6.3%) (10.6%) (5.7%) (12.5%)
G&A 9 19 29 40 52 60 66 69 73
% Revenue 15.0% 21.0% 23.5% 23.5% 23.1% 21.3% 20.3% 19.4% 19.4%
% Change YoY 109.8% 55.1% 37.2% 29.8% 15.0% 10.0% 5.0% 5.0%
Total Operating Expenses $53 $85 $130 $193 $221 $229 $227 $229 $222
EBIT ($17) ($26) ($43) ($67) ($53) ($18) $17 $39 $62
% Operating Margin (28.9%) (29.1%) (34.4%) (39.2%) (23.6%) (6.3%) 5.2% 11.1% 16.6%
Taxes - (0.1) 0.1 0.2 0 0 0 0 0
% Tax Rate 0.4% (0.2%) (0.2%) - - - - - - - - - -
EBIAT ($17) ($26) ($43) ($67) ($53) ($18) $17 $39 $62
% Profit Margin (28.9%) (29.0%) (34.4%) (39.3%) (23.6%) (6.3%) 5.2% 11.1% 16.6%
20
In Millions of Dollars except Per Share FY 2015 FY 2016 FY 2017 FY 2018E FY2019E FY2020E FY2021E FY2022E FY 2023E
Revenue $60 $90 $124 $170 $225 $281 $323 $356 $374
Less: COGS (25) (31) (37) (44) (57) (70) (79) (87) (90)
Less: Operating Expenses (53) (85) (130) (193) (221) (229) (227) (229) (222)
EBIT ($17) ($26) ($43) ($67) ($53) ($18) $17 $39 $62
Less Taxes - - - - 0.4% (0.2%) (0.2%) - - - - - - - - - -
NOPAT ($17) ($26) ($43) ($67) ($53) ($18) $17 $39 $62
Plus: Depreciation $1 $3 $4 $5 $7 $9 $10 $11 $12
Change in Net Working Capital (9) (20) 74 (87) (20) (17) (8) (1)
Less: Capex (2) (10) (4) (4) (9) (11) (13) (14) (15)
Unlevered FCF ($18) ($42) ($62) $8 ($142) ($40) ($3) $28 $58
PV of FCF - - ($123) ($30) ($2) $16 $29
WACC 15.0% ($111)
EBITDA ($16) ($23) ($39) ($62) ($46) ($9) $27 $51 $74
Exit Multiple
Terminal Year EBITDA $74
Exit Multiple 40.0x
Terminal Value $2,953
Discount Factor 0.50
PV of FCF ($111)
PV of Terminal Value 1,468
Enterprise Value $1,357
Net Debt - -
Equity Value $1,357
Shares Outstanding 94
Implied Share Price $14.41
WACC
14.0% 14.5% 15.0% 15.5% 16.0%
4.9x $10.10 $9.88 $9.66 $9.46 $9.25
5.9x $12.16 $11.89 $11.64 $11.39 $11.14
6.9x $14.22 $13.91 $13.61 $13.32 $13.03
7.9x $16.28 $15.92 $15.58 $15.25 $14.92
8.9x $18.34 $17.94 $17.55 $17.18 $16.81
Exit
Multi
ple
Revenue Multiple Method
Terminal Year Revenue $374
Exit Multiple 6.9x
Terminal Value $2,574
Discount Factor 0.50
Enterprise Value $1,280
Net Debt - -
Equity Value $1,280
Shares Outstanding 94
Implied Share Price $13.59
Implied Share Price Upside Weight
Revenue Multiple $13.59 12% 50%
Comps $15.83 31% 50%
Blended Implied Share Price $14.71 21.7% 100%