2017 T&E Expense Trends and Benchmark Spending | March 22, 2017
50
2017 T&E Expense Trends and Benchmark Spending March 22, 2017
-
Upload
ashley-emery -
Category
Business
-
view
58 -
download
1
Transcript of 2017 T&E Expense Trends and Benchmark Spending | March 22, 2017
2017 T&E Expense Trends and Benchmark Spending
March 22, 2017

Learning Objectives
• Factors contributing to high expense report processing costs
• Top expense management pressures, pain points and areas of opportunity
• Annual budget and benchmark spending by category for T&E expenses
• Finance professionals’ must-have expense reporting features for 2017
• How automation helps to eliminate inefficiency and control costs
Attending this event will help you understand:
Webinar notes
• Today’s event will be recorded and all attendees will be kept in listen-only mode to eliminate excessive background noise.
• Links to today’s presentation and the recording of this webinar will be sent out to all attendees within 24 hours of the event.
• Please ask questions on today’s topic via the “Questions” box in your GoToWebinar control panel at any time during the event. We will do our best to get to your questions during the Q&A/panel discussion at the end of the event. If we do not get to your question, we will follow up with you directly.
360 Thought Leadership Consulting helps companies define and unlock the strategic value of their thought leadership programs. Formerly, Ernie served as Vice President, Educational Programs for Proformative, as the Director of Treasury Services and as a Director of the Corporate Treasurers Council for the Association for Financial Professionals.
Ernie HumphreyChief Executive Officer
Featured Speaker
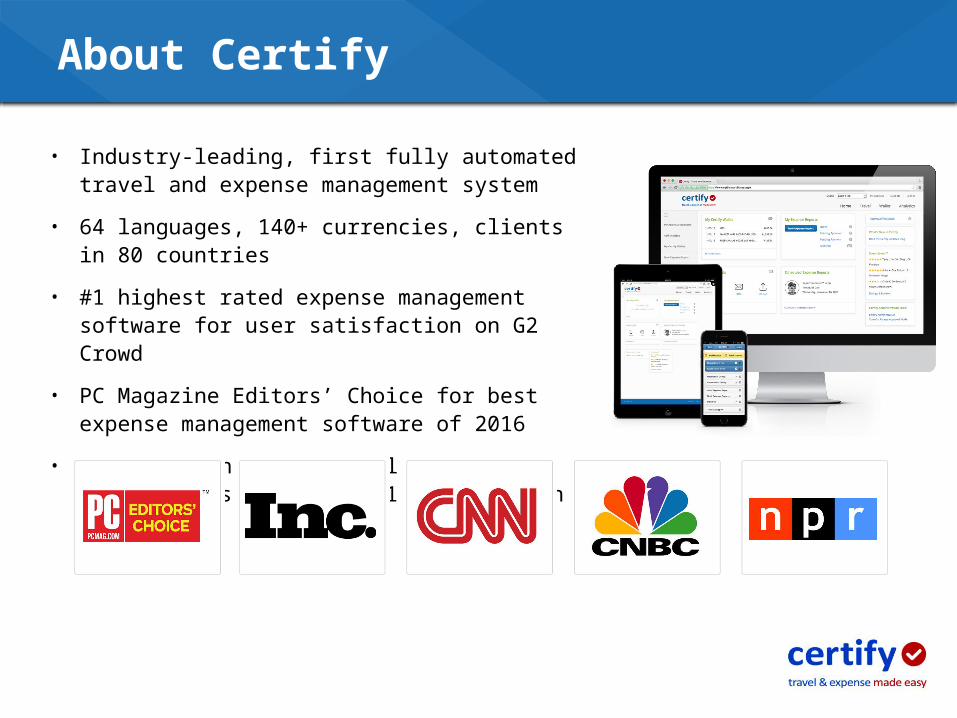
• Industry-leading, first fully automated travel and expense management system
• 64 languages, 140+ currencies, clients in 80 countries
• #1 highest rated expense management software for user satisfaction on G2 Crowd
• PC Magazine Editors’ Choice for best expense management software of 2016
• Processing nearly 40 million expenses and receipts valued at $10+ billion in 2016
About Certify
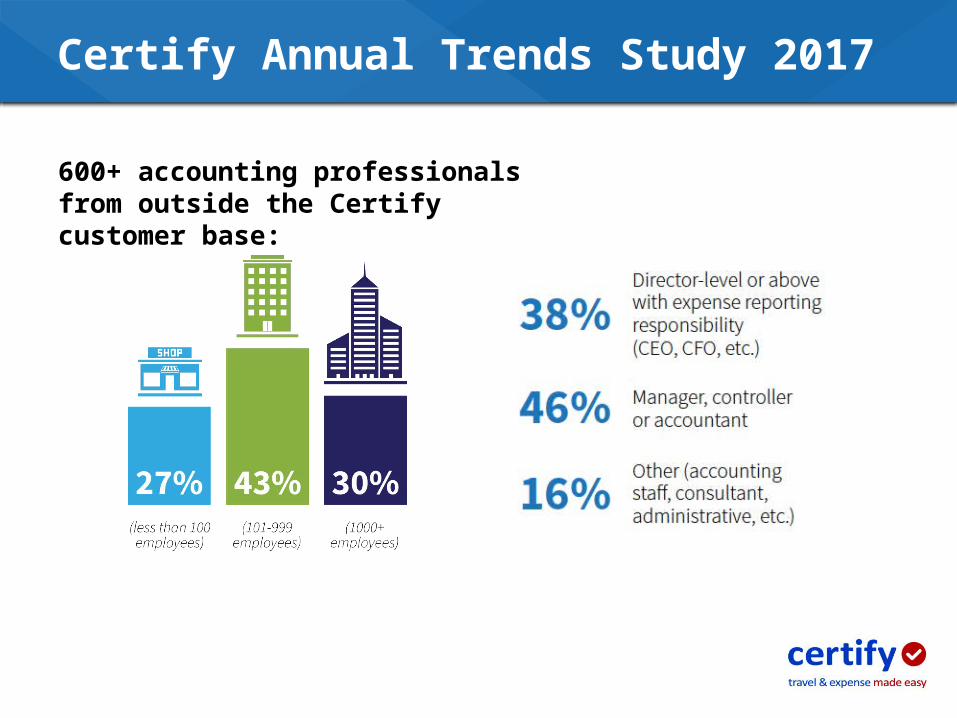
Certify Annual Trends Study 2017
600+ accounting professionals from outside the Certify customer base:
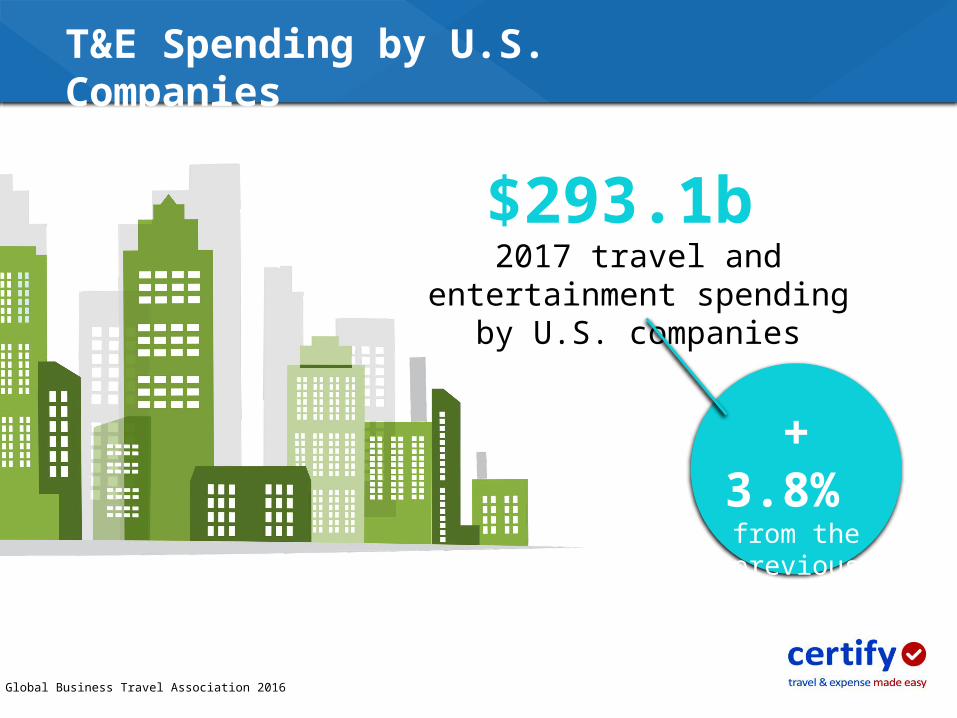
T&E Spending by U.S. Companies
1. Global Business Travel Association 2016
$293.1b 2017 travel and entertainment spending by U.S. companies
+ 3.8% from the
previous year

Business Investment in T&E
6-12%total annual budget
for T&E expenses(Aberdeen Group 2014)
PayStream Advisors 2016
Company Revenue Annual Spend
Under $100MM $700,000
$100MM to $500MM $1,500,000
$501MM to $2b $7,400,000
$2b and above $58,000,000

T&E spending ranks as the 2nd most difficult operating expense category to control Forrester Research 2014

Polling Question 1
a) Mealsb) Mileagec) Airfared) Not sure
As a percent of total spending, what was your company’s largest expense category in 2016?

Key Survey Results & Trends
1. Meals 19%
2. Airfare 15%
3. Lodging 14%
4. Misc. 13%
5. Gas 11%
6. Taxi 9%
7. Cell phone 5%
8. Car rental 5%
9. Supplies 5%
10. Shipping 2%
11. Tolls 1%
12. Parking 1%
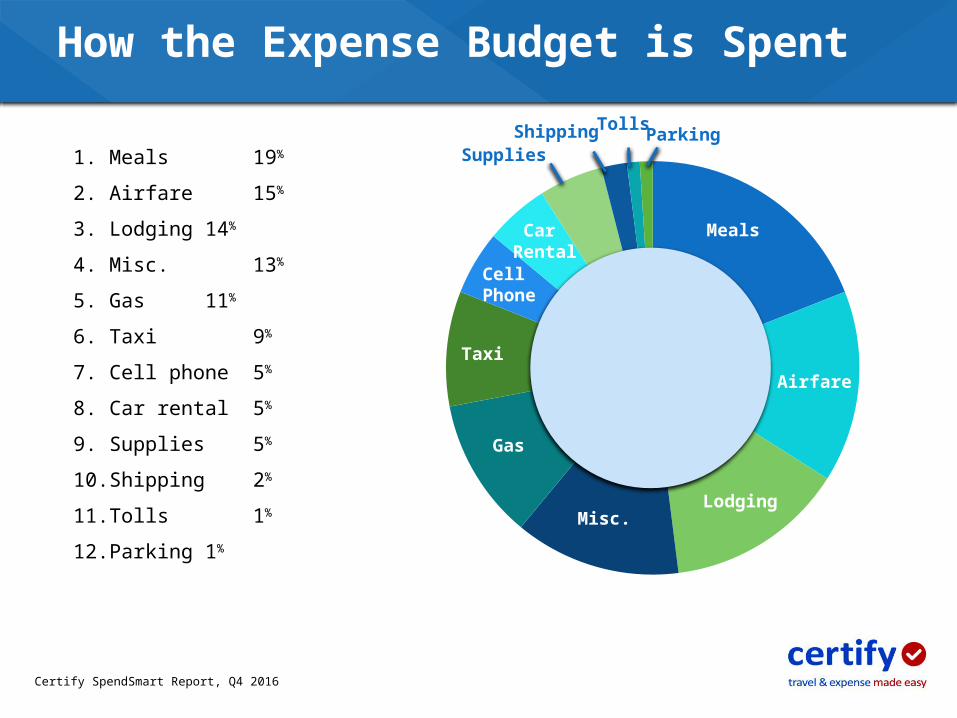
How the Expense Budget is Spent
Certify SpendSmart Report, Q4 2016
Meals
Airfare
LodgingMisc.
Gas
Taxi
Cell Phone
Car Rental
SuppliesShipping Tolls Parking

Meals
Airfare
LodgingMisc.
Gas
Taxi
Cell Phone
Car Rental
SuppliesShipping Tolls Parking
1. Meals 19%
2. Airfare 15%
3. Lodging 14%
4. Misc. 13%
5. Gas 11%
6. Taxi 9%
7. Cell phone 5%
8. Car rental 5%
9. Supplies 5%
10. Shipping 2%
11. Tolls 1%
12. Parking 1%
$98.74DAILYMEAL COST
2016
Certify SpendSmart Report, Q4 2016
2016 Business Travel News Corporate Travel Index
How the Expense Budget is Spent

Category 2016 2017 Difference
Gas $30.32 $29.77 –1.81%
Airfare $274.00 $316.17 +15.39%
Lodging $223.45 $210.19 –5.93%
Car Rental $186.45 $190.74 +2.30%
Cell Phone $92.24 $89.00 –3.51%
Meals $26.06 $27.02 +3.68%
Misc. $55.71 $68.20 +22.41%
Taxi $31.82 $27.90 –12.31%
Benchmark Spending by Category
Certify SpendSmart Report, Q4 2016-2017

www.gsa.gov, accessed 1/30/17
2017 U.S. GSA Per Diem Rates
GSA Lodging, Meals & Incidentals for San Francisco, CA
Lodging (per night) Breakfast Lunch Dinner
$267 $17 $18 $31Incidental -- $5 $5 $5

Certify Annual Travel & Expense Management Survey 2016
Budgeting & Category Spending Caps
We do not have expense category limits
26%
Based on internal historical spending
23%Follow U.S. GSA per rate
guidelines23%
Determined by annual budgeting process
21%
Other7%
Inefficiencies in T&E Expense Reporting
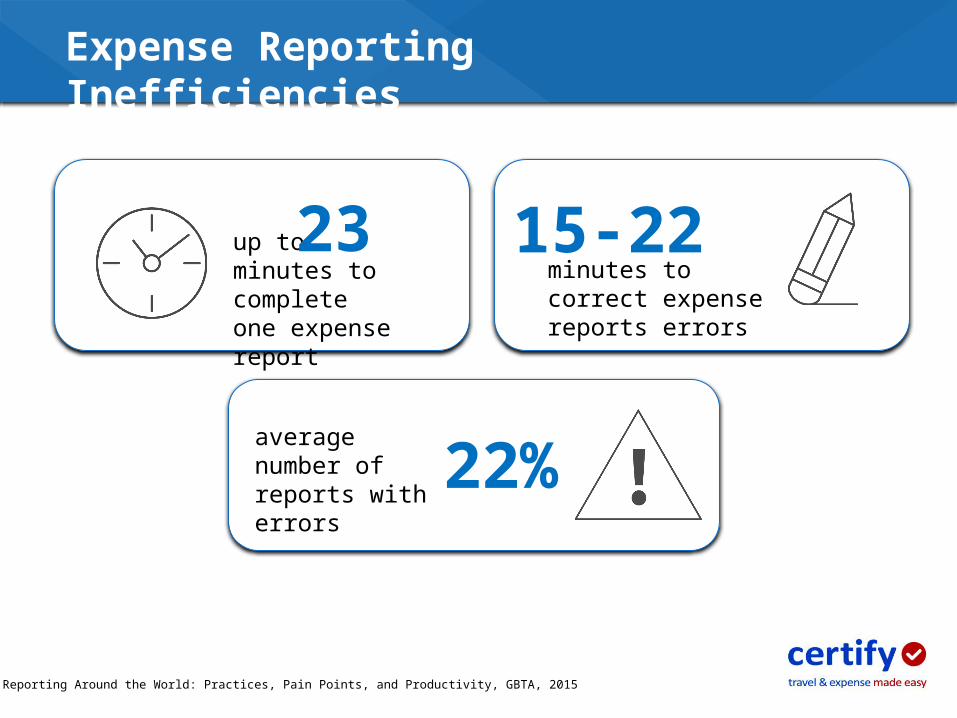
Expense Reporting Inefficiencies
Expense Reporting Around the World: Practices, Pain Points, and Productivity, GBTA, 2015
up tominutes to complete one expense report
minutes to correct expense reports errors
average number of reports with errors
23 15-22
22%
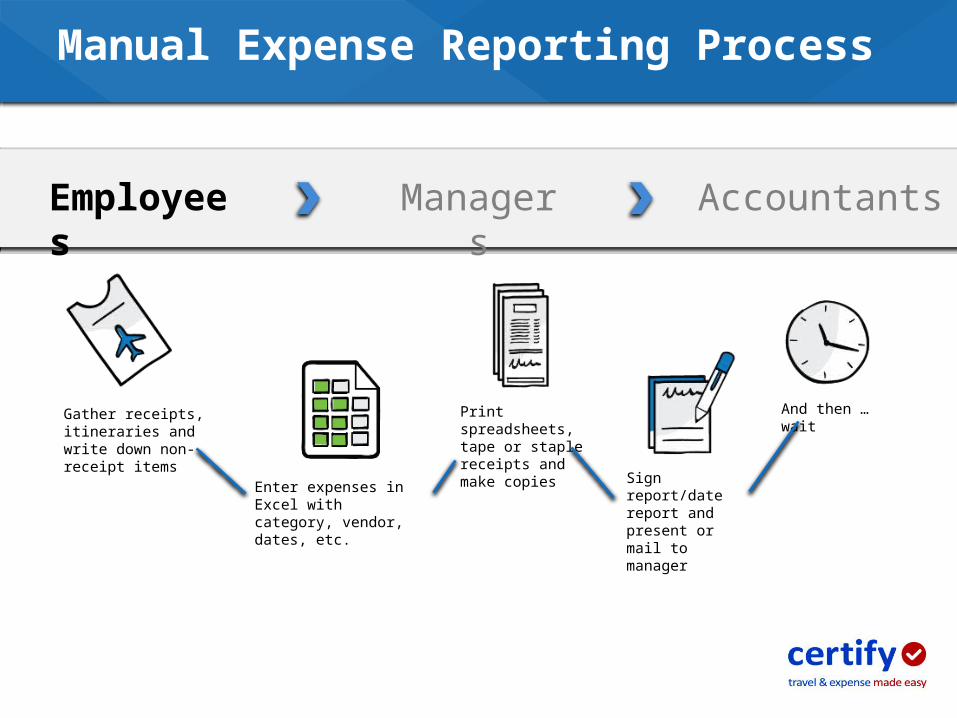
Print spreadsheets, tape or staple receipts and make copies
Enter expenses in Excel with category, vendor, dates, etc.
And then … waitGather receipts, itineraries and write down non-receipt items
Sign report/date report and present or mail to manager
Employees
Manual Expense Reporting Process
AccountantsManagers

Check expenses for receipts, review for out-of-policy items, etc.
Receive reports for all employees at different times during the month/quarter
If errors, return report to employee to start over; wait for resubmission Sign/approve reports
and route to the next manager or to AP
Employees AccountantsManagers
Manual Expense Reporting Process
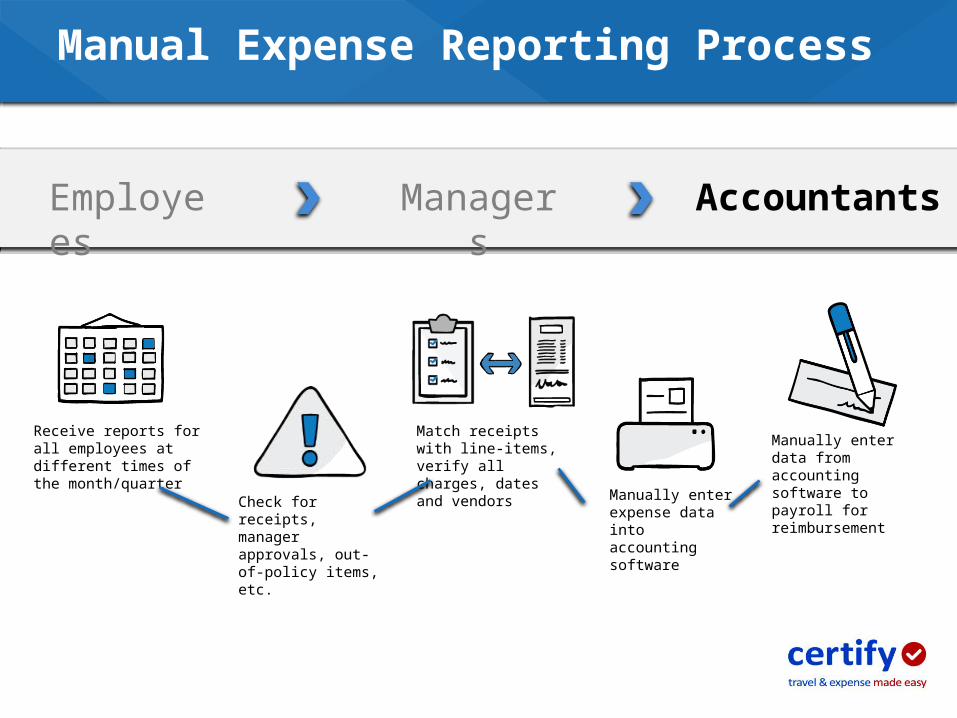
Manually enter data from accounting software to payroll for reimbursementManually enter
expense data into accounting software
Check for receipts, manager approvals, out-of-policy items, etc.
Receive reports for all employees at different times of the month/quarter
Match receipts with line-items, verify all charges, dates and vendors
Employees AccountantsManagers
Manual Expense Reporting Process
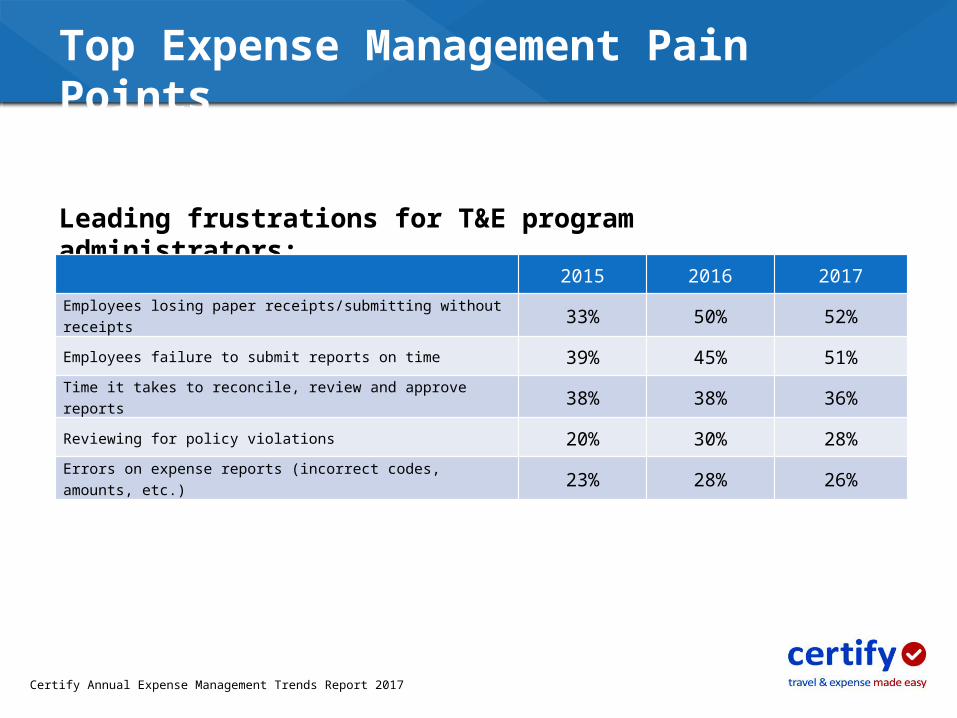
Leading frustrations for T&E program administrators:
Top Expense Management Pain Points
2015 2016 2017
Employees losing paper receipts/submitting without receipts 33% 50% 52%
Employees failure to submit reports on time 39% 45% 51%
Time it takes to reconcile, review and approve reports 38% 38% 36%
Reviewing for policy violations 20% 30% 28%
Errors on expense reports (incorrect codes, amounts, etc.) 23% 28% 26%
Certify Annual Expense Management Trends Report 2017
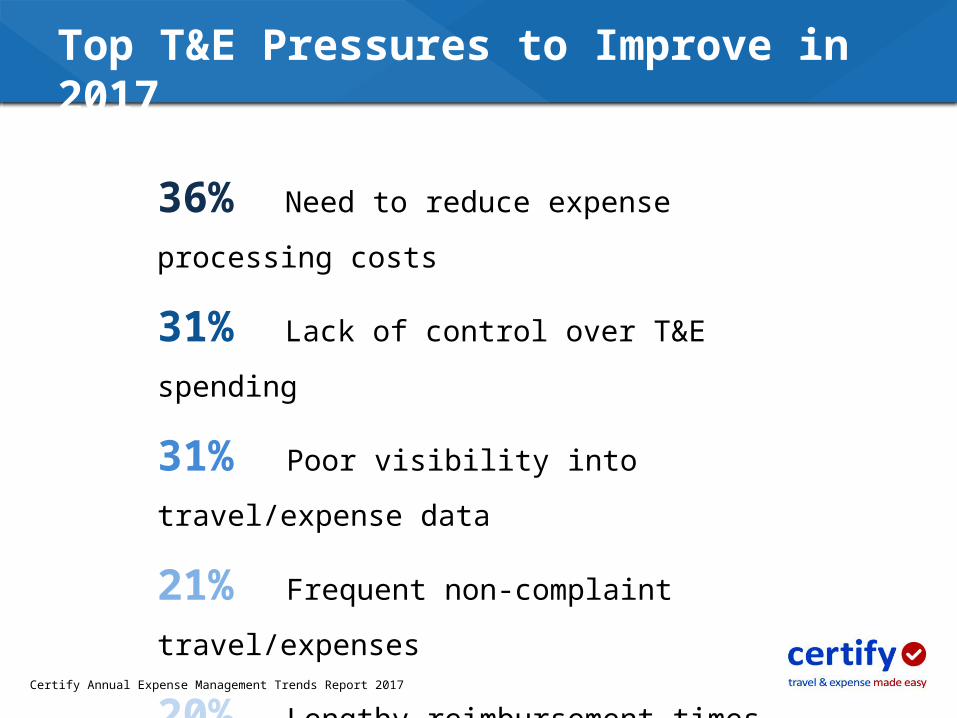
Top T&E Pressures to Improve in 2017
36% Need to reduce expense processing costs
31% Lack of control over T&E spending
31% Poor visibility into travel/expense data
21% Frequent non-complaint travel/expenses
20% Lengthy reimbursement times
Certify Annual Expense Management Trends Report 2017
Polling Question 2
a) Reducing process and workflow inefficiencies b) Tighter controls for employee T&E spendingc) Lowering expense report processing costsd) Increasing travel policy compliance
What is your organization’s top area for T&E improvement in the year ahead?
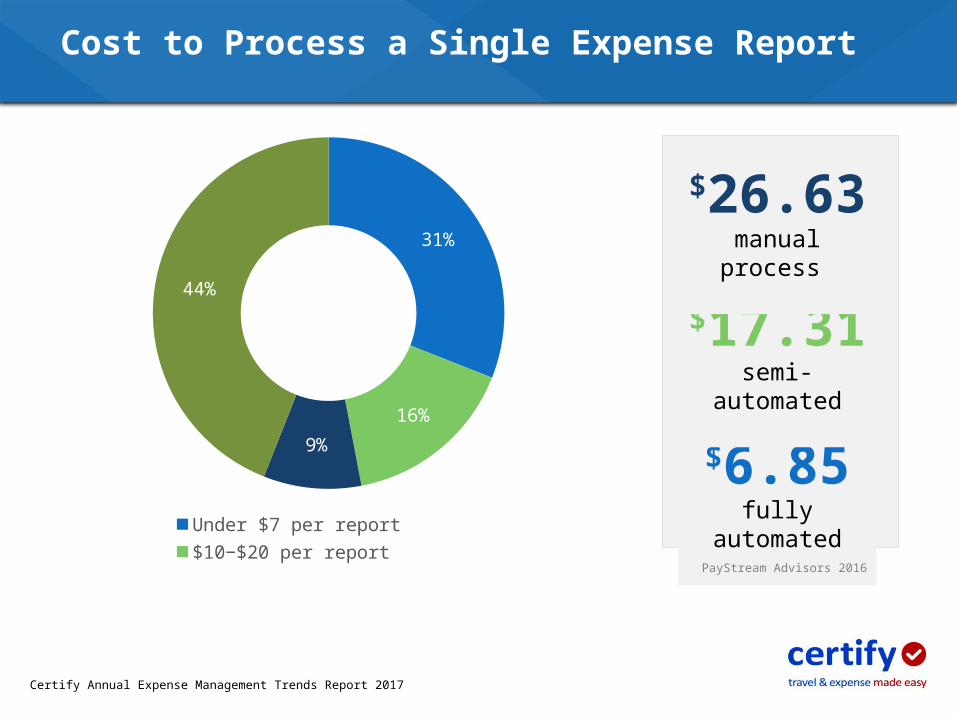
Cost to Process a Single Expense Report
$6.85fully automated
$17.31 semi-automated
$26.63 manual process
PayStream Advisors 2016
31%
16%9%
44%
Under $7 per report $10−$20 per report$25 or more per report We do not track these costs
Certify Annual Expense Management Trends Report 2017
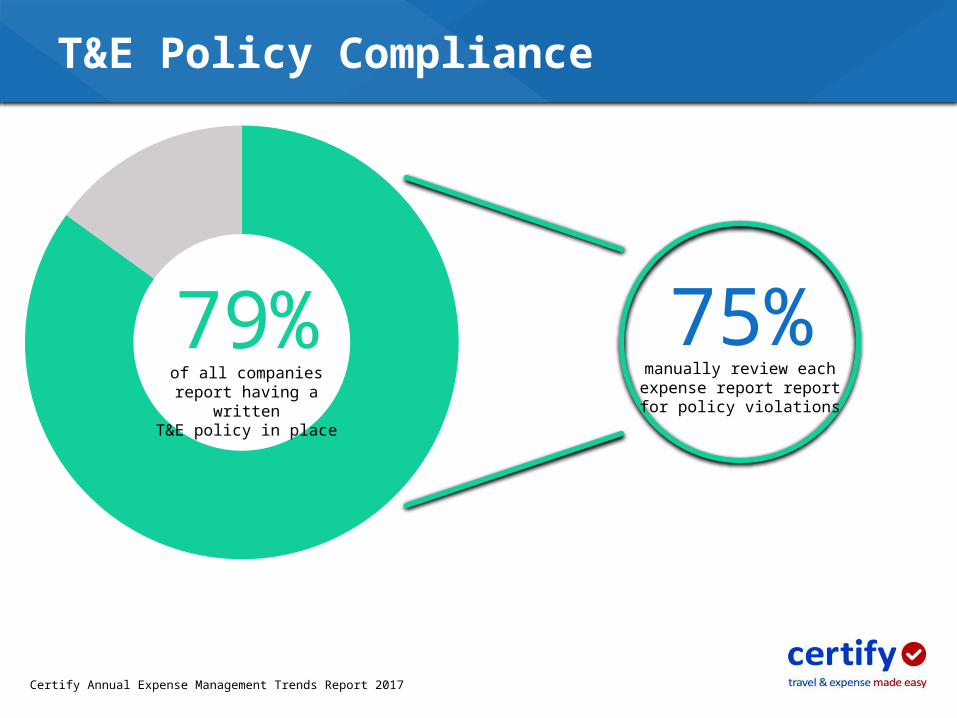
T&E Policy Compliance
79%of all companies report
having a writtenT&E policy in place
75%manually review each expense report report
for policy violations
Certify Annual Expense Management Trends Report 2017

An estimated 20% of a total T&E spend is considered out of policy for the average companyAberdeen Group 2012
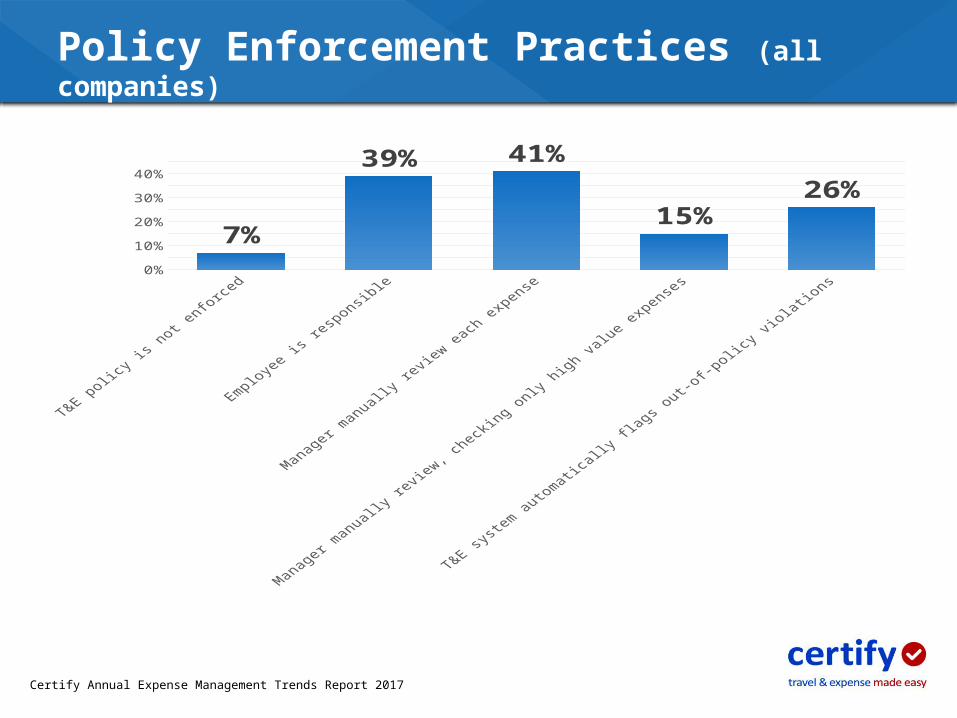
0%5%
10%15%20%25%30%35%40%45%
7%
39% 41%
15%26%
Policy Enforcement Practices (all companies)
Certify Annual Expense Management Trends Report 2017
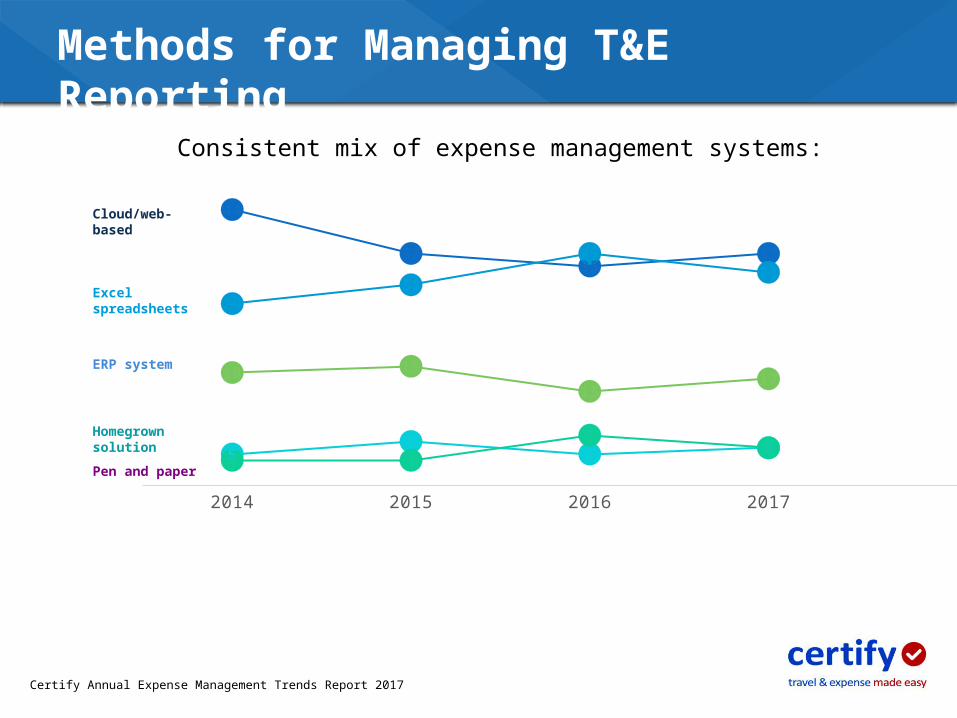
2014 2015 2016 2017
44
3735
37
2932
3734
57
5 64 4
86
18 1915
17
Methods for Managing T&E Reporting
Consistent mix of expense management systems:
Certify Annual Expense Management Trends Report 2017
Cloud/web-based
Excel spreadsheets
ERP system
Homegrown solution
Pen and paper
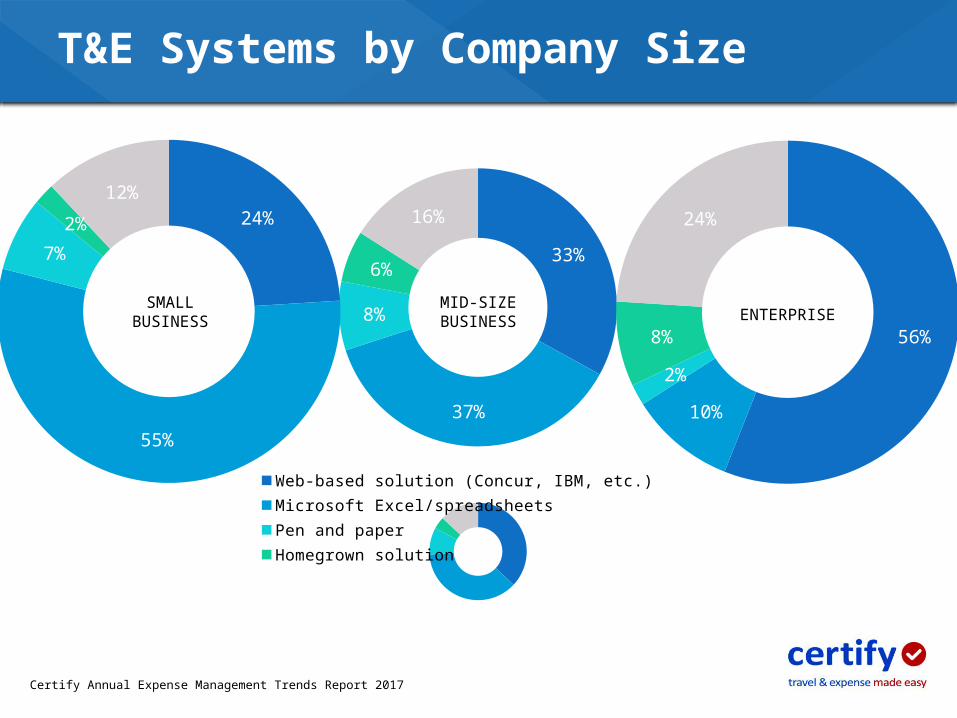
SMALLBUSINESS
MID-SIZEBUSINESS ENTERPRISE
33%
37%
8%
6%
16%
56%
10%
2%
8%
24%24%
55%
7%2%
12%
Web-based solution (Concur, IBM, etc.)Microsoft Excel/spreadsheetsPen and paperHomegrown solutionERP/accounting package (Oracle, SAP, etc.)
T&E Systems by Company Size
Certify Annual Expense Management Trends Report 2017
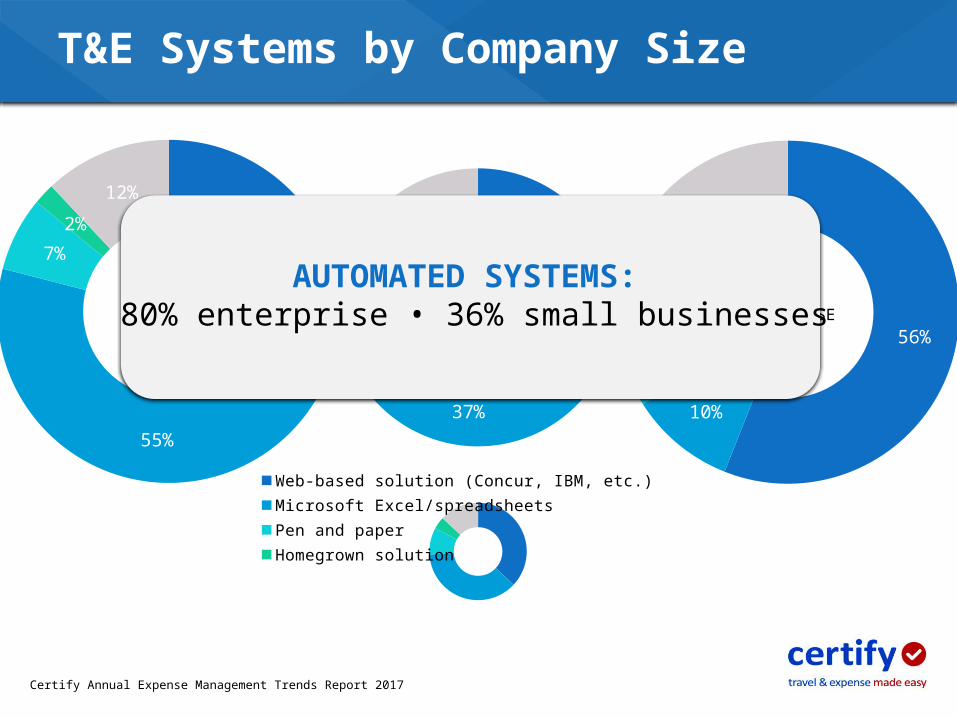
SMALLBUSINESS
MID-SIZEBUSINESS ENTERPRISE
33%
37%
8%
6%
16%
56%
10%
2%
8%
24%24%
55%
7%2%
12%
Web-based solution (Concur, IBM, etc.)Microsoft Excel/spreadsheetsPen and paperHomegrown solutionERP/accounting package (Oracle, SAP, etc.)
AUTOMATED SYSTEMS: 80% enterprise • 36% small businesses
T&E Systems by Company Size
Certify Annual Expense Management Trends Report 2017

Polling Question 3
a) Paper-based/spreadsheetsb) ERP system (Oracle, Microsoft Dynamics, etc.)c) Web-based expense software (Certify, Concur, etc.)d) Not applicable
How does your organization currently manage T&E expense reporting?

The #1 reason companies turn to automation: simplifying expense reporting process for employees and managers (59%)
Certify Annual Expense Management Trends Report 2017
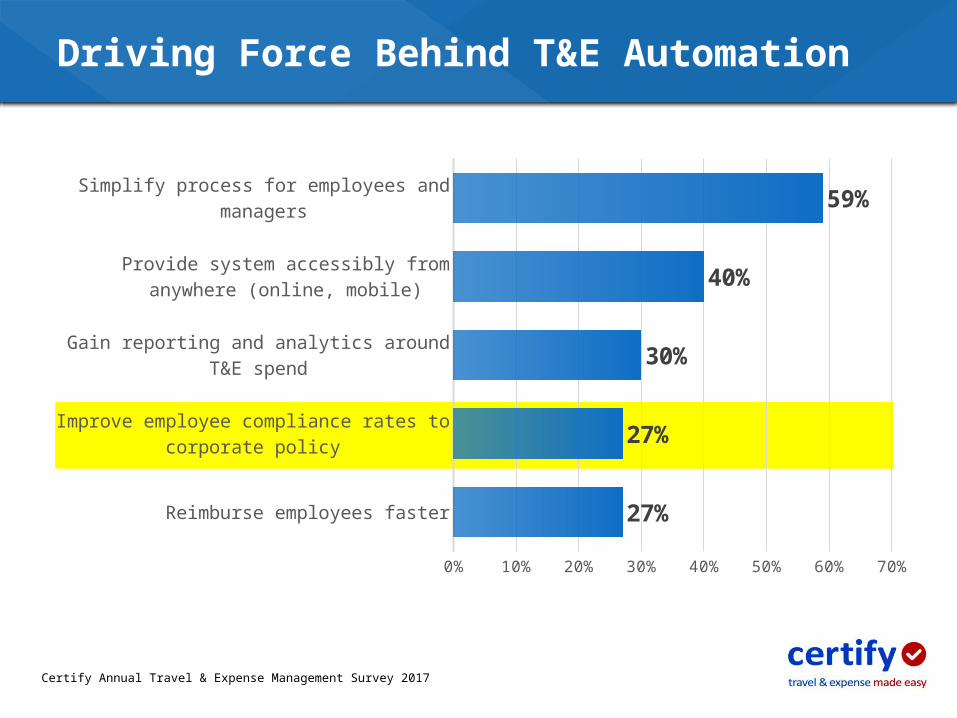
Reimburse employees faster
Improve employee compliance rates to corporate policy
Gain reporting and analytics around T&E spend
Provide system accessibly from anywhere (online, mobile)
Simplify process for employees and managers
0% 10% 20% 30% 40% 50% 60% 70%
27%
27%
30%
40%
59%
Driving Force Behind T&E Automation
Certify Annual Travel & Expense Management Survey 2017
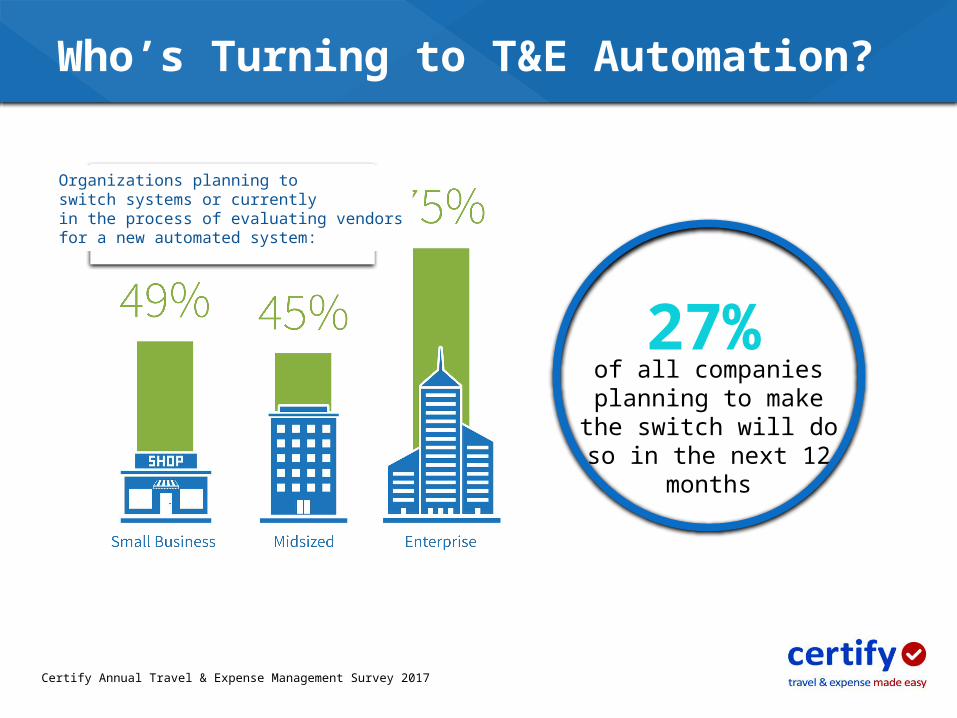
Who’s Turning to T&E Automation?
27%of all companies
planning to make the switch will do so in the
next 12 months
Certify Annual Travel & Expense Management Survey 2017
Organizations planning to switch systems or currently in the process of evaluating vendorsfor a new automated system:
How does T&E automation eliminate inefficiencies and
help control spending?
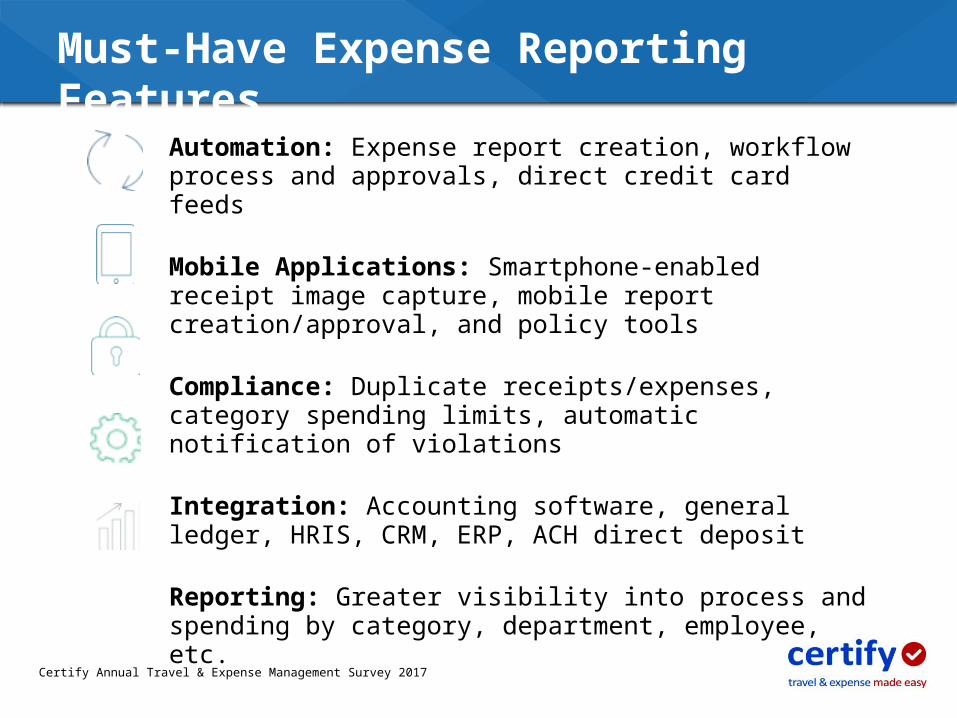
Must-Have Expense Reporting Features
Automation: Expense report creation, workflow process and approvals, direct credit card feeds
Mobile Applications: Smartphone-enabled receipt image capture, mobile report creation/approval, and policy tools
Compliance: Duplicate receipts/expenses, category spending limits, automatic notification of violations
Integration: Accounting software, general ledger, HRIS, CRM, ERP, ACH direct deposit
Reporting: Greater visibility into process and spending by category, department, employee, etc.
Certify Annual Travel & Expense Management Survey 2017
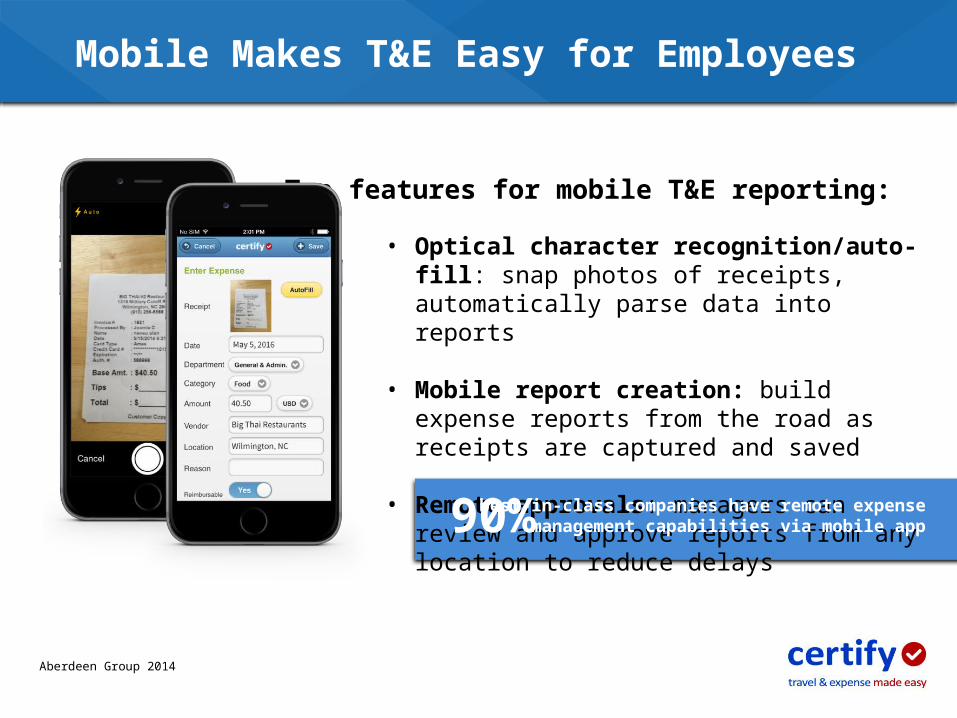
Mobile Makes T&E Easy for Employees
• Optical character recognition/auto-fill: snap photos of receipts, automatically parse data into reports
• Mobile report creation: build expense reports from the road as receipts are captured and saved
• Remote approvals: managers can review and approve reports from any location to reduce delays
Top features for mobile T&E reporting:
Aberdeen Group 2014
90% best-in-class companies have remote expense management capabilities via mobile app
2016

97% of business travelers carry at least one mobile device; 80% used their smartphone to plan or book corporate travel in 2014
Expedia/Egencia Mobile Index 2014
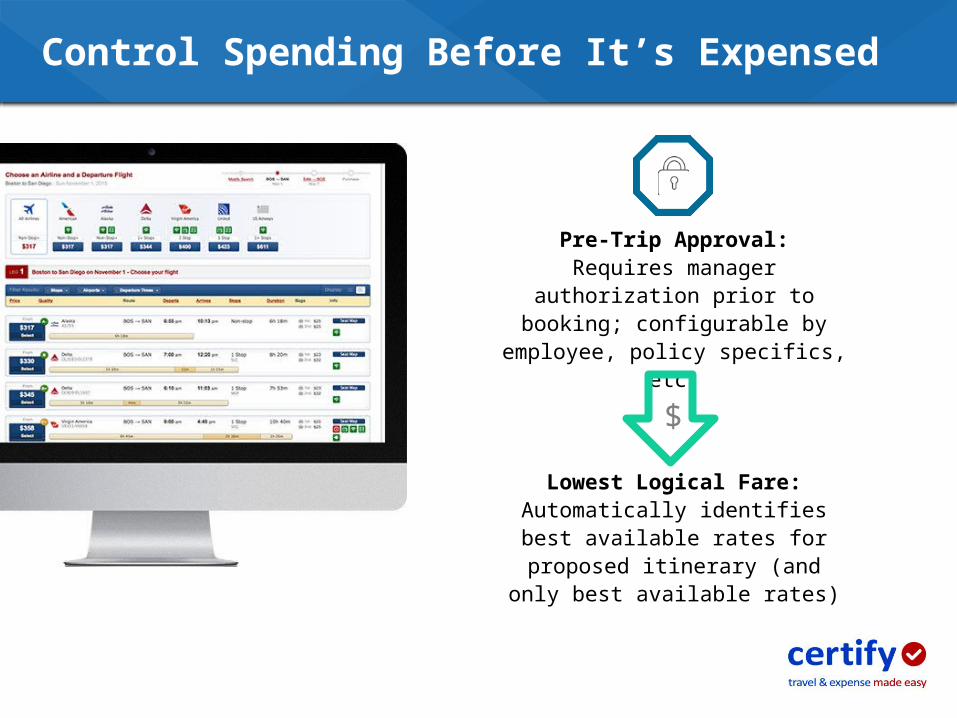
Control Spending Before It’s Expensed
Pre-Trip Approval:Requires manager authorization prior to booking; configurable by employee,
policy specifics, etc.
Lowest Logical Fare:Automatically identifies best available rates for proposed itinerary (and only
best available rates)
$

Companies that track and apply unused tickets can save 5-8% of total annual travel budget
2015 GBTA Ancillary Fee Handbook
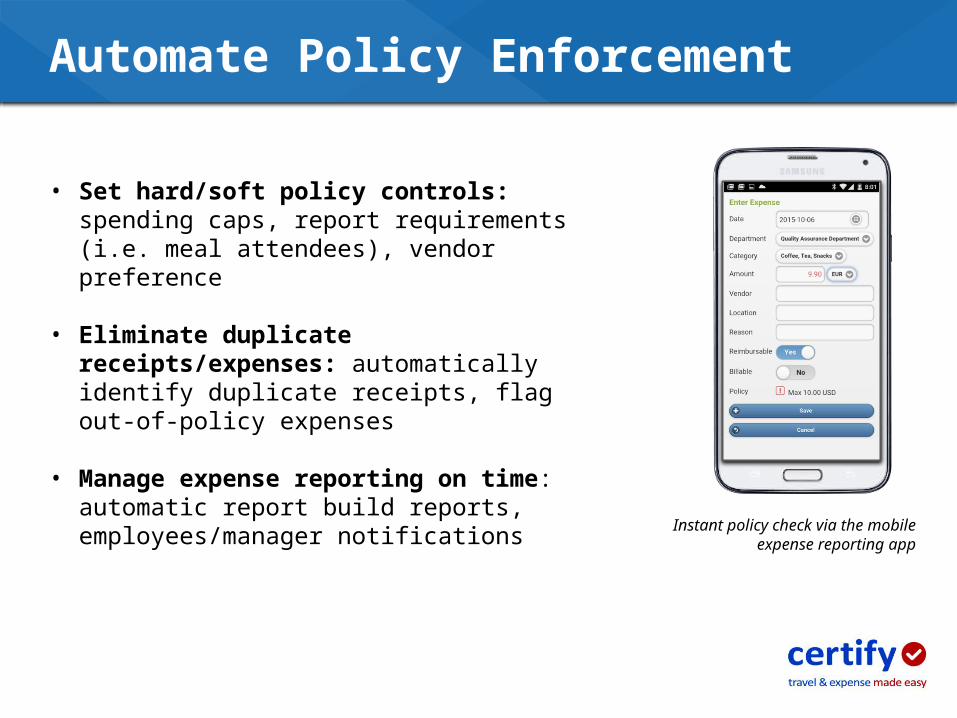
Automate Policy Enforcement
• Set hard/soft policy controls: spending caps, report requirements (i.e. meal attendees), vendor preference
• Eliminate duplicate receipts/expenses: automatically identify duplicate receipts, flag out-of-policy expenses
• Manage expense reporting on time: automatic report build reports, employees/manager notifications
Instant policy check via the mobile expense reporting app

Building company travel policy into T&E expense reporting software has been shown to improve compliance rates as much as 44%
Aberdeen Group 2013

Integrate Systems, Maximize Efficiency
• Accounting systems: automate key accounting functions and streamline workflow
• Corporate credit cards: direct control over employee spending, faster reconciliation
• Corporate systems: reduce data entry and errors across multiple redundant systems
• ACH reimbursement: direct deposit for more efficient reimbursement, simplified accounting

Companies with an integrated T&E solution experience 64% fewer instances of reimbursement errors
Aberdeen Group 2014
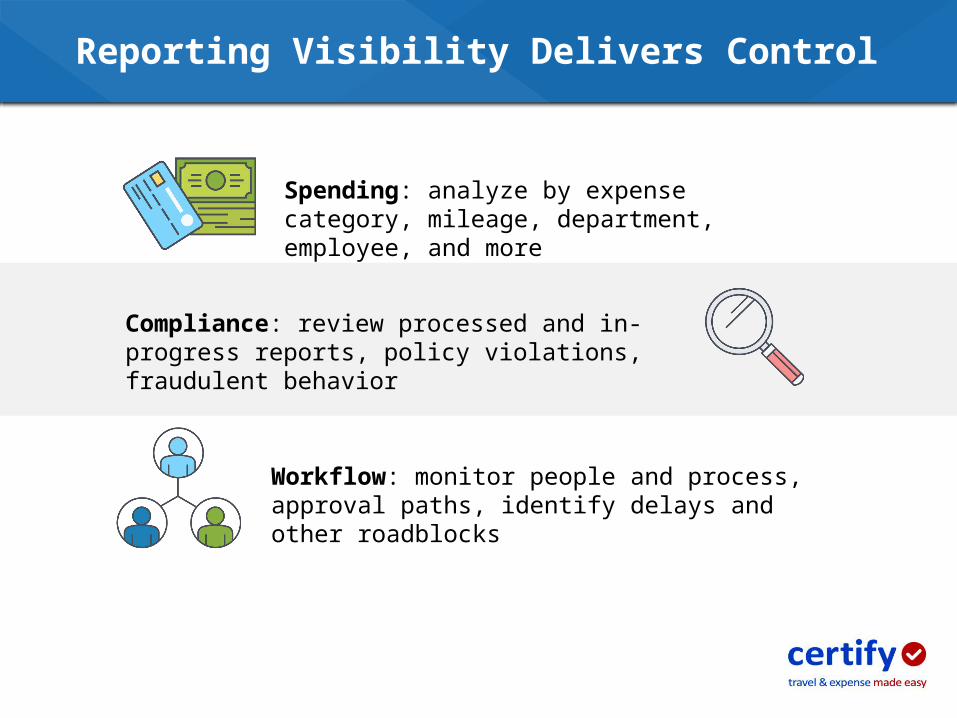
Reporting Visibility Delivers Control
Workflow: monitor people and process, approval paths, identify delays and other roadblocks
Compliance: review processed and in-progress reports, policy violations, fraudulent behavior
Spending: analyze by expense category, mileage, department, employee, and more

Improving visibility into spend is a driving force behind the switch to automation for 30% of companies
Certify Annual Expense Management Trends Report 2017
Closing Thoughts
• Setting the Foundation for Effective T&E Expense Management
• Review your company’s T&E policies; if you do not have them, create them
• Improve the travel IQ of employees and take measures to enforce policies
• Arm travelers with better technologies to simplify expense reporting
• Automate key components of the expense management process
• Benchmark company T&E spending regularly
• Leverage analytics to improve intelligence and data
Setting the Foundation for Effective T&E Expense Management
Additional Resources
• 2017 Expense Management Trends & Benchmarks White Paper
• T&E Expense Management Customer Success Stories
• Expense Management Cost Calculator
• Certify SpendSmart TM Reports

Questions?


![· Gift]Awards/MemoriaIs Expense Legal Services Food/Beverage Expense Polling Expense Printing Expense Salaries/Wages/Contract Labor Solicitation/Fundraising Expense](https://static.fdocuments.in/doc/165x107/5c5ef74209d3f2515c8cf3a9/-giftawardsmemoriais-expense-legal-services-foodbeverage-expense-polling-expense.jpg)