eGovernment Benchmark 2017 - LR V
190
eGovernment Benchmark 2017 Taking stock of user-centric design and delivery of digital public services in Europe Digital Single Market FINAL BACKGROUND REPORT – VOLUME 2 A study prepared for the European Commission DG Communications Networks, Content & Technology by:
Transcript of eGovernment Benchmark 2017 - LR V
eGovernment Benchmark 2017Taking stock of user-centric design and delivery of digital public services in Europe
DigitalSingle
Market
FINAL BACKGROUND REPORT – VOLUME 2A study prepared for the European Commission DG Communications Networks, Content & Technology by:

This study was carried out for the European Commission byCapgemini, IDC, Sogeti, and Politecnico di Milano
For more information about this paper, please contact:
European CommissionDirectorate General for Communications Networks, Content and TechnologyUnit F4. Digital Economy & SkillsGianluca Papa – Project Officer for the eGovernment BenchmarkEmail: [email protected]
Project TeamNiels van der Linden – Principal Consultant, CapgeminiProject Manager eGovernment BenchmarkEmail: [email protected]
Written and reviewed by Dinand Tinholt, Niels van der Linden, Anouschka Groeneveld, Sem Enzerink, Cosmina Radu (Capgemini); Gabriella Cattaneo, Stefania Aguzzi (IDC); Florian Pallaro (Sogeti); Giuliano Noci, Michele Benedetti, Giulia Marchio, Luca Tangi (Politecnico di Milano).
Internal identificationContract number: 30-CE-08484066/00-95 SMART number: SMART 2016 - 0050
DISCLAIMERBy the European Commission, Directorate-General of Communications Networks, Content and Technology.
The information and views set out in this publication are those of the author(s) and do not necessarily reflect the official opinion of the Commission. The Commission does not guarantee the accuracy of the data included in this study. Neither the Commission nor any person acting on the Commission’s behalf may be held responsible for the use which may be made of the information contained therein.
ISBN: 978-92-79-74295-8DOI: 10.2759/742892
© European Union, 2017. All rights reserved. Certain parts are licensed under conditions to the EU. Reproduction is authorised provided the source is acknowledged.
eGovernment Benchmark 2017Taking stock of user-centric design and delivery of digital public services in Europe
FINAL BACKGROUND REPORT – VOLUME 2A study prepared for the European Commission DG Communications Networks, Content & Technology

4
Table of contents
EXECUTIVE SUMMARY 11
1. INTRODUCTION 16 1.1. What is this report about 16 1.2. Who should read the report 16 1.3. Why read the report 17 1.4. How to read the report 17
2. MEASURING EGOVERNMENT 20 2.1. The new eGovernment Action Plan and its policy priorities for 2016-2020 20 2.2. The eGovernment Benchmark method 21 2.2.1. The measurement framework: four top-level benchmarks 21 2.2.2. Updates in the method of the eGovernment Benchmark 2016 22 2.2.3. Method of data collection 23 2.2.4. The life events in 2016 25
PART ONE: A BIRD’S EYE VIEW ON EGOVERNMENT PROGRESS IN EUROPE 27
3. SYNTHESIS OF TOP-LEVEL BENCHMARKS 28 3.1. Overview of results for the top-level benchmarks 28 3.2. User Centricity 32 3.2.1. Online availability of services 33 3.2.2. Usability of services 35 3.2.3. Mobile friendliness of services per life event 36 3.2.4. Mandatory online services 38 3.3. Transparency 42 3.4. Cross-border Mobility 51 3.5. Key Enablers 54 3.6. Key findings 60
PART TWO: DEEP DIVE INTO THE LIFE EVENTS 63
4. STARTING UP A BUSINESS AND EARLY TRADING OPERATIONS 64 4.1. Introduction to life event 64 4.2. User Centricity 65 4.2.1 Online availability 65 4.2.2. Mobile friendliness 67 4.3. Transparency 68 4.4. Cross-border Mobility 68 4.5. Key Enablers 70 4.6. Progress across Europe 72
5. FAMILY 77 5.1. Introduction to life event 78 5.2. User Centricity 79 5.2.1. Online availability 79 5.2.2. Mobile friendliness 79 5.3. Transparency 81 5.4. Key Enablers 81 5.5. Progress across Europe 83

5
6. LOSING AND FINDING A JOB 87 6.1. Introduction to life event 88 6.2. User Centricity 88 6.2.1. Online availability 89 6.2.2. Mobile friendliness 89 6.3. Transparency 91 6.4. Key Enablers 91 6.5. Progress across Europe 94
7. STUDYING 97 7.1. Introduction to life event 98 7.2. User Centricity 99 7.2.1. Online Availability 99 7.2.2. Mobile friendliness 99 7.3. Transparency 100 7.4. Cross-border Mobility 101 7.5. Key Enablers 102 7.6. Progress across Europe 104
8. THE EXPLORATIVE BENCHLEARNING PERSPECTIVE 107 8.1. The benchlearning approach 108 8.1.1. Introduction to the benchlearning perspective 108 8.1.2. The framework of the explorative benchlearning perspective 108 8.2. Step 1: Measuring Country Performance through the absolute indicators Penetration and Digitisation 109 8.2.1. Penetration 109 8.2.2. Digitisation 110 8.2.3. Understanding performances 111 8.3. Step 2: Understanding the impact of context-specific variables on performances 114 8.3.1. Methodology 114 8.3.2. Users’ characteristics that influence eGovernment performance 114 8.3.3. Government’s characteristics that influence eGovernment performance 115 8.3.4. Context Characteristics that influence eGovernment performance 115 8.3.5. Relative indicators analysis 116 8.4. Comparing countries to understand and improve performance 119 8.4.1. Methodology and data analysis 119 8.4.2. Users characteristics’ impact on eGovernment performance 120 8.4.3. Government characteristics’ impact on eGovernment performance 122 8.4.4. Context characteristics’ impact on eGovernment performance 125 8.4.5. The benchlearning perspective 127 8.5. Improving the framework: considerations for future applications 131
ANNEX I: RELATIVE INDICATORS 132ANNEX II: LONG LIST OF GOOD PRACTICES 136II.1 User centricity 136II.2 Transparency 147II.3 Key enablers 155II.4 Starting up a business and trading operations 169II.5 Family 175II.6 Losing and finding a job 180II.7 Studying 184

6
Figure 1: eGovernment Action Plan 2016-2020 21Figure 2: Overview of Action Plan Principles and benchmark method update 23Figure 3: Overview of life events under assessment in 2012 - 2016 25Figure 4: Average scores for the top-level benchmarks across the 2016 life events (EU28+, %) 29Figure 5: Average scores of the four top-level benchmarks per 2016 life event (EU28+, %) 31Figure 6: Country ranking – average results for top-level benchmarks per 2016 life event (EU28+, %) 31Figure 7: User Centricity per 2016 life event – average country results (EU28+, %) 33Figure 8: Availability of services per country, average of results of 2016 life events (EU28+, %) 34Figure 9: Availability of public services at central, regional and local level across EU28+ (2016, %) 35Figure 10: Interaction options with public administration, average of 2016 life events (EU28+, %) 36Figure 11: Mobile friendliness per 2016 life event (EU28+, %) 37Figure 12: Mobile friendliness portals vs. services - average all life events (EU28+, %) 37Figure 13: Overview of the extent to which countries have made services mandatory online 39Figure 14: Scores in each Transparency indicator – average results of 2016 life events (EU28+, %) 44Figure 15: Transparency of Service Delivery – average results of 2016 life events (EU28+, %) 44Figure 16: Transparency of Personal Data – average results of 2016 life events (EU28+, %) 45Figure 17: Number of countries per stage of maturity for monitoring who has consulted personal data of the user (2016, EU28+, absolute numbers) 46Figure 18: Transparency of Public Organisations – average results of 2016 life events (EU28+, %) 47Figure 19: Online availability, Usability of services and use of Key Enablers in cross-border services – average results of 2016 life events (EU28+, %) 51Figure 20: Online availability of services for country nationals vs. non-country nationals (2016, EU28+, %) 52Figure 21: Availability of Key Enablers - average results of 2016 life events (EU28+, %) 55Figure 22: Use of Key Enablers in business and citizens service provision (2016, EU28+, %) 56Figure 23: Availability of public services in life event Business (2016, EU28+, %) 66Figure 24: Mobile-friendliness of services in life event Business (2016, EU28+, %) 67Figure 25: Mobile-friendliness of portals in life event Business (2016, EU28+, %) 68Figure 26: Transparency of Service Delivery, average per service in life event Business (2016, EU28+, %) 69Figure 27: Cross-border availability of services in life event Business – average results (2016, EU28+, %) 69Figure 28: Availability of eID, eDocuments and Authentic Sources per service in life event Business – average across EU28+ (2016, %) 71Figure 29: Correlation online availability and Key Enabler Authentic Sources - life event Business by country (2016, EU28+, %) 72Figure 30: Country ranking in life Event Business - average of top level benchmarks (2016, EU28+, %) 73Figure 31: Availability of each public service in the life event Family (online, illustrating automated, fully online, information online, via portal, offline) (EU28+, %) 80Figure 32: Country ranking: Mobile friendliness of services in life event Family (2016, EU28+, %) 80Figure 33: Country ranking: Mobile friendliness of portal in life event Family (2016, EU28+, %) 80Figure 34: Transparency of Service Delivery per service in life event Family (2016, EU28+, %) 81Figure 35: Availability of eID, eDoc and Authentic Sources per service in life event Family – average across EU28+ (2016, %) 82Figure 36: Correlation Online Availability and Key Enabler Authentic Sources in life event Family (2016, %) 83Figure 37: Country ranking in life event Family - average of top level benchmarks (2016, EU28+, %) 84Figure 38: How services are made available for the Losing and finding a job life event (2016, EU28+, %) 89Figure 39: Country ranking 2016: Mobile friendliness of services in life event Losing and finding a job (%) 90Figure 40: Country ranking 2016: Mobile friendliness of portals in life event Losing and finding a job (%) 90Figure 41: Transparency of Service Delivery per service in life event Job – average across EU28+ (%) 91Figure 42: Availability of eID, eDocuments and Authentic Sources per service in life event Job – average across EU28+ (2016, %) 92Figure 43: Correlation Online Availability of services and Use of Authentic Sources in life event Job (2016, %) 93
Table of figures

eGovernment Benchmark 2017
7
Figure 44: Country ranking in life event Job - average of top level benchmarks (2016, %) 94Figure 45: Availability of services in the life event Studying (2016, EU28+, %) 99Figure 46: Mobile friendliness of services in life event Studying (2016, EU28+, %) 100Figure 47: Mobile friendliness of portals in life event Studying (2016, EU28+, %) 100Figure 48: Level of Transparency of Service Delivery per service in life event Studying (2016, EU28+, %) 101Figure 49: Cross-border availability of services in life event Studying – average results (2016, EU28+, %) 102Figure 50: Availability of eID, eDoc and Authentic Sources per service in life event Studying – average cores (2016, EU28+, %) 103Figure 51: Correlation online availability and use of Key Enabler Authentic Sources in life event Studying (2016, EU28+, %) 104Figure 52: Country ranking in life event Job - average of top level benchmarks (2016, EU28+, %) 104Figure 53: Penetration indicator valorisation 109Figure 54: Penetration index 110Figure 55: Digitisation indicator valorisation 110Figure 56: Digitisation Index 111Figure 57: Scenarios for Penetration and Digitisation levels 112Figure 58: Penetration vs Digitisation 113Figure 59: Geographical positioning on relative indicators 117Figure 60: Country performance on relative indicators compared to European average 118Figure 61: Mock-up visualisation of the performance clusters 119Figure 62: Digital skills vs Penetration 120Figure 63: Digital skills vs Digitisation 121Figure 64: ICT usage vs Penetration 121Figure 65: ICT usage vs Digitisation 122Figure 66: Quality vs Penetration 123Figure 67: Quality vs Digitisation 123Figure 68: Openness vs Penetration 124Figure 69: Openness vs Digitisation 125Figure 70: Connectivity vs Penetration 125Figure 71: Connectivity vs Digitisation 126Figure 72: Digital in the private sector vs Penetration 127Figure 73: Digital in the private sector vs Digitisation 128Figure 74: Penetration and Digitisation relative performances 129Figure 75: Absolute and relative performances 130
8
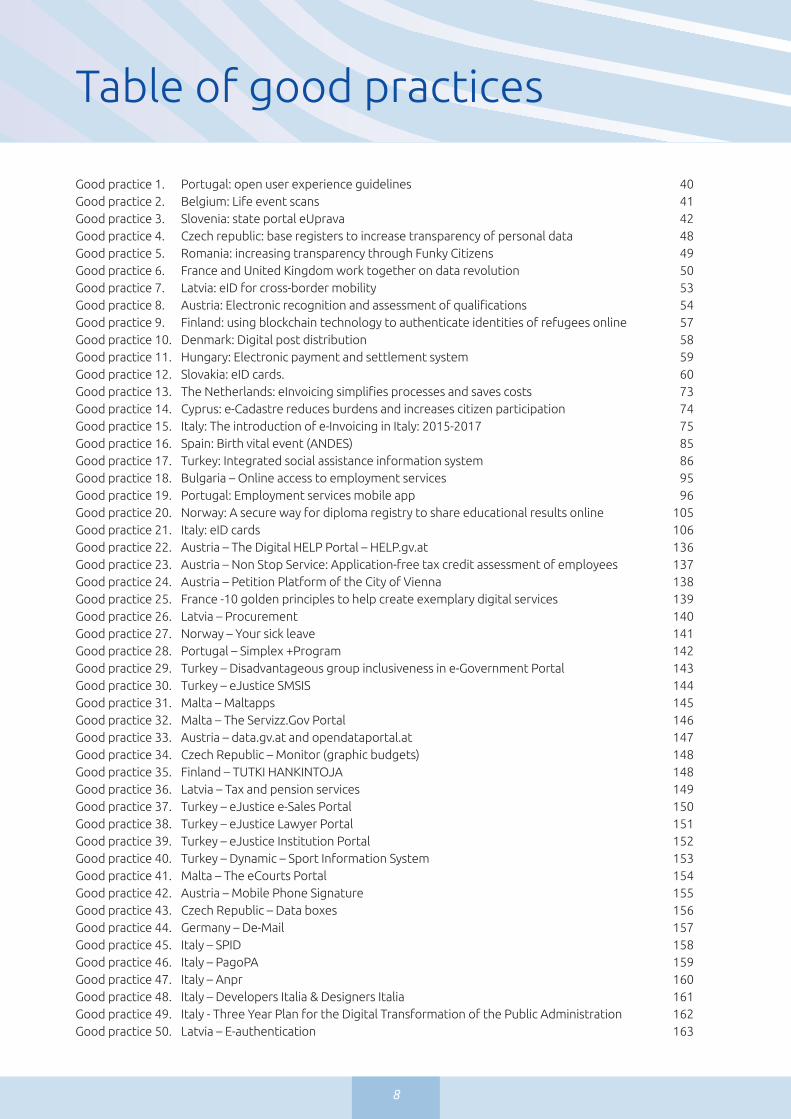
Good practice 1. Portugal: open user experience guidelines 40Good practice 2. Belgium: Life event scans 41Good practice 3. Slovenia: state portal eUprava 42Good practice 4. Czech republic: base registers to increase transparency of personal data 48Good practice 5. Romania: increasing transparency through Funky Citizens 49Good practice 6. France and United Kingdom work together on data revolution 50Good practice 7. Latvia: eID for cross-border mobility 53Good practice 8. Austria: Electronic recognition and assessment of qualifications 54Good practice 9. Finland: using blockchain technology to authenticate identities of refugees online 57Good practice 10. Denmark: Digital post distribution 58Good practice 11. Hungary: Electronic payment and settlement system 59Good practice 12. Slovakia: eID cards. 60Good practice 13. The Netherlands: eInvoicing simplifies processes and saves costs 73Good practice 14. Cyprus: e-Cadastre reduces burdens and increases citizen participation 74Good practice 15. Italy: The introduction of e-Invoicing in Italy: 2015-2017 75Good practice 16. Spain: Birth vital event (ANDES) 85Good practice 17. Turkey: Integrated social assistance information system 86Good practice 18. Bulgaria – Online access to employment services 95Good practice 19. Portugal: Employment services mobile app 96Good practice 20. Norway: A secure way for diploma registry to share educational results online 105Good practice 21. Italy: eID cards 106Good practice 22. Austria – The Digital HELP Portal – HELP.gv.at 136Good practice 23. Austria – Non Stop Service: Application-free tax credit assessment of employees 137Good practice 24. Austria – Petition Platform of the City of Vienna 138Good practice 25. France -10 golden principles to help create exemplary digital services 139Good practice 26. Latvia – Procurement 140Good practice 27. Norway – Your sick leave 141Good practice 28. Portugal – Simplex +Program 142Good practice 29. Turkey – Disadvantageous group inclusiveness in e-Government Portal 143Good practice 30. Turkey – eJustice SMSIS 144Good practice 31. Malta – Maltapps 145Good practice 32. Malta – The Servizz.Gov Portal 146Good practice 33. Austria – data.gv.at and opendataportal.at 147Good practice 34. Czech Republic – Monitor (graphic budgets) 148Good practice 35. Finland – TUTKI HANKINTOJA 148Good practice 36. Latvia – Tax and pension services 149Good practice 37. Turkey – eJustice e-Sales Portal 150Good practice 38. Turkey – eJustice Lawyer Portal 151Good practice 39. Turkey – eJustice Institution Portal 152Good practice 40. Turkey – Dynamic – Sport Information System 153Good practice 41. Malta – The eCourts Portal 154Good practice 42. Austria – Mobile Phone Signature 155Good practice 43. Czech Republic – Data boxes 156Good practice 44. Germany – De-Mail 157Good practice 45. Italy – SPID 158Good practice 46. Italy – PagoPA 159Good practice 47. Italy – Anpr 160Good practice 48. Italy – Developers Italia & Designers Italia 161Good practice 49. Italy - Three Year Plan for the Digital Transformation of the Public Administration 162Good practice 50. Latvia – E-authentication 163
Table of good practices

eGovernment Benchmark 2017
9
Good practice 51. Norway - eSignature 164Good practice 52. Norway – User-driven consent in Altinn 165Good practice 53. Portugal - SCAP 166Good practice 54. Turkey – Ministry of Development e-Correspondence Project 167Good practice 55. Turkey – Revenue Administration 168Good practice 56. Turkey – Ministry of Interior: Directorate General of Civil Registration and Citizenship Affairs 168Good practice 57. Austria – Unternehmensserviceportal (USP) 169Good practice 58. Austria – The Business Service Portal 170Good practice 59. Turkey – Central Trade Registry System (MERSIS) 171Good practice 60. United Kingdom – Government Digital Service 172Good practice 61: StartUpGreece: Actions for the acceleration of the Greek startup ecosystem 173Good practice 62. Malta – The BusinessFirst Portal 174Good practice 63. Austria - Automated Family Allowances 175Good practice 64. Spain – ¡Digitalíza-t! 176Good practice 65. Turkey – Ministry of Interior – Directorate General of Civil Registration and Citizenship Affairs 177Good practice 66. Turkey – eJustice Retrieval Certificate of Inheritance Document 177Good practice 67. Turkey – Ministry of Health, e-Pulse 178Good practice 68. Malta – The myHealth Portal 179Good practice 69. Austria – eAMS Account by Public Employment Service Austria (AMS) 180Good practice 70. Turkey – eJustice (Which is a part of eGovernment) Services 181Good practice 71. Turkey – Finding/Appliying Job and Course Information 182Good practice 72. Malta – The JobsPlus Portal 183Good practice 73. Austria - Austrian Study Grant Authority 184Good practice 74. Portugal – Digitally assisted eGovernment public services delivery 185Good practice 75. Slovenia – Subsidised transport ticket for students 186Good practice 76. Turkey – Council of Higher Education – University e-Registiration 187Good practice 77. Turkey – Ministry of Education- e-School (MEBBIS) 188


Executive Summary
The digital transformation of governments across Europe is one of the cornerstones of achieving the Digital Single Market vision, as well as the broader EU2020 goals. The recent Ministerial Declaration emphasises the need to strive towards ‘open, efficient and inclusive, providing borderless, interoperable, personalised, user-friendly, end-to end digital public services to all citizens and businesses – at all levels of public administration1’. The Declaration also includes ‘User-centricity principles for design and delivery of digital public services’. The 2017 EU eGovernment benchmark sheds light onto the state-of-play of the digital transformation of European public administrations and the extent to which they are ‘on track’ with regard to achieving these objectives.
This year’s measurement gains further relevance when assessed against the background of the publication of the new eGovernment Action Plan 2016-2020 in April last year. The 2017 measurement not only provides an in-depth analysis of the progress made by European public administrations in their modernisation of service provision; it also delivers the ‘baseline’ against which the progress made by the actions under the new eGovernment Action Plan 2016-2020 can be benchmarked. In doing so, the benchmark aims at providing – like every year—an assessment of the extent to which European public administrations are on track to achieving the 2020 vision of a Digital Single Market.
This Background Report presents a detailed overview of the updated measurement, the four life events, and provides the reader with a thorough analysis of the results on the top-level benchmarks, in each of the 2016 life events. The current report is accompanied by an Insight Report which highlights the main findings of the benchmarking exercise.
In the benchmark tradition, the life events of 2014 represented the focus in 2016, as part of the biennial cycle of the benchmark. These domains are: Starting a Business, Losing and Finding a Job and Studying. In addition to these and with the broader goal of providing further impulses to public administrations across Europe towards the mod-ernisation of their service provision in new domains, a further life event was added this year: Family Life.
The analysis follows the lines of four top-level benchmarks, covering important EU policy priorities:
■ User Centricity - indicates the extent to which a service or information concerning the service is provided online.
■ Transparency - indicates the extent to which governments are transparent with regard to
a) the process of service delivery; b) their own responsibilities and performance; c) the personal data involved.■ Cross Border Mobility - indicates the extent to which customers of public services
users can use online services in another European country.■ Key enablers - indicates the extent to which technical pre-conditions for eGovern-
ment service provision are used.
11
1 Talinn Ministerial Declaration on eGovernment, 6 October 2017, available online: http://ec.europa.eu/newsroom/document.cfm?doc_id=47559

12
With regard to the four top-level benchmarks, the following key findings can be report-ed over 2016:
On User Centricity:
■ User Centricity continues to advance on the quantitative dimension, with more online services available online in 2016.
■ The quality of service provision is catching up speed, with higher scores in terms of service usability as well as a good progress on the mobile friendliness dimension. Despite the progress, public administrations have not accelerated a great deal on this dimension, at least not to an extent to which they could keep up pace with the fast speed of spread of mobile internet adoption.
■ In 2016, 1 in 2 services were available online via smartphones or tables. Yet, the indicator ‘mobile friendliness’ is still considerably lagging behind, compared to the other two indicators that measure User Centricity of Government.
On Transparency:
■ Transparency of Government crystallised as the missed opportunity of the 2016 measurement, with overall modest progress on the dimensions of service delivery and personal data and a more optimistic – albeit still modest – progress on the public administration indicator.
On Cross-border services:
• The vision of a Digital Single Market is taking shape, with a slightly smaller gap between service provision for national and foreign users of public services in a given national context. Still eGovernment services are friendlier to domestic users than to users from other European countries.
• The Cross-Border Mobility of both businesses and citizens is improving, with the latter appearing to be catching slightly more speed.
On Key Enablers:
• The use of technological pre-conditions (Key Enablers) still has room to accelerate. Improvements were observed in 2016 on the availability of the eID and eDocuments. However the progress is still modest given the two-year timeframe between measurements.
• On average for the four domains, eDocuments shows the best adoption rate across life events in Europe, with a score of 61%. The use of the eID was pos-sible in 1 out of 2 European services in 2016. Although ranking last in terms of adoption rate, the adoption of Authentic Sources has gained the most speed in 2016, in particular in the more established life events Business, Job and Studying.
• Overall in Europe, bringing services online continues to be pushed forward while actions to enhance the user experience along the service interactions are still a lower priority. However the divide between the quantity and quality aspects seems to be shrinking.

eGovernment Benchmark 2017
13
When zooming into the four life events, the 2016 benchmark provides following key insights:
■ Starting up a business continues to develop well on all benchmarks and remains ‘best in class’ among the assessed life events. The domain shows potential to reach maximum scores in terms of usability and online availability in two-years-time. With targeted efforts, the developments on the other benchmarks could also come very close to maximum scores.
■ Losing and finding a job has caught up significant speed across Europe and shows a steady progress from 2012 on. Welfare agencies make more and more use of eID, and, more encouragingly, they have shown great progress on the use of Authentic Sources.
■ Studying continues on the growth path in service provision within national borders, as well as in cross-border services. The online availability of services in cross bor-der interactions has for the very first time surpassed the cross-border mobility of businesses. On this life event as well, the Transparency benchmark scores low – with the lowest results among the three more established life events.
■ Family Life is the least mature domain in 2016. Given the fact that the life event is being assessed for the very first time with this year’s benchmarking exercise, the scores should be seen rather as a ‘baseline’ for the future measurements, rather than signals for any development. Nevertheless, significant progress is needed in this life event, as the results of 2016 can be described as modest at best.

14

eGovernment Benchmark 2017
Introduction

16
Introduction
1
1.1. What is this report aboutThis year’s edition of the eGovernment Benchmark assesses the progress of the digital transformation of governments across Europe in 2016, and provides the baseline against which the measures undertaken in the framework of the new eGovernment Action Plan for the period 2016-2020 will be assessed. The report presents the results of the as-sessment of eGovernment services in 34 countries – the European Union Member States, as well as Iceland, Norway, Mon-tenegro, Republic of Serbia, Switzerland, and Turkey – referred to Europe or EU28+ throughout the report. The benchmark is an assessment conducted on a yearly-basis for the European Commission that monitors the implementation of the eGo-vernment Action Plan’s priorities across Europe. For the 34 participating countries the assessment provides an overview of their own progress on eGovernment, as well as a ‘peer-comparison’ with the possi-bility to learn from the best practices and success stories in other countries that are in a similar situation. The present paper represents the ‘back-ground report’. It aims to provide a
“By 2020, public administrations and public institutions in the European Union should be open, efficient and inclusive, providing borderless, personalised, and user-friendly, end-to-end digital public services to all citizens and businesses in the EU. Innovative approaches are used to design and deliver better services in line with the needs and demands of citizens and businesses. Public administrations use the opportunities offered by the new digital environment to facilitate their interactions with stakeholders and with each other.”
Vision of the eGovernment Action Plan 2016-2020
comprehensive view on the performed measurements. The results on the indica-tors that compose the framework are presented for each life event, as well as at aggregated level across all life events. This report also includes extensive de-scription of the peer-clustering exercise that has been performed to facilitate and encourage best practices transfer across Member States.
1.2. Who should read the reportThe report is relevant to a broad spectrum of groups as it provides valuable insights into the digital transformation in govern-ment across Europe:
■ Government and public administra-tion officials, who are interested in observing the development of eGov-ernment in their own national context, and benchmark this against other European countries.
■ Researchers in the eGovernment field or related areas that are interested in tapping into the rich data source on which the benchmarking exercise is based and gather further insights on eGovernment across Europe. The data of both the background and the insights reports is open, free of charge and provided in a machine-readable data. This includes all life event as-sessments performed in 2016. The Commission’s webpage also includes the data collected in previous meas-urements in 2012/2013/2014/2015 as well as the demand-side user survey amongst citizens of 2012.
■ Businesses and developers who are providing or are interested in develop-ing eGovernment applications and ser-vices to public administrations across Europe. The report provides insights into the life events and assessment dimensions, highlighting the areas that need further improvement.

eGovernment Benchmark 2017
17
■ Citizens and entrepreneurs interested in observing the state of play as well as progress with regard to eGovernment in their country and across Europe. With an increase in cross-border transactions for citizens and business, the insights pro-vided by the benchmark are of particular relevance.
1.3. Why read the reportThis year’s benchmark gains particular rel-evance against the backdrop of the adoption of the new eGovernment Action 2016-20202 in April 2016. The results on the state-of-play on eGovernment in 2016 will therefore also represent the baseline against which the progress and effectiveness of measures under the new eGovernment Action Plan will be assessed. The monitoring of the digital transformation of government is a key element to assessing the progress towards completing the Digital Single Market (hence-forth DSM) as well as the pursuit of a more “citizen-centric Europe”.
From a general perspective however, benchmarking exercises provide insight into the state of play of eGovernment services in Europe and play an essential part in ena-bling the European Union to tackle the cur-rent socio-economic challenges in a timely, and more importantly, adequate manner. The benchmarking analysis is used as a com-parison tool for analysing processes and performance metrics, against the standard or best practices in a given field. The benchmarking exercise represents a pivotal component of the European Union’s Open Method of Coordination (OMC). This tool is used to stimulate mutual learning processes, to perform multilateral surveil-lance and to contribute to further conver-gence of participating countries’ policies in various policy areas.
The benchmarking includes constructing a well-defined baseline against which the
subjects of the study are compared. This will be used to analyse their performance, establish good practices and identify strength areas as well as inadequacies. In the context of public sector innovation, it offers insights into how services can improve in quality and efficiency and can enable govern-ments to provide adequate and timely responses to such inadequacies. Bench-marking is the first step of a continuous bench-learning and improvement cycle.
1.4. How to read the reportThe present report – called the Back-ground Report – is the extensive benchmark assessment, which aims to deliver an impactful study on eGovern-ment. This report is complemented by the shorter Insight Report, which present the key findings and policy recommendations. Complementary to these two reports, country factsheets are provided to enable a more focused insights at national level into the re-sults per top-level benchmark and per life event in comparison with the rest of the EU. The research is completed by the raw data that is publicly available. The graphs presented in this report are considered most relevant to represent the data gathered. The data allows for even more representations. Please con-sult the Method Paper which includes a comprehensive description of the method used (including full descrip-tion of the questionnaire and life event models for instance).
The Background Report is structured as follows:
■ Chapter 2 provides an overview of the measurement, including the policy priorities it addresses and a short description of the methodology3;
2 European Commission (2016). The EU eGovernment Action Plan 2016-2020. Accelerating the digital transformation of government. Available at: http://eur-lex.europa.eu/legal-content/EN/TXT/?uri=CELEX:52016DC0179
3 For a more detailed description of the methodology, please refer to the Method Paper published with the present report.
18
■ Chapter 3 provides the analysis of the top-level benchmarks for the indicators: User Centricity, Transparency, Cross-border Mobility and Key Enablers;
■ Chapters 4 to 7 provide the insights for the four life events under scrutiny in this edition: Starting a business and early trading activities, Studying, Los-ing and finding a job, and Family life;
■ Chapter 8 presents the clustering analysis of countries based on the rela-tive indicators, analysing performance of countries that have similar pre-req-uisites and developing paths.
1

eGovernment Benchmark 2017
19

20
Measuring eGovernment
2
2.1. The new eGovernment Action Plan and its policy priorities for 2016-2020
With the new eGovernment Action Plan 2016-2020, the European Commission aims at undertaking actions along three priority areas4:
■ Modernisation of public administra-tion with ICT, using Key Enablers. The European Commission underlines the importance of the uptake of Key Ena-blers towards creating digital public services that are fit for the future. Key Enablers such as electronic Identifica-tion, electronic Document, Authentic Sources, and Single Sign On facilitate the transformation of public adminis-trations towards lean and user-centric public service providers.
■ Enabling Cross-border Mobility with interoperable digital public services. Cross-border public services are con-sidered the backbone for the effective functioning of the EU Single Market, as they facilitate Cross-border Mobil-ity, thus enabling access to markets, boosting competitiveness and attrac-tiveness of the EU as a place to live and invest in.
■ Facilitation of digital interaction between citizens/business and administrations towards providing high-quality public services. Increasing interaction and exchange in the design process of high-quality public services also takes a front role in the new Action Plan. The availability of digital public services that are in line with the needs of the users (citizens and busi-nesses) is linked to competitiveness and attractiveness of Europe as loca-tion for investments. Greater involve-ment of end-users in the design and
delivery process is considered to be a key promoter towards this end. In ad-dition the interaction and exchange via the publishing and re-sue facilitation of public services will be pursued as well on this pillar, as it creates further opportunities for knowledge, growth and job creation.
In supporting actions on these dimensions, following principles will be promoted:
Digital by Default:■ Public administrations should deliver
services digitally (including machine readable information) as the pre-ferred option (while still keeping other channels open for those who are disconnected by choice or necessity). In addition, public services should be delivered through a single contact point or a one-stop-shop and via differ-ent channels.
Once only principle: ■ Public administrations should ensure
that citizens and businesses supply the same information only once to a public administration. Public administration offices take action if permitted to in-ternally re-use this data, in due respect of data protection rules, so that no additional burden falls on citizens and businesses.
Inclusiveness and accessibility: ■ Public administrations should design
digital public services that are inclu-sive by default and cater for different needs such as those of the elderly and people with disabilities.
Openness & transparency: ■ Public administrations should share
information and data between them-selves and enable citizens and busi-nesses to access control and correct
4 http://ec.europa.eu/newsroom/dae/document.cfm?doc_id=15268

eGovernment Benchmark 2017
21
their own data; enable users to monitor administrative processes that involve them; engage with and open up to stakeholders (such as businesses, re-searchers and non-profit organisations) in the design and delivery of services.
Cross-border by default: ■ Public administrations should make
relevant digital public services avail-able across borders and prevent fur-ther fragmentation to arise, thereby facilitating mobility within the Single Market.
Interoperability by default: ■ Public services should be designed
to work seamlessly across the Single Market and across organisational silos, relying on the free movement of data and digital services in the European Union.
Trustworthiness & Security: ■ All initiatives should go beyond the
mere compliance with the legal frame-work on personal data protection and privacy, and IT security, by integrating
those elements in the design phase. These are important pre-conditions for increasing trust in and take-up of digital services.
2.2. The eGovernment Benchmark methodThis section shortly describes what is measured and how. The extensive Method5
Paper provides all details.
2.2.1. The measurement framework: four top-level benchmarks
As depicted above, the framework update ensures a more adequate measurement of progress in the main priority areas, in line with the new eGovernment Action Plan: modernisation of public administra-tions, Cross-border Mobility, and facilitation of digital interactions between citizens and administrations. The progress in these areas is measured via top-level benchmarks, which are comprised of multiple sub-indicators.
eGovernment Action Plan2016-2020
Key digital enablers & facilitators
Enabling cross-border mobilty
with digitalpublic services
Facilitating digitalinteraction
betweenadministrations andcitizens/businesses
Modernisingpublic
administrationwith ICT
5 For the latest version please see: http://ec.europa.eu/newsroom/dae/document.cfm?action=display&doc_id=17858
Figure 1: eGovernment Action Plan 2016-2020

22
As in previous editions, following four top-level benchmarks represented the focus of 2016 benchmark:
■ User-centric Government (or User Centricity) – as measured through Mystery Shopping. This top-level benchmark assesses the availability and usability of public eServices and examines awareness and barriers to use. It is connected to the first pillar of public administration modernisa-tion. In 2016, mobile friendliness of both individual services’ websites as well as generic portals is integrated as indicator into the computation of the user-centricity benchmark.
■ Transparent Government (or Trans-parency). This top-level benchmark evaluates the transparency of govern-ment authorities’ operations, service delivery procedures as well as with regard to the consultation of personal data by public administrations. This is related to the first pillar of public administration modernisation.
■ Cross-border Mobility. This top-level benchmark is constituted by the measurement of Citizen Mobility and Business Mobility. The benchmark measures the availability and usability of cross border services. This is con-nected to the second pillar of Cross-border Mobility.
■ Key Enablers. This top-level bench-mark assesses the availability of Key Enablers such as electronic Identifica-tion (eID), electronic Documents, Au-thentic Sources as well as Digital Post (newly introduced this year). Another novelty in the present benchmarking exercise is the assessment of the use of Key Enablers in cross-border public services. Key Enablers represent the foundation for all priority areas.
The measurement on each of the top-level benchmarks is undertaken via a number of questions that deal with the quality and quantity of eGovernment services in the 2016 life events. The next
section elaborates on the data collection methodology.
2.2.2. Updates in the method of the eGovernment Benchmark 2016The method for the current benchmarking exercise was updated in early 2016, in line with the priorities of the new eGovern-ment Action Plan. In this context, following additions were made:
■ The introduction of a new life event addressing Family Life that includes services that are typical for young families, such as: marriage (or other partnerships), birth and related (finan-cial) rights, renovating a house, and also looking forward to your financial situation at a later age.;
■ The evaluation of availability of Key Enablers (eID and eDocuments) in cross-border public service provi-sion as well as assessment of the use for a new Key Enabler – Digital Post;
■ The introduction of new questions on Transparency with regard to person-al data, complementing the existing questions on the indicator Transparent Government.
Figure 2, presents an overview of the method update, in line with the priorities of the eGovernment Action Plan 2016-2020.
2

23
eGovernment Benchmark 2016
2.2.3. Method of data collection
The method most used in the bench-mark exercise is Mystery Shopping.
A Mystery Shopper is trained and briefed to observe, experience, and measure a given public service process. Mystery Shoppers act as prospective users and follow a detailed, objective evaluation checklist. Mystery Shopping was the method of choice for the assessment of all top-level benchmarks under review this year.Besides Mystery Shopping, the assessment of ‘Mobile Friendliness’ is being conducted automatically, by using an online and open tool through which the complete sample (of approximately 2500 URLs) is evaluated.
Figure 2: Overview of Action Plan Principles and benchmark method update
Action plan principle Method update
Facilitating digital interaction with citizens – digital by default, once-only, transparency by default, and cross-border by default.
New life event on ‘Family life’ that will be assessed for the top-level benchmarks on user centricity, transparency, cross-border mobility and key enablers.
Facilitating digital interaction with citizens – user centricity
Include indicator ‘Mobile friendliness’ in user centricity benchmark
Facilitating digital interaction with citizens - inclusive by default
Landscape development around Citizen Access Points
Modernising public administrations - Privacy & data protection
Include question that assesses whether citizens can monitor who consulted their personal data and for what purpose
Enabling cross-border mobility - key digital enablers, and cross-border by default
Expand assessment of availability of eID and eDocuments in cross-border services
Key digital enablersExpand eID assessment and include a new enabler ‘Digital Post’
Key digital enablers, once-only, and cross-border by default
Expand qualitative landscaping on (use of) the key enabler Authentic sources

24
The Mystery Shopping exercise at a glance:
■ Mystery Shoppers are users of government services themselves, which provides a certain level of validity and involvement into the measurement: how they experience the eGovernment services is a valid real-life user experience.
■ All Mystery Shoppers are briefed and clearly instructed in order to minimise subjectivity. One way of do-ing this is to provide them with persona descriptions that provide them guidance when performing the assessment.
■ In principle, every country is evaluated by two Mystery Shoppers and their results are compared. Any in-consistencies are re-evaluated by the research team in order to achieve a high level of reliability. For Cross Border Mobility, all participation countries are assessed by two Mystery Shoppers from another country.
■ Every Mystery Shopper is a country national owning a national eID (if any).
■ The Mystery Shopper’s ‘journey’ is time-boxed, i.e. each Mystery Shopper has limited time to assess one life event. This implies that when a particular feature could not be found within reasonable time, it is an-swered negatively. This does not mean per se that the particular feature is not available online – it means that it apparently was too difficult to find intuitively, or with too many clicks. This makes it very likely that regular citizens or entrepreneurs will not use it, nor will they find it.
■ After completion of the Mystery Shopping exercise, results are sent for validation to the Member States. This is an intense collaborative process with participating countries representatives. Member States are included at the start and at the end of the evaluation: at the start in order to validate the sample and key characteristics of the services under assessment; at the end to validate the research results in collabora-tion with the responsible organisations in a country and correct potential obvious erroneous findings.
eGovernment Benchmark 2017
25
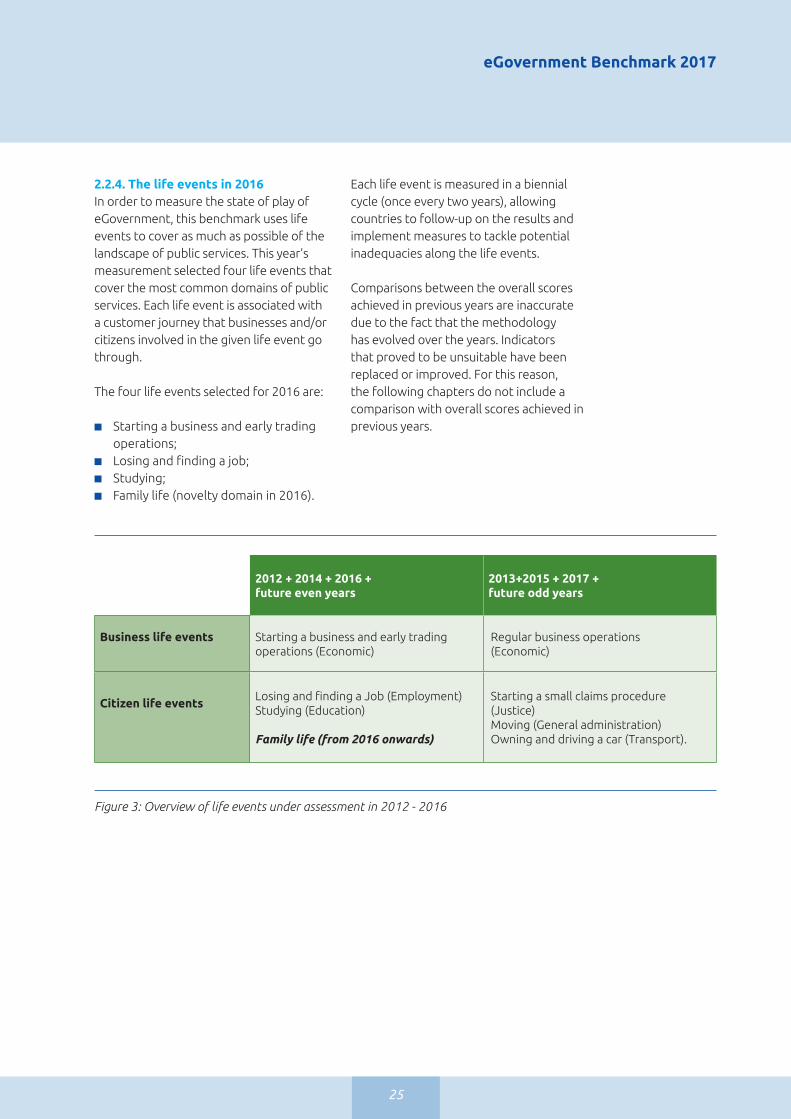
2.2.4. The life events in 2016In order to measure the state of play of eGovernment, this benchmark uses life events to cover as much as possible of the landscape of public services. This year’s measurement selected four life events that cover the most common domains of public services. Each life event is associated with a customer journey that businesses and/or citizens involved in the given life event go through.
The four life events selected for 2016 are:
■ Starting a business and early trading operations;
■ Losing and finding a job;■ Studying;■ Family life (novelty domain in 2016).
Each life event is measured in a biennial cycle (once every two years), allowing countries to follow-up on the results and implement measures to tackle potential inadequacies along the life events.
Comparisons between the overall scores achieved in previous years are inaccurate due to the fact that the methodology has evolved over the years. Indicators that proved to be unsuitable have been replaced or improved. For this reason, the following chapters do not include a comparison with overall scores achieved in previous years.
Figure 3: Overview of life events under assessment in 2012 - 2016
2012 + 2014 + 2016 + future even years
2013+2015 + 2017 + future odd years
Business life events Starting a business and early trading operations (Economic)
Regular business operations (Economic)
Citizen life eventsLosing and finding a Job (Employment)Studying (Education)
Family life (from 2016 onwards)
Starting a small claims procedure (Justice)Moving (General administration)Owning and driving a car (Transport).

26

eGovernment Benchmark 2017
27
Part one: A bird’s eye view on eGovernment progress in Europe

28
Synthesis of top-level benchmarks
3
3.1. Overview of results for the top-level benchmarksWhen looking at the scores on the four top-level benchmarks: User Centricity, Transparency, Cross-border Mobility and Key Enablers, the landscape shows mixed results. Whereas Europe scores on aver-age well with regard to user-centricity, the average scores achieved on the other three dimensions leave more room for im-provement. In particular, steps could still be taken in exploiting the potential of Key Enablers in public service provision.
Figure 4 provides an overview of the 2016 results, calculated as averaged scores across the four life events.
Key Insights
■ European governments reach the average of 80% for User Centricity in 2016. More interaction and feedback possibilities between citizens and public administrations are now available across Europe.
■ European public administrations are providing more services online in 2016 reaching the 82%.
■ On average, one in two public websites is mobile-friendly (54%). ■ The business life event is most advanced compared to other life events.■ The services related to Family Life could be improved mostly (likely as result of more
local service deliver this life event scores lower).■ Transparency does not appear to be a ‘by-default principle’ in public service provision
across Europe. The idea of transparent Government is yet to materialise, as the Transparency benchmark only reached moderate scores in service delivery (50%) and personal data (53%).
■ Cross-border Mobility increased modestly, though the implementation of the eIDAS directive could be an accelerator for cross-border services in the coming years.
■ The take-up of Key Enablers continues to show sluggish progress, making this a key areas for public entities to focus on if they want to fully exploit the opportunities of ‘digital’.
This chapter presents the synthesis of the top-level bench-mark results and analyses the progress made by public ad-ministrations across Europe. Where applicable, it highlights the room for improvement for each of the benchmarks and life events. Given the newly introduced domain around Family life, no comparison to previous results can be drawn in this regard. The section is structured as follows: Chapter 3.1 presents the current state-of-play of eGovernment in Europe from a top-level perspective. The top-level bench-marks are presented in more detail in section 3.2. (User Centricity), 3.3. (Transparency), 3.4. (Usability of services) and 3.5. (Key Enablers). Finally, section 3.6 presents the main findings on eGovernment progress across Europe.

eGovernment Benchmark 2017
29
When looking at the top-level benchmark 2016 results from a high-level perspec-tive, European public administrations are developing into more user-centric governments, reaching an average score of 80%. The usability of services is now peaking at 89%, whereas online avail-ability of services scored 82%. When comparing the scores in the three life events measured in both 2014 and 2016 (Business, Job and Studying) in terms of usability of service, European public services have made a leap to 90% in 2016 (calculated as average of the three domains measured both in 2014 and 2016: Business, Job and Studying), from an initial 85% in 2014. In comparison to the online availability and usability of services, the mobile friendliness indica-tor is still lagging behind, with an overall score of only 54% in 2016. Although still relatively low, European public adminis-trations seem to be responding, albeit rather slowly, to the increased demand for mobile accessible services by the cus-tomers, as ‘mobile’ has been establishing
itself as preferred access channel for Internet users.
In terms of the top-level benchmark for the Single Market – Cross-border Mobility (consisting of Business mobility and Citizen Mobility), almost 2 out of 3 European pub-lic services are accessible and user-friendly across borders (63%). Being the cross-border equivalent of the User Centricity benchmark, this benchmark analyses both the Online Availability and Usability of public services for users of cross-border services. The score on this benchmark is calculated as an average of the results on Citizen Mobility measured by the cross-border dimension of services in life event Studying and Business Mobility measured within the cross-border dimension of ser-vices in life event Business.The 2016 results still depict a slight differ-ence between the level of Cross-border Mobility for citizens (61%) and the degree to which Cross-border Mobility is enabled by public services for businesses (65%). Both cross-border services aimed at
6 The2016lifeeventsare:Startingabusinessandearlytradingoperations(businesslifeevent),Losingandfindingajob,Studying, and Family life (citizen life events).
Figure 4: Average scores for the top-level benchmarks across the 2016 life events6 (EU28+, %)
80
59
63
52
User centricity
Transparency
Cross-border Mobility
Key Enablers
Overview (spider): results for the top-level benchmarks EU28+ for 2016

30
3
7 The results are calculated as average of the scores registered on the four top-level benchmark (User Centricity, Transpa-rency, Mobility, Key Enablers) within each of the four life events measured in 2016. The life events ‘Losing and Finding a Job’ and ‘Family Life’ do not have a Cross-border Mobility dimension.
citizens and businesses have made pro-gress in terms of online availability in 2016 compared to 2014, scoring 74% (+14 points) and 73% (+9 points) respectively. In terms of their usability, a similar progress can be outlined with regard to the cross-border services for citizens. The services on this dimension enjoyed a degree of usability of 76% (+7 points) in 2016. When looking at the cross-border services aimed at citizens, European administrations have indeed made significant progress compared to 2014, with a frog-leap of 14 points on the online availability aspect and an increase of 7 points on the usability dimension. This reinforces the belief that European public services are bringing their contribution to accomplishing the Digital Single Market vision by 2020.
However, the availability of Key Enablers such as eID and eDocuments in cross-bor-der services – measured for the first time in 2016 – is quite low. On the adoption of the eID in cross-border service provision, a 14% availability for citizens and a 29% availability for businesses were registered in 2016. Slightly more optimistic is the adoption of eDocuments in cross-border service provision, with 24% availability for citizen services and 43% availability for businesses.
Modest scores were registered with regard to the top-level benchmark Transparency, in particular on the service delivery and personal information dimensions. With an overall score of 59%, the idea of develop-ing transparent governments is developing relatively slow across Europe. Although it scores high in terms of transparency of public organisations (73%), the transpar-ency of service delivery and personal data reached only modest scores, of 50% and respectively 53%. In this regard, Europe needs to speed up its efforts in order to ensure that modernisation of public ser-
vice provision – in particular online avail-ability and usability of services – does not come to the detriment of the Transparen-cy dimension. When designing a compre-hensive vision of public service modernisa-tion, the Transparency dimension should be considered from early stages on. Online services for citizens all over Europe should have transparency as a ‘by-default’ feature.
The uptake of Key Enablers is another area that appears to have been neglected in 2016. The scores of 2016 only reached 52%. The drawback is mainly attributed to the newly introduced life event Family Life and the measurement of the use of Key Enablers in this domain. The domain has scored poorly in 2016, with an overall availability of eID, eDocuments, Authentic Sources and Digital Post at 37% levels. Building on the previous remark on trans-parency, Europe seems to be missing a few opportunities to improve the quality of its services – in particular in terms of enhanc-ing its user experience by boosting the use of Key Enablers – and with regard to Transparency in Service Delivery.
When reviewing the life events from the same high-level perspective, the life event Business (69%) was the top performer in 2016, followed by Losing and finding a job (66%), and Studying (64%). In this light, Eu-rope appears to be focusing on its services for businesses, and could be doing more for citizens.
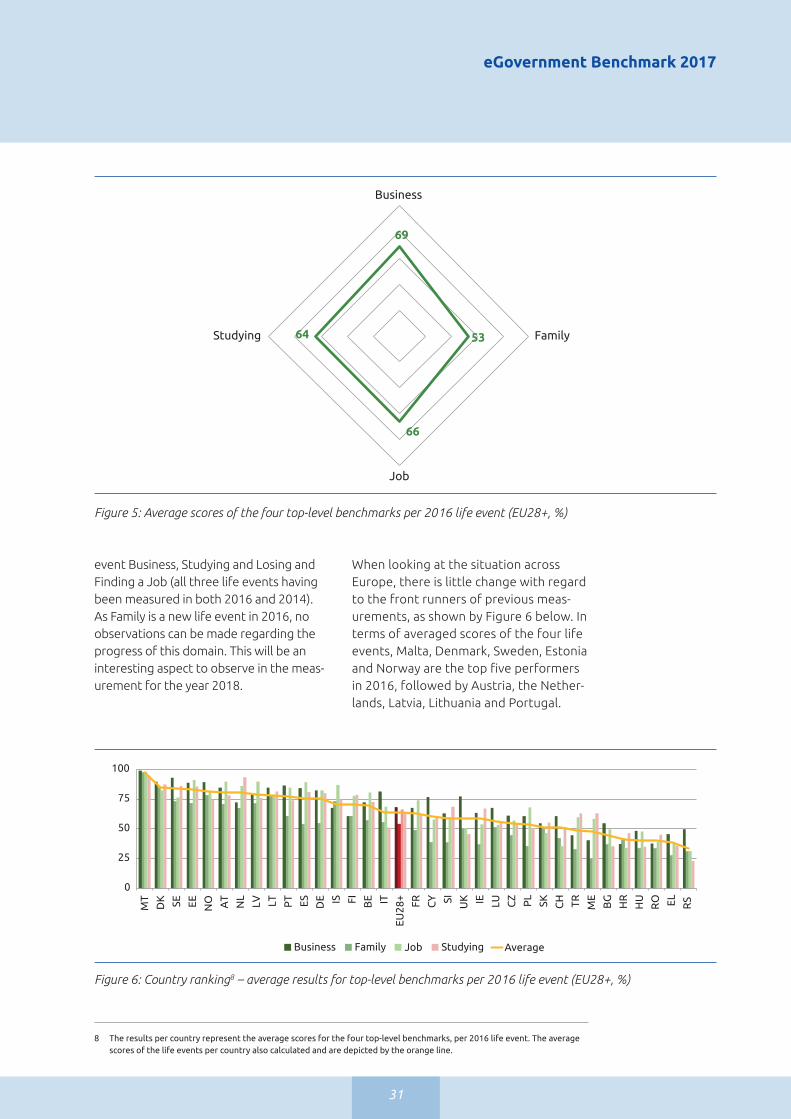
Figure 5 depicts the results at aggregate level per domain, across the four top-level benchmarks in Europe7.
The scores in the life events Starting a Busi-ness, Studying as well as Losing and Finding a Job have registered a mild improvement in comparison to the 2014 measurement, with increases of 5 percentage points in terms of online availability of services in the life
eGovernment Benchmark 2017
31
event Business, Studying and Losing and Finding a Job (all three life events having been measured in both 2016 and 2014). As Family is a new life event in 2016, no observations can be made regarding the progress of this domain. This will be an interesting aspect to observe in the meas-urement for the year 2018.
Figure 5: Average scores of the four top-level benchmarks per 2016 life event (EU28+, %)
69
53
66
64
Business
Family
Job
Studying
Overview (spider): Aggregated EU28+ results per life event (an overall score per life event; average of 4 top level benchmarks); for the 2016 life events
0
25
50
75
100
MT
DK SE EE NO AT
NL
LV LT PT ES DE IS FI BE IT
EU28
+
FR CY SI UK IE LU CZ PL
SK CH TR ME
BG
HR
HU
RO EL RS
Overview: overall country ranking, averaging results obtained in each top level benchmark in each 2016 lifeevent (equally weighing the 4 top level benchmarks)
Business Job Studying Average Family
Figure 6: Country ranking8 – average results for top-level benchmarks per 2016 life event (EU28+, %)
8 The results per country represent the average scores for the four top-level benchmarks, per 2016 life event. The average scores of the life events per country also calculated and are depicted by the orange line.
When looking at the situation across Europe, there is little change with regard to the front runners of previous meas-urements, as shown by Figure 6 below. In terms of averaged scores of the four life events, Malta, Denmark, Sweden, Estonia and Norway are the top five performers in 2016, followed by Austria, the Nether-lands, Latvia, Lithuania and Portugal.

32
3
Country perspectivesWhen looking at the results along the four life events within the national context, countries seem to have set different focus points in their modernisation of service provision: Netherlands seems to have set a stronger focus on services targeted at job seekers and students, whereas Sweden and Norway are more strongly targeting business customers.Austria and Portugal depict a higher emphasis on catering to the needs of job seek-ers as well as businesses. At the same time, Iceland, France and Poland have set a strong focus on enabling modernisation of services of jobseekers. Croatia, Ireland and Slovenia are performing well in terms of public services for students.Cyprus, Italy, Serbia as well as the UK have a more developed service provision in the life event Business, compared to the other three life events. The majority of countries registered good results in the life events Business, Job and Studying, whereas Family Life seems to be overall the neglected area in Europe. Despite the modest results, Romania appears to be devoting equal attention to all four life events.
Given the method update undertaken for the 2016 exercise in order to better fit the objectives of the new eGovernment Action Plan, only limited comparisons between the 2016 and the 2014 measure-ments could be drawn. The next section takes a closer look at the results in each of the 2016 life events and assesses – where applicable – the progress made on each top-level benchmark: User Centricity, Transparency, Cross-border Mobility, and Key Enablers.
3.2. User Centricity The eGovernment benchmark acknowl-edges the importance of providing digital public services that are user-centric and, equally important, needs-based. With the top-level benchmark User Centricity, the eGovernment exercise measures the ex-tent to which public services meet users’ expectations across Europe. The eGovern-ment assessment takes a closer look at the supply-side and analyses the extent to which Government services are available
online, their usability (the extent to which support, help and feedback functionalities are available online) as well as their mobile friendliness. The present section tackles the dimensions of online availability and mobile friendliness and elaborates on the scores in these two indicators.
When looking at the extent to which Euro-pean public services are available online, the 2016 results show the newly intro-duced life event Family scoring the lowest on the online availability dimension, with only 71%. This life event gains terrain on the mobile friendliness side, with the highest score among the four life events (60%). The results on the User Centricity dimensions, comprising online availability of services, usability, and mobile friendli-ness are highlighted in Figure 7.

eGovernment Benchmark 2017
33
Encouraging enough, at least half of the public services available online in each life event are mobile-friendly. Interesting is also the fact that mobile-friendliness of public services targeted at businesses scores the lowest, with only 51%. This is an important insight to take note of, since providing services for businesses that can be accessed from anywhere (any device), any time, is an important element towards increasing Europe’s attractiveness as location to invest and conduct business in. Mobile-friendly services increase op-portunities to easily look up information and possibly even apply for services on moments that are most convenient for the entrepreneur. This helps achieve cost and efficiency gains on the entrepreneur’s side. It contributes to flexibility and allows the user (in this case the entrepreneur) to focus his/her resources on the business operations rather than on dealing with public service interactions. In the light of the general trend of ‘mobile’ becoming the preferred Internet access channel for users across Europe and the world, this dimension would need to be stronger prioritised by European governments.
3.2.1. Online availability of services
Whereas the previous sections have dealt with the extent to which services are avail-able in the four life events, the following section will focus on the way in which these services are made available online across Europe, along the four life events.
For the purpose of the benchmarking exercise, following categories of services were identified: ■ Automated services (dark green)■ Fully online services, accessible via a
portal (medium green), or not via a por-tal (light blue)
■ Information online, accessible via a por-tal (yellow), or not via a portal (orange)
■ Not provided online (red)
Figure 8 presents the country overview, with the average in Europe depicted by the top bar. The figure reveals the scores in each category of the above-mentioned services. In 2016, 67% of eGovernment services were offered fully online, combin-ing automated service (4%, dark green bar), service online and through portal (62%, light green bar) and service online but not through portal (1%, blue bar). Although the services were not entirely online, citizens were able to access information regarding the services via the Internet (32%), of which 27% through a portal (yellow bar) and 5% through the webpages of the respective
Figure 7: User Centricity per 2016 life event – average country results (EU28+, %)
User centricity: bar chart showing online availability, usability and mobile friendliness scores for each life event 2016 (EU28+ average)
Online Availability Usability Mobile Friendliness
Business Family Job Studying
100
50
75
25
0

34
3
0% 10% 20% 30% 40% 50% 60% 70% 80% 90% 100%
RO HR RS EL ME SK LU HU CY CH BG PL CZ SI
UK TR
IT NL DE BE IS
FR FI IE
ES SE LV EE LT AT
NO DK PT MT
EU-28+
How services are made available by country (across life events, 2016, %)
Automated service
Service online and through portal Offline
Service online but not through portal Information online but not through portal
Information online and through portal
Figure 8: Availability of services per country, average of results of 2016 life events (EU28+, %)
public administrations (orange bar). The most noticeable progress was made on information that was only available ‘offline’, which dropped to 1% in 2016 (red bar). In the same lines as the previous eGovernment benchmark assessments, the share of ser-vices that are offered via portal (depicted by the light green and yellow bars) continues to follow an upward trend and reaches 89% in 2016.
When looking at the progress made by the individual countries, Malta and Portugal lead in the ranking, with nearly all of their eGovernment services being either auto-mated or fully online.
In terms of services that are still offline, countries such as Latvia, Sweden, France,
the Netherlands, Italy, Cyprus and Switzer-land as well as Bulgaria, Greece, Hungary and the Republic of Serbia have now joined Austria, Malta, Norway, Ireland, Lithuania and Estonia as they have no public services offline anymore. The efforts of Hungary which moved from 25% offline services last year to 0% this year are especially worth highlighting.
Overall, the development in terms of digi-talisation of public service provision across Europe continues to be gradual, with the ser-vices that were offline in the last assessment now becoming available online, which in a next step are becoming available via a portal.
In terms of online availability of services at national, regional and local government

eGovernment Benchmark 2017
35
0
25
50
75
100
User centricity: bar chart showing how public services are made available online by central,regional and local public authorities (for the EU28+ and each MS, %)
National Regional Local Average
MT
NO DK LT PT IE DE SE IS FI LV AT
NL
FR BE
EU28
+
HU
CH ES EE CZ
UK LU BG PL
CY SI EL TR IT SK RO RS
HR
ME
Figure 9: Availability of public services at central, regional and local level across EU28+ (2016, %)
levels, the depiction of eGovernment across Europe becomes more nuanced (see Figure 9 below). Important to note in this context is that the sample of local services in some countries is very small. More, the newly in-troduced Family life event might also influ-ence the overall scores quite heavily, given the overall lower online availability scores of this life event, compared to the other three domains of 2016.
The percentage of services available online at regional level slightly surpasses the one at national level (66% vs. 65%) – an interest-ing observation that could be explained by an equally strong – both politically and financially – regional level that is pushing forward the development of eGovernment. Lagging behind is the local level with an EU average under 50%. In this context, it is worth highlighting that the respective administrative structure of countries also in-fluence the degree to which eGovernment services are more strongly developed at the regional and/ or local levels.
When looking at the individual countries, there appears to be some exceptions from the overall trend in Europe with Norway and Lithuania showing strong eGovernment service provision at local level, where all of their public services are made available
online. In this regard, Serbia as well shows good results with 45% of its local eGovern-ment services available online, compared to the 20% registered at national level. With regard to the regional government, Ireland and Denmark lead by example with all of their regional eGovernment services available online. Hungary as well as Slovenia show good results on this dimension, reach-ing 75%.
Overall significant differences in scores can be noticed between the three administra-tive levels. Strong local level service provi-sion is registered in Norway and Lithuania, where maximum scores are reached at this level. Maximum scores at the regional ser-vice provision are registered for Denmark and Ireland.
Whereas online availability of services is an important indicator of the extent to which public service provision across Europe is becoming more user-centric, this indica-tor only captures one dimension of the ‘User Centricity’ top-level benchmark. The following section will dive into the second indicator and analyse the usability of the eGovernment services across Europe.
3.2.2. Usability of services With regard to the usability of services

36
3
96
82
99 99
87 85
74
0
25
50
75
100
FAQ Demo/live chat
Contactdetails
Multi-channel
Feedback Discussionfora
Complaintprocedures
User centricity: bar chart to report out per question asked for Usability(EU28+, average all life events, %)
Figure 10: Interaction options with public administration, average of 2016 life events (EU28+, %)
and in particular to the interaction pos-sibilities between customers and public service providers, countries across Europe show good to excellent results on average on the four life events. European public administrations seem to have recognised the salience of providing interaction pos-sibilities with their customers and have made efforts towards this end, as Figure 10 exhibits.
Overall, very good results have been reg-istered on all indicators here, in particular with regard to the multi-channel contact options, the provision of contact details, as well as the online availability of FAQs which are almost reaching maximum scores. Slightly lagging behind is the real-time service assistance, with an average of 82% of public services providing this kind of user support. A bit concerning is the score of the indicator Complaint procedures, with only reaches 74%. This appears to be a neglected area, despite the importance of this feedback channel.
In this light, the possibility of interactions between citizens and public administra-tions are developing nicely, here as well some efforts need to be made to ensure the highest degree possible of interaction
is achieved. In this regard, the possibility for customers to file a complaint most defi-nitely needs to be enhanced. This bench-mark dimension is pivotal to measuring progress on the third pillar of the eGovern-ment Action Plan 2016-2020 dealing with the digital interactions towards designing and delivering public services.
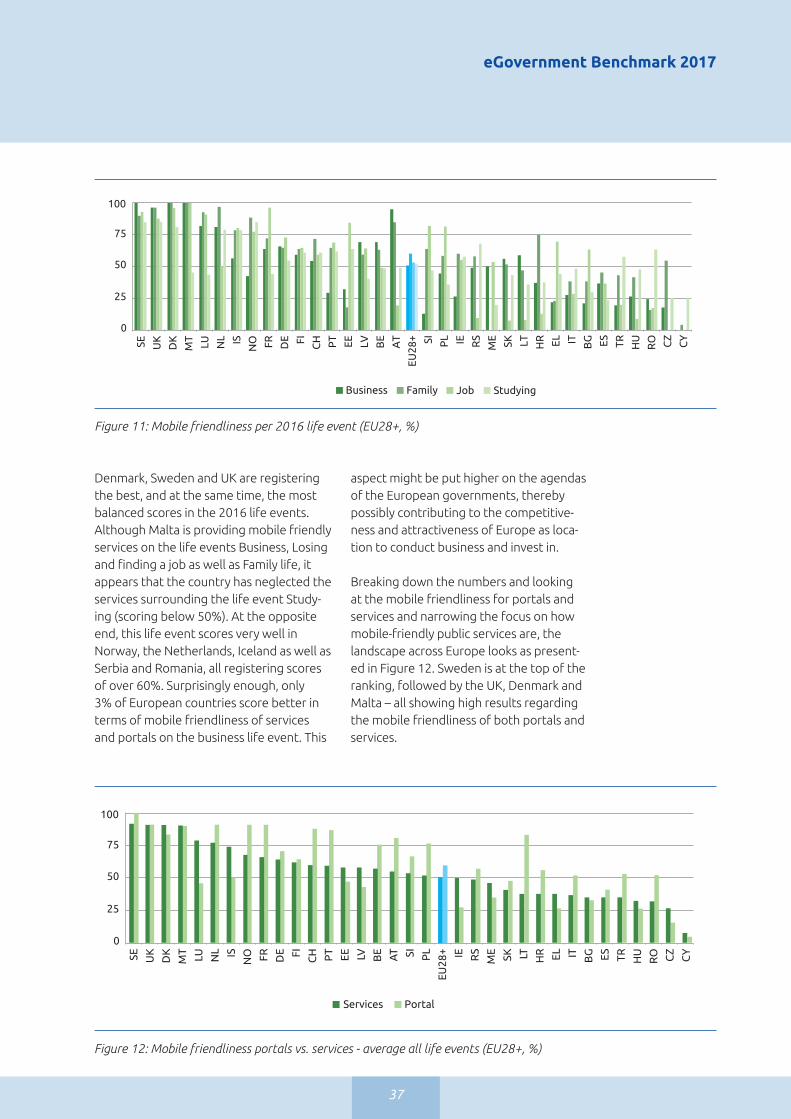
3.2.3. Mobile friendliness of services per life eventWith an increasing use of mobile devices to access online information and to make online transactions, public administrations also need to provide services that are ac-cessible online and from any end device. Figure 11 illustrates the progress made across Europe with regard to the mobile friendliness of portals and services on each of the four life events.
On average, the eGovernment services seem to show significant room for im-provement, since none of the life event scores of the EU 28+ exceed 60%. In this regard, the countries need to step up and provide services that keep up the pace with current trends (i.e. mobile access), as more and more users expect to be able to access public services anytime and from the device of their choice. In this context,
eGovernment Benchmark 2017
37
User centricity: bar chart showing mobile friendliness per life event
0
25
50
75
100
Business Job Family Studying
SE UK
DK
MT
LU NL IS
NO FR DE FI CH PT EE LV BE
AT
EU28
+ SI PL IE RS
ME
SK LT HR EL IT BG ES TR HU
RO CZ
CY
Figure 11: Mobile friendliness per 2016 life event (EU28+, %)
Denmark, Sweden and UK are registering the best, and at the same time, the most balanced scores in the 2016 life events. Although Malta is providing mobile friendly services on the life events Business, Losing and finding a job as well as Family life, it appears that the country has neglected the services surrounding the life event Study-ing (scoring below 50%). At the opposite end, this life event scores very well in Norway, the Netherlands, Iceland as well as Serbia and Romania, all registering scores of over 60%. Surprisingly enough, only 3% of European countries score better in terms of mobile friendliness of services and portals on the business life event. This
aspect might be put higher on the agendas of the European governments, thereby possibly contributing to the competitive-ness and attractiveness of Europe as loca-tion to conduct business and invest in.
Breaking down the numbers and looking at the mobile friendliness for portals and services and narrowing the focus on how mobile-friendly public services are, the landscape across Europe looks as present-ed in Figure 12. Sweden is at the top of the ranking, followed by the UK, Denmark and Malta – all showing high results regarding the mobile friendliness of both portals and services.
0
25
50
75
100
Services Portal
SE UK
DK
MT
LU NL IS
NO FR DE FI CH PT
EE LV BE
AT SI PL
EU28
+ IE RS
ME
SK LT HR EL IT BG ES TR HU
RO CZ
CY
Figure 12: Mobile friendliness portals vs. services - average all life events (EU28+, %)

38
3
Sweden (91%), the UK (91%), Denmark (90%), Malta (90%), Luxembourg (79%) as well as the Netherlands (77%) reg-istered very good scores in terms of mobile friendliness of services, , followed by Iceland (74%), Norway (68%), France (66%), Germany (64%) and Finland (62%). On the portal dimension, Sweden reaches maximum points, followed by Norway (91%), France (91%), the UK( 90%), Neth-erlands (90%), Malta (89%), Switzerland (88%), Portugal (86%), Denmark(83%) and Lithuania (83%). When looking at the degree of balance between the mobile friendliness of both dimensions, Lithu-ania, Luxembourg, Switzerland, Portugal, Austria, France and Poland show the high-est discrepancies. Lithuania represents the most blatant example, with a mobile friendliness of its services reaching 38% and a mobile friendliness of its portals reaching 83%. For Lithuania, Switzerland, Portugal, Austria, France and Poland the mobile friendliness of portals is far more developed than the mobile friendliness of services. Au contraire, in Luxembourg the scale tips heavier towards the mobile friendliness of services, rather than por-tals. Overall the European average is quite modest, at 51% on the services and 60% on the portal dimension.
Overall, when looking at the scores in the three indicators of the User Centricity benchmark – online availability, usability of services and mobile friendliness – presented above, Europe seems to be moving in the middle-upper segment in terms of its user centricity. This rep-resents a good base, which the actions under the new eGovernment Action Plan can build on in the coming years. Without a doubt, there is still room for improve-ment, especially with regard to the online availability and mobile friendliness of ser-vices. However, progress has been made in the majority of Europe. This can only strengthen the belief that the European countries are on the right track to achiev-ing the vision of a ‘user-centric’ Europe.
3.2.4. Mandatory online servicesThe eGovernment benchmark also landscapes the extent to which countries make it mandatory for users to use the online channel for public services. This ele-ment is NOT part of the above indicators on user centricity or online availability. The data reveals that there are 14 coun-tries that have made at least one service mandatory online in one of the life events under assessment this year. It appears that making the online channel manda-tory is more common for businesses and students, segments that can be assumed to be more digital savvy, and is less practiced for services in the life events of Losing and Finding a Job and Family life.

eGovernment Benchmark 2017
39
0%
10%
20%
30%
40%
50%
60%
70%
80%
90%
100%
Each dot represents a country, only countries that score >0 are presented
0 1 2 3 4 5 6
Man
dat
ory
on
line
serv
ices
(%
of
rele
van
t se
rvic
es)
Composite 4life events
BusinessStart-up
Family Losing andfinding a job
Studying
Figure 13: Overview of the extent to which countries have made services mandatory online

40
3
Good practice 1. Portugal: open user experience guidelines
Portugal – Usability Portal
User experience guidelines and resources for improved usability in public sites
What is it?A public initiative (and a website) that makes available a set of resources and tools to build public sites according to good user experience and usability principles. The site provides both a theoretical guide and an open html framework which can be reused by different public organizations (or any other interested party).
The initiative has defined a series of standards and approaches which will be included on the future development of public sites carried out by AMA and are encouraged to be (re)used by the all of the Portuguese Public Administration.
The template is open to collaboration and expected to act as a basis for future development and adjustments, when needed, provided that it is done in an open and collaborative basis (via a github page).
What are the benefits? ■ Improvement of user experience■ Open Source and collaborative■ Fostering of a user centric approach■ Guidelines for PA services websites■ Promotion of one front-end public administration to citizens
What are the key success factors?■ Adoption of the template by different organizations;■ Add-ons and further coding to the templates and components by
collaborating in an open manner;■ Best practice guide downloads.
eGovernment Benchmark 2017
41
Good practice 2. Belgium: Life event scans
Belgium (Flanders) – Life event scans
Looking at government service delivery starting from the real needs of the citizens
What is it?The “life event scan” is an innovative methodology that systematically screens all the possible interactions that a user has with the government in a certain life situa-tion. The approach is based on three pillars: user needs, process simplification and screening of regulations. The life event scan provides insights in how the services are experienced from the perspective of the end user. This results in very concrete recommendations to organise government services in accordance with life events where the user is the true focus of attention and a reduction of the amount of wasted time, extra expenses and irritation among citizens, businesses and organisations.
What are the benefits? ■ Higher satisfaction achieved by the users■ Radical simplification of existing processes■ Involvement of different levels of government
What are the key success factors?■ Inclusion of all relevant live events■ Sufficient uptake of recommendations
Source: https://overheid.vlaanderen.be/life-event-scan The results of this novel approach will be used in the design of the future Flemish Citizen portal https://overheid.vlaanderen.be/producten-diensten/burgerloket
42
3
Good practice 3. Slovenia: state portal eUprava
Slovenia – state portal eUprava (Slovenian eGoverment)
Portal eUprava is the main point for e-services for citizens.
What is it?The state portal eUprava (eGovernment) enables business between the state and its citizens by providing a main point for e-services. On the one hand, it lowers operating costs of public authorities which provide their services in one place. On the other hand, it is a major contribution to citizens, who do not need to look for services on various websites of public authorities. They can read all the information or submit electronic applications on one portal. To reach all citizens, the portal is adapted for people with special needs, such as blind and partially slighted users, users with dyslexia and people with hearing problems. Furthermore, the portal is accessible by mobile devices, but the function to submit forms through mobile phones is still under development.
What are the benefits? ■ Shortened service production time■ Lover operational costs for authorities and citizens■ Efficiency, simplicity, user centricity, user satisfaction
What are the key success factors?■ Accessible to all citizens
In the following section, the second top-level benchmark Transparency will be analysed in more detail.
3.3. Transparency Enhancing transparency of data and ser-vices between public administrations and their customers within and across borders is believed to boost efficiency, accountabil-ity and contributes to foster trust in public sector entities. This also goes in line with the increased demands and expectations of citizens and businesses across Europe who wish to understand how the services that they access operate, as well as be informed regarding processing times, per-sonal data consulted and processed, public administrations’ mission and achievements.
These aspects are assessed within the eGovernment benchmark exercise by ana-
lysing the following three Transparency indicators:1. Transparency of Service Delivery:
assesses the extent to which public administrations inform users about the administrative process they have entered, e.g. from the users’ request for a service until the service is deliv-ered. Being transparent in this context means that citizens and entrepreneurs can set expectations on time, process and delivery of the service. This allows them to plan their interactions with the government.
2. Transparency of Public Organisa-tions: assesses the extent to which governments publish information about themselves (e.g. finance, organisational structure and responsi-bilities), and about their activities (e.g. the decision-making process, regula-

eGovernment Benchmark 2017
43
tions, laws). It should enable users to anticipate and respond to Government decisions that affect them and hold policy makers responsible for their de-cisions and performance. It increases policy makers’ accountability and fiscal responsibility, and decreases the risk of fraud and corruption.
3. Transparency of Personal Data: assesses the extent to which govern-ments proactively inform users about their personal data and how, when, and by whom it is being processed. Citizens want easy electronic access to their personal data. It increases the legitimacy and security of data processing and it improves the quality and accuracy of the personal data stored. This in turn increases citizens’ trust in governments. Most national governments have legislation on how to deal with personal data in place and there has been an EU Directive since 1995 (the European Data Protection Directive 95/46/EC37) as well as the Directive (EU) 2016/6809 and Regula-tion (EU) 2016/679 with regard to the processing of personal data and the free movement of such data which entered into force in April 2016.
When looking at the progress made along the Transparency dimension, scores here slightly curb the enthusiasm triggered by the results of the 2014 measurement. Given the method update on the Transparency of Personal Data, no parallel can be drawn to the 2014 benchmark. The indicators Trans-parency of Public organisation and Transpar-ency of Service Delivery remain unaltered and can therefore be compared on the three life events: Business, Losing and Finding a Job, and Studying. In terms of public admin-
istration transparency – the extent to which government bodies provide contact details on websites – all three life events have made significant improvement, with the life event Business experiencing the highest increase of 8 points to 82% compared to 2014. The life events Job and Studying increased by 6 points, to reach 82% and 70% respectively in 2016.
With regard to the extent to which users are provided with information on delivery and processing times, the progress made compared to 2014 is slightly better, with an increase of 6 points for services for business-es (59% in 2016) and increases of 8 points for services for students (to 56% in 2016) and even 10 points for jobseekers (to 50% in 2016). However high the progress made in the three life events, the scores in this dimension still leave room for improvement. An extra boost on this dimension, in particular with regard to personal data (which only reached 53% in 2016) is expected to be given by the enforcement of the legal framework on data protection, with the adoption in early 2016 of Directive (EU) 2016/68010 and Regulation (EU) 2016/67911 on transparency of process-ing of personal data and free movement of such data. This will give the needed impulse for European governments and public administrations to enforce better practices when dealing with personal data. Indeed, it may be too early for any conclusions in this regard, as both the Directive and Regulation will only be binding from May 2018 on.
In light of the fact that the service delivery dimension is also showing modest scores, the benchmark of Transparency appears to continue to be a ‘work-in-progress area’ across Europe.
9 European Commission (2016), Directive (EU) 2016/680 of the European Parliament and of the Council. Available at: http://eur-lex.europa.eu/legal-content/EN/TXT/?uri=uriserv:OJ.L_.2016.119.01.0089.01.ENG&toc=OJ:L:2016:119:TOC 10 European Commission (2016), Directive (EU) 2016/680 of the European Parliament and of the Council. Available at: http://
eur-lex.europa.eu/legal-content/EN/TXT/?uri=uriserv:OJ.L_.2016.119.01.0089.01.ENG&toc=OJ:L:2016:119:TOC 11 European Commission (2016), Regulation (EU) 2016/679 of the European Parliament and of the Council of 27 April 2016
on the protection of natural persons with regard to the processing of personal data and on the free movement of such data, and repealing Directive 95/46/EC (General Data Protection Regulation). Available at: http://eur-lex.europa.eu/legal-content/EN/TXT/PDF/?uri=CELEX:32016R0679&from=EN

44
3
Figure 14: Scores in each Transparency indicator – average results of 2016 life events (EU28+, %)
Figure 15: Transparency of Service Delivery – average results of 2016 life events (EU28+, %)
50
73 53
Transparency: spider for each of the 3 transparency indicators (EU28+, %)
0
20
40
60
80
100Service delivery
Personal data Public organisation
When breaking-down the scores in the Transparency of Service Delivery dimen-sion, citizens seem to be able to monitor progress in only 50% of the cases. The possibility to save an online application as draft as well as the availability of informa-tion regarding the length of the process seem to be present in less than 50% of online services. Transparency in service delivery plays an important role for citizens and entrepreneurs in allowing time man-agement and planning of their interactions with government in due time. It appears
that this dimension as well shows room for improvement and needs to be put higher on the agendas of public administrations across Europe. An overview of the activi-ties assessed under this sub-indicator is presented in Figure 15 below.
Diving deeper into the Transparency of Personal Data, similar remarks can be made. While citizens are being noti-fied concerning incorrect data in 71% of the cases and are given the possibility to modify this data in 67% of the instances,
0
20
40
60
Deliverynotice
Trackprogress
Saveas draft
Lengthprocess
Deliverytimelines
Max. time limit
Serviceperformance
Transparency: bar chart to report out per question asked forservice delivery (EU28+, average all life events, %)
47 47
57
51
42
59
50

eGovernment Benchmark 2017
45
Figure 16: Transparency of Personal Data – average results of 2016 life events (EU28+, %)
0
20
40
60
80
Online access
Notification incorrect data
Modify data
Complaint procedure
Monitor who has consulted personal data
Transparency: bar chart to report out per question asked on personal data(EU28+, average all life events)
53
71 67
60
17
they can access their personal data online in only 53% of cases. Allowing user to access their personal data is an important aspect that plays into the discussion on creating leaner and more efficient public service provision. By enabling customers to update their personal data, the number of additional notifications on behalf of public administrations towards the service user could be avoided. Looking at the possibility to see who consulted their personal data, the first red flags can be raised here, as the scores are only reaching 17%. This is a worrisome observation since citizens seem to receive very little information on which bodies consulted and processed their data and the reasons why the information was accessed.
Within the Transparency benchmark four maturity stages are defined in a newly added question (overall score presented in fifth bar, to the right of figure 15):■ Maturity stage 0: it is not possible to
monitor who consulted your personal data and for what purpose.
■ Maturity stage 1: you can only monitor whether your data has been consulted.
■ Maturity stage 2: you can monitor whether and when your data has been consulted.
■ Maturity stage 3: you can monitor whether and when your data has been consulted and who has consulted the data.
■ Maturity stage 4: you can monitor whether and when your data has been consulted and who has consulted the data for what purpose.
Figure 17 shows for each life event the number of countries that reached matu-rity stage 0, 1, 2, 3, and 4. Zooming into the maturity levels across Europe per life event (see figure 16), we see that no country has yet reached maturity stage 4 in any of the life events. In the life events Business, Losing and finding a job and Family life only three countries can be categorised at stage 3. The vast major-ity of European countries are still in their incipient stages with the highest number of countries being at maturity stage 0. Slight fluctuations can be observed across the life events. It appears that this top-level benchmark has been neglected so far across Europe, with countries setting their focus on making services accessible to citizens online, rather than considering ‘transparency by default’ as one of the mandatory design principles of eGovern-ment.

46
3
Figure 17: Number of countries per stage of maturity for monitoring who has consulted personal data of the user (2016, EU28+, absolute numbers)
3 3 3 2 0
5
10
15
20
25
30
Business Start-Ups (2016) Family (2016) Losing and Finding a Job (2016) Studying (2016)
Transparency: D5: how many countries per stage
0 1 2 3 4
22
18
22
7
3 5
4 4 6
8 6
20
Against this backdrop, two directions come into closer consideration. On the one hand, public administrations that are at a high level of maturity with regard to online availability of government services need to undertake ‘transparency checks’ of their services and add the elements that enhance transparency to their ser-vices. On the other hand, public admin-istrations that are now in the process of designing digital services can use this ob-servation to their advantage and embed such transparency elements in the early stages of the service design and develop-ment processes.
On the same dimension, encouraging results are registered in terms of Trans-parency of Public Organisations. Here, high scores are observed on the informa-tion published by public administrations concerning their organisational structure, mission and responsibility, budget as well as legislation relevant to their field of activity. The level of transparency is however low in terms of the monitoring methods as well as mechanisms to assess users’ satisfaction. Given the salience of these factors towards enhancing digital interactions between citizens and govern-ments (Pillar III of the new eGovernment Action Plan), this dimension appears to represent a missed opportunity for public administrations. In this context, govern-ments across Europe could step up and undertake more measures to foster co-creation and participation of citizens in decision-making processes that directly impact them.
Figure 18 depicts the level of transpar-ency of public administrations on the 14 categories analysed by this indicator.
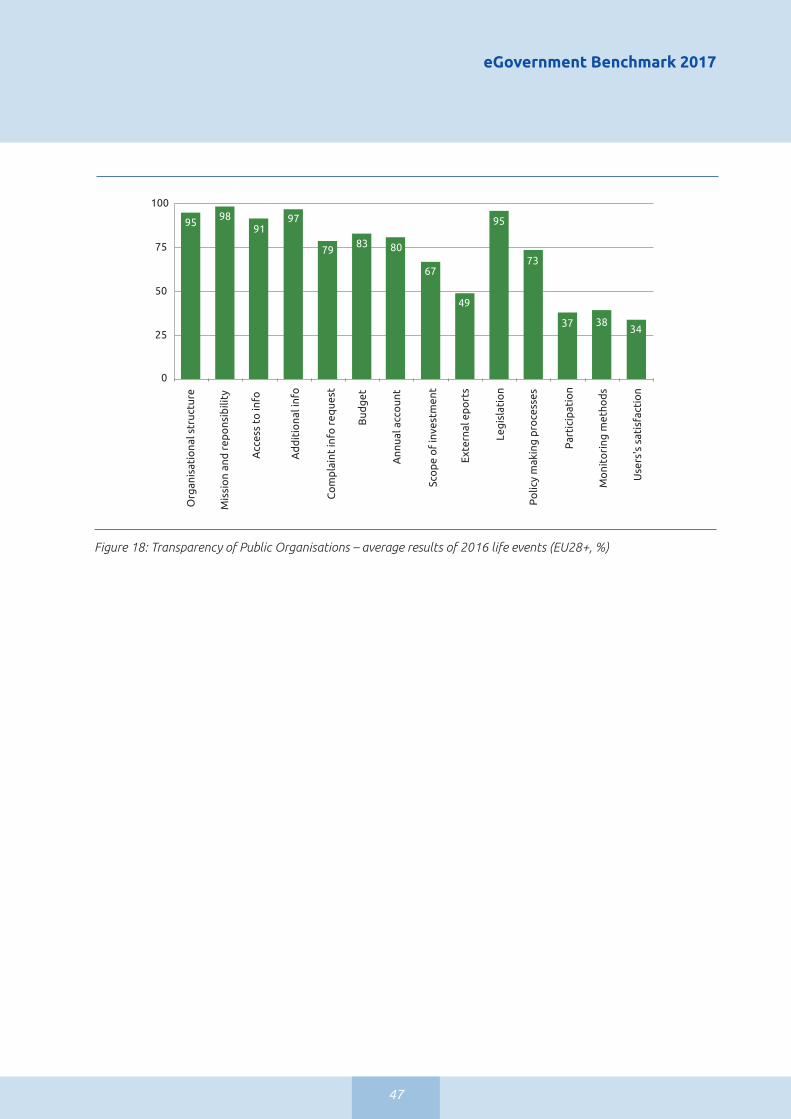
eGovernment Benchmark 2017
47
0
25
50
75
100 O
rgan
isat
iona
l str
uctu
re
Mis
sio
n an
d r
epo
nsib
ility
Acc
ess
to in
fo
Ad
dit
iona
l inf
o
Co
mp
lain
t in
fo r
eque
st
Bud
get
Ann
ual a
cco
unt
Sco
pe
of
inve
stm
ent
Exte
rnal
ep
ort
s
Leg
isla
tio
n
Po
licy
mak
ing
pro
cess
es
Par
tici
pat
ion
Mo
nito
ring
met
hod
s
Use
rs's
sat
isfa
ctio
n
Transparency: bar chart to report out per question asked for public organisations(EU28+, average all life events)
95 98
91 97
79 83 80
67
49
95
73
37 38 34
Figure 18: Transparency of Public Organisations – average results of 2016 life events (EU28+, %)
48
3
Good practice 4. Czech republic: base registers to increase transparency of personal data
Czech Republic – Base registers (authentic source)
Shared information across public administration
What is it?Unique solution to centralize and keep actual most common and widely used infor-mation. Base registers are central information source for information systems of public authorities. In addition base registers are central hub for interchange of ad-ditional information, related to information, stored in base registers – e. g. IS of ve-hicles, IS of drivers, IS of foreigners etc. The system of the base registers consists of the Registry of Inhabitants (updated reference data on citizens of Czech Republic, foreigners with residence permit or incomers who were granted asylum here), the Registry of Persons (the reference data about corporations, enterprising individu-als or public authorities), the Registry of Territorial Identification, Addresses and Real Estates Property (data on the basic territorial elements, for example territo-ries of the states, regions, municipals or parts of urban areas, plots and streets) and the Registry of Rights and Responsibilities (the data of competency of public ad-ministration offices). Thanks to the base registers system the situation in the Czech Republic has changed in the field of the transparency of using personal data. The base Registers concept is based on the need of secure data interchange between thousands of information systems of public administration. When citizen reports changes in his/her data, it has to be done only one – the rest of public administra-tion gets to know about the reported change “automatically”, and basically has no legal right to request these data again. It is based on European Union’s once-only principle. Thanks to base registers many agenda have been simplified and speeded up, and citizens and businesses have gained profound control over who, when, and why, uses our personal data.
Base Register of Territorial Identification, Addresses and Real Estates provides up-to-date core location data on administrative units, buildings, addresses, streets and public spaces, geographic names and election districts, as open data. In addition, RUIAN contains information on various characteristics of real estates, buildings and addresses and ensure remote access to these data (http://vdp.cuzk.cz).
What are the benefits? ■ Flexible reaction on data changes■ Sharing of data to be more effective■ Public remote access to the data of RUIAN register
What are the key success factors?■ Compliance with the interoperability principles for successful exchange and
reuse of public administration data■ Ensuring of using “once only” principle
Source: http://www.szrcr.cz/

eGovernment Benchmark 2017
49
12 This good practice has been selected by the authors of this report as very relevant for the development of the policy prio-rities on transparency and open government, and is constructed on information published online on the JoinUp platform
Good practice 5. Romania: increasing transparency through Funky Citizens12
Romania – Funky Citizens
‘Funky Citizens’ involves taxpayers in checking municipal budget
What is it?Funky Citizens, a Romanian civil initiative to build research-based, data-driven on-line advocacy tools, is inviting its followers to participate in analysing the municipal budget of Cluj-Napoca. This move was triggered after several errors were found in the 2015 draft budget. According to Funky Citizens, the municipal government reacted openly and quickly when confronted with these errors.
Funky Citizens was started by four passionate university graduates in law, political science and economics. These graduates are fighting what they see as a lack of ac-countability in the management of public money in Romania. The website provides citizens with insight into how public money is spent and offers tools to participate in making budgetary decisions at national and local level.
What are the benefits? ■ Transparency ■ Participation of citizens which enables collective intelligence■ Greater accountability of the municipal government
What are the key success factors?■ Willingness of citizens to participate
Source: https://joinup.ec.europa.eu/community/opengov/news/funky-citizens-involves-taxpayers-checking-municipal-budget
50
3
Good practice 6. France and United Kingdom work together on data revolution
France and United Kingdom
French-UK data taskforce publishes joint report
What is it?This joint taskforce was initiated in 2015 to further explore the topic of data revolution, in particular the aspects related to the fostering of economic growth and cooperation between the two countries. The report represents an opportu-nity for the UK and France to deepen their connection, and to open up new ways of collaborating and sharing experience. Data can be a common language and common resource. The recommendations in the report bring together the best of both countries’ experiences with data. In this regard, four main recommendation categories were identified: support data driven innovation, build robust data infra-structures, improve data literacy and skills, and strengthen citizens’ confidence and empowerment.
What are the benefits? ■ Improves data literacy and skills in both societies ■ Creates a common “data language”■ Could be transferable to other countries as well
What are the key success factors?■ Work on common data standards as the Open Contracting Data Standard
(OCDS) concerning public procurement data■ Create a legislation mapping between France and UK to facilitate the transfer-
ability of a common data language
Source: https://joinup.ec.europa.eu/community/opengov/news/uk-french-data-task-force-publishes-joint-report + the report: http://www.modernisation.gouv.fr/sites/ default/files/fichiers-attaches/report_data-driven-growth_july2016_0.pdf
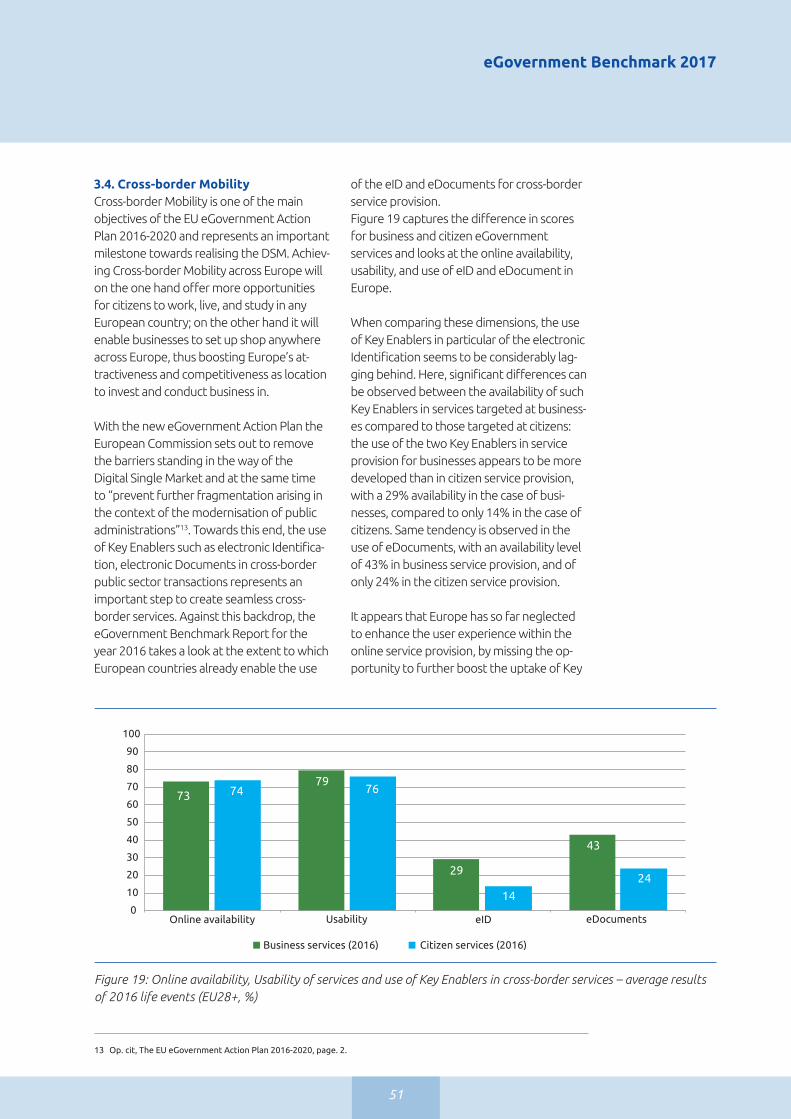
eGovernment Benchmark 2017
51
3.4. Cross-border Mobility Cross-border Mobility is one of the main objectives of the EU eGovernment Action Plan 2016-2020 and represents an important milestone towards realising the DSM. Achiev-ing Cross-border Mobility across Europe will on the one hand offer more opportunities for citizens to work, live, and study in any European country; on the other hand it will enable businesses to set up shop anywhere across Europe, thus boosting Europe’s at-tractiveness and competitiveness as location to invest and conduct business in.
With the new eGovernment Action Plan the European Commission sets out to remove the barriers standing in the way of the Digital Single Market and at the same time to “prevent further fragmentation arising in the context of the modernisation of public administrations”13. Towards this end, the use of Key Enablers such as electronic Identifica-tion, electronic Documents in cross-border public sector transactions represents an important step to create seamless cross-border services. Against this backdrop, the eGovernment Benchmark Report for the year 2016 takes a look at the extent to which European countries already enable the use
Figure 19: Online availability, Usability of services and use of Key Enablers in cross-border services – average results of 2016 life events (EU28+, %)
74 76
14
24
Citizen services (2016)
73 79
29
43
0
10
20
30
40
50
60
70
80
90
100
Online availability Usability eID eDocuments
Cross border: bar chart to present online availability, usability, eID, eDoc scores(EU28+, average all life events- possibly also show per life event to illustrate differences)
Business services (2016)
13 Op. cit, The EU eGovernment Action Plan 2016-2020, page. 2.
of the eID and eDocuments for cross-border service provision.Figure 19 captures the difference in scores for business and citizen eGovernment services and looks at the online availability, usability, and use of eID and eDocument in Europe. When comparing these dimensions, the use of Key Enablers in particular of the electronic Identification seems to be considerably lag-ging behind. Here, significant differences can be observed between the availability of such Key Enablers in services targeted at business-es compared to those targeted at citizens: the use of the two Key Enablers in service provision for businesses appears to be more developed than in citizen service provision, with a 29% availability in the case of busi-nesses, compared to only 14% in the case of citizens. Same tendency is observed in the use of eDocuments, with an availability level of 43% in business service provision, and of only 24% in the citizen service provision.
It appears that Europe has so far neglected to enhance the user experience within the online service provision, by missing the op-portunity to further boost the uptake of Key
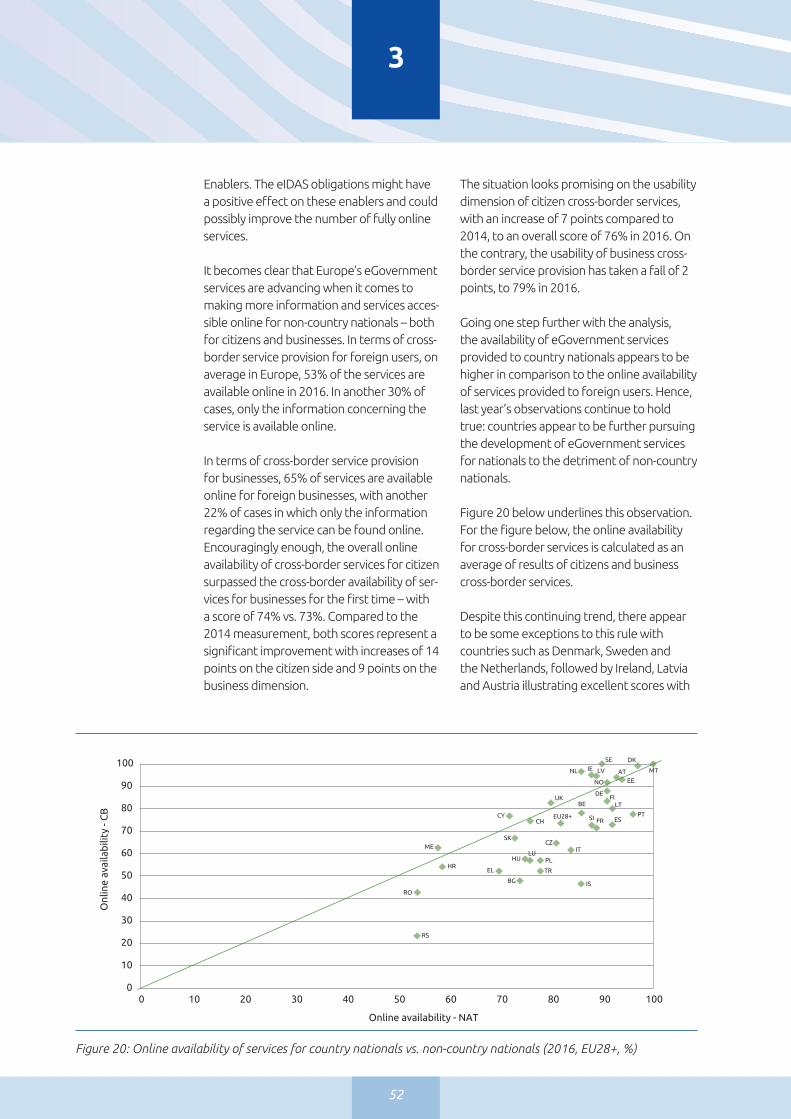
52
3
Enablers. The eIDAS obligations might have a positive effect on these enablers and could possibly improve the number of fully online services.
It becomes clear that Europe’s eGovernment services are advancing when it comes to making more information and services acces-sible online for non-country nationals – both for citizens and businesses. In terms of cross-border service provision for foreign users, on average in Europe, 53% of the services are available online in 2016. In another 30% of cases, only the information concerning the service is available online.
In terms of cross-border service provision for businesses, 65% of services are available online for foreign businesses, with another 22% of cases in which only the information regarding the service can be found online. Encouragingly enough, the overall online availability of cross-border services for citizen surpassed the cross-border availability of ser-vices for businesses for the first time – with a score of 74% vs. 73%. Compared to the 2014 measurement, both scores represent a significant improvement with increases of 14 points on the citizen side and 9 points on the business dimension.
The situation looks promising on the usability dimension of citizen cross-border services, with an increase of 7 points compared to 2014, to an overall score of 76% in 2016. On the contrary, the usability of business cross-border service provision has taken a fall of 2 points, to 79% in 2016.
Going one step further with the analysis, the availability of eGovernment services provided to country nationals appears to be higher in comparison to the online availability of services provided to foreign users. Hence, last year’s observations continue to hold true: countries appear to be further pursuing the development of eGovernment services for nationals to the detriment of non-country nationals.
Figure 20 below underlines this observation. For the figure below, the online availability for cross-border services is calculated as an average of results of citizens and business cross-border services.
Despite this continuing trend, there appear to be some exceptions to this rule with countries such as Denmark, Sweden and the Netherlands, followed by Ireland, Latvia and Austria illustrating excellent scores with
Figure 20: Online availability of services for country nationals vs. non-country nationals (2016, EU28+, %)
AT
BE
BG
CH CY
CZ
DE
DK
EE
EL
ES
FI
FR
HR HU
IE
IS
IT
LT
LU
LV
ME
MT NL
NO
PL
PT
RO
RS
SE
SI
SK
TR
UK
EU28+
0
10
20
30
40
50
60
70
80
90
100
0 10 20 30 40 50 60 70 80 90 100
Onl
ine
avai
lab
ility
- C
B
Online availability - NAT
Cross-border: scatter plotting countries on their score obtained for online availability forservices provided to country nationals vs services provided to foreign users (2016,%)

eGovernment Benchmark 2017
53
regard to online availability of cross-border services, which in turn rank higher compared to the online availability of their national ser-vices. Despite these exceptions, Europe still needs to step up the pace in terms of cross-border public service provision in order to remain on track with completing the Digital Single Market by 2020.
Good practice 7. Latvia: eID for cross-border mobility
Latvia – eID for cross-border mobility
Social network profile self-service verification by use of national eID
What is it?The first social network profile self-service verification solution within which the user can undertake profile verification (approval of authenticity of one’s digital personality) in the most popular social network in Latvia – Draugiem.lv by use of national eiD card. With this eID Latvian inhabitants living abroad will no longer need a Latvian internet bank to vote in the civic initiative portal of Latvia.
The Draugiem.lv verification solution is a unique example of public-private partner-ship in finding new ways to integrate governmental e-solutions within the private sector, thus expanding the use of the electronic identity cards issued by the state of Latvia (eID card).
What are the benefits? ■ Safe environment■ Enables e-democracy■ Strengthening citizen engagement■ Enables involvement of Latvian citizens living abroad
What are the key success factors?■ Cooperation between government and private partners
Source: https://joinup.ec.europa.eu/community/opengov/case/social-network-profile-self-service-verification-use-national-eid-latvia
54
3
Good practice 8. Austria: Electronic recognition and assessment of qualifications
Austria – Electronic Recognition and Assessment of Qualifications
Contact point for all points of questions concerning international recognition in the field of higher education
What is it?The Austrian ENIC NARIC (Recognition Information Centre) is the official contact point for all kinds of questions concerning international recognition in the field of higher education. Assessment of Higher Education qualifications for professional purposes and confirmations of higher education are exclusively available through the electronic application portal AAI.
What are the benefits? ■ Portal Solution■ Transparent criteria catalogue
What are the key success factors?■ Online Payment■ Transaction without media interruptions and securely available
Actual portal: https://www.aais.at/ .
3.5. Key Enablers As highlighted by the eGovernment Action Plan 2016-2020, the modernisation of pub-lic administrations towards providing faster and higher quality services for citizens and businesses needs to rely on Key Enablers. These enablers can increase user centricity of services. In line with this, the eGovern-ment Benchmark is also assessing the availability of such Key Enablers in public service provision. Against this backdrop, four Key Enablers represent the focus of the eGovernment Benchmark for 2016: ■ Electronic Identification (eID): a
government-issued, electronic identifi-cation solution to determine if the use is who he claims to be. Using eID ena-bles online transactions, saves time and reduces costs for all actors involved.
■ Electronic Documents (eDocuments): an electronic document reduces offline
paper processes by allowing citizens and businesses to send authenticated documents online.
■ Authentic Sources: base registries used by governments to automati-cally validate or fetch data relating to citizens or businesses. It facilitates pre-filling of online forms and the imple-mentation of the ‘once-only principle’, which implies that governments re-use data to deliver services automatically.
■ Digital Post: public administrations should allow citizens to receive mail in a digital format and help reduce paper mailing. Governments should provide the possibility to communicate electronically-only with citizens or entrepreneurs through personal mail-boxes or other digital post solutions. This represents a novelty of the 2016 measurement.
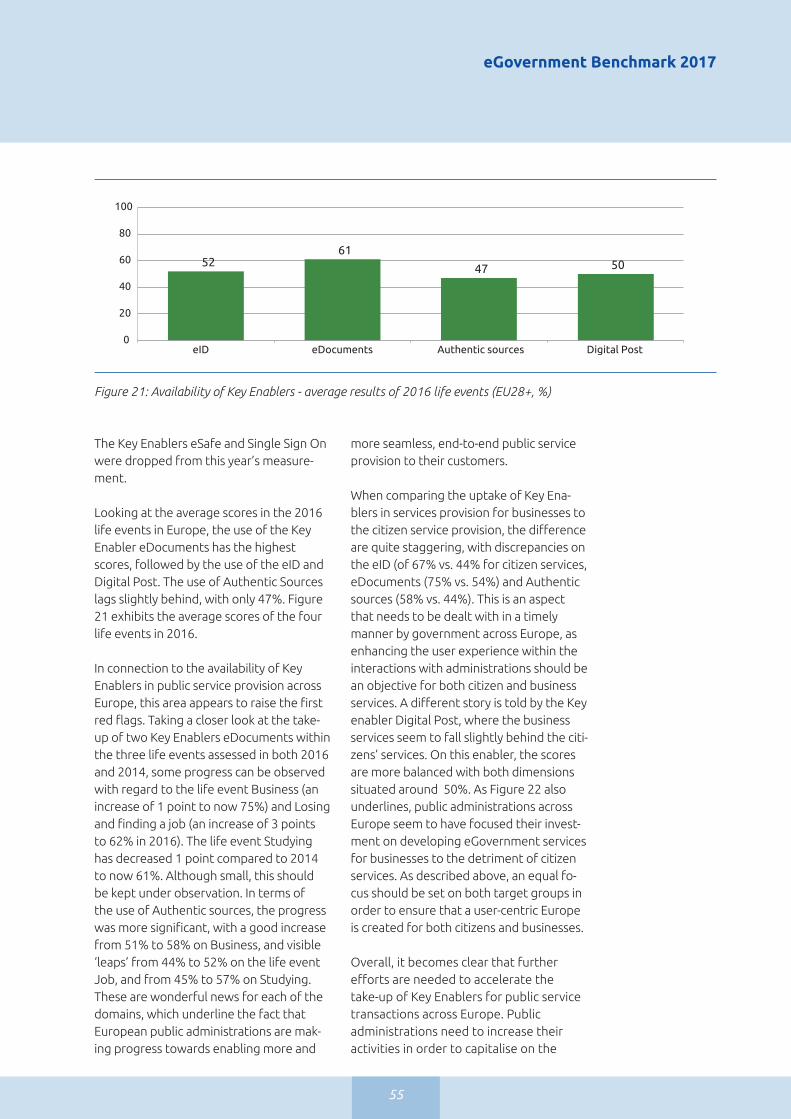
eGovernment Benchmark 2017
55
Figure 21: Availability of Key Enablers - average results of 2016 life events (EU28+, %)
52 61
47 50
0
20
40
60
80
100
eID eDocuments Authentic sources Digital Post
Key Enablers: bar chart with scores per enabler (EU28+, average all life events)
The Key Enablers eSafe and Single Sign On were dropped from this year’s measure-ment.
Looking at the average scores in the 2016 life events in Europe, the use of the Key Enabler eDocuments has the highest scores, followed by the use of the eID and Digital Post. The use of Authentic Sources lags slightly behind, with only 47%. Figure 21 exhibits the average scores of the four life events in 2016.
In connection to the availability of Key Enablers in public service provision across Europe, this area appears to raise the first red flags. Taking a closer look at the take-up of two Key Enablers eDocuments within the three life events assessed in both 2016 and 2014, some progress can be observed with regard to the life event Business (an increase of 1 point to now 75%) and Losing and finding a job (an increase of 3 points to 62% in 2016). The life event Studying has decreased 1 point compared to 2014 to now 61%. Although small, this should be kept under observation. In terms of the use of Authentic sources, the progress was more significant, with a good increase from 51% to 58% on Business, and visible ‘leaps’ from 44% to 52% on the life event Job, and from 45% to 57% on Studying. These are wonderful news for each of the domains, which underline the fact that European public administrations are mak-ing progress towards enabling more and
more seamless, end-to-end public service provision to their customers.
When comparing the uptake of Key Ena-blers in services provision for businesses to the citizen service provision, the difference are quite staggering, with discrepancies on the eID (of 67% vs. 44% for citizen services, eDocuments (75% vs. 54%) and Authentic sources (58% vs. 44%). This is an aspect that needs to be dealt with in a timely manner by government across Europe, as enhancing the user experience within the interactions with administrations should be an objective for both citizen and business services. A different story is told by the Key enabler Digital Post, where the business services seem to fall slightly behind the citi-zens’ services. On this enabler, the scores are more balanced with both dimensions situated around 50%. As Figure 22 also underlines, public administrations across Europe seem to have focused their invest-ment on developing eGovernment services for businesses to the detriment of citizen services. As described above, an equal fo-cus should be set on both target groups in order to ensure that a user-centric Europe is created for both citizens and businesses.
Overall, it becomes clear that further efforts are needed to accelerate the take-up of Key Enablers for public service transactions across Europe. Public administrations need to increase their activities in order to capitalise on the
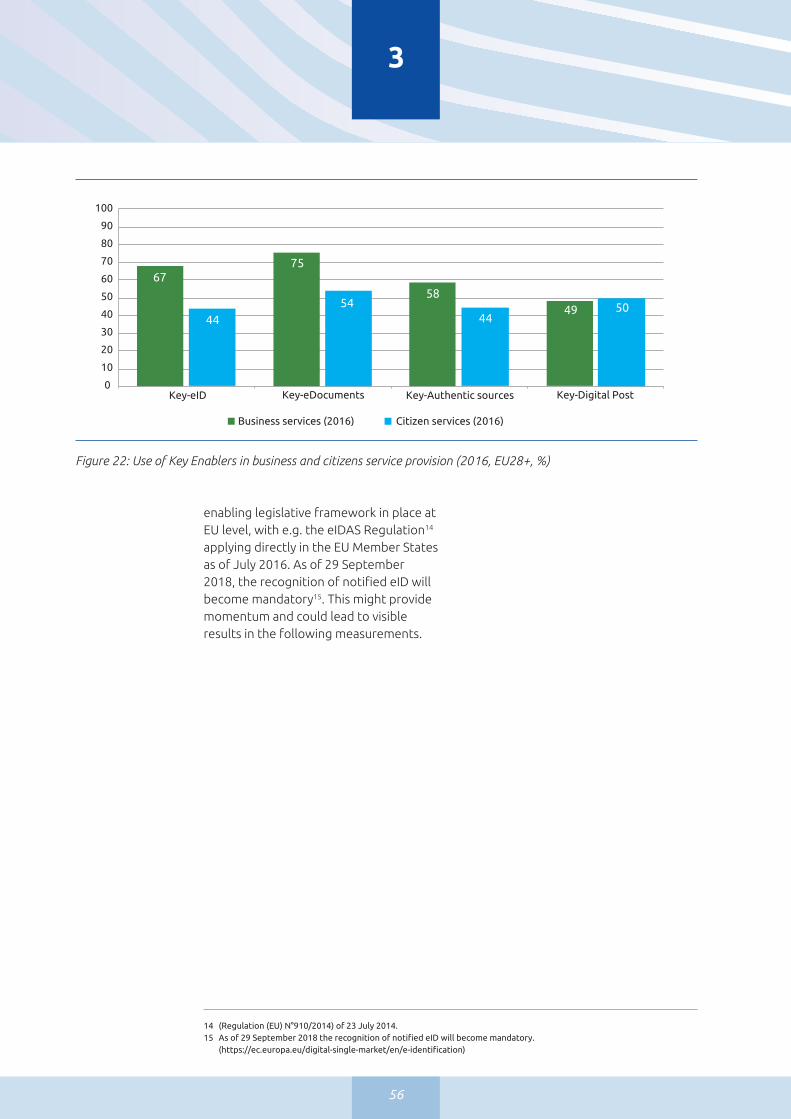
56
3
14 (Regulation (EU) N°910/2014) of 23 July 2014.15 Asof29September2018therecognitionofnotifiedeIDwillbecomemandatory.
(https://ec.europa.eu/digital-single-market/en/e-identification)
Figure 22: Use of Key Enablers in business and citizens service provision (2016, EU28+, %)
44
Citizen services (2016)
67 75
58 49
100
90
80
70
60
50
40
30
20
10
0 Key-eID Key-eDocuments Key-Authentic sources Key-Digital Post
Business services (2016)
50 44
54
Use of Key Enablers in business and citizens service provision (2016, Europe, %)
enabling legislative framework in place at EU level, with e.g. the eIDAS Regulation14 applying directly in the EU Member States as of July 2016. As of 29 September 2018, the recognition of notified eID will become mandatory15. This might provide momentum and could lead to visible results in the following measurements.

eGovernment Benchmark 2017
57
Finland – Finnish Immigration Service
Moni-prepaid payment cards for refugees
What is it?The Finnish Immigration Service uses MONI-prepaid payment card for refugees, based on blockchain technology to anonymised user refugee status. Currently, the MONI prepaid card holders already get more salaries paid on their cards than allowance money (the break even point was June-July /2017 – 18 months after the start the amount of salaries paid using prepaid card in one month exceeded the amount of reception center allowance money in that month).
What are the benefits? ■ Speeding up the entrance of asylum seekers to the labour market■ Ensuring privacy and confidentiality of refugees■ Stimulating inclusiveness of asylum seekers■ Using a debit card is a safer and cheaper way to pay reception allowance
than cash
What are the key success factors?■ Extensive piloting ■ Creating a program with clear goals and requirements
Sources: http://www.migri.fi/for_the_media/bulletins/press_releases/press_ releases/1/0/reception_allowance_on_debit_card_to_be_tried_at_the_oulu_turku_and_tampere_reception_centres_72028https://www.technologyreview.com/s/608764/how-blockchain-is-kickstarting-the-financial-lives-of-refugees/
Good practice 9. Finland: using blockchain technology to authenticate identities of refugees online
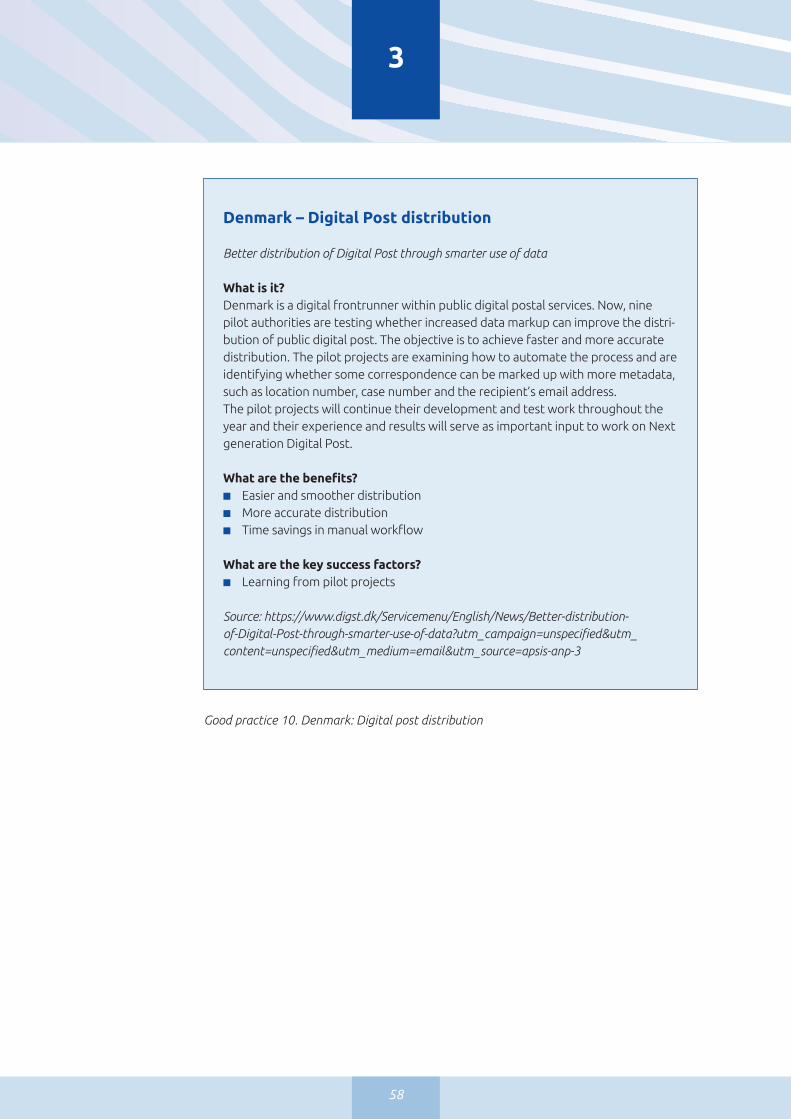
58
3
Denmark – Digital Post distribution
Better distribution of Digital Post through smarter use of data
What is it?Denmark is a digital frontrunner within public digital postal services. Now, nine pilot authorities are testing whether increased data markup can improve the distri-bution of public digital post. The objective is to achieve faster and more accurate distribution. The pilot projects are examining how to automate the process and are identifying whether some correspondence can be marked up with more metadata, such as location number, case number and the recipient’s email address. The pilot projects will continue their development and test work throughout the year and their experience and results will serve as important input to work on Next generation Digital Post.
What are the benefits? ■ Easier and smoother distribution■ More accurate distribution■ Time savings in manual workflow
What are the key success factors?■ Learning from pilot projects
Source: https://www.digst.dk/Servicemenu/English/News/Better-distribution-of-Digital-Post-through-smarter-use-of-data?utm_campaign=unspecified&utm_content=unspecified&utm_medium=email&utm_source=apsis-anp-3
Good practice 10. Denmark: Digital post distribution
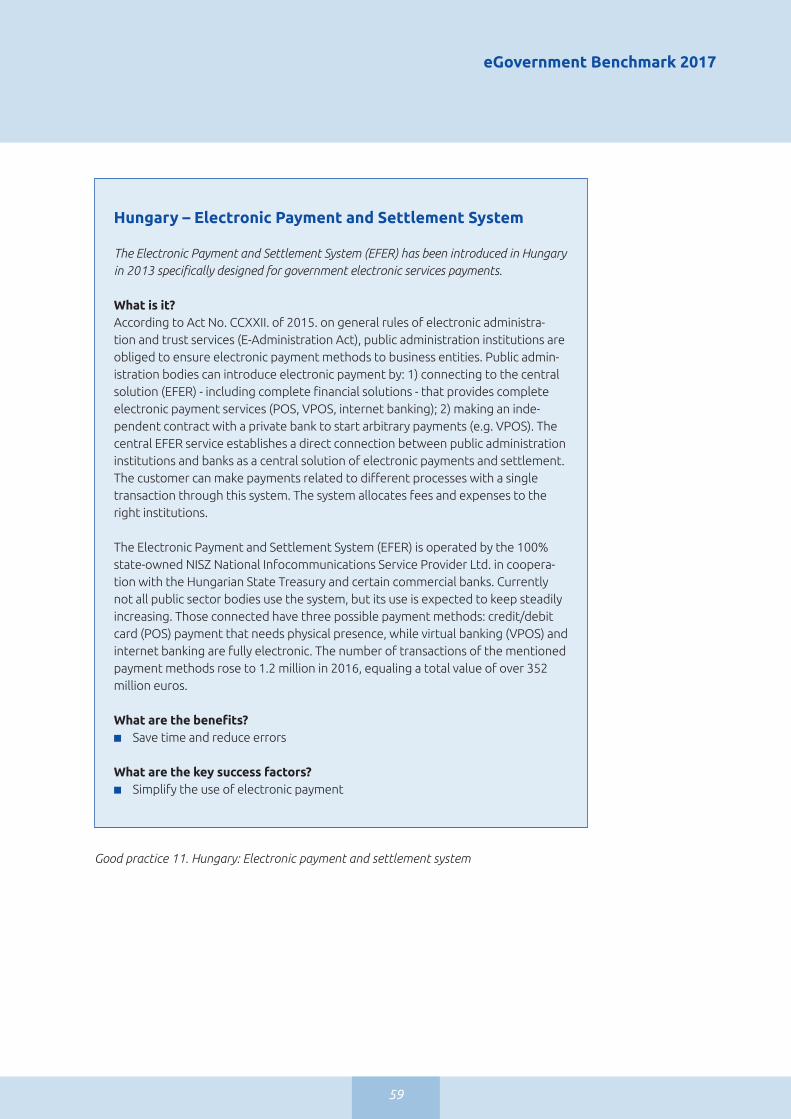
eGovernment Benchmark 2017
59
Hungary – Electronic Payment and Settlement System
The Electronic Payment and Settlement System (EFER) has been introduced in Hungary in 2013 specifically designed for government electronic services payments.
What is it?According to Act No. CCXXII. of 2015. on general rules of electronic administra-tion and trust services (E-Administration Act), public administration institutions are obliged to ensure electronic payment methods to business entities. Public admin-istration bodies can introduce electronic payment by: 1) connecting to the central solution (EFER) - including complete financial solutions - that provides complete electronic payment services (POS, VPOS, internet banking); 2) making an inde-pendent contract with a private bank to start arbitrary payments (e.g. VPOS). The central EFER service establishes a direct connection between public administration institutions and banks as a central solution of electronic payments and settlement. The customer can make payments related to different processes with a single transaction through this system. The system allocates fees and expenses to the right institutions.
The Electronic Payment and Settlement System (EFER) is operated by the 100% state-owned NISZ National Infocommunications Service Provider Ltd. in coopera-tion with the Hungarian State Treasury and certain commercial banks. Currently not all public sector bodies use the system, but its use is expected to keep steadily increasing. Those connected have three possible payment methods: credit/debit card (POS) payment that needs physical presence, while virtual banking (VPOS) and internet banking are fully electronic. The number of transactions of the mentioned payment methods rose to 1.2 million in 2016, equaling a total value of over 352 million euros.
What are the benefits? ■ Save time and reduce errors
What are the key success factors?■ Simplify the use of electronic payment
Good practice 11. Hungary: Electronic payment and settlement system

60
3
3.6. Key findings In the light of the analysis presented in Chapter 3, some key insights crystallised when looking at the current eGovernment progress:
■ European governments are steadily becoming more citizen-centric. Euro-pean governments reach the average of 80% for User Centricity in 2016. More interaction and feedback possibilities between citizens and public administra-tions are now available across Europe.
■ More eGovernment services were ac-cessible online in 2016, with European public administrations reaching a score of 82%.
■ On average across Europe, one in two public website is mobile-friendly (54%).
■ Mandatory online services are not unusual amongst countries for deliv-ering eServices with in total 14 coun-tries of 34 having at least one service mandatory via the online channel. Most mandatory eServices are address-ing businesses (9 European countries made one or more services mandatory online) and students (10 countries), and only a few eServices are related to Family life (3 countries) or to jobseek-ers (6 countries).
■ The business life event is the most ad-vanced compared to other life events, while the services related to Family Life could be improved (most likely as a result of more local services delivered in this domain, this life event scores lower). The idea of a transparent
Slovakia – eID cards
Two million eID cards now in use in Slovakia
What is it?Early 2017, Slovakia handed out its 2 millionth eID card. This translates into an adoption rate of the electronic Identification card of nearly 40% (given the coun-try’s 5.4 million citizens), and an issuance rate per month between 50,000 to and 55,000 eID cards. The card allows users to electronically identify and authenti-cate themselves and can be used to access a wide range of eGovernment services on the slovensko.sk eGovernment portal. It provides access to more than 1,400 services, from registering a car, and accessing administrative records, to applying for child benefits.
What are the benefits? ■ Fast service for citizens, and services are available outside office hours■ Less personnel costs■ Higher efficiency gains
What are the key success factors?■ Sufficient possibilities to use eID
Source: https://joinup.ec.europa.eu/community/epractice/news/two-million-eid-cards-now-use-slovakia
Good practice 12. Slovakia: eID cards.

eGovernment Benchmark 2017
61
Government has yet to materialize, as the Transparency benchmark only reached moderate scores in service de-livery (50%) and personal data (53%).
■ The Business Mobility benchmark indicates that cross-border services are lagging behind services offered to national entrepreneurs. Still for 17% of services that foreign entrepreneurs need to start a business in another country not even information can be accessed online (e.g. for language and eID interoperability reasons). In comparison, entrepreneurs starting a business in their own country face such issues in only 2% of the cases.
■ Much more needs to be done with regard to the use of Key Enablers in public service provision for both citizens and business services. The low uptake of eID in government services, both in domestic and cross-border transactions clearly signals a missed opportunity. The use of authentic sources towards obtaining efficiency gains in service delivery remains a missed opportunity, with scores that have stagnated at 47%.

62

63
Part two: Deep dive into the life events

64
Starting up a business and early trading operations
4
4.1. Introduction to life eventEnhancing Europe’s attractiveness and competitiveness worldwide represents one of the main objectives of the Euro-pean Union, towards fulfilling its Agenda for 2020. The European Commission has placed great emphasis on this dimension and has pushed forward the simplification of administrative and regulatory bur-dens and the creation of an overall more business-friendly environment16.
The eGovernment benchmarks of the past years have measured this dimension in an effort to help government grasp their progress and the potential areas for improvement. Whereas in 2013 and 2015 the focus was set on the availability of eGovernment services that support busi-ness entrepreneurs in performing their regular business operations, the 2012, 2014 and again the 2016 benchmarks measure the extent to which entrepre-neurs can set up their business in the Eu-ropean Union in a quick and easy manner. This endeavour remains a key element towards ensuring that Europe continues to be a top location to invest, conduct business and live in.
The dimensions that the four top-level benchmarks cover come into play here. ■ By creating intuitive, interactive and
individualised services (e.g. through digital gateways as Single Points of Contact for users) cost savings are triggered on the business side, with entrepreneurs spending less time on switching from one website to an-other, in search for information and/or to carry out their transactions.
■ By increasing transparency on process-ing times for applications, business owners can plan their interactions with government better. At the same time, an increased level of transpar-ency with regard to whom accessed user’s personal information as well as transparency of public organisations with regard to their activities, budgets and spending help increase trust in public institutions across Europe.
■ By simplifying public service provi-sion for business registrations across Europe, the EU is ensuring that entrepreneurs are welcomed by a business-friendly environment, with lean public service interactions. Si-multaneously, the use of Key Enablers towards service provision ensures that European public services are not only information-driven but also available across country borders.
The 2016 eGovernment Benchmark meas-ures the maturity of the eGovernment services in the life event Business, from the perspective of the entrepreneur – as customer of public service provision. By doing so, it aims at enabling governments a bird’s eye view on their services and their progress so far, and helps them bet-ter grasp the areas that need a stronger focus in the years to come.
This chapter assesses the results of the top-level benchmarks in the life event Starting up a business and early trading operations. After a short introduction to the life event, the results on User Centricity, Transparency, Cross-border Mobility and Key Enablers will be presented and elaborated upon.
16 European Commission. Available at: http://ec.europa.eu/dgs/secretariat_general/admin_burden/docs/abr_delivering_on_promises_en.pdf

eGovernment Benchmark 2017
65
Key insights – Life Event Business and Early Trading Operations
■ Starting Up a Business is the best scoring life event in 2016, with an overall score of 69% across the four top-level benchmarks.
■ In terms of its User Centricity, the Life event Business registered a significant boost in terms of usability, with a score of 92% (+8 points vs 2014) and a score of 87% in terms of online availability of services (+5 points vs 2014). Nine European countries have reached maximum scores in terms of usability of services in this domain.
■ More attention needs to be given to the mobile friendliness of services, with only 1 in 2 services being classified as mobile-friendly (51%).
■ Transparency of Government continues to show steady progress on all indicators (Ser¬vice delivery, Personal data, and Public organisations) and reached an average of 63% in 2016.
■ Slow progress is made with regard to Cross-border Mobility, which has increased only by 1 point to reach 65% in 2016. Slow progress here is mainly explained by the introduction of cross-border Key Enablers while, for example, online availability has progressed substantially. Both online availability and usability of services in cross-border interactions in this domain are lagging behind when compared to the services for national businesses. More efforts are needed to ensure business mobility and help realise the DSM vision by 2020.
■ Sluggish progress is also made with regard to the uptake of Key Enablers, with a score of 67% in 2016 (with a decrease of 4 points vs 2014) and a minor increase of 1 point in the use of eDocuments to 75%. Authentic sources increased to 58% (+ 7 points) and reinforces the belief that the ‘Once-Only Principle’ is picking up speed across Europe. The newly measured Key Enabler Digital Post scores at 49% in 2016.
■ The most mature service interactions are the interactions surrounding the registration of a company and the subsequent publication in the Official Journal. At the opposite end, the least mature services surround the registration obligations with civil insurance and the confirmation of management qualifications on behalf of entrepreneurs.
4.2. User CentricityThe analysis of this top-level benchmark focusses on the online availability and mobile-friendliness of services targeted at businesses across Europe.
4.2.1 Online availability Similar to 2014, this year’s benchmark results reinforce the fact that the eGovernment services for businesses are well developed across Europe. Progress
has been registered in 2016, with now all public service information being available online. The assessment in the life event Business is the most extensive of all life events and comprises 11 dimensions of analysis and 33 inter-actions.
Figure 23 illustrates how services within this life event are made available to businesses in Europe.
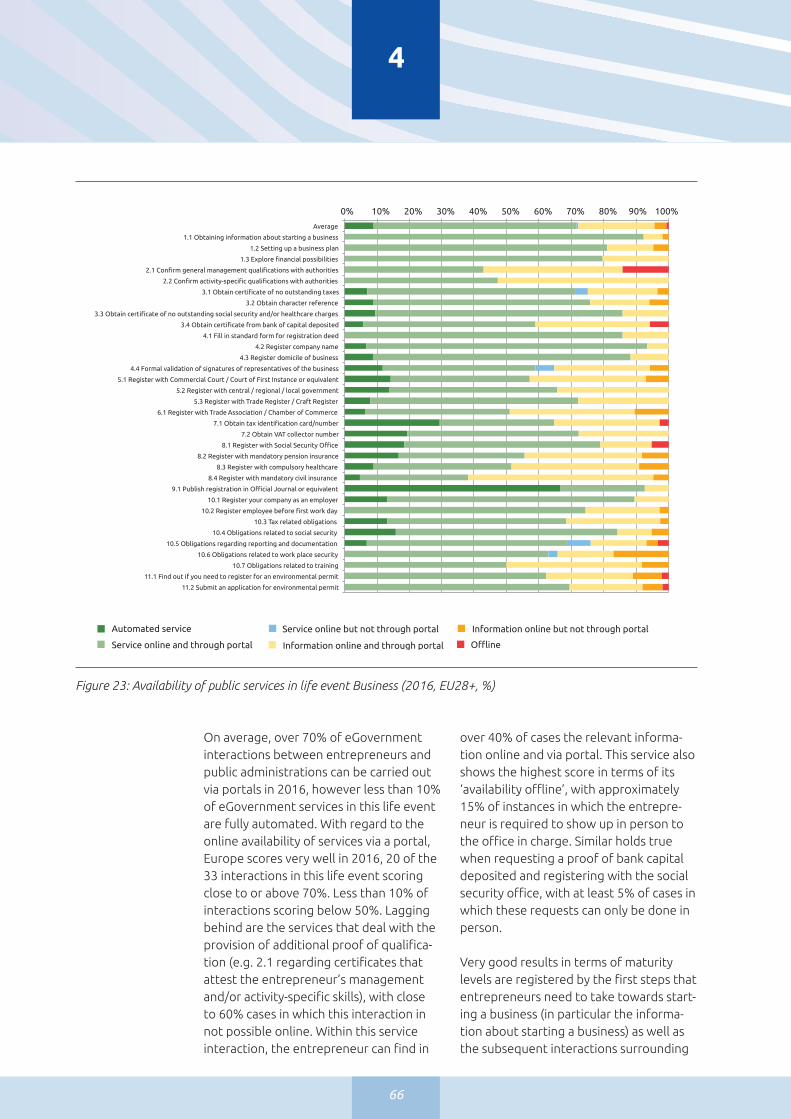
66
4
Figure 23: Availability of public services in life event Business (2016, EU28+, %)
0% 10% 20% 30% 40% 50% 60% 70% 80% 90% 100%
Average
1.1 Obtaining information about starting a business
1.2 Setting up a business plan
1.3 Explore financial possibilities
2.1 Confirm general management qualifications with authorities
2.2 Confirm activity-specific qualifications with authorities
3.1 Obtain certificate of no outstanding taxes
3.2 Obtain character reference
3.3 Obtain certificate of no outstanding social security and/or healthcare charges
3.4 Obtain certificate from bank of capital deposited
4.1 Fill in standard form for registration deed
4.2 Register company name
4.3 Register domicile of business
4.4 Formal validation of signatures of representatives of the business
5.1 Register with Commercial Court / Court of First Instance or equivalent
5.2 Register with central / regional / local government
5.3 Register with Trade Register / Craft Register
6.1 Register with Trade Association / Chamber of Commerce
7.1 Obtain tax identification card/number
7.2 Obtain VAT collector number
8.1 Register with Social Security Office
8.2 Register with mandatory pension insurance
8.3 Register with compulsory healthcare
8.4 Register with mandatory civil insurance
9.1 Publish registration in Official Journal or equivalent
10.1 Register your company as an employer
10.2 Register employee before first work day
10.3 Tax related obligations
10.4 Obligations related to social security
10.5 Obligations regarding reporting and documentation
10.6 Obligations related to work place security
10.7 Obligations related to training
11.1 Find out if you need to register for an environmental permit
11.2 Submit an application for environmental permit
How services are made available by country (Business, 2016, %)
Automated service
Service online and through portal Offline
Service online but not through portal
Information online and through portal
Information online but not through portal
On average, over 70% of eGovernment interactions between entrepreneurs and public administrations can be carried out via portals in 2016, however less than 10% of eGovernment services in this life event are fully automated. With regard to the online availability of services via a portal, Europe scores very well in 2016, 20 of the 33 interactions in this life event scoring close to or above 70%. Less than 10% of interactions scoring below 50%. Lagging behind are the services that deal with the provision of additional proof of qualifica-tion (e.g. 2.1 regarding certificates that attest the entrepreneur’s management and/or activity-specific skills), with close to 60% cases in which this interaction in not possible online. Within this service interaction, the entrepreneur can find in
over 40% of cases the relevant informa-tion online and via portal. This service also shows the highest score in terms of its ‘availability offline’, with approximately 15% of instances in which the entrepre-neur is required to show up in person to the office in charge. Similar holds true when requesting a proof of bank capital deposited and registering with the social security office, with at least 5% of cases in which these requests can only be done in person.
Very good results in terms of maturity levels are registered by the first steps that entrepreneurs need to take towards start-ing a business (in particular the informa-tion about starting a business) as well as the subsequent interactions surrounding

eGovernment Benchmark 2017
67
the registration of a company (both name and address, as well as with the Labour Office in charge) and those related to social security obligations. All these inter-actions have reached score of +80%. Best performers are the interactions regarding the registration of a company as well as the information about starting a business, both available online in 92% of cases.
With regard to the level of automation, publishing the registration of a business in the Official Journal scores the highest – almost reaching 70% , and differentiates itself visibly from the second most mature service in this regard -- the application for a tax identification card/number, which comes close to reaching 30% in 2016. Ser-vices that deal with the request of a VAT number, registration with social security and mandatory pension insurance follow next, with scores slightly below 20%.
4.2.2. Mobile friendliness An important part of user centricity of public service provision deals with the user being able to access a service and/or relevant information anytime, from anywhere (e.g. from the device of choice). The following section observes the extent to which eGovernment services in Europe
are in tune with users’ demand on read-ability of services and portal websites on their mobile device.
Figure 24 presents the country ranking on the mobile friendliness of eGovernment services for the life event Business. Excel-lent results are registered by Denmark, Malta and Sweden by reaching maximum scores, followed at close distance by UK (96%) and Austria (95%). Next in rankings are Luxembourg (81%) and the Nether-lands (81%). As the landscape shows, half of the European countries have reached scores of at least 50% in 2016.
With regard to the mobile friendliness of portals17 across Europe, Figure 25 below depicts even more optimistic results. Seven of the 34 countries under scrutiny reached a 100% score with another ten scoring equal to or higher than 50%. The Nordic countries show a strong presence here, with Denmark, Norway and Sweden reaching 100%. France, Lithuania and Poland represent the positive surprises in this category with the same maximum scores.
Examining the scores in both dimensions, Denmark and Malta and Sweden reached
Figure 24: Mobile-friendliness of services in life event Business (2016, EU28+, %)
0%
10%
20%
30%
40%
50%
60%
70%
80%
90%
100%
DK MT SE UK AT LU NL BE LV DE FR FI LT IS SK CH ME RS PL NO HR ES EE PT IT HU IE RO EL BG TR CZ SI CY
17 For the purpose of this report, portals are understood as central points of access to public services and information related to public services.

68
4
maximum points on both indicators. The scores in both mobile friendliness dimen-sions are encouraging, however here as well Europe needs to step up its pace and provide its business customers with services and portals that can be accessed anytime, anywhere, and from any device. This would represent a great signal that European public administrations are re-sponsive to users’ preferences regarding ‘mobile’ as preferred channel for access to services and information online.
Figure 25: Mobile-friendliness of portals in life event Business (2016, EU28+, %)
0%
10%
20%
30%
40%
50%
60%
70%
80%
90%
100%
DK FR LT MT NL PL SE UK CH FI PT AT BE HR NO DE RO IT ES IS LV ME RS SI SK TR EE LU EL IE HU CZ BG CY
4.3. Transparency Transparency along this life event rep-resents an important element to saving costs on the entrepreneur’s side (Trans-parency of Service Delivery) as well as to increase trust in government (covered by the dimensions Transparency of Public Organisations and Transparency of Per-sonal Data).
Transparency of service delivery improved 6 points compared to 2014 and reached 59% in 2016. It appears that services become more transparent throughout Eu-rope by providing timelines for delivery.
As depicted in Figure 26, there are only a few services in this life event scoring be-low 40%. When looking at the most and least transparent services, the publication
of the company registration in the Official Journal is the best performing interac-tion, at a considerable distance from the services concerning tax and social security related obligations, which score along the 65% lines. At the opposite end, interactions such as the registration with the Chamber of Commerce and with the office in charge of mandatory civil insur-ance appear to have the least transparent service delivery, with scores around 35%.
However, improvement on this dimension is needed, with only 10 of the 33 analysed interactions reaching 60% and above.
4.4. Cross-border Mobility Enabling Cross-border Mobility for busi-nesses is one of the key EU priorities for completing the Digital Single Market and
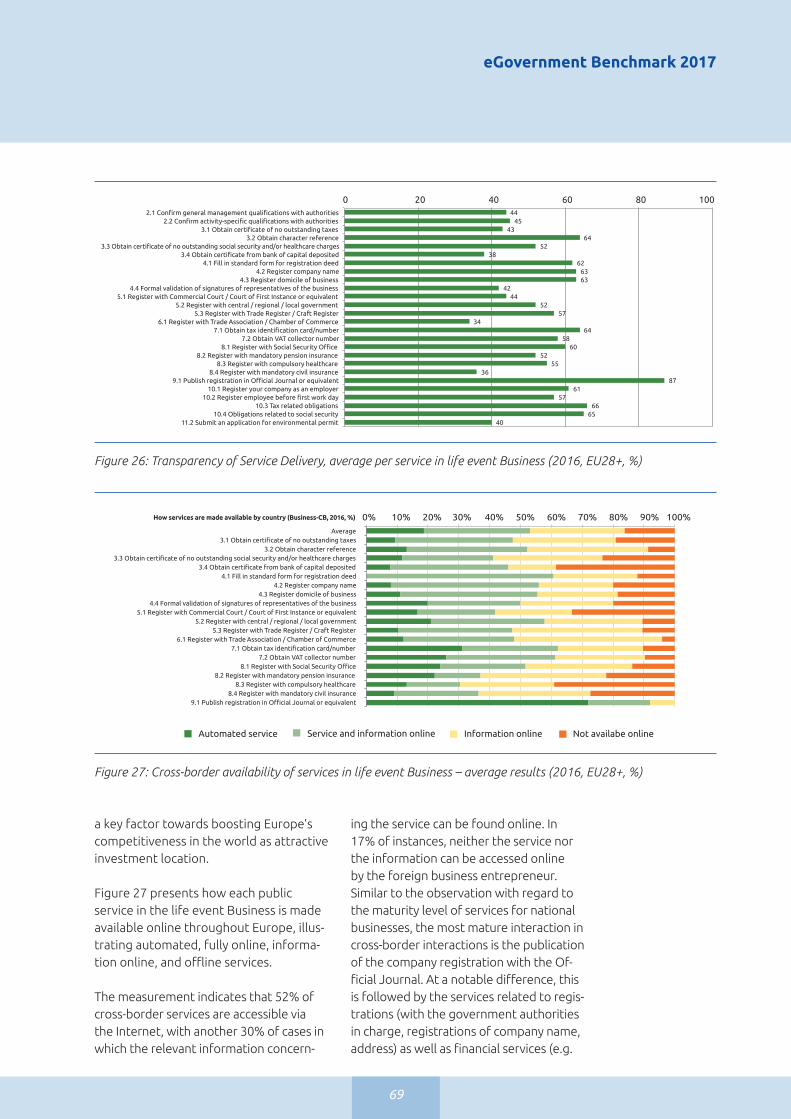
eGovernment Benchmark 2017
69
Figure 26: Transparency of Service Delivery, average per service in life event Business (2016, EU28+, %)
Figure 27: Cross-border availability of services in life event Business – average results (2016, EU28+, %)
44 45
43 64
52 38
62 63 63
42 44
52 57
34 64
58 60
52 55
36 87
61 57
66 65
40
0 20 40 60 80 100 2.1 Confirm general management qualifications with authorities
2.2 Confirm activity-specific qualifications with authorities 3.1 Obtain certificate of no outstanding taxes
3.2 Obtain character reference 3.3 Obtain certificate of no outstanding social security and/or healthcare charges
3.4 Obtain certificate from bank of capital deposited 4.1 Fill in standard form for registration deed
4.2 Register company name 4.3 Register domicile of business
4.4 Formal validation of signatures of representatives of the business 5.1 Register with Commercial Court / Court of First Instance or equivalent
5.2 Register with central / regional / local government 5.3 Register with Trade Register / Craft Register
6.1 Register with Trade Association / Chamber of Commerce 7.1 Obtain tax identification card/number
7.2 Obtain VAT collector number 8.1 Register with Social Security Office
8.2 Register with mandatory pension insurance 8.3 Register with compulsory healthcare
8.4 Register with mandatory civil insurance 9.1 Publish registration in Official Journal or equivalent
10.1 Register your company as an employer 10.2 Register employee before first work day
10.3 Tax related obligations 10.4 Obligations related to social security
11.2 Submit an application for environmental permit
Transparency: bar chart illustrating level of transparency of service delivery per service (Life Event: Business)
Average
How services are made available by country (Business-CB, 2016, %)
3.1 Obtain certificate of no outstanding taxes 3.2 Obtain character reference
3.3 Obtain certificate of no outstanding social security and/or healthcare charges 3.4 Obtain certificate from bank of capital deposited
4.1 Fill in standard form for registration deed 4.2 Register company name
4.3 Register domicile of business 4.4 Formal validation of signatures of representatives of the business
5.1 Register with Commercial Court / Court of First Instance or equivalent 5.2 Register with central / regional / local government
5.3 Register with Trade Register / Craft Register 6.1 Register with Trade Association / Chamber of Commerce
7.1 Obtain tax identification card/number 7.2 Obtain VAT collector number
8.1 Register with Social Security Office 8.2 Register with mandatory pension insurance
8.3 Register with compulsory healthcare 8.4 Register with mandatory civil insurance
9.1 Publish registration in Official Journal or equivalent
How services are made available by country (Business-CB, 2016, %)
Automated service Service and information online Not availabe onlineInformation online
0% 10% 20% 30% 40% 50% 60% 70% 80% 90% 100%
a key factor towards boosting Europe’s competitiveness in the world as attractive investment location.
Figure 27 presents how each public service in the life event Business is made available online throughout Europe, illus-trating automated, fully online, informa-tion online, and offline services.
The measurement indicates that 52% of cross-border services are accessible via the Internet, with another 30% of cases in which the relevant information concern-
ing the service can be found online. In 17% of instances, neither the service nor the information can be accessed online by the foreign business entrepreneur. Similar to the observation with regard to the maturity level of services for national businesses, the most mature interaction in cross-border interactions is the publication of the company registration with the Of-ficial Journal. At a notable difference, this is followed by the services related to regis-trations (with the government authorities in charge, registrations of company name, address) as well as financial services (e.g.

70
4
obtaining of VAT and tax identification numbers), with scores around the 50% line. In terms of their automation, again the publication in the Official Journal scores highest (71%). This is followed by the inter-actions surrounding financial services (e.g. request for VAT number, tax identification card) – with scores of 25% and above, and registration activities (with social security, pension insurance, registration with cen-tral, regional or local government) – which score around the 20% line.
At the other end, the least mature service appears to be the registration with com-pulsory health insurance, and the manda-tory civil insurance, with respective results around the 30% and 35%. Overall, whereas for country nationals offline services hardly exist, for all 19 assessed cross-border ser-vices there is still a substantial amount of services in which a face-to-face interaction between the foreign business entrepreneur and the public administration is required.
4.5. Key EnablersKey Enablers can reduce the administrative burden that businesses normally face, as they provide a requisite for fully transac-tional eGovernment services and reduce the number of steps to take and the amount of data to submit. The use of Key Enablers is an important step to simplifying and modernising public administrations, in particular their service provision.
Figure 28 presents their availability in each service interaction assessed in the life event Business.
The results look encouraging with regard to the take-up of eDocuments and Authentic Sources in service provision towards businesses, with results of 75% on eDocuments (+1 point compared to 2014) and 58% on the use of Authentic Sources (+7 points vs 2014). Zooming into the availability of eDocuments, the vast majority of interactions show good levels of use, scoring 60% and above. Looking at the use of Authentic Sources, the results
look less optimistic, with the vast major-ity of interactions scoring close to 50%. Despite this, it is expected that European public administrations will continue on this growth path in this regard.
The Key Enabler eID however witnessed a fall-back of 4 points in 2016, to 67%. Here all interactions still showcase examples in which no electronic Identification is pos-sible online, albeit to different extents. The vast majority of interactions however provide entrepreneurs with the possibility to authenticate online via their national electronic Identification. When looking at the service interactions, the adoption rates remain modest at best. In this perspective, more efforts are definitely needed.
Going one step further the benchmark is also looking at the use of the Key Enabler Authentic Sources and how this relates to the overall online availability of ser-vices in the life event Business. Since the indicator of online services only contains basic services we calculated the score for online availability using only basic services as well. This allows us to make a proper comparison between the two indicators. Figure 29 on page 72 illustrates the coun-try scores in these two dimensions for the life event Business.
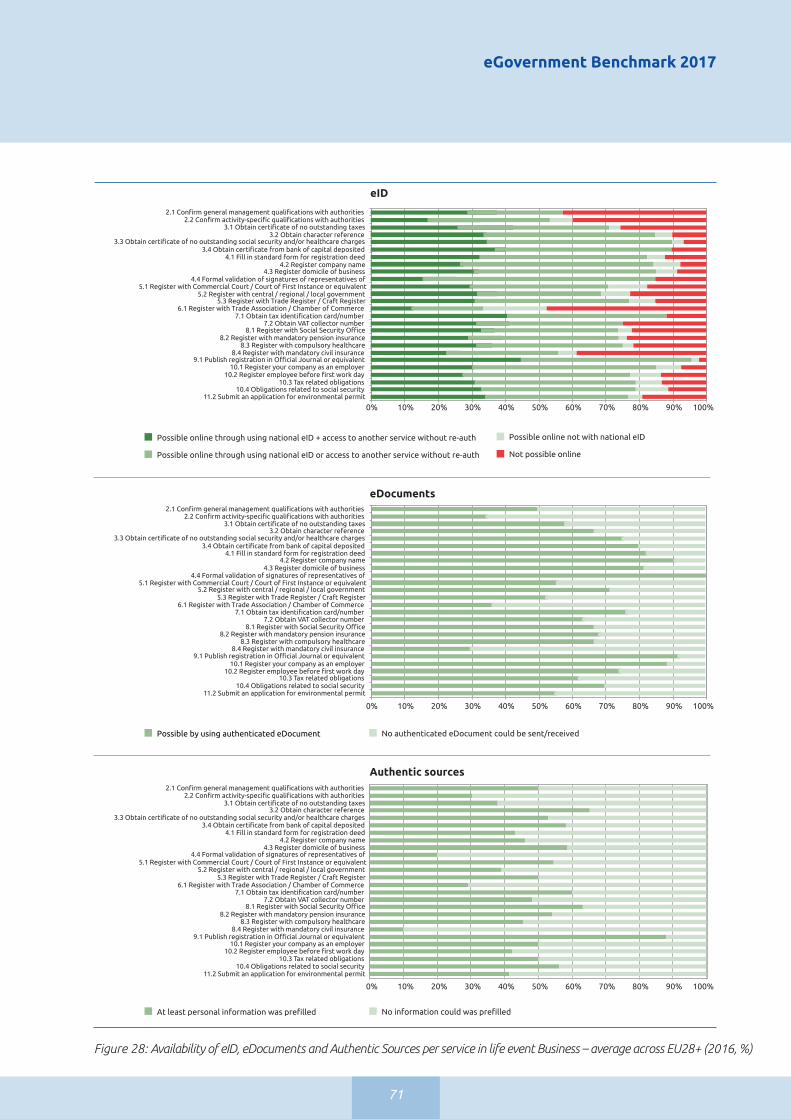
eGovernment Benchmark 2017
71
Figure 28: Availability of eID, eDocuments and Authentic Sources per service in life event Business – average across EU28+ (2016, %)
0% 10% 20% 30% 40% 50% 60% 70% 80% 90% 100%
0% 10% 20% 30% 40% 50% 60% 70% 80% 90% 100%
0% 10% 20% 30% 40% 50% 60% 70% 80% 90% 100%
2.1 Confirm general management qualifications with authorities 2.2 Confirm activity-specific qualifications with authorities
3.1 Obtain certificate of no outstanding taxes 3.2 Obtain character reference
3.3 Obtain certificate of no outstanding social security and/or healthcare charges 3.4 Obtain certificate from bank of capital deposited
4.1 Fill in standard form for registration deed 4.2 Register company name
4.3 Register domicile of business 4.4 Formal validation of signatures of representatives of
5.1 Register with Commercial Court / Court of First Instance or equivalent5.2 Register with central / regional / local government
5.3 Register with Trade Register / Craft Register 6.1 Register with Trade Association / Chamber of Commerce
7.1 Obtain tax identification card/number 7.2 Obtain VAT collector number
8.1 Register with Social Security Office 8.2 Register with mandatory pension insurance
8.3 Register with compulsory healthcare 8.4 Register with mandatory civil insurance
9.1 Publish registration in Official Journal or equivalent 10.1 Register your company as an employer
10.2 Register employee before first work day 10.3 Tax related obligations
10.4 Obligations related to social security 11.2 Submit an application for environmental permit
eID
Possible online through using national eID + access to another service without re-auth
Possible online through using national eID or access to another service without re-auth
Possible online not with national eID
Not possible online
Possible by using authenticated eDocument No authenticated eDocument could be sent/received
At least personal information was prefilled No information could was prefilled
Authentic sources
2.1 Confirm general management qualifications with authorities 2.2 Confirm activity-specific qualifications with authorities
3.1 Obtain certificate of no outstanding taxes 3.2 Obtain character reference
3.3 Obtain certificate of no outstanding social security and/or healthcare charges 3.4 Obtain certificate from bank of capital deposited
4.1 Fill in standard form for registration deed 4.2 Register company name
4.3 Register domicile of business 4.4 Formal validation of signatures of representatives of
5.1 Register with Commercial Court / Court of First Instance or equivalent5.2 Register with central / regional / local government
5.3 Register with Trade Register / Craft Register 6.1 Register with Trade Association / Chamber of Commerce
7.1 Obtain tax identification card/number 7.2 Obtain VAT collector number
8.1 Register with Social Security Office 8.2 Register with mandatory pension insurance
8.3 Register with compulsory healthcare 8.4 Register with mandatory civil insurance
9.1 Publish registration in Official Journal or equivalent 10.1 Register your company as an employer
10.2 Register employee before first work day 10.3 Tax related obligations
10.4 Obligations related to social security 11.2 Submit an application for environmental permit
eDocuments

72
Figure 29: Correlation online availability and Key Enabler Authentic Sources - life event Business by country (2016, EU28+, %)
AT
BE
BG
CH
CY
CZ
DE
DK
EE
EL
ES
FI
FR
HR
HU
IE
IS IT
LT
LU
LV
ME
MT
NL
NO
PL
PT
RO
SE
SI
SK TR
UK
EU28+
0
10
20
30
40
50
60
70
80
90
100
Aut
hent
ic s
our
ces
Online availability
0 10 20 30 40 50 60 70 80 90 100
Correlation online availability and Key Enabler Authentic Sources - life event Business by country (2016, EU28+, %)
RS
4
In 2016 there seems to be some weak correlation between authentic sources and online availability. Maximum scores in both dimensions are achieved by Malta and Portugal. Receiving excellent results on both dimensions were also Estonia, Spain, Sweden, Belgium, Norway as well as Luxembourg and Slovenia. Whereas in most countries the online availability of services clearly surpasses the use of Authentic Sources in service provision, in the Republic of Serbia the situation looks completely different: here, the use of Au-thentic Sources reaches 89%, whereas the online availability of services for business only reaches 55%.
However, overall on the online avail-ability dimension alone, the results look very promising, with only four countries scoring below 80%. Maximum scores are reached in 2016 by Malta, Portugal, Norway and Belgium, followed by Estonia, Spain, Sweden (99%), as well as Austria and Denmark (98%), and Lithuania and Latvia (97%).
4.6. Progress across EuropeWhen looking at the results per country, the top 5 is occupied by Malta, Sweden,
Denmark, Norway and Estonia. Following closely are Portugal, Austria, Lithuania, Spain, and Germany. Italy, Latvia, UK and Cyprus perform very well as well, with scores of 75% and above in this life event. When looking at the 50% mark, further examples can be given, with Serbia, Slova-kia and Bulgaria that have passed it.
Figure 30 below provides an overview of the performance of European countries in the life event Business, calculated as average of results for the four top level benchmarks.
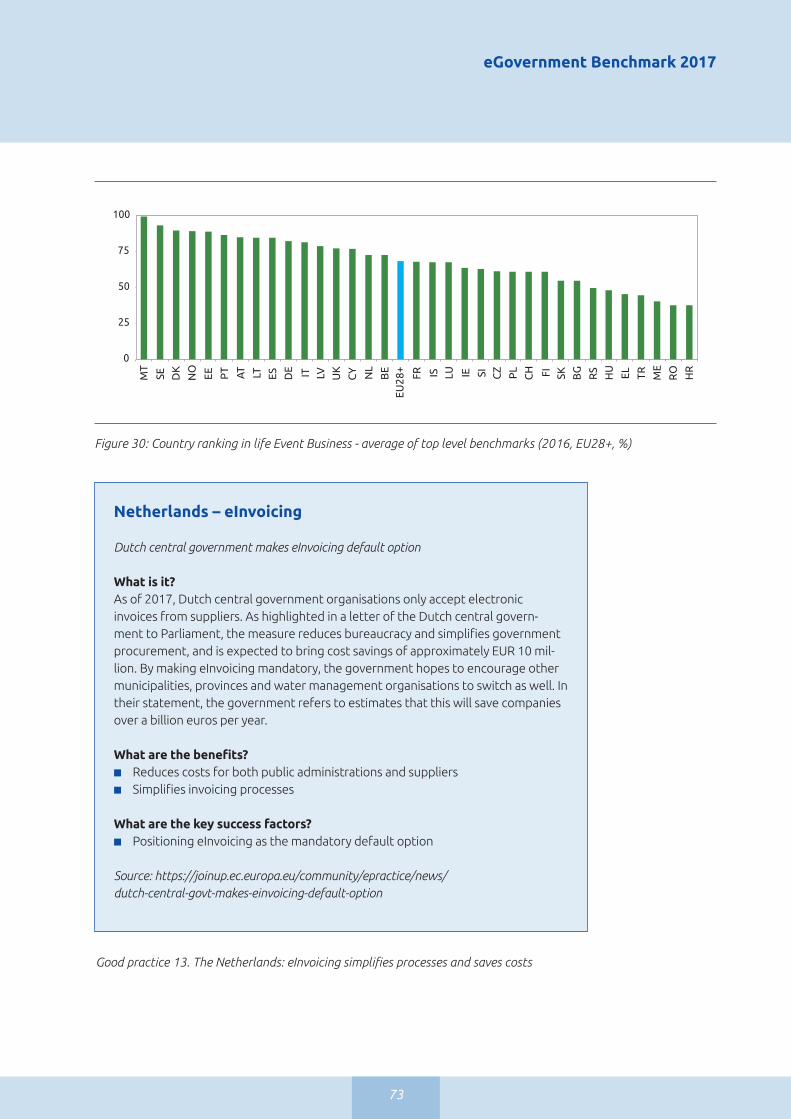
eGovernment Benchmark 2017
73
Figure 30: Country ranking in life Event Business - average of top level benchmarks (2016, EU28+, %)
0
25
50
75
100
MT
SE
DK
NO
EE
PT AT LT
ES
DE IT
LV
UK
CY
NL
BE
EU28
+
FR
IS
LU
IE
SI
CZ
PL
CH
FI
SK
BG
RS
HU
EL
TR
ME
RO
HR
Overall: bar chart with country ranking Life Event Business (average of top level benchmarks)
Netherlands – eInvoicing
Dutch central government makes eInvoicing default option
What is it?As of 2017, Dutch central government organisations only accept electronic invoices from suppliers. As highlighted in a letter of the Dutch central govern-ment to Parliament, the measure reduces bureaucracy and simplifies government procurement, and is expected to bring cost savings of approximately EUR 10 mil-lion. By making eInvoicing mandatory, the government hopes to encourage other municipalities, provinces and water management organisations to switch as well. In their statement, the government refers to estimates that this will save companies over a billion euros per year.
What are the benefits? ■ Reduces costs for both public administrations and suppliers■ Simplifies invoicing processes
What are the key success factors?■ Positioning eInvoicing as the mandatory default option
Source: https://joinup.ec.europa.eu/community/epractice/news/dutch-central-govt-makes-einvoicing-default-option
Good practice 13. The Netherlands: eInvoicing simplifies processes and saves costs

74
4
Cyprus – The DLS Portal
What is it?The Department of Lands and Surveys opens up its data in a new platform of e-services. e-Cadastre is finally here! The Department fully opens its doors to the outside world, with online services via the Internet, through its own platform of electronic services; the whole concept is based on a 24 hour available, fast and friendly service.
The New Internet Services Platform consists of four (4) main pillars:
1. A new and dynamic front page with information on the Department and Services.2. Ability to navigate to a property through an on-line free web application in real time.
The application uses the Geographical Information Systems of the Department, extending them through Web GIS capabilities. Various layers of information are avail-able, such as parcels, buildings, sheet/plans, aerial photography, planning zones, etc. The ability to identify each property is available with a.o. important parcel characteris-tics, relative scanned cadastral plans, the valuation as at 1.1.2013
3. Electronic Application Submission. An “e-Applications Dashboard” is available for every citizen, hosting personal profiling, monitoring of all registered application in the Department and providing the ability to launch and submit an application, purchase static maps, export data and upload data to the Department. The dashboard includes submission of applications, such as demarcation of boundaries, correction of errors and objection against the General Valuation, property searches and copies of title certificates, mortgage release by Banks. In association with the Local Government and the Sewerage Boards, export of taxation data is provided and an updating of new buildings characteristics and roads can be uploaded On-line. The selection and provi-sion of GIS data to the citizen is dynamic and specific services are provided to Private Surveyors and Valuers.
4. Adherence and Implementation of the INSPIRE Directive for Cyprus. The implementa-tion of the INSPIRE Directive for Cyprus through a specialised and dedicated INSPIRE GeoPortal platform integrated inside the DLS PORTAL is available. Network services, such as the INSPIRE GeoPortal of Cyprus make it possible to discover, transform, view and download spatial data and to invoke spatial data and e-commerce services from various Governmental sources, according to the European INSPIRE Directive.
What are the benefits? ■ The elimination of time-consuming bureaucratic procedures in the acceptance of vari-
ous applications■ The ease of access into DLS core data■ Client-oriented service ■ Transparency and enabling active citizen participation
What are the key success factors?■ What are the key success factors? ■ Combining multiple levels of data■ Integrating different functionalities
Good practice 14. Cyprus: e-Cadastre reduces burdens and increases citizen participation
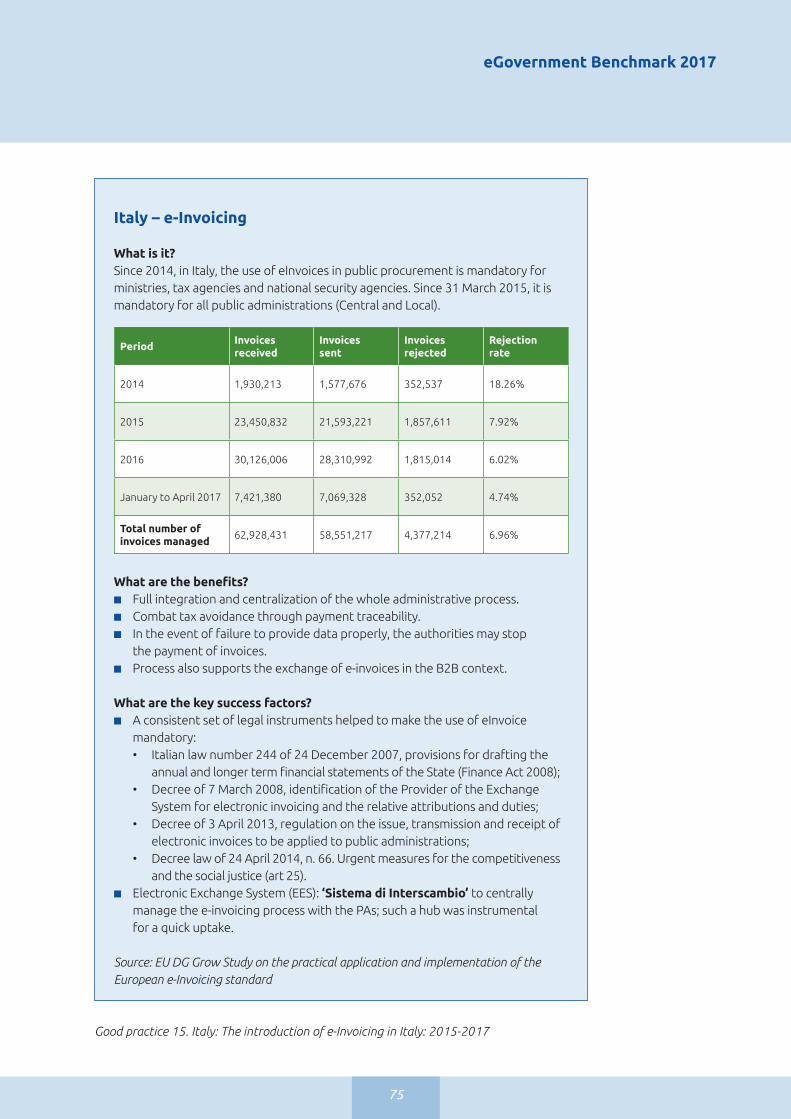
eGovernment Benchmark 2017
75
Italy – e-Invoicing
What is it?Since 2014, in Italy, the use of eInvoices in public procurement is mandatory for ministries, tax agencies and national security agencies. Since 31 March 2015, it is mandatory for all public administrations (Central and Local).
What are the benefits? ■ Full integration and centralization of the whole administrative process. ■ Combat tax avoidance through payment traceability. ■ In the event of failure to provide data properly, the authorities may stop
the payment of invoices.■ Process also supports the exchange of e-invoices in the B2B context.
What are the key success factors?■ A consistent set of legal instruments helped to make the use of eInvoice
mandatory:• Italian law number 244 of 24 December 2007, provisions for drafting the
annual and longer term financial statements of the State (Finance Act 2008);• Decree of 7 March 2008, identification of the Provider of the Exchange
System for electronic invoicing and the relative attributions and duties;• Decree of 3 April 2013, regulation on the issue, transmission and receipt of
electronic invoices to be applied to public administrations;• Decree law of 24 April 2014, n. 66. Urgent measures for the competitiveness
and the social justice (art 25).■ Electronic Exchange System (EES): ‘Sistema di Interscambio’ to centrally
manage the e-invoicing process with the PAs; such a hub was instrumental for a quick uptake.
Source: EU DG Grow Study on the practical application and implementation of the European e-Invoicing standard
Good practice 15. Italy: The introduction of e-Invoicing in Italy: 2015-2017
PeriodInvoices received
Invoices sent
Invoices rejected
Rejection rate
2014 1,930,213 1,577,676 352,537 18.26%
2015 23,450,832 21,593,221 1,857,611 7.92%
2016 30,126,006 28,310,992 1,815,014 6.02%
January to April 2017 7,421,380 7,069,328 352,052 4.74%
Total number ofinvoices managed
62,928,431 58,551,217 4,377,214 6.96%

76
4

77
Family

78
Family
5
5.1. Introduction to life eventWithin the broader goal of providing further impulses to public administrations in order to increase the overall online availability of their services, this year’s benchmark introduced a new life event surrounding Family Life. The domain comprises the assessment of services
This chapter assesses the results of the top-level benchmarks within the newly introduced life event Family. After a short introduction of the life event and a bird’s eye view of the key findings, the scores of the four top-level benchmarks for this domain will be presented in more detail.
that are typically aimed at young families such as: marriage (or other partnerships), birth of a child and related (financial) rights, and also looking at the financial situation at a later age. This life event is comprised of three stages, and a total of eleven dimensions of analysis that will be assessed against their performance along the four top-level benchmarks.
Life events are measured biennially to allow countries to implement im-provements. The Family life event was measured for the first time in 2016, with a new measurement following in 2018.
Key insights – Life Event Family
■ Family Life represents the lowest scoring life event in 2016 when compared to the other three life events measured in 2016.
■ User Centricity is the best performing indicator within this domain, with an overall score of 73%. Online availability of services shows moderate results of 71%, with an overall usability of 84%. With results at 60%, mobile friendliness represents the only indicator in which the life event Family outranks the other three life events of 2016.
■ Transparency of government in this life event needs significant improvement. With an overall score of 49%, this domain scores the lowest, at a visible difference to the other life events. A modest performance is noticed with regard to Transparency of Service Delivery (35%). Better results are registered in terms of Transparency of Public Organisations (68%) and Transparency of Personal Data (45%).
■ The use of Key Enablers in this life event performs modestly, with an average result of 37%. When reviewing the scores of each Key Enablers, eDocuments ranks highest, with a score of 45%, followed by the use of eID (30%) and Authentic Sources (22%). The use of Digital Post in this life event is more prominent, with an overall score of 54%.
■ The most mature service in this domain is the online calculation of retirement benefits. At the opposite end, the marriage registration appears to be the least mature service interaction.
■ Overall, Family Life is a young life event which appears to have not gained the deserved attention from public administrations across Europe. The 2016 results however should be seen as baseline, against which the progress in this life event can be measured.

eGovernment Benchmark 2017
79
5.2. User Centricity
5.2.1. Online availabilityIn 2016 for the EU28+ average, the overall online availability of eGovernment ser-vices in this domain reached 71%. In less than 40% of cases in this life event users can conduct the interactions online. In another 40% of instances, they are able to find the necessary information online. However, there is still a high degree of dispersion, with information available online on different websites. In only 2% of cases neither the service nor the informa-tion are related to the given interaction available via the Internet.
When breaking down these numbers and reviewing the way in which services are provided online for each interaction in the life event Family, the results are mixed. Good results in terms of online availability of services can be observed in only 6 of the 11 observed interactions, with a level of online availability of service of at least 50% here. In the other half of interac-tions, online availability of services barely reaches a score of 20%. This life event consists of three sections: birth, marriage, and retiring. The discrepancies can be observed both across the three sections and within each section. The most mature stage appears to be along the interactions taking place at a later age (e.g. retirement life stage). Here, the interactions show-case good results. In 60% of cases across Europe, retirement benefits applications available online. In the same vein, 90% of services to calculate pensions are avail-able online through a simulation. The low-est performing stage appears to be the interaction regarding marriage (stage 2), with a mere 17% of online availability.
With regard to automation, there are only three interactions in which automation of services was already pursued, albeit to modest extents. Best performing here are the interactions on stage 1 regarding the birth of a child, with the application for child allowance that shows a 20% maturity
level and the acknowledgment of a child with public administrations scoring at 6%. The interaction in stage 3 (retirement) con-cerning the retirement benefits application follows sluggishly, with an overall degree of automation across EU28+ on 2%.
In this light and as Figure 31 also high-lights, the services targeted at young families could most certainly profit from a higher level of online availability of services. This would come to the aid of customers in this life event that expect a resource-effi-cient interaction with their public adminis-trations.
5.2.2. Mobile friendlinessWith regard to the mobile friendliness of its portals and services, this domain ranks highest with an average score in Europe of 60% and outperforms the more established domains such as Business or Job. Figure 32 provides an overview of the Euro-pean ranking in terms of mobile-friendliness of services in the life event Family. Here, Denmark and Malta are ‘best in class’ with maximum scores, closely followed by the Netherlands, the UK, Luxembourg, Sweden and Norway. When looking at the top 10 ranking, the Nordic countries seem to have set a strong focus on User Centricity (in particular in terms of mobile friendliness) for services targeted at young families. A pleasant surprise comes from Croatia, which also reaches the 75% in 2016.
In terms of mobile friendliness of portals, as Figure 33 also shows, the situation across Europe appears even more promising, with now eleven European countries (Austria, Switzerland, Denmark, France, Italy, Malta, Norway, Poland, Portugal, Sweden and the United Kingdom)obtaining maximum scores in 2016. When looking at next best scores, Turkey, Belgium, the Netherlands and Ser-bia achieve scores above 75%
In terms of achieving mobile friendliness of both services and portals, thus combining the results presented in figure 31 and figure 32, two countries have reached maximum
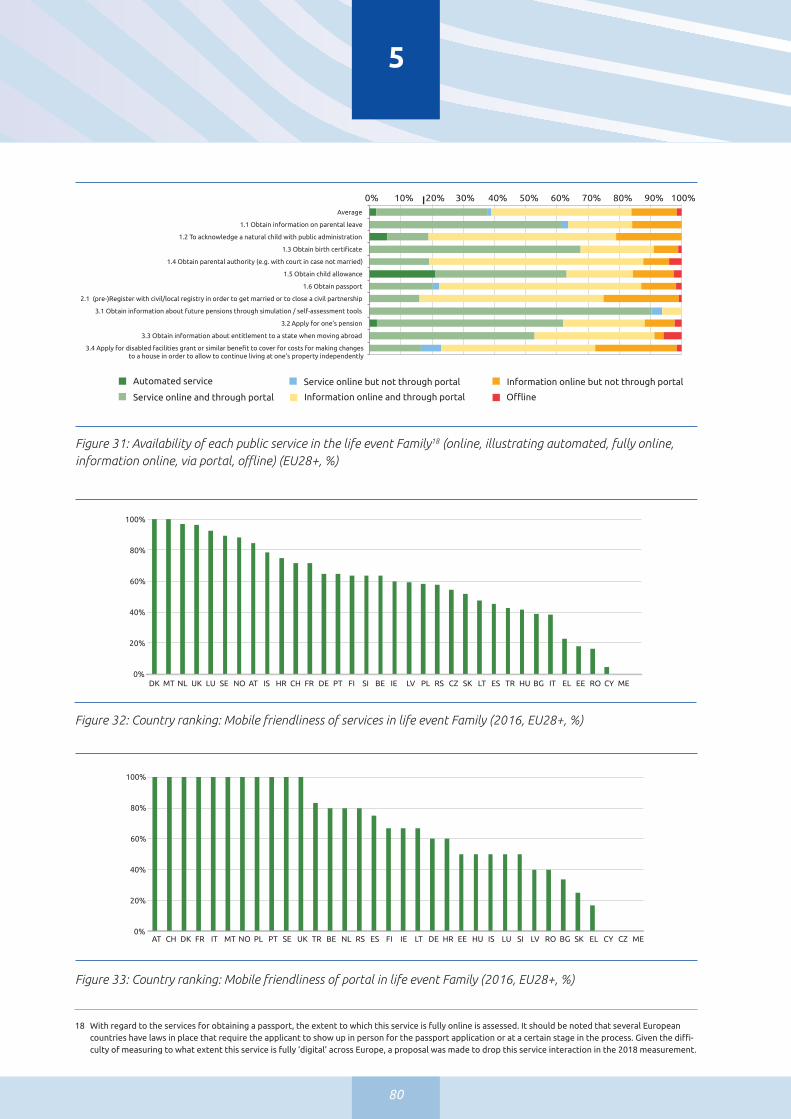
80
5
Figure 32: Country ranking: Mobile friendliness of services in life event Family (2016, EU28+, %)
Figure 33: Country ranking: Mobile friendliness of portal in life event Family (2016, EU28+, %)
AT CH DK FR IT MT NO PL PT SE UK TR BE NL RS ES FI IE LT DE HR EE HU IS LU SI LV RO BG SK EL CY CZ ME 0%
20%
40%
60%
80%
100%
120%
DK MT NL UK LU SE NO AT IS HR CH FR DE PT FI SI BE IE LV PL RS CZ SK LT ES TR HU BG IT EL EE RO CY ME 0%
20%
40%
60%
80%
100%
120%
Figure 31: Availability of each public service in the life event Family18 (online, illustrating automated, fully online, information online, via portal, offline) (EU28+, %)
0% 10% 20% 30% 40% 50% 60% 70% 80% 90% 100%
Average
1.1 Obtain information on parental leave
1.2 To acknowledge a natural child with public administration
1.3 Obtain birth certificate
1.4 Obtain parental authority (e.g. with court in case not married)
1.5 Obtain child allowance
1.6 Obtain passport
2.1 (pre-)Register with civil/local registry in order to get married or to close a civil partnership
3.1 Obtain information about future pensions through simulation / self-assessment tools
3.2 Apply for one’s pension
3.3 Obtain information about entitlement to a state when moving abroad
3.4 Apply for disabled facilities grant or similar benefit to cover for costs for making changesto a house in order to allow to continue living at one’s property independently
How services are made available by country (Family, 2016, %)
Automated service
Service online and through portal Offline
Service online but not through portal
Information online and through portal
Information online but not through portal
18 Withregardtotheservicesforobtainingapassport,theextenttowhichthisserviceisfullyonlineisassessed.ItshouldbenotedthatseveralEuropeancountrieshavelawsinplacethatrequiretheapplicanttoshowupinpersonforthepassportapplicationoratacertainstageintheprocess.Giventhediffi-culty of measuring to what extent this service is fully ‘digital’ across Europe, a proposal was made to drop this service interaction in the 2018 measurement.

eGovernment Benchmark 2017
81
Figure 34: Transparency of Service Delivery per service in life event Family (2016, EU28+, %)
34
39
26
52
36
25
46
22
0 20 40 60
1.2 To acknowledge a natural child with public administration
1.3 Obtain birth certificate
1.4 Obtain parental authority (e.g. with court in case not married)
1.5 Obtain child allowance
1.6 Obtain passport
2.1 (pre-)Register with civil/local registry in order to get married or to close a civil partnership
3.2 Apply for one’s pension
3.4 Apply for disabled facilities grant or similar benefit to cover for costs for makingchanges to a house in order to allow to continue living at one’s property independently
Transparency: bar chart illustrating level of transparency of service delivery per service (Life Event: Family)
scores -- Malta and Denmark. Next in place is the UK, with a score of 80% on the mobile friendliness of its services and 100% on the mobile friendliness of its portals.
5.3. TransparencyIn terms of transparency of Government, the life event Family scores the lowest among the four life events in 2016, with an average of 50% along the three dimensions (personal data, public organisations and service delivery). When looking one level deeper, the weakest performance is regis-tered by Transparency of Service Delivery, with only 36%.
Transparency of Service Delivery (i.e. the extent to which the user is informed about the progress made in the processing of this application) seems to be a neglected area, with results that range from 22% to 52%. The best scoring interaction reaches 52%, but most interactions score close to the 30% line. An overview of the scores meas-ured within the eight assessed interactions on this benchmark is provided by Figure 34 below. As the illustration shows, this important top-level benchmark shows very modest results in the life event Family.
As the cross-border dimension was not as-sessed, the next section will discuss the use of Key Enablers in the life event Family.
5.4. Key EnablersThe results in the life event Family look less
encouraging when compared to the other life events, with a fairly low availability of eID, eDocuments and Authentic Sources in the eight interactions observed here. Figure 35 depicts the extent to which the three Key Enablers are embedded in the service provi-sion in this domain.
On the Key Enabler eID, all interactions still showcase examples in which no electronic Identification is possible online. All interac-tions analysed here provide entrepreneurs with the possibility to authenticate online via their national electronic Identification, albeit to different extents -- ranging from modest to good. Three of eight interactions stand out positively from the other services. Best performers in this category are the interac-tions regarding the application for a pension and obtaining a child allowance, followed by obtaining a birth certificate, with a good availability of Key Enablers in the service provision. ‘Best in class’ across all three Key Enablers is the interaction concerning a child allowance for example, in which the use of an eID is possible in over 62% of cases across Europe, with a similar result for the use of authenticated eDocuments and a level of nearly 40% of implementation of the ‘Once-only Principle’ (in 40% of the cases in this service interaction, the personal information was prefilled).
With regard to the use of Authentic Sources – as an indicator of the degree of implementation of the ‘Once-Only

82
5
Principle’, the results are modest at best, with a mere 25% of interactions showing a degree of implementation of over 35%. As a European average, this result is quite low.
In this regard, European public administra-tions most certainly need to accelerate their efforts, in order to improve the user experi-ence along this domain’s interactions.
Figure 35: Availability of eID, eDoc and Authentic Sources per service in life event Family – average across EU28+ (2016, %)
1.2 To acknowledge a natural child with public administration
1.3 Obtain birth certificate
1.4 Obtain parental authority (e.g. with court in case not married)
1.5 Obtain child allowance
1.6 Obtain passport
2.1 (pre-)Register with civil/local registry in order to get marriedor to close a civil partnership
3.2 Apply for one’s pension
3.4 Apply for disabled facilities grant or similar benefit to cover for costs
0% 10% 20% 30% 40% 50% 60% 70%
80% 90% 100%
1.2 To acknowledge a natural child with public administration
1.3 Obtain birth certificate
1.4 Obtain parental authority (e.g. with court in case not married)
1.5 Obtain child allowance
1.6 Obtain passport
2.1 (pre-)Register with civil/local registry in order to get marriedor to close a civil partnership
3.2 Apply for one’s pension
3.4 Apply for disabled facilities grant or similar benefit to cover for costs
At least personal information was prefilled
eID
0% 10% 20% 30% 40% 50% 60% 70% 80% 90% 100%
Possible online through using national eID + access to another service without re-auth
Possible online through using national eID or access to another service without re-auth
Possible online not with national eID
Not possible online
eDocuments
Possible by using authenticated eDocument No authenticated eDocument could be sent/received
No information was prefilled
Authentic sources

eGovernment Benchmark 2017
83
Moving forward, the relationship between online availability of services and the use of the Key Enabler Authentic Sources in service provision along the life event Family was also analysed. Since the indica-tor of online services only contains basic services we calculated the score for online availability using only basic services as well. This allows us to make a proper com-parison between the two indicators.
Figure 36 below illustrates the extent to which countries focused on bringing services online, in comparison to improv-ing the user experience in terms of the availability of pre-filled forms (here by analysing the extent to which Authentic sources are used across Europe). Pre-fill-ing forms is one element to increase the experience of users when handling online public forms.
When looking at the landscape in Europe, it appears that only Malta (best performer on both indicators) and Lithuania are giving equal attention to both the online availability of services and the user experi-ence in terms of the availability of pre-filled forms. Both countries are positioned on or quite close to the reference line.
Figure 36: Correlation Online Availability and Key Enabler Authentic Sources in life event Family (2016, %)
0
10
20
30
40
50
60
70
80
90
100
0 10 20 30 40 50 60 70 80 90 100
Aut
hent
ic s
our
ces
Online availability
Correlation Online Availability and Key Enabler Authentic Sourcesin life event Family (2016, %)
NINL
SI
LT
DKFINOSEAT
IS EE
PT
IT
BE LV DEHU
LURSHR
ME RO TR CY CZ FIELUK SKBG IE
EU28+
MT
ES
The results depicted below emphasise the observation that there is a generally good online availability of services in the life event Family. However, there is basically no correlation between the two indica-tors under scrutiny here. In this life event, European countries appear to have set their focus on quantity (through online availability) rather than quality of services (in terms of pre-filling forms). Bringing services online appears to be put forward, while actions to enhance the user experi-ence along the service interactions (in this example, the use of the Key Enabler Authentic Sources) are deprioritised. This holds true in particular for the countries situated in the bottom right quadrant, where actually almost all European countries are located in terms of scoring. For the few countries located in the bot-tom left quadrant, there appears to be a stronger need for prioritisation of both online availability and user experienced (here the use of Authentic Sources).
5.5. Progress across EuropeThe top performer on this life event is Malta, almost reaching the maximum score, followed at a visible distance by Denmark, Norway and Lithuania with
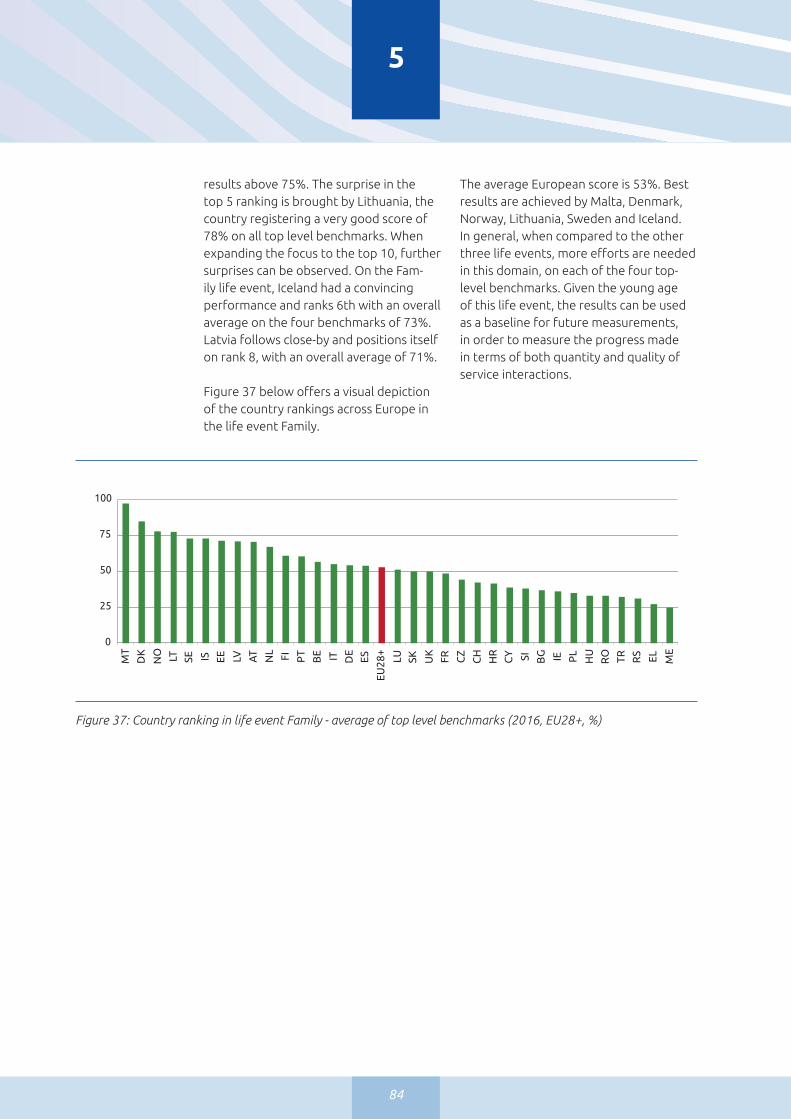
84
results above 75%. The surprise in the top 5 ranking is brought by Lithuania, the country registering a very good score of 78% on all top level benchmarks. When expanding the focus to the top 10, further surprises can be observed. On the Fam-ily life event, Iceland had a convincing performance and ranks 6th with an overall average on the four benchmarks of 73%. Latvia follows close-by and positions itself on rank 8, with an overall average of 71%.
Figure 37 below offers a visual depiction of the country rankings across Europe in the life event Family.
5
Figure 37: Country ranking in life event Family - average of top level benchmarks (2016, EU28+, %)
The average European score is 53%. Best results are achieved by Malta, Denmark, Norway, Lithuania, Sweden and Iceland. In general, when compared to the other three life events, more efforts are needed in this domain, on each of the four top-level benchmarks. Given the young age of this life event, the results can be used as a baseline for future measurements, in order to measure the progress made in terms of both quantity and quality of service interactions.
MT
DK
NO
LT
SE
IS
EE
LV
AT
NL FI
PT
BE IT
DE
ES
EU28
+
LU
SK
UK
FR
CZ
CH
HR
CY
SI
BG
IE
PL
HU
RO
TR
RS EL
ME
Overall: bar chart with country ranking Life Event Family (average of top level benchmarks)
0
25
50
75
100
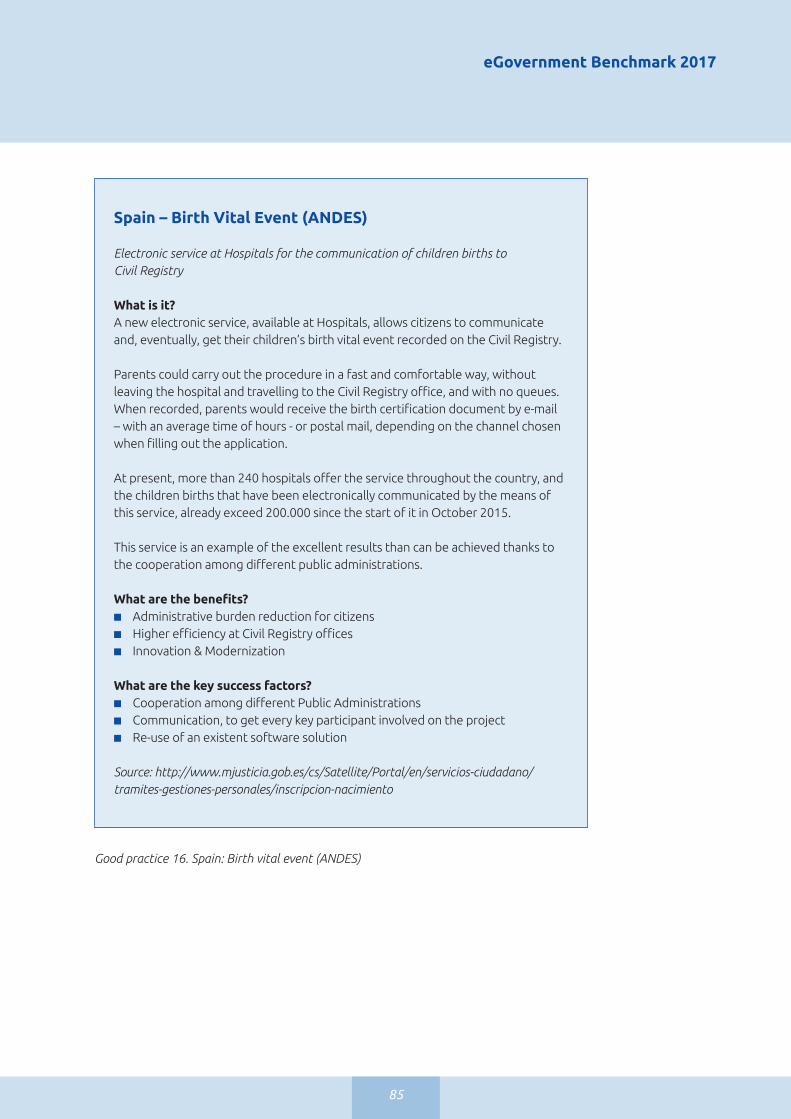
eGovernment Benchmark 2017
85
Spain – Birth Vital Event (ANDES)
Electronic service at Hospitals for the communication of children births to Civil Registry
What is it?A new electronic service, available at Hospitals, allows citizens to communicate and, eventually, get their children’s birth vital event recorded on the Civil Registry.
Parents could carry out the procedure in a fast and comfortable way, without leaving the hospital and travelling to the Civil Registry office, and with no queues. When recorded, parents would receive the birth certification document by e-mail – with an average time of hours - or postal mail, depending on the channel chosen when filling out the application.
At present, more than 240 hospitals offer the service throughout the country, and the children births that have been electronically communicated by the means of this service, already exceed 200.000 since the start of it in October 2015.
This service is an example of the excellent results than can be achieved thanks to the cooperation among different public administrations.
What are the benefits? ■ Administrative burden reduction for citizens■ Higher efficiency at Civil Registry offices■ Innovation & Modernization
What are the key success factors?■ Cooperation among different Public Administrations■ Communication, to get every key participant involved on the project■ Re-use of an existent software solution
Source: http://www.mjusticia.gob.es/cs/Satellite/Portal/en/servicios-ciudadano/ tramites-gestiones-personales/inscripcion-nacimiento
Good practice 16. Spain: Birth vital event (ANDES)

86
5
Turkey – Integrated Social Assistance Information System
Turkey joints all social assistance programs on a single platform
What is it?Turkey’s Integrated Social Assistance Information System (ISAS) is an e-govern-ment system that electronically facilitates all steps related to the management of social assistance, including the application, identification of eligibility, dis-bursement of funds, and auditing. ISAS integrates data from 22 different public institutions and provides 112 web-based services in one easily accessible online portal.
Through the development of ISAS, Turkey standardized, integrated, and con-verted its previously paper-based social assistance procedures into an electronic system. Citizens are currently registered for social assistance via ISAS, where their information is corroborated with several government databases and data that are collected through a household visit. The data collected is used to create a poverty profile that is then used to determine eligibility. Since 2010, ISAS has processed 30 million citizens’ applications for social assistance and completed 340 million assistance transactions totalling US$13 billion (equivalent to approxi-mately 39 billion TL).
What are the benefits? ■ Social assistance decisions can now be made by assessing the welfare of the
whole household rather than the individual applicant Client-oriented service ■ All social assistance services are consolidated under one single structure with
a defined procedure for determining eligibility and disbursement■ ISAS has reduced the time and costs related to social assistance provision.■ Information sharing and communication across institutions involved in social
assistance has improved.■ The system has become more transparent and reduces the duplication of
social assistance benefits.
What are the key success factors?■ Unique National ID Numbers■ Strong Political Support■ Integration■ Customized Design Approach■ Modular and Flexible IT Infrastructure
Good practice 17. Turkey: Integrated social assistance information system

87
Losing and finding a job

88
Losing and finding a Job
6
6.1 Introduction to life eventThis section discusses the results for the life event Losing and finding a job and looks at the progress since the last meas-urement in 2014. Similar to the life event Family Life, this domain was also assessed along three dimensions: User centricity (the extent to which service transactions can be undertaken online and their mobile friendliness), Transparency (observed along three indicators: personal data,
service delivery, public organisations) as well as the use of Key Enablers (eID, eDocu-ments, Authentic Sources and Digital Post) in service provision.
6.2 User CentricityOn this benchmark, the numbers depict the extent to which European public administrations are offering user-centric services for jobseekers. In line with the pre-vious analyses for the life events Business
Key insights – Life Event Losing and Finding a Job
■ The Job Life event was the second best scoring domain in 2016, after the business one, with some scores even ranking highest, when compared across the three life events. Overall, this life event has experienced a steady increase since the first measurement of 2012.
■ The User Centricity in this domain reached 81%, with an online availability of services in this life event at 83% and an overall usability across Europe of 90%. In 2016, more services in this domain were accessible via the internet, a boost of 6 points compared to 2014. Fourteen European countries have reaching scores of over 90% on this dimension, four of which even reaching a 99% to 100% availability. In terms of their mobile-friendliness, services and portals in this domain still need improvement, with only 1 in 2 being accessible via the mobile phone.
■ On the Transparency dimension, this domain reached a degree of maturity of 62%. Transparency of Service Delivery reached 50% in 2016, a solid increase of 10 points compared to 2014. Transparency of Public Organisations was the best performing indicator across all life events, with a very good score of 82% (+6 points vs 2014). Transparency of Personal Data registered a maturity level of 56% in 2016.
■ The use of the Key Enablers has taken up speed compared to 2014. While the availability of eDocuments in service provision reached 62% (+3 points vs 2014), the eID reached 57% (+1 point vs 2014). At the same time, the use of Authentic Sources experienced a solid boost from 44% in 2014, to 52% in 2016.
■ Services surrounding the orientation on the job market and the overall job search were the most mature interactions in this domain, with scores above the 90% line. The least mature are the interactions in stage 3 (providing proof of active job search and obtaining tax refunds), with an online service availability of only 40%.

eGovernment Benchmark 2017
89
and Family, the present chapter presents in more detail the results on the indicators online availability of services and mobile-friendliness in the life event Job. Similar to 2014, a total of 22 interactions along five stages were assessed. The overall User Centricity of services in this domain reached – the second-best score amongst all domains.
6.2.1 Online availability In 2016 more services for jobseekers were available online. With a score of 83%, this domain registered a solid increase of 6 points compared to 2014.
Figure 38 below illustrates the way in which interactions in this domain are made possible for customers. The bar chart shows how public services in this life event are available: online and fully automated, fully online, information online, informa-tion via portal, and offline.
Overall, progress has been made across all interactions, with a higher extent of ser-vices accessible online in 2016, via portal or via specific website. There are still some in-teractions that are slightly below the 50% mark. However, this amount is becoming
lower by each measurement, with even the lowest scoring interaction experiencing a frog leap of 10 points when compared to 2014.
Zooming deeper into the stages, the services around the ‘Finding a job’ (inter-actions in stages 4 and 5) are the most developed in terms of their online availabil-ity, reaching levels as high as 97% (services around stage 4: online job search). Com-pared to 2014, the average score on all in-teractions in stage 4 has improved. Visible progress has also been registered by the first interactions in stage 1, with the reg-istration as unemployed now scoring 65% on online availability, compared to 55% in 2014. The registration for unemployment benefits has reached a 68% online availa-bility, an increase from 55% in the previous measurement. Overall, this is an encourag-ing development that underlines the fact that European governments are seeking to do more to support the citizens that are at this stage in their lives.
6.2.2 Mobile friendlinessWith regard to the mobile friendliness of services, Malta positioned itself at the top of the chart with maximum scores and is
Figure 38: How services are made available for the Losing and finding a job life event (2016, EU28+, %)
0% 10% 20% 30% 40% 50% 60% 70% 80% 90% 100% Average
1.1 Registering as unemployed
1.2 Registering for unemployment benefits
1.3 Accessing personalized information
2.1 Doing a means test
2.2 Being assisted by a public officer
2.3 Understanding what documents are required when applying for additional benefits
2.4 Ensuring continuity of medical insurance
2.5 Ensuring continuity of pension payments
2.6 Obtaining guidance related to housing
2.7 Accessing Debt counselling services
2.8 Accessing health promotion programs
2.9 Obtaining guidance in case on invalidity, sickness, employment injuries
2.10 Obtaining financial aid for starting up as a self-employed
2.11 Accessing social welfare appeals
3.1 Provide evidence that you are looking for work
3.2 Obtaining a tax refund or any other tax-related benefits
4.1 Orientation on labor market
4.2 Job search
4.3 Receiving job alerts
4.4 Setting up a personal space
5.1 Subscribing to training and education programmes
5.2 Subscribing to vacational/careers advice
How services are made available by country (Job, 2016, %)
Automated service
Service online and through portal Offline
Service online but not through portal
Information online and through portal
Information online but not through portal
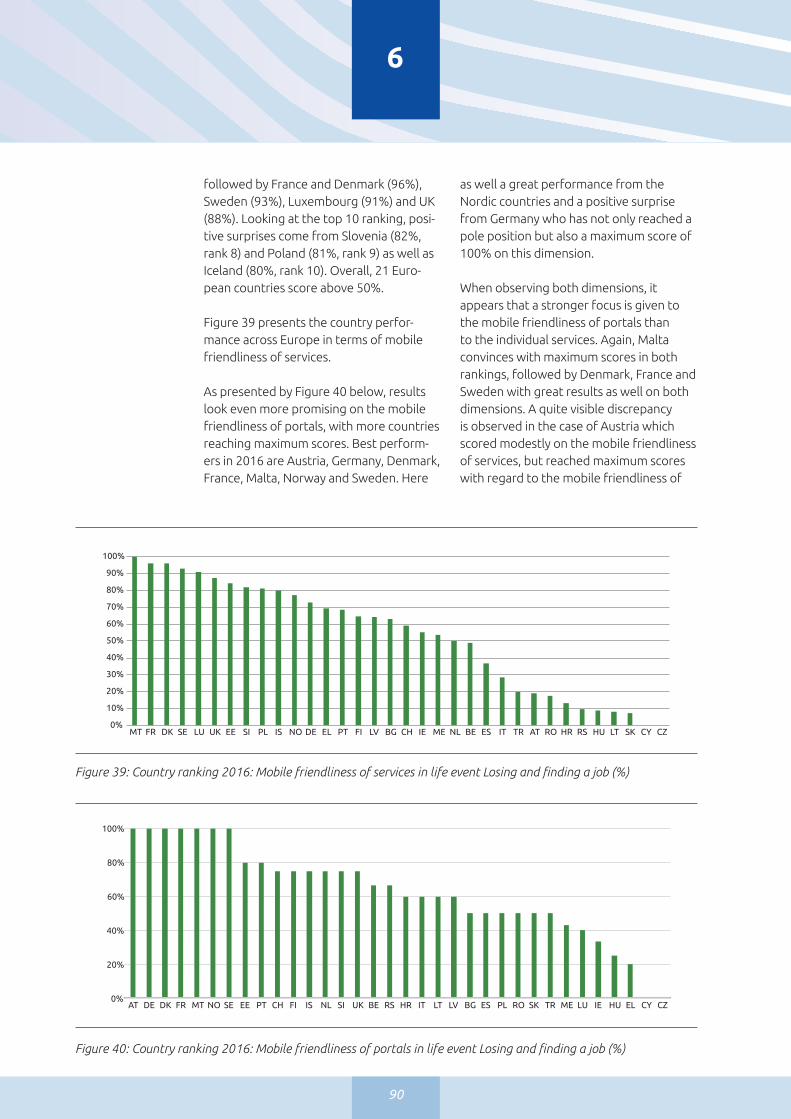
90
6
followed by France and Denmark (96%), Sweden (93%), Luxembourg (91%) and UK (88%). Looking at the top 10 ranking, posi-tive surprises come from Slovenia (82%, rank 8) and Poland (81%, rank 9) as well as Iceland (80%, rank 10). Overall, 21 Euro-pean countries score above 50%.
Figure 39 presents the country perfor-mance across Europe in terms of mobile friendliness of services.
As presented by Figure 40 below, results look even more promising on the mobile friendliness of portals, with more countries reaching maximum scores. Best perform-ers in 2016 are Austria, Germany, Denmark, France, Malta, Norway and Sweden. Here
Figure 39: Country ranking 2016: Mobile friendliness of services in life event Losing and finding a job (%)
Figure 40: Country ranking 2016: Mobile friendliness of portals in life event Losing and finding a job (%)
AT DE DK FR MT NO SE EE PT CH FI IS NL SI UK BE RS HR IT LT LV BG ES PL RO SK TR ME LU IE HU EL CY CZ 0%
20%
40%
60%
80%
100%
120%
0%
10%
20%
30%
40%
50%
60%
70%
80%
90%
100%
MT FR DK SE LU UK EE SI PL IS NO DE EL PT FI LV BG CH IE ME NL BE ES IT TR AT RO HR RS HU LT SK CY CZ
as well a great performance from the Nordic countries and a positive surprise from Germany who has not only reached a pole position but also a maximum score of 100% on this dimension.
When observing both dimensions, it appears that a stronger focus is given to the mobile friendliness of portals than to the individual services. Again, Malta convinces with maximum scores in both rankings, followed by Denmark, France and Sweden with great results as well on both dimensions. A quite visible discrepancy is observed in the case of Austria which scored modestly on the mobile friendliness of services, but reached maximum scores with regard to the mobile friendliness of

eGovernment Benchmark 2017
91
Figure 41: Transparency of Service Delivery per service in life event Job – average across EU28+ (%)
57
50
58
58
34
38
41
58
0 40 20 80 60 100
1.1 Registering as unemployed
1.2 Registering for unemployment benefits
2.4 Ensuring continuity of medical insurance
2.5 Ensuring conituity of pension payments
2.11 Accessing social welfare appeals
3.1 Provide evidence that you are looking for work
3.2 Obtaining a tax refund or any other tax-related benefits
4.2 Job search
Figure 41: Transparency of Service Delivery per service in life event Job – average across EU28+ (%)
its portals. An opposite focus is shown by Luxembourg, where great results were achieved in terms of services, and only a modest performance of mobile-friendly use of portals. At the same time, Norway and Germany appear to have focused more strongly on the mobile user experience of their portals, and less on that of their services. Slovenia represents the nice surprise in both rankings with balanced scores of over 80% on both dimensions.
6.3 TransparencyWith regard to this benchmark, three dimensions were assessed: personal data, service delivery and public administrations. In 2016 appears high discrepancy in terms of scoring of the individual indicators. While the information on public admin-istration becomes more and more trans-parent – reaching an excellent 82%, the service delivery only reached the 50% line. Similarly modest are the results of Trans-parency of Personal Data, which scored 56%. While jobseekers appear to have clear information online on the administrations (agencies) providing the services in this domain, they seem to be left in the dark in 1 of 2 situations, with regard to the pro-cessing times of their applications as well as to whom accessed their data.
In all life events but more stringently in this domain, Transparency of Service Delivery is crucial, as it provides certainty and security to the ones who are going through the experience of a job loss. It appears that in
2016 as well, European public administra-tions have struggled most with transpar-ency of their service delivery – despite the 10 point increase in comparison to the 40% levels of 2014.
Figure 41 zooms into the service interac-tions and illustrates the European averages on the eight interactions under scrutiny here. With regard to how transparent service delivery in this life event is, results depict a moderate to fairly optimistic pic-ture. Four of the interactions were close to 60% in 2016. More modest results are reg-istered with regard to appeals (e.g. welfare appeals) which only measured 34%. In this light, more efforts are needed to ensure that transparency regarding processing times is ensured by public administrations across Europe.
As cross-border services are not applicable in this domain, Cross-border Mobility was not measured. The next section will look into the extent to which Key Enablers are available along the interactions of this life event.
6.4 Key EnablersZooming into the availability of eID, eDocu-ments and Authentic Sources along the service interactions in this life event, the results are fairly good, reaching again the 2012 levels. As a note, in the 2014 meas-urement, these three Key Enablers have experienced (significant) fall-backs. In 2016, the results look again encouraging,

92
6
with an improvement of 1 point compared to 2014 on the availability of eID (now at 57%), of 3 points on the use of eDocuments (now at 62%) and a real frog- leap on the use of Authentic Sources (at 52% from 44%).
The provision of Key Enablers in this life event helps towards redirecting users’ re-sources to the more relevant aspects in this life event, such as the re-entry onto the job market. The availability of the eID, eDocu-
Figure 42: Availability of eID, eDocuments and Authentic Sources per service in life event Job – average across EU28+ (2016, %)
0% 10% 20% 30% 40% 50% 60% 70% 80% 90% 100%
0% 10% 20% 30% 40% 50% 60% 70% 80% 90% 100%
0% 10% 20% 30% 40% 50% 60% 70% 80% 90% 100%
1.1 Registering as unemployed
1.2 Registering for unemployment benefits
1.2 Registering for unemployment benefits
2.4 Ensuring continuity of medical insurance
2.5 Ensuring continuity of pension payments
2.11 Accessing social welfare appeals
3.1 Provide evidence that you are looking for work
3.2 Obtaining a tax refund or any other tax-related benefits
4.2 Job search
1.1 Registering as unemployed
2.4 Ensuring continuity of medical insurance
2.5 Ensuring continuity of pension payments
2.11 Accessing social welfare appeals
3.1 Provide evidence that you are looking for work
3.2 Obtaining a tax refund or any other tax-related benefits
4.2 Job search
1.2 Registering for unemployment benefits
1.1 Registering as unemployed
2.4 Ensuring continuity of medical insurance
2.5 Ensuring continuity of pension payments
2.11 Accessing social welfare appeals
3.1 Provide evidence that you are looking for work
3.2 Obtaining a tax refund or any other tax-related benefits
4.2 Job search
eID
Possible online through using national eID + access to another service without re-auth
Possible online through using national eID or access to another service without re-auth
Possible online not with national eID
Not possible online
eDocuments
Possible by using authenticated eDocument No authenticated eDocument could be sent/received
Authentic sources
At least personal information was prefilled No information was prefilled

eGovernment Benchmark 2017
93
ments and Authentic Sources in particular ensures a faster service interaction and help save time in particular on the side of the job seeker.
Figure 42 presents the average availability of each Key Enabler, per each interaction examined under this life event.
As the graph also shows, in general eID can be used reasonably well in all interactions. Ensuring continuity of contributions are the most mature interactions in this regard, with scores along the 80% line. All services show cases in which no electronic Identifica-tion is possible, albeit the shares differ from 5% (job search) to 35% (obtaining a tax refund). In particular, in the case of appeals, financial services (social welfare refund) and registrations (e.g. for unemployment benefits) there is still 1 in 3 cases in which the use of the eID is not possible online. As regards the use of eDocuments, there appears to be a high level of use in the inter-actions that deal with ensuring continuity of contribution payments, as well as with regard to job search. In terms of the use of Authentic Sources, the results are relatively good, with the highest scoring interaction being the continuity of medical insurance (close to the 80% line), followed by the
services surrounding the pension payments (63%). The lowest use rate of Authentic Sources appears in the service regarding the access to social welfare appeals (slightly above 20%).
Going one step further, and analysing the relationship between the online availability of services in the life event Job and the use of Authentic Sources in this life event, no strong correlation between the two dimen-sions can be observed across Europe. All European countries are situated in either the upper right or bottom right quadrant, with countries in which both dimensions are simultaneously pushed forward, and coun-tries in which one dimension is promoted to the detriment of the other.
Figure 43 presents a detailed illustration of how the two indicators correlate in the different European countries. Since the indicator of online services only contains basic services we calculated the score for online availability using only basic services as well. This allows us to make a proper comparison between the two indicators.
Portugal lies perfectly on the reference line, (with maximum scores in both dimen-sions). Malta and Finland also reach high
Figure 43: Correlation Online Availability of services and Use of Authentic Sources in life event Job (2016, %)
AT
BE
BG
CH
CY CZ
DE
DK
EE
EL
ES
FI
FR HR
HU
IE
IS
IT
LT
LU
LV
ME MT NL
NO PT
RO
RS
SE
SI
SK
TR
UK
EU28+
Correlation Online Availability versus Authentic Sources by country for LIFE EVENT General administration: Jobs (2016, %)
Online availability
0 10 20 30 40 50 60 70 80 90 100 0
10
20
30
40
50
60
70
80
90
100
Aut
hent
ic s
our
ces
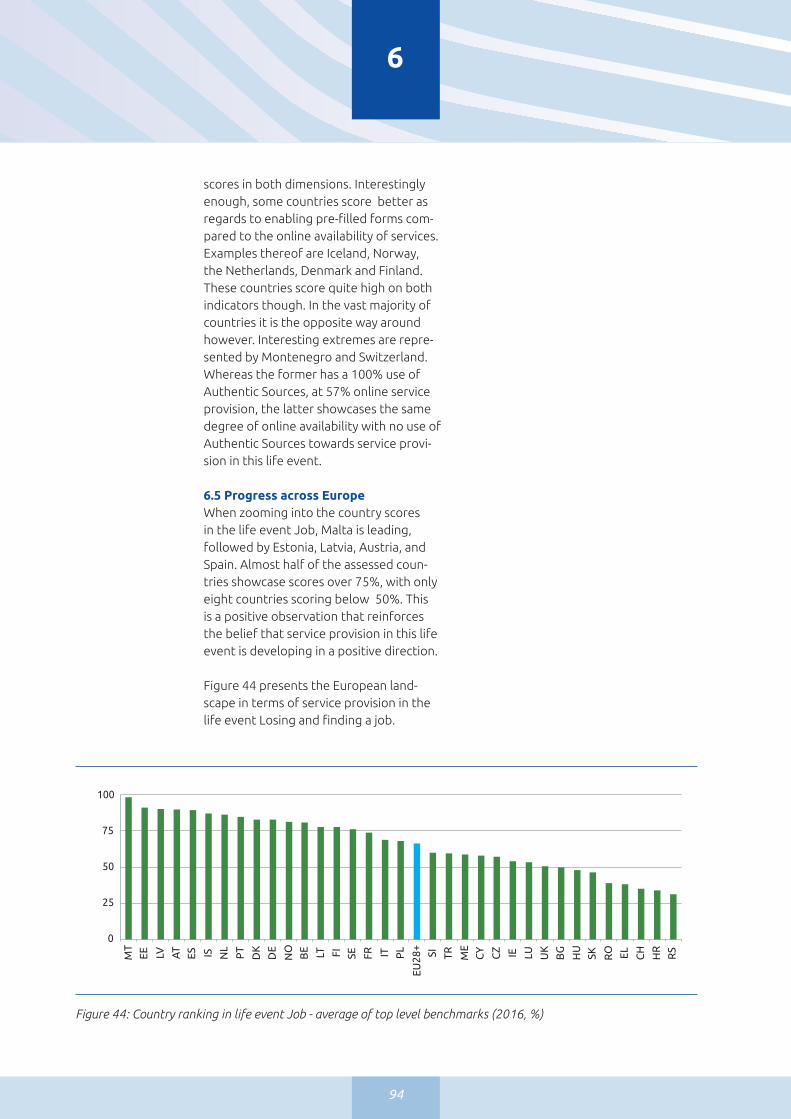
94
scores in both dimensions. Interestingly enough, some countries score better as regards to enabling pre-filled forms com-pared to the online availability of services. Examples thereof are Iceland, Norway, the Netherlands, Denmark and Finland. These countries score quite high on both indicators though. In the vast majority of countries it is the opposite way around however. Interesting extremes are repre-sented by Montenegro and Switzerland. Whereas the former has a 100% use of Authentic Sources, at 57% online service provision, the latter showcases the same degree of online availability with no use of Authentic Sources towards service provi-sion in this life event.
6.5 Progress across Europe When zooming into the country scores in the life event Job, Malta is leading, followed by Estonia, Latvia, Austria, and Spain. Almost half of the assessed coun-tries showcase scores over 75%, with only eight countries scoring below 50%. This is a positive observation that reinforces the belief that service provision in this life event is developing in a positive direction.
Figure 44 presents the European land-scape in terms of service provision in the life event Losing and finding a job.
6
MT
EE
LV
AT
ES
IS
NL
PT
DK
DE
NO
BE LT
FI
SE
FR
IT
PL
EU28
+
SI
TR
ME
CY
CZ IE
LU
UK
BG
HU
SK
RO
EL
CH
HR
RS
Overall: bar chart with country ranking Life Event Job (average of top level benchmarks)
0
25
50
75
100
Figure 44: Country ranking in life event Job - average of top level benchmarks (2016, %)
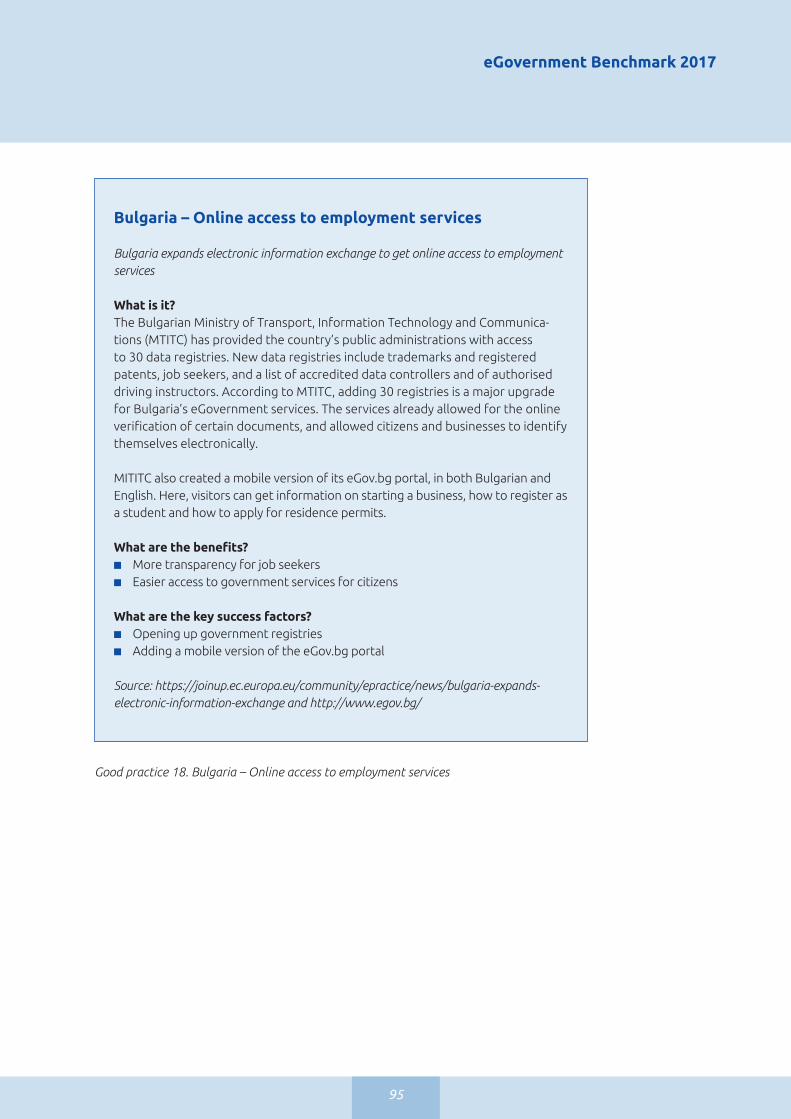
eGovernment Benchmark 2017
95
Bulgaria – Online access to employment services
Bulgaria expands electronic information exchange to get online access to employment services
What is it?The Bulgarian Ministry of Transport, Information Technology and Communica-tions (MTITC) has provided the country’s public administrations with access to 30 data registries. New data registries include trademarks and registered patents, job seekers, and a list of accredited data controllers and of authorised driving instructors. According to MTITC, adding 30 registries is a major upgrade for Bulgaria’s eGovernment services. The services already allowed for the online verification of certain documents, and allowed citizens and businesses to identify themselves electronically.
MITITC also created a mobile version of its eGov.bg portal, in both Bulgarian and English. Here, visitors can get information on starting a business, how to register as a student and how to apply for residence permits.
What are the benefits? ■ More transparency for job seekers■ Easier access to government services for citizens
What are the key success factors?■ Opening up government registries■ Adding a mobile version of the eGov.bg portal
Source: https://joinup.ec.europa.eu/community/epractice/news/bulgaria-expands- electronic-information-exchange and http://www.egov.bg/
Good practice 18. Bulgaria – Online access to employment services

96
6
Portugal – “Citizen Map App with Employment services”
Mobile phone app gives access to employment services
What is it?Portugal’s Administrative Modernisation Agency has increased the number of eGo-vernment services that can be accessed through the agency’s smart phone app, the Citizen Map - Using their mobile phones, users can now also access the employ-ment services of the country’s Institute for Employment and Vocational Training (IEFP).
Through the Citizen Map, Citizens can know which public services are closest to them, what documents are needed to solve the situation, or take an electronic queue ticket and be informed of how many precede theirs.
Up until recently, though, electronic tickets were available only for Citizen Shop services. As of 2016, this service is also accessible for approximately 100 service sites of the Institute of Employment and Vocational Training (IEFP).
What are the benefits? ■ Efficiency as it creates a one-stop-shop service point■ Innovative and accessible employment service for citizens■ Modernised HR services for employers
What are the key success factors?■ Displaying the country’s services centers (Citizen Shops) on a geographic map,
enabling users to find the closest and most convenient ones.
Source: https://joinup.ec.europa.eu/community/epractice/news/portugal-adds- services-its-mobile-app
Good practice 19. Portugal: Employment services mobile app

97
Studying
98
Studying
7
7.1 Introduction to life eventThis section provides deeper insights into the progress made in the life event Studying across Europe. The analysis comprised three different stages and 12 interactions. The results address the four benchmark dimensions User Centricity (the extent to which services for stu-dents are available online as well as their mobile-friendliness), Transparency (the
extent to which students are informed about the processing and delivery times of their applications), Cross-border Mobility (the extent to which students can access services when deciding to live in another European country), and Key Enablers (the extent to which services for students are taking advantage of technical enablers such as eID, eDocu-ments, and authentic sources).
Key insights – Life Event Studying
■ With an overall average of 64%, Studying is the third best performing life event in 2016.
■ In terms of its user-centricity, the life event scored second across the 2016 domains, with an overall result of 83% - a very good performance at only 1 point away from the business life event. With an online availability of 84%, the life event Studying experienced a good boost compared to 2014 (+5points). Compared to the 2014 vs.2012 results (+9 points), the progress seems to have been slower in the past two years. The usability of services continued on the growth path and reached 89% in 2016. Low scores are registered on the mobile-friendliness dimension (52%).
■ The Transparency dimension scores at 60%, with modest results with regard to Transparency of Service Delivery (56%) and Personal Data (55%) and a good score of 70% on the Public Organisation indicator. This life event obtained an average of 60% with 56%, 70 and 55%.
■ Cross-border Mobility of students has increased when compared to the 2014 scores, however it is still lagging behind the mobility that businesses enjoy with regard to service provision across Europe.
■ The use of Key Enablers registers good scores, however there has been a decline in the availability of eID and eDocuments in the interactions in this life event. Significant boost has been registered by the use of Authentic Sources, which registered an increase of 12 points compared to 2014.
■ The most mature service interaction is the one related to the understanding of admission requirement, which is as of 2016 fully available online. At the opposite end, the least mature services are the applications for social benefits, with a level of online availability of 50%.

eGovernment Benchmark 2017
99
7.2 User CentricityIn terms of their User Centricity, the twelve interactions assessed in this life event reached an overall scored of 83% in 2016. With this, the life event Studying scores second best along the four do-mains analysed in 2016.
7.2.1 Online AvailabilityThe score of online availability of services for students has reached 86%, a boost of 5 points compared to previous measure-ment of 2014. This reinforces the belief that this domain is on track to achieving maximum scores by 2020. In connection with the usability of the services, the maturity level observed on this dimension was 89%, which is indeed an excellent score. It appears that both the quantity and usability of services for students are progressing, and this takes place at the same speed. Both dimensions witnessed a 5 point increase compared to 2014.
Figure 45 exhibits the extent to which stu-dents are able to find the needed services and/or information via digital channels. As highlighted in the bar chart below, great progress has been made with regard to the understanding of admission require-ment, which is as of 2016 fully available online. Good results are also shown by the interaction regarding the set-up of a per-
Figure 45: Availability of services in the life event Studying (2016, EU28+, %)
1.1 Advanced course search
1.2 Perform assessment tests
1.3 Understand admission requirements
2.2 Enrolling in higher education
2.3 Applying for student grants
2.4 Applying for social benefits
2.5 Financial advise
3.2 Enrolment additional courses (eg languages)
3.3 Personal profile
3.4 International office
3.5 Career advice - internships
3.6 Register for graduation ceremony
How services are made available by country (Studying, 2016, %)
0% 10% 20% 30% 40% 50% 60% 70% 80% 90% 100%
Automated service
Service online and through portal Offline
Service online but not through portal
Information online and through portal
Information online but not through portal
sonal profile, which is almost entirely pos-sible online, as well as regarding obtaining career advice online, which is as of 2016 possible online in 91% of cases. The enrol-ment in higher education can be done via the Internet in more than 80% of cases.
When looking at the stages, the orienta-tion stage (1) shows good results on two of its interactions. Very good performance can be observed with regard to interac-tion in stage 3 of the life event. As de-picted by the illustration, the interactions along stage 2 need to catch up speed and improve their online availability, as they play an important role to ensuring cer-tainty and stability regarding the financial aspects, that in particular for the custom-ers of this domain are an area of concern.
7.2.2 Mobile friendlinessWhen reviewing the mobile friendliness of services in the life event Studying, no country seems to have reached maximum scores. Best performers are UK, Norway, and Sweden, followed by Denmark, Ice-land and the Netherlands, all with scores above the 75% line. Serbia follows with a score of 68%, followed by Estonia (64%) and Romania (63%).
In terms of the mobile friendliness of portals, seven European countries have

100
Figure 46: Mobile friendliness of services in life event Studying (2016, EU28+, %)
Figure 47: Mobile friendliness of portals in life event Studying (2016, EU28+, %)
7
0%
10%
20%
30%
40%
50%
60%
70%
80%
90%
100%
UK NO SE DK NL IS RS EE RO PT FI CH IE TR DE EU AT BE IT HU SI MT EL FR LU SK LV HR LT PL BG CY CZ ES ME
0%
10%
20%
30%
40%
50%
60%
70%
80%
90%
100%
CH LT NL NO PT SE UK SI BE LU DE FR DK AT BG MT RO SK EL FI RS CZ PL HR ME EE IS LV TR CY HU IT ES IE
reached maximum scores. This dimension also depicts stronger discrepancies across Europe, with several countries scoring 100%, but with many other examples in which this dimension still needs significant improvement. Similar to the other life events, in this domain as well portals seem to be performing better when compared to services. Figure 47 illustrates the state of play across Europe on this indicator.
Overall, when examining both the mobile friendliness of services and portals, European public education institutions need to step up and intensify their ac-tions for ensuring that their services and portals can be accessible from the device of choice of the end-user. In particular,
on the Studying life event, the end-users are also represented to a high extent by the ‘digital natives’ generation, where access via mobile is considered a ‘default feature’. As the modest results on this indicator show, this seems to have not been understood as such by the majority of European public education institutions.
7.3 TransparencyThe Transparency benchmarks scores at 60% (third best across the 2016 domains), with an overall European average of 56% on service delivery, 70% on public admin-istration and a score of 55% on personal data. The scores indicate room for im-provement as regards achieving a trans-parent European public service provision.

eGovernment Benchmark 2017
101
Figure 48: Level of Transparency of Service Delivery per service in life event Studying (2016, EU28+, %)
67
54
47
56
0 20 40 60 80
2.2 Enrolling in higher education
2.3 Applying for student grants
2.4 Applying for social benefits
3.6 Register for graduation ceremony
Transparency: bar chart illustrating level of transparency of service delivery per service (Life Event: Studying)
Figure 48 provides an overview of the scores for each of the examined interac-tions, for basic services only.
As illustrated above, the Transparency of Service Delivery shows good scores in all four interactions, with the highest score of 67% registered in the enrolment appli-cation for higher education. Good results were also achieved by the application for student grants, with a score of 54%. Lag-ging behind is the Transparency of Service Delivery in terms of social benefits appli-cations, which only reached 47% in 2016.The latter two dimensions are impor-tant aspects contributing to increasing students’ financial planning, by providing them with a clear timeline for decisions regarding the financial aspects (e.g. student grants and social benefits). Fail-ing to have clarity in terms of financial aid might prevent some students from going further with their decision to enrol in higher education. This is an important observation that needs to be taken into account by public education institutions and education agencies across Europe.
7.4 Cross-border MobilityThe life event Studying has also been as-sessed on the extent to which it enables Cross-border Mobility for users in this life stage. The services were assessed against to their online availability for foreign students. Figure 49 illustrates the service provision on this life event for non-coun-try nationals.
On average in Europe, services for non-country nationals continue to be offline in approximately 11% of cases. All interac-tions in this life event present examples in which services are still offline.
The application for student grants and the application for social benefits, as well as receiving financial advice are lagging behind, and only reach 50% in terms of online availability. The service interac-tion regarding the portability of student grants abroad is online in only 38% of cases. These observations are added to the list of remarks that show that the interactions dealing with financial matters (applications for student grants, student loans, as well as seeking financial advice) have the highest percentage of offline services. This might be a hurdle towards enabling the mobility of students across Europe. It also represents quite a worri-some observation, given the importance of financial stability for students in gen-eral and in particular for those who are considering of studying abroad. Given the overall goal of enabling mobility across Europe, and the weight that the financial aspects play in the decision to study in a foreign country, public education institu-tions and administrations across Europe would need to put additional effort in this regard. On a positive note, this interaction displays the highest degree of automation, with 13% of services being fully automated. This indeed represents a positive signal.

102
On average in Europe, cross-border services in this life event are available online in 68% of cases, with another 11% of cases in which the information can be found online. Only 11% of interaction on this life event were still not accessible cross-border in 2016. When compared to the life event Business (the other life event which was assessed against its Cross-border Mobility dimension), it ap-pears that the life event Studying surpassed the life event Business for the first time when it comes to the online availability of services. Whereas in the life event Business, the cross-border availability of services meas-ured 73%, citizen mobility in Europe reached 74% in 2016.
7.5 Key EnablersAn important aspect towards enhancing the user experience in this life event is the employment of Key Enablers. The following section deals with the extent to which the eID, eDocs and Authentic Sources are used in the service interactions aimed at students. Figure 50 presents the scores in the three Key Enablers, per interaction in the life event Studying.
As depicted by the graph above, the overall uptake of Key Enablers has room for im-provement. When compared to the scores of 2014, there is a slight fall-back in the use of eDocuments of 1 point to now 61%, and
a more visible decrease of 4 points regard-ing the use of the eID, which measured 55% in 2016. Worrisome are the results on the Key Enabler eID, where in particular the application for grants and social benefits still show many instances in which the use of an electronic Identification is not possible online. Once again, the interactions regard-ing the financial aspects stand out. In both, the online application for student grants and social benefits, are still 40% of cases in which the use of an eID is not possible online. Excellent progress was measured with re-gard to the use of Authentic Sources, which made a great improvement of 13 points in this life event, to reach 57% in 2016. This sends a strong signal that the European public institutions have worked towards ena-bling access to registries among the involved institutions, and provide a more user-friendly service interaction.
Going one step further, the benchmark ana-lysed the correlation between the Key Ena-bler Authentic Sources and online availability of services. Since the indicator of online services only contains basic services we cal-culated the score for online availability using only basic services as well. This allows us to make a proper comparison between the two indicators. In this domain as well, there is no strong correlation between the two dimen-sions that can be observed in Europe.
Figure 49: Cross-border availability of services in life event Studying – average results (2016, EU28+, %)
7
Average
How services are made available by country (Studying-CB, 2016, %)
1.1 Advanced course search
1.2 Perform assessment tests
1.3 Understand admission requirements
2.1 Request recognition of diploma
2.2 Enrolling in higher education
2.3 Applying for student grants
2.4 Applying for social benefits
2.5 Financial advise
3.1 Portability of student grand (abroad)
3.2 Enrolment additional courses (eg languages)
3.3 Personal profile
3.4 International office
3.5 Career advice - internships
How services are made available by country (Studying-CB, 2016, %)
Automated service Service and information online Not available onlineInformation online
0% 10% 20% 40% 60% 70% 80% 90% 30% 50% 100% Average
How services are made available by country (Studying-CB, 2016, %)
1.1 Advanced course search
1.2 Perform assessment tests
1.3 Understand admission requirements
2.1 Request recognition of diploma
2.2 Enrolling in higher education
2.3 Applying for student grants
2.4 Applying for social benefits
2.5 Financial advise
3.1 Portability of student grand (abroad)
3.2 Enrolment additional courses (eg languages)
3.3 Personal profile
3.4 International office
3.5 Career advice - internships
How services are made available by country (Studying-CB, 2016, %)
Automated service Service and information online Not available onlineInformation online
0% 10% 20% 40% 60% 70% 80% 90% 30% 50% 100%

eGovernment Benchmark 2017
103
Figure 51 presents the country results across Europe on these two indicators. Once again, countries position themselves in the right side of the graph, emphasising a stronger focus on online availability of their services compared to the enhancement of the user experience along the online ser-vice provision, by e.g. the use of Authentic Sources. Some countries however score close to the reference line, illustrating therefore that they place an equal attention to both
dimensions. Examples thereof are Malta, Portugal, Spain and Lithuania with maximum scores, followed by the Netherlands, Estonia, Denmark and Sweden. Very good results are also registered by the Czech Republic, with scores of 90% on both indicators. Overall, in this life event as well, European countries seem to have prioritised bringing services online to the detriment of enhanc-ing the quality of the services. Cyprus and Poland represents the clear exception to the
Figure 50: Availability of eID, eDoc and Authentic Sources per service in life event Studying – average scores (2016, EU28+, %)
Possible online through using national eID + access to another service without re-auth
Possible online through using national eID or access to another service without re-auth
Possible online not with national eID
Not possible online
Possible by using authenticated eDocument No authenticated eDocument could be sent/received
At least personal information was prefilled No information was prefilled
0% 10% 20% 30% 40% 50% 60% 70% 80% 90% 100%
0% 10% 20% 30% 40% 50% 60% 70% 80% 90% 100%
0% 10% 20% 30% 40% 50% 60% 70% 80% 90% 100%
eID
eDocuments
Authentic sources
2.2 Enrolling in higher education
2.3 Applying for student grants
2.4 Applying for social benefits
3.6 Register for graduation ceremony
2.2 Enrolling in higher education
2.3 Applying for student grants
2.4 Applying for social benefits
3.6 Register for graduation ceremony
2.2 Enrolling in higher education
2.3 Applying for student grants
2.4 Applying for social benefits
3.6 Register for graduation ceremony

104
7
Figure 51: Correlation online availability and use of Key Enabler Authentic Sources in life event Studying (2016, EU28+, %)
Figure 52: Country ranking in life event Job - average of top level benchmarks (2016, EU28+, %)
0
10
20
30
40
50
60
70
80
90
100
0 10 20 30 40 50 60 70 80 90 100
Aut
hent
ic s
our
ces
Online availability
Correlation Online Availability and Key Enabler Authentic Sourcesin life event Family (2016, %)
SI
NO
SE
AT
EE, LT, IS, MT, PT, ES, NL
IT
BE
LV
DE
HU
LU
PL
HR
ME
FR
TR
CY
CZ
FI
EL UK
SK
BG
IE
EU28+
rule, with maximum scores in terms of use of Authentic Sources and score around the 70% line in terms of online availability.
7.6 Progress across EuropeWhen looking at a cross-country com-parison along the life event Studying, no country seems to have reached maximum scores. Despite this, the majority of coun-tries are scoring above 70%. This is a very good result and reinforces the observa-tion made in 2014 that European public education institutions are making efforts towards offering students more and better online services.
On this life event, Malta is ‘best in class’, fol-lowed at a close distance by the Netherlands. Third best score is registered by Denmark. Sweden, Estonia, Lithuania, Spain as well as Germany, Finland and Austria score more than 75% and manage to convince with very good results in this life event.
Overall, the life event Studying shows good to very good scores across Europe and ranked third best amongst the four life events. This emphasises the fact that services in this domain are catering more and more to their customers’ needs and expectations.
MT
NL
DK
SE
EE
LT
ES
DE FI
AT LV
NO
IS
PT
BE SI
IE
EU28
+
TR
ME
FR
CY
LU
SK
CZ
CH
IT
PL
HR
UK
RO
EL
BG
HU
RS
Overall: bar chart with country ranking Life Event Studying (average of top level benchmarks)
0
25
50
75
100
eGovernment Benchmark 2017
105
Figure 51: Correlation online availability and use of Key Enabler Authentic Sources in life event Studying (2016, EU28+, %)
Norway – Digital Diploma Registry. A secure way to share educational results
What is it?The Diploma Registry is a digital solution where students and applicants can collect their results from their education and share them with potential employers, educational institu-tions and other relevant recipients. The Diploma Registry is free of charge to use.
The primary way to share your results is to transfer them to an HR-system connected to the Diploma Registry. The process starts in the HR-system and, by following a link to the Diploma Registry, the portal will retrieve all your results, directly from the educational institutions’ databases. You can then choose which results you want to share.
You can also give somebody access to your results by sending them a link to the Diploma Registry. You start the process in the Diploma Registry. When you have chosen which results you want to share, the Diploma Registry generates a link which can easily be sent to the desired recipient. A unique code is sent along with the link. The recipient must apply the code to access the results. You can choose how long the link will be active for.
An EU-project - EMREX - was established in 2015 to enable secure digital sharing of results across borders. Through the pilot project, students transferred results between education-al institutions in Norway, Sweden, Denmark, Finland and Italy. The Diploma Registry is the central Norwegian application in the EMREX project. Countries including the USA, Australia and China, have expressed interest in joining the network. Both the Diploma Registry and EMREX are mentioned in the EU publication “Study to support the revision of the diploma supplement and analyse the feasibility of its digitalisation at European level”.
What are the benefits? ■ Collect educational results electronically and share them in a secure way with encryp-
tion and digital signing. ■ Trustworthyness: avoid false admission or hiring people with false diploma. ■ Saving time: the recipient does not have to check the results. ■ Reducing the need to produce transcripts of records, saving both time and paper. ■ For both students and applicants, the Diploma Registry simplifies the task of submit-
ting their results to the desired recipient.■ If the cost of sending, receiving, registering and verifying each order of a transcript
of records amounts to NOK 200, the Diploma Registry can save more than NOK 100 million per year. Given approximately 620,000 people change jobs every year.
What are the key success factors?■ A thorough and good product specification.■ In-House development with programmers understanding the problem to be solved.■ An established working method (Scrum) which is familiar to the team members.■ Thorough testing by several groups of people.■ A close dialogue with the educational institutions throughout the whole project■ The same people responsible for development and operations after release.■ A silent release: finding and solving bugs before the user group increased.
Good practice 20. Norway: A secure way for diploma registry to share educational results online

106
7
Italy – eID cards
Italian eID overhaul reaches municipalities and universities
What is it?Italy’s renewed eID system offers access to services in about 3,300 municipalities in 2016. The Public System for Digital Identity Management (SPID, Sistema Pub-blico per la gestione dell’Identità Digitale di cittadini e imprese) is now also used by several universities such as the Universities of Rome and Turin. SPID-support implemented in the University of Rome’s portal Infostud, for example, means that some 110,000 students at Sapienza - the University of Rome - can use SPID to log in to their university’s services.
What are the benefits? ■ Step towards creating a one-stop-shop for government as well as university
services■ Easy access for students to a variety of services
What are the key success factors?■ Adding university services to the eID system
Source: https://joinup.ec.europa.eu/community/epractice/news/italian-eid- overhaul-reaches-municipalities
Good practice 21. Italy: eID cards

eGovernment Benchmark 2017
107
The explorative benchlearning perspective

108
The explorative benchlearning perspective
8
8.1 The benchlearning approach
8.1.1 Introduction to the benchlearning perspectiveThe purpose of the eGovernment bench-learning is to compare eGovernment performance between countries, whilst understanding how country-specific characteristics influence eGovernment performance and, consequently, the eGovernment strategy. In addition, it identifies the main factors that drive in-novation and the different development paths that countries can take while learn-ing from best-performer’s experiences. Through the benchlearning approach, each country can compare itself to, and try to learn from, other countries which have similar contexts, but reach better performance. This could help countries to understand the level of maturity that could be reached in the future, and to support the development of relevant and feasible eGovernment objectives and the related actions for getting there.
The two-step benchlearning approach was first introduced in the 2015 Report and of-fered countries opportunities to learn from better scoring countries that displayed simi-lar features. In the eGovernment Bench-marking Report 2016 the benchlearning approach was improved by introducing the measurement of time series and by offering an understanding of the evolu-tion of countries’ performances over time. Three novelties have been implemented in the current report, in order to increase (i) the transparency of the process and the benchlearning exercise itself, (ii) the clarity of the indicators used, and (iii) the coher-ence with the Mystery Shopping exercise.
19 TheDigitalEconomyandSocietyIndex(DESI)isacompositeindexthatsummarisesrelevantindicatorsonEurope’sdigitalperformance and tracks the evolution of EU member states in digital competitiveness (https://ec.europa.eu/digital-single-market/en/desi).
First, the absolute indicator measure-ment has been updated in order to bet-ter connect the benchlearning analysis as compared to the Mystery Shopping exercise. Secondly the relative dataset, that builds on data sources outside of the Mystery Shopping, has been up-dated to include new indicators that are part of the Digital Economy and Society Index (DESI)19. Finally, a more evident link between country characteristics and eGovernment results.
The benchlearning analysis covers 28 out of the 34 countries that participated in the eGovernment Benchmark. Iceland, Montenegro, Norway, Serbia, Switzerland and Turkey could not be included yet, due to missing data (the analysis uses the DESI dataset as one of the main data sources, which is based on the EU28).
8.1.2 The framework of the explorative benchlearning perspective The benchlearning exercise aims to connect country specific characteristics on eGovernment maturity and strategies to the performance of the country through a benchlearning exercise based on a two-step analysis.
The first step of the analysis aims at measuring a country’s maturity through the identification of eGovernment performances in terms of the use of eGovernment services, and public ad-ministrations’ ability to produce efficient and effective procedures and ser-vices delivery. We assess and compare eGovernment performance with two absolute indicators: Penetration and Digitisation.

eGovernment Benchmark 2017
109
The second step of the analysis aims at evaluating exogenous factors that shape the specific context of individual coun-tries: this step develops understanding of which factors influence each country performance through relative indicators.
This two-step analysis enables a bench-learning perspective. This perspective provides interpretations of how contextual variables affect a country’s eGovernment performance in terms of level of Penetra-tion and level of Digitisation. It allows us to explore performance levels, similarities and differences in context, and to under-stand different eGovernment implementa-tion levels across countries. The purpose is to offer input for policy makers to identify country specific policies and design or redesign eGovernment strategies.
8.2. Step 1: Measuring Country Performance through the absolute indicators Penetration and Digitisation
8.2.1 PenetrationPenetration can be described as the ex-tent to which use of the online channel is widespread among users of government services. The availability of digital public services around Europe has increased in recent years, but in order to understand the maturity of eGovernment the supply of public services should be compared with its usage. To this end a Eurostat
20 This variable has been constructed by assuming that the percentage of citizens needing to submit forms (for which information is lacking) is analogous to the percentage of internet users needing to submit a form (for which information is available).
Figure 53: Penetration indicator valorisation
indicator has been selected, which relates the number of individuals that submitted online forms in the last twelve months to the total number of individuals that need to submit official forms to administrative authorities. Figure 53 shows the Penetra-tion indicator valorisation.
Figure 54 shows the Penetration index for each country. The average for the 28 Euro-pean countries is 52%, but with a wide vari-ance in results: there are countries close to 90% (Finland and Denmark) and countries with a percentage lower than 30% (Italy, Greece and Czech Republic).
Improving Penetration performances could be achieved in two different ways: by increasing the number of people that submit official forms online to administra-tive authorities or by automatising pro-cesses and requesting fewer forms from citizens To increase the usage of the online channel a Public Administration needs to digitise a larger number of administrative forms, to improve the usability of the ex-isting services, and to implement policies to raise awareness about the opportunities and advantages offered by eGovernment services. To simplify the administrative machinery and automatise processes databases need to be integrated and data needs to be shared across different public services in order to reduce the need for information directly to citizens.
Indicator Composed variables Data source
Penetration
Internet use: submitting completed forms (last twelve months);Percentage of individuals who need to submit official forms to administrative authorities
European Commission’s calculations based on Eurostat data20

110
Figure 54: Penetration index
19%
27% 29% 31% 33% 34%
37% 41% 42% 42% 44% 45% 46%
49% 52%
55% 55% 55% 56% 56% 59% 61%
66% 70%
79% 79% 84%
88% 88%
IT
EL
CZ
HU
DE PL
CY
BE LU
PT
BG
SI
MT
AT
EU28
HR
FR
SK
ES
LV
IE
LT
RO
UK
NL SE
EE
FI
DK
54. Penetration index
8.2.2. DigitisationThe Digitisation index is a proxy for the Digitisation level of the back- and front-office. To capture Digitisation the four top-level indicators from the Mystery Shopping method were applied (Figure 55):■ User Centric Government: this top-
level benchmark assesses the availabil-ity and usability of public eServices and examines awareness and barriers to use.
■ Transparent Government: this top-level benchmark evaluates the trans-parency of i) government authorities’ operations; ii) service delivery pro-cedures and; iii) the incorporation of personal data by public administrations.
■ Citizen and Business Mobility: this top-level benchmark is constructed
by the joint measurement of Citizen Mobility and Business Mobility, and it assesses the availability and usability of cross-border services. This indicator is a weighted average of the two in-dicators Citizen Mobility and Business Mobility with a ratio of 3 to 1.
■ Key Enablers: this top-level bench-mark assesses the availability of key digital enablers, such as electronic Identification (eID), electronic Docu-ments, Authentic Sources as well as Digital Post.
The Digitisation indicator is calculated as the average of the four indicators.
Looking at the Digitisation indicator (Figure 56), the results are more homo-geneous than those obtained for the
Figure 55: Digitisation indicator valorisation
Indicator Composed variables Data source
Digitisation
Average of:■ User Centric Government■ Transparent Government■ Citizen and Business (3:1) Mobility■ Key Enablers
eGovernment Benchmark - Mystery Shopping
8

eGovernment Benchmark 2017
111
Figure 56: Digitisation Index
40% 41% 42% 43% 43%
52% 53% 55% 55% 56% 58% 60% 60% 61% 62% 65% 71% 72% 73% 74% 75% 77% 78%
81% 83% 83% 83% 83%
97%
56 Digitisation Index
EL
HU
BG
HR
RO
SK
LU
PL
CZ
UK
IE
CY
SI
IT
FR
EU28
BE FI
ES
PT
DE LT
LV
AT
NL
SE
EE
DK
MT
Penetration indicator. The European average is about 65% and there are no countries with a percentage lower than 40%. The best performer is Malta (97%), followed by Denmark, Estonia, Sweden, and the Netherlands (83%). Five coun-tries (Greece, Hungary, Bulgaria, Croatia and Romania) have percentages lower than 50%.
The Digitisation index is composed of the four top-level indicators from the Mys-tery Shopping described above. For this reason improving the Digitisation level means improving at least one of the Mys-tery Shopping indicators that compose it. For additional details about the indica-tors’ characteristics and how to increase their value, see the previous chapters.
8.2.3 Understanding performancesTo understand a country’s ability to exploit ICT for increasing the efficiency of its processes, we compare Penetration with Digitisation. shows four scenarios capturing different levels of Penetration and Digitisation:
■ Non-consolidated eGovernment: This scenario contains a lower level of Digitisation and a lower level of Pene-tration. A government in this scenario does not utilise ICT opportunities yet,
but might be aiming to benefit from it in the future.
■ Unexploited eGovernment: This scenario contains a lower level of Digitisation combined with a higher level of Penetration. A government in this scenario might still be in an ongo-ing digitisation process, but has a high number of citizens using eGovernment services. Countries in this scenario are reaching a lower level of efficiency in managing their resources and might have room to leverage high online use of eGovernment services.
■ Expandable eGovernment: This scenario contains a higher level of Digitisation and a lower level of Penetration. A government in this scenario innovates efficiently, but the number of online users has to be expanded to realise all the potential benefits.
■ Fruitful eGovernment: This scenario contains a higher level of both Dig-itisation and Penetration. This indi-cates a successful process of innova-tion. Countries in this scenario have achieved an efficient and effective way of working.
By classifying the countries conform the above-mentioned four scenarios the fol-lowing observations can be made:

112
■ Non-consolidated eGov: this scenario includes almost one third (8) of the Eu-ropean countries. These countries do not benefit from ICT opportunities. In the near future, the goal of the coun-tries in this cluster could be to improve both Digitisation and Penetration, by digitising front- and back office and encouraging citizens to use eGovern-ment services. Except for Luxembourg, all the countries in this scenario belong to southern or eastern Europe (Hun-gary, Greece, Bulgaria, Poland, Czech Republic, Cyprus, Slovenia and Italy).
■ Unexploited eGov: this group in-cludes countries with a good level of Penetration, but with a level of Digiti-sation below the European average. In these countries, citizens and compa-nies are familiar with eGovernment services. If these countries manage to increase their Digitisation level further, they might benefit more from that advantage, as apparently citizens and companies are eager to use eGovern-ment services. This scenario includes six countries: France, the United King-
dom, Ireland, Slovakia, Romania and Hungary.
■ Expandable eGov: the digitisa-tion process of the countries in this scenario is advanced, but Penetration is still low. To fully benefit from the progress made in Digitisation, eGov-ernment usage needs to be increased. This scenario includes five countries (Malta, Germany, Portugal, Belgium and Austria).
■ Fruitful eGov: this scenario includes the best-in-class countries, which per-form at a Digitisation and Penetration level above average. The majority of the countries included in this scenario are from northern Europe (Denmark, Norway, Sweden, Finland, Estonia, Latvia, Lithuania), plus one country from southern Europe (Spain). These countries managed to increase supply and demand of eGovernment services in tandem.
The joint analysis of Penetration and Digitisation (Figure 58) shows a linear correlation between the two indicators.
Figure 57: Scenarios for Penetration and Digitisation levels
UnexploitedeGov
FruitfuleGov
Non consolidatedeGov
ExpandableeGov
Penetration
Digitisation
HIG
HLO
W
LOW HIGH
8
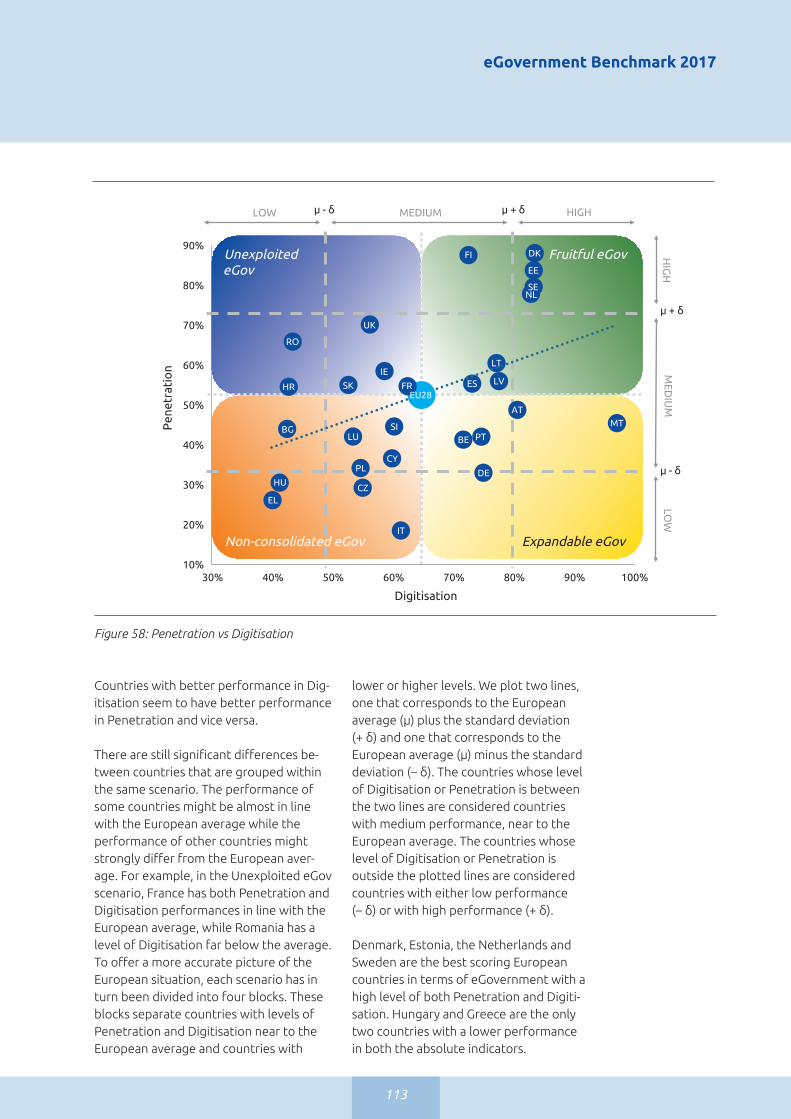
eGovernment Benchmark 2017
113
Countries with better performance in Dig-itisation seem to have better performance in Penetration and vice versa.
There are still significant differences be-tween countries that are grouped within the same scenario. The performance of some countries might be almost in line with the European average while the performance of other countries might strongly differ from the European aver-age. For example, in the Unexploited eGov scenario, France has both Penetration and Digitisation performances in line with the European average, while Romania has a level of Digitisation far below the average. To offer a more accurate picture of the European situation, each scenario has in turn been divided into four blocks. These blocks separate countries with levels of Penetration and Digitisation near to the European average and countries with
lower or higher levels. We plot two lines, one that corresponds to the European average (μ) plus the standard deviation (+ δ) and one that corresponds to the European average (μ) minus the standard deviation (– δ). The countries whose level of Digitisation or Penetration is between the two lines are considered countries with medium performance, near to the European average. The countries whose level of Digitisation or Penetration is outside the plotted lines are considered countries with either low performance (– δ) or with high performance (+ δ).
Denmark, Estonia, the Netherlands and Sweden are the best scoring European countries in terms of eGovernment with a high level of both Penetration and Digiti-sation. Hungary and Greece are the only two countries with a lower performance in both the absolute indicators.
Figure 58: Penetration vs Digitisation
Non-consolidated eGov
Fruitful eGov
Expandable eGov
LOW MEDIUM HIGH
LOW
MED
IUM
HIG
H
10%
20%
30%
40%
50%
60%
70%
80%
90%
30% 40% 50% 60% 70% 80% 90% 100%
μ - δ
μ + δ
μ + δμ - δ
Pen
etra
tio
n
Digitisation
Unexploited eGov
RO
HR
LU
CZ
IT
BE PT
ATMT
LV
LT
FI DK
EE
SE
ES
DE
CYPL
SI
FREU28
BG
HU
EL
SK
IE
UK
NL

114
8.3. Step 2: Understanding the impact of context-specific variables on performances
8.3.1 Methodology The second step of the analysis identifies witch exogenous factors (‘Relative indica-tors’) influence country performance and evaluates how those exogenous factors shape the specific context of individual countries.
A set of relative indicators that could influ-ence the eGovernment performance of the selected countries was identified from several databases (Eurostat, DESI, Trans-parency international, World Bank, etc.). Each indicator was considered as a proxy for a specific exogenous factor that could relate to the Digitisation and Penetration indexes.
After identifying the initial relative indica-tors, statistical analyses were performed (principal component analysis, stepwise analysis, multivariate and univariate correlations) to reduce the number of indicators. Relative indicators that did not correlate with the absolute indica-tors were excluded. For example, the population of a given country is of primary importance for a wide range of analyses. Nonetheless, it was not significantly cor-related with any of our absolute indicators and thus, as it did not appear to influence a country’s performance in eGovernment, not included in the final list of relative indicators.
The table in Annex III shows the complete list of the indicators taken into consid-eration during the statistical analysis described.
The selected indicators were clustered into three categories of relative indicators that can help to explain country-specific performances from the perspective of us-ers, government and the ‘digital’ context. All three categories consist of a number of sub-indicators.
8
■ Users’ characteristics: Citizens’ ability and willingness to use online services. In this analysis user characteristics are captured by indicators concerning Digi-tal Skills and ICT Usage.
■ Government characteristics: ele-ments of how public organisations act and are organised that influence eGovernment performance. In this analysis government characteristics are captured by indicators that evaluate Quality and Openness of government actions and institutions.
■ Context characteristics: exogenous factors that can offer a proxy of the eReadiness in terms of adoption of digital in a country in a country. In this analysis context characteristics are captured by two indicators: connec-tivity characteristics and diffusion of digital in private sector.
8.3.2 Users’ characteristics that influence eGovernment performanceThis indicator represents citizens’ ability and willingness to use online services, and is captured by the following two indicators:
■ Digital skills: the Human Capital indi-cator from The Digital Economy and Society Index (DESI) measures the skills needed to realise the potential offered by a digital society. Such skills go from basic user skills that enable individu-als to interact online and to consume digital goods and services, to advanced skills that empower the workforce to use technology for enhancing produc-tivity and fostering economic growth.
■ ICT usage: besides the digital skills of the users, another indicator that is helpful to understand the users’ characteristics is the overall level of ICT usage. The “Use of internet” indica-tor (part of the DESI) covers a variety of activities performed by citizens that are already online. Such activities range from consumption of online content (videos, music, games, etc.) to modern communication activities, online shopping and banking.

eGovernment Benchmark 2017
115
8.3.3 Government’s characteristics that influence eGovernment performanceGovernment’s characteristics indicators show how public organisations act and are organised that influence eGovernment performance. In this analysis, Govern-ment’s characteristics are measured through the following indicators that showed significant correlation with the absolute performance of countries:
■ Quality: this indicator aims at sum-marising in one number a proxy of governments’ action. It is composed of four components:• Regulatory Quality: captures
perceptions of the ability of the government to formulate and implement sound policies and regulations that allow and promote private sector development.
• Rule of Law: captures perceptions of the extent to which agents have confidence in, and obey the rules of society, and in particular: the quality of contract enforcement, property rights, police and the courts, as well as the likelihood of crime and violence.
• Government Effectiveness: cap-tures perceptions of the quality of public services, the quality of the civil service and the degree of its independence from political pres-sures, the quality of policy formula-tion and implementation, and the credibility of the government’s commitment to such policies.
• Reputation: considers the repu-tation of the government. The selected indicator is “Perceived Corruption” calculated by Transpar-ency International, which measures the perceived level of public sector corruption worldwide.
These four indicators are highly corre-lated, hence the Quality indicator has been calculated as a simple average of these four indicators.
■ Openness: This indicator aims at iden-tifying the openness of each country
from an Open Government perspec-tive, it takes into consideration two different aspects:• Open Data: a DESI indicator that
measures the extent to which countries have an Open Data policy in place (including the transposition of the revised PSI Directive), the estimated political, social and economic impact of Open Data and the characteristics (functionalities, data availability and usage) of the national data portal.
• Voice and Accountability: a World Bank indicator that captures perceptions of the extent to which citizens are able to select their government, as well as freedom of expression, freedom of associa-tion, and free media.
The Openness indicator has been computed as a simple average of these two indicators.
8.3.4 Context Characteristics that influence eGovernment performanceContext characteristics represent the digital infrastructure and private sector digitisation of a country, and include:
■ Connectivity: the Connectivity indicator (DESI) measures the deploy-ment of broadband infrastructure and its quality. Access to fast broad-band-enabled services is a necessary condition for competitiveness.
■ Digital in private sector: the Inte-gration of Digital Technology dimen-sion (from the DESI) measures the Digitisation of businesses and their exploitation of the online sales chan-nel. By adopting digital technology, businesses can enhance efficiency, reduce costs and better engage customers, collaborators and busi-ness partners. Furthermore, when the Internet is used as a sales outlet, it offers access to wider markets and potential for growth.

116
8.3.5 Relative indicators analysisFollowing a similar approach as used for the absolute indicators, for each relative indicator the European average and the standard deviation is calculated. This re-sulted in three categories of countries:
■ Low: countries with a percentage lower than μ - δ (where μ is the Euro-pean average and δ is the standard deviation),
■ Medium: countries with a percentage in line with the European average (be-tween μ - δ and μ + δ, where μ is the European average and δ is the stand-ard deviation),
■ High: countries with a high relative indicator’s value (above μ + δ, where μ is the European average and δ is the standard deviation).
Figure 59 shows the geographical position of each country for each relative indica-tor following the three clusters described above, while Figure 60 summarizes coun-try performance.
8
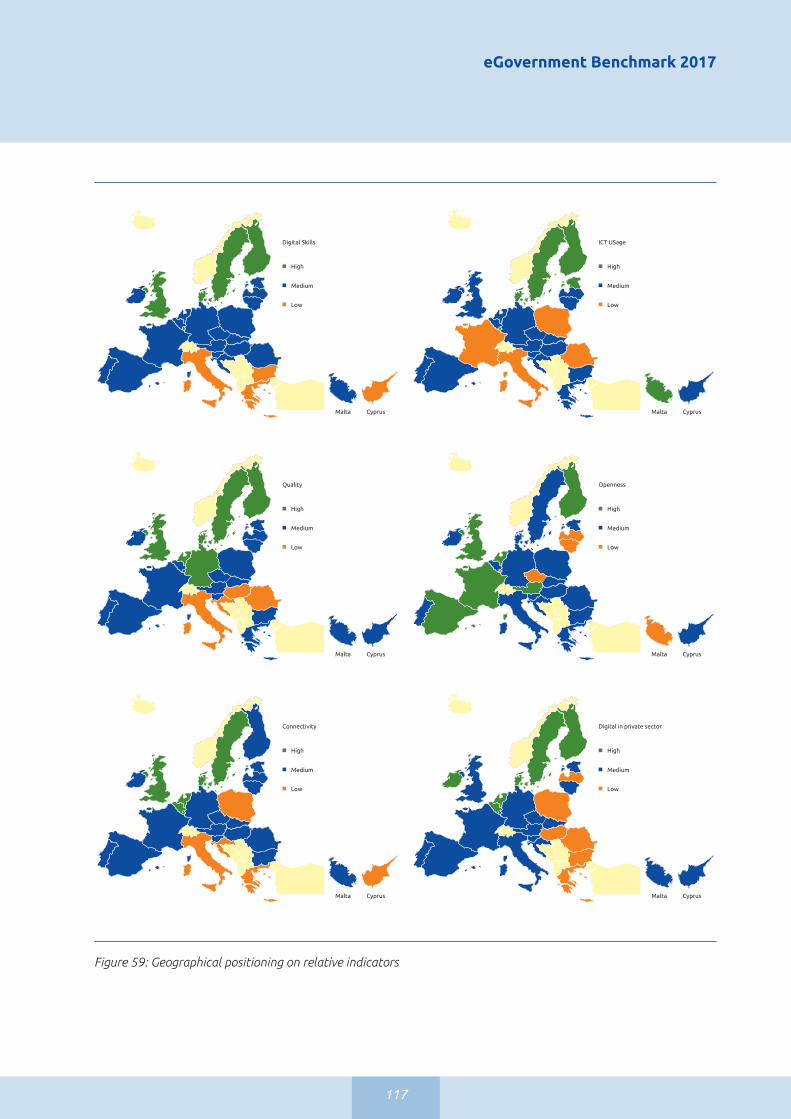
eGovernment Benchmark 2017
117
Digital Skills
Medium
High
Low
Malta Cyprus
Quality
Medium
High
Low
Malta Cyprus
Connectivity
Medium
High
Low
Malta Cyprus
ICT USage
Medium
High
Low
Malta Cyprus
Openness
Medium
High
Low
Malta Cyprus
Digital in private sector
Medium
High
Low
Malta Cyprus
Figure 59: Geographical positioning on relative indicators

118
User characteristics Government characteristics Context characteristics
Digital skills ICT usage Quality Openness ConnectivityDigital in the private
sector
AT Medium Medium Medium High Medium Medium
BE Medium Medium Medium Medium High High
BG Low Medium Low Medium Low Low
HR Medium Medium Low Medium Low Medium
CY Low Medium Medium Medium Low Medium
CZ Medium Medium Medium Low Medium Medium
DK High High High Medium High High
EE Medium High Medium Medium Medium Medium
FI High High High High Medium High
FR Medium Low Medium High Medium Medium
DE Medium Medium High Medium Medium Medium
EL Low Medium Low Medium Low Low
HU Medium Medium Low Medium Medium Low
IE Medium Medium Medium Medium Medium High
IT Low Low Low Medium Low Medium
LV Medium Medium Medium Low Medium Low
LT Medium Medium Medium Low Medium Medium
LU High High High Low High Medium
MT Medium High Medium Low Medium Medium
NL Medium Medium High High High High
PL Medium Low Medium Medium Low Low
PT Medium Medium Medium Medium Medium Medium
RO Low Low Low Medium Medium Low
SK Medium Medium Medium Medium Medium Medium
SI Medium Medium Medium Medium Medium Medium
ES Medium Medium Medium High Medium Medium
SE High High High Medium High High
UK High Medium High High High Medium
Figure 60: Country performance on relative indicators compared to European average
8

eGovernment Benchmark 2017
119
Figure 61: Mock-up visualisation of the performance clusters
8.4 Comparing countries to understand and improve performance
8.4.1 Methodology and data analysisThe benchlearning perspective allows us to explore performance levels, similarities and differences in context, and eGovern-ment implementation across different countries. The purpose is to offer some input for policy makers to identify country specific policies and design or redesign eGovernment strategies.
In the following paragraphs, we provide interpretations of how contextual vari-ables affect a country’s eGovernment per-formance in terms of level of Penetration and level of Digitisation. For that purpose, a linear regression is performed between each relative indicator and each absolute indicator.
When comparing relative with absolute in-dicators, we distinguish three categories. The different categories are based on the
level of the absolute indicator compared to the European trend (Figure 61):■ Average countries: countries for which
the score on the absolute indicators is in line with the European trend.
■ Underperforming countries: countries for which the score on the absolute indi-cators is lower than the European trend.
■ Outperforming countries: countries for which the score on the absolute indicators is higher than the European trend.
In order to distinguish the three different categories, we have chosen a 99% confi-dence level21 for all intervals.
This approach is useful to compare coun-tries and see if there are countries with similar contextual variables but with dif-ferent Digitisation and Penetration levels. Countries with a lower level of Penetration and Digitisation might learn from countries with similar contextual variables but better performances in absolute indicators.
21 Instatistics,theconfidencelevelmeasurestheprobabilitythataparameterfallswithinaspecifiedrangeofvalues,de-finedbetweenlowerandupperlines.Inouranalysis,therangeissupposedtocontainthevalueswitha99%ofprobability.Ifacountryisoutoftherange,itmeansthatthelinearcorrelationmodeldoesnotfitwellforit:country’sspecificperfor-mances were expected better (Underperforming - under the lower line) or worse (Outperforming - above the upper line).
LOW MEDIUM HIGH
30%
40%
50%
60%
70%
80%
90%
100%
20% 30%
Average countries
Outperforming countries
Underperforming countries
40% 50% 60% 70% 80%
Ab
solu
te in
dic
ato
r
Relative indicator

120
In the following sections each of the relative indicators and its correlation with Penetration and Digitisation is analysed.
8.4.2 Users characteristics’ impact on eGovernment performanceUsers’ characteristics have been analysed through two indicators: Digital skills and ICT usage. They are used to analyse how citizens’ ability and willingness to use on-line services might relate to eGovernment performance.
First we look at Digital skills. Digital skills of the population seem to have a small posi-tive correlation with Penetration (Figure 62). By zooming in we can consider more details on countries’ positions. There are five countries (Romania, Bulgaria, Cyprus, Greece and Italy) with a low level of Digital skills. Despite a low level of Digital, Ro-mania is outperforming which is due to its good Penetration level. On the contrary, Italy is underperforming: considering its Digital skills level, it was expected to have a higher level of Penetration. Considering countries with a medium level of Digital skills, Latvia and Lithuania are outperform-ing thanks to a level of Penetration slightly
Figure 62: Digital skills vs Penetration
10%
20%
30%
40%
50%
60%
70%
80%
90%
20% 30% 40% 50% 60% 70% 80%
Pen
etra
tio
n
Digital skills
LOW MEDIUM HIGH
RO
BG
EL
CYPL
PTMT SI
EU28LV
HR
LTSK ES IE
FR
EENL
DK FI
SE
UK
LU
DE
BE
CZHU
IT
AT
above the average. Hungary, Czech Republic, Belgium and Germany are underperforming instead. There are six countries in total with a high level of Digital skills: the Netherlands and Denmark are outperforming; Sweden, United Kingdom and Finland have perfor-mances in line with the expectations and Luxembourg is underperforming.
Digital skills of the population also seem to have a small positive correlation with Digitisation (Figure 63).
Among the countries with a low level of Digital skills, only Greece is underperfo-ming. Instead, among the countries with a medium level of Digital skills, there is a wide variety of results: seven countries are outperforming (Latvia, Lithuania, Portugal, Spain, Malta, Estonia and Austria) and five countries are under-performing (Croatia, Hungary, Slovakia, Czech Republic and Ireland). Lastly, con-sidering the countries with a high level of Digital skills, the Netherlands is the only outperforming country, whereas the United Kingdom and Luxembourg are under performing.
8

eGovernment Benchmark 2017
121
Figure 64: ICT usage vs Penetration
Figure 63: Digital skills vs Digitisation
LOW MEDIUM HIGH
10%
20%
30%
40%
50%
60%
70%
80%
90%
25% 30% 35% 40% 45% 50% 55% 60% 65% 70%
Pen
etra
tio
n
ICT usage
RO
FR
FR
ELCZ
DECY
BE
HU
MTLU
SE
UK
LTLVHRESSK
AT
PTBGSI
PL
IE
NLEE
FI DK
EU28
LOW MEDIUM HIGH
Digital skills
30%
40%
50%
60%
70%
80%
90%
100%
20% 30% 40% 50% 60% 70% 80%
Dig
itis
atio
n
EU28
RO BGEL
HR HU
SKCZ
IEUK
LU
FI
DKNLEE
BEDE
FRSI
PL
CYIT
ES
MT
LV LTPT
AT SE
Second, the analysis focuses on ICT usage. ICT usage of the population seems to have a small positive correlation with Penetra-tion (Figure 64). Only four countries have a low level of ICT usage. Among them, there are two outperforming countries: Romania and
France. Poland performs in line with the average and Italy is underperforming. From the countries with a medium level of ICT usage, only Ireland and the Netherlands are outperforming. On the other hand, there are many underperforming countries (Greece, Czech Republic, Germany, Cyprus, Belgium

122
and Hungary). Estonia, Finland and Den-mark are the three countries with a high level of ICT usage and are outperforming, Malta and Luxembourg are underper-forming.
ICT usage of the population also seems to have a small positive correlation with Dig-itisation (Figure 65). The countries with a lower level of ICT usage all demonstrate a performance in line with the European trend. Among the countries with a me-dium level of ICT usage, there is a greater variability: Austria, Portugal, Spain and Germany are outperforming; Bulgaria, Greece, Slovakia, United Kingdom, Croatia and Hungary are underperforming. Considering countries with a high level of ICT Usage, Malta is outperforming and Luxembourg is underperforming.
8.4.3.Government characteristics’ impact on eGovernment performanceGovernment characteristics have been analysed through two indicators: Quality and Openness.
Quality has been calculated as the aver-age of four different indicators (Regula-
Figure 65: ICT usage vs Digitisation
LOW MEDIUM HIGH
30%
40%
50%
60%
70%
80%
90%
100%
25% 30% 35% 40% 45% 50% 55% 60% 65% 70%
Dig
itis
atio
n
ICT usage
EU28CY
BE
AT
PT ESDE
MT
LT LV
NL EE
FI
DK SE
IECZ
SIFR
PL
IT
ROEL
SK
HR HU
UKLU
BG
tory quality, Rule of Law, Government Effectiveness and Reputation). These four indicators are highly correlated, probably because they all capture citizens’ percep-tions even though they refer to different aspects of government’s quality. The pur-pose of the relative indicator “quality” is to summarize citizens’ perceptions about Government’s quality as a whole.
Quality seems to have a small positive cor-relation with Penetration (Figure 66).
Among the countries with a low level of Quality, Romania and Croatia are outper-forming, Italy instead is underperforming. Considering countries with a medium level of Quality, Estonia is strongly outperform-ing, Lithuania and Slovakia are slightly outperforming (their positioning is almost aligned with the confidence interval). On the other hand, Poland, Cyprus, Portugal Czech Republic Belgium and Austria are underperforming. Denmark and Finland, with the highest level of both Quality and Penetration, are outperforming. Luxem-bourg and Germany are the two underper-forming countries between those with a high level of Quality.
8

eGovernment Benchmark 2017
123
Figure 66: Quality vs Penetration
LOW MEDIUM HIGH
10%
20%
30%
40%
50%
60%
70%
80%
90%
50% 55% 60% 65% 70% 75% 80% 85% 90%
Pen
etra
tio
n
Quality
EU28
EE
RO
BG
ELHU
SI MT
ESLVFR
IE
UK
LU
DE
AT
BEPTCY
PLCZ
NL SE
IT
HR SKLT
DKFI
Quality also seems to have a small positive correlation with Digitisation (Figure 67).
Hungary is the only underperforming coun-try among those with a low Quality level. Considering countries belonging to the medium cluster, there is only one underper-
Figure 67: Quality vs Digitisation
LOW MEDIUM HIGH
30%
40%
50%
60%
70%
80%
90%
100%
50% 55% 60% 65% 70% 75% 80% 85% 90%
Dig
itis
atio
n
Quality
EU28
PTLT
EEAT
DE
IE
LUUKCZ
HU
NL SEDK
FI
FR
BE
SI CY
PL
IT
SK
HRROEL
BG
MT
LVES
forming country (Czech Republic) and several outperforming countries (Malta, Latvia, Spain, Lithuania, Portugal, Estonia, Austria). On the opposite, among the countries with a high level of Quality there are no outperforming countries and only two underperforming countries (Luxembourg and United Kingdom).

124
Openness takes into consideration two different indicators: Open Data (a DESI Indicator) and Voice and accountability (a World Bank indicator).
This indicator is the only one that seems to have only a very small positive correlation with Penetration and no linear relation with Digitisation.
Starting from the Penetration indicator, the graph below (Figure 68) seems to show a small positive correlation. Among the countries with a low level of Openness, only Czech Republic is underperform-ing. Looking at the medium cluster of countries, we can find a heterogeneous situation: there are four outper forming countries (Estonia, Romania, Sweden and Denmark) among which three (Estonia, Sweden and Denmark) perform strongly above the confidence interval’s line. On the opposite, there are seven underper-forming countries (Hungary Cyprus, Portu-gal, Italy, Greece, Poland, and Germany).
The Netherlands and Finland are the two outperforming countries among those with a high level of Openness.
The Openness indicator does not show any positive correlation with Digitisation. Coun-tries might decide to digitalise the front- and back-office of their public administra-tions, but might not publish any open data nor involve citizens in government’s deci-sions. In this respect, the most impressive case is Malta, which has the highest level of Digitisation and the lowest level of Open-ness. The figure shows that the opposite case is not possible: a country cannot be open if it is not digitalised. A country could not publish open data without having digi-talised both back-office and front-office, which constitutes an essential precondition to collect and publish data. Open Data is one of the conditions that allows citizens to be involved in government’s decisions. In fact, the figure shows that the countries with the highest level of Openness are all countries with a good level of Digitisation (France, Finland, Spain, Austria, United Kingdom, and the Netherlands). In the middle, with a level of openness between 45% and 65%, countries show different pictures: either well digitalised countries that did not implement openness policies (Estonia and Lithuania for example), or countries that, although having low level
Figure 68: Openness vs Penetration
LOW MEDIUM HIGH
10%
20%
30%
40%
50%
60%
70%
80%
90%
30% 35% 40% 45% 50% 55% 60% 65% 70% 75% 80%
Pen
etra
tio
n
Openness
EU28
IE
UK
FI
NL
DK
SEEE
RO
SK
ATBG
BESI
HR
LTLV
LU
CZ HU
CYPT
PL
EL
IT
DE
MT
FR ES
8

eGovernment Benchmark 2017
125
Figure 70: Connectivity vs Penetration
Figure 69: : Openness vs Digitisation
LOW MEDIUM HIGH
10%
20%
30%
40%
50%
60%
70%
80%
90%
40% 45% 50% 55% 60% 65% 70% 75% 80% 85%
Pen
etra
tio
n
Connectivity
EU28
IE
AT
LVLT
UK
NL
FR ESSK
BG
HR
PL
EL
IT
CY
HU CZ
PTMT
DE
LU BE
SE
DKFIEE
RO
SI
LOW MEDIUM HIGH
30%
40%
50%
60%
70%
80%
90%
100%
35% 40% 45% 50% 55% 60% 65% 70% 75% 80%
Dig
itisa
tion
Openness
EU28
EL
PL UK
FR
FIES
ATNLDK
DE
SE
PTBE
EE
LT
MT
LV
CZLU
SI
RO HR HU BG
SK
CY IEIT
of Digitisation, have implemented good openness polices (Greece and Poland, but also Bulgaria and Hungary).
8.4.4 Context characteristics’ impact on eGovernment performanceContext characteristics have been ana-
lysed through two indicators: Connectivity and Digital in the private sector.
To measure the connectivity character-istics, the DESI’s Connectivity index has been selected. The Connectivity index seems to have a positive correlation with

126
Penetration (Figure 70). However, there is a great variability of data.
Considering the countries with a low Connectivity level only Italy is underper-forming. In the medium cluster, Estonia and Finland have reached a high level of Penetration, far above the confidence interval; and together with Romania they are the three outperforming countries. On the contrary, Hungary, Czech Republic, Portugal, Malta and Germany are under-performing. In the high cluster, Denmark and Sweden are outperforming, Luxem-bourg and Belgium underperforming.
A clear relation can be discovered when relating Connectivity to Digitisation (Figure 71). All countries with a level of Connectivity below the European aver-age are also countries with a low level of Digitisation (for example Italy, Croatia, Greece and Poland).
Looking at the performance, Greece and Bulgaria are the two countries with a low level of Connectivity and are underper-forming in Digitisation. Romania, Hungary, Ireland Czech Republic have a medium
level of Connectivity but they are under-performing in Digitisation; Spain, Estonia, Austria, Latvia and Malta, on the opposite, have the same level of Connectivity but outperform in Digitisation. Among the countries with a high level of Connectiv-ity, United Kingdom and Luxembourg are underperforming.
To measure digital in the private sector, the DESI indicator Integration of Digital Technology was used, which measures the Digitisation of businesses and their adop-tion of online sales channels.
The relation of Digital in the private sector with Penetration shows a positive correla-tion.
Among the countries with a low level of Digital in the private sector, Roma-nia and Latvia are outperforming, the rest of the countries have performance in line with the European trend. In the medium cluster, there are five countries underperforming (Italy, Czech Republic, Cyprus, Portugal and Germany) and two outperforming (Estonia and United King-dom). Looking at countries with a higher
Figure 71: Connectivity vs Digitisation
LOW MEDIUM HIGH
30%
40%
50%
60%
70%
80%
90%
100%
40% 45% 50% 55% 60% 65% 70% 75% 80% 85%
Dig
itis
atio
n
Connectivity
EU28
EE
MT
ATLV LT
DE
SEDK NL
BE
LUUK
IECZ
HU
FRSICYIT
PLSK
HREL
BG RO
FI PTES
8

eGovernment Benchmark 2017
127
percentage of Digital in private sector, the Netherlands and Finland are outperform-ing and Belgium is underperforming.
Figure 72 shows the correlation between digital in the private sector and Digitisa-tion; also in this case, there seems to be a positive correlation.
Latvia seems have a low level of Digitisa-tion in the private sector despite a high level of Digitisation in the public sector. Hungary, Bulgaria and Greece are under-performing, with a low level of Digital in private sector and a level of Digitisation under the confidence interval line. The medium cluster contains four under-performing countries (Slovakia, United Kingdom, Czech Republic and Croatia) and four outperforming countries (Estonia, Malta, Spain and Austria). Ireland is the only country with a high level of Digital in the private sector and a level of Digitisa-tion under the expectations.
8.4.5 The benchlearning perspectiveThe analysis shows that a digitisation process is driven by a complex mix of dif-ferent factors. The development of eGo-
vernment is strongly correlated with the development of other factors concerning citizens’ preferences and skills, govern-ment’s policies and characteristics, as well as the relation between public administra-tions and the private sector.
There is a positive correlation between almost all of the absolute and relative indicators. An especially strong relation has been found between Digitisation and the relative indicator Quality. This indi-cates that an effective government (i.e. a government with sound policies and regulations, with high quality of public services and gaining citizens’ trust) is also a government with a high level of Digiti-sation. Another strong correlation was found between the Penetration index and user’s characteristics. A country with more skilful citizens and daily internet use is also a country with a widespread usage of eGovernment services.
Figure 73 shows the relative performance of each country for Penetration and Dig-itisation. Performance is given for each relative indicator, as well as overall per-formance. This provides a summary of the
Figure 72: Digital in the private sector vs Penetration
LOW MEDIUM HIGH
10%
20%
30%
40%
50%
60%
70%
80%
90%
15% 20% 25% 30% 35% 40% 45% 50% 55% 60%
Pen
etra
tio
n
Digital in the private sector
EU28
UK
NL
FI
SE
DK
IELT
SK FR HRES
ATSILU
IT
CY
CZ
PT
DE
BEBG
PLHUEL
MT
EE
RO
LV

128
analysis described in the previous para-graphs. Red cells show underperforming countries, when the digitisation or pen-etration level was lower than expected on the basis of the relative indicator. Green cells show outperforming countries, when the digitisation or penetration level was higher than expected on the basis of the relative indicator. Blank cells show countries that show digitisation and penetration levels that were expected on the basis of the relative indicator. For example, Austria was expected to score a higher level of Penetration referring to its level of ‘Quality’, and hence its cell is coloured red. On the opposite, Denmark’s Penetration level is better than the expec-tations starting from its level of ‘Quality’, and hence its cell is coloured green.
The overall impact of relative indicators for Penetration is defined Underperform-ing if the country is Underperforming in at least 4 on 6 relative indicators. Equally, a country is Outperforming if it is Out-performing in at least 4 on 6 indicators. For Digitisation we used the same logic though the total number of relative indi-cators is five (Openness is not correlated
with Digitisation), so the threshold is set to 3 on 5 indicators. Taking Austria as an example again, although the country is ‘Underperforming’ in Penetration with respect to the Quality indicator, the other five relative indicators are at average level, which leads to Austria scoring ‘aver-age’ as overall result for Penetration. An example for Digitisation is Estonia, which is ‘Outperforming’ not only with respect to Digital skills, but also concerning Qual-ity, Connectivity, and Digital in the private sector. Estonia is ‘Outperforming’ in 4 of 5 relative indicators and the overall per-formance on Digitisation is hence set as ‘Outperforming’.
Figure 74 shows the position of each country in terms of absolute performanc-es (i.e. levels of Penetration and Digiti-sation) and relative performances (i.e. influence of context variables on absolute performance). The arrows therefore signal that a country’s score in either Digitisation or Performance are not what would be expected in terms of its context charac-teristics (i.e. relative indicators) but higher (i.e. upward or rightward leaning) or lower (i.e. downward or leftward leaning).
8
Figure 73: Digital in the private sector vs Digitisation
LOW MEDIUM HIGH
30%
40%
50%
60%
70%
80%
90%
100%
15% 20% 25% 30% 35% 40% 45% 50% 55% 60%
Dig
itis
atio
n
Digital in the private sector
EU28
MT
ATNL SE
NL
DK
DE
SI
CZUK
HR
CYFR
BE
SKLU
IT
PL
ROEL
BGHU
PTLT
IE
ES
EE
LV

eGovernment Benchmark 2017
129
Penetration Digitisation
Dig
ital
ski
lls
ICT
usa
ge
Qua
lity
Op
enne
ss
Co
nnec
tivi
ty
Dig
ital
in p
riva
te s
ecto
r
Ove
rall
Dig
ital
ski
lls
ICT
usa
ge
Qua
lity
Op
enne
ss
Co
nnec
tivi
ty
Dig
ital
in p
riva
te s
ecto
r
Ove
rall
AT Average Outperforming
BE Underperforming Average
BG Average Underperforming
HR Average Underperforming
CY Underperforming Average
CZ Underperforming Underperforming
DK Outperforming Average
EE Outperforming Outperforming
FI Outperforming Average
FR Average Average
DE Underperforming Average
EL Average Underperforming
HU Underperforming Underperforming
IE Average Underperforming
IT Underperforming Average
LV Average Outperforming
LT Average Average
LU Underperforming Underperforming
MT Average Outperforming
NL Outperforming Average
PL Average Average
PT Underperforming Outperforming
RO Outperforming Average
SK Average Underperforming
SI Average Average
ES Average Outperforming
SE Average Average
UK Average Underperforming
Figure 74: Penetration and Digitisation relative performances

130
8
Figure 75: Digitisation vs Penetration
Non-consolidated eGov
Fruitful eGov
Expandable eGov
LOW MEDIUM HIGH
LOW
MED
IUM
HIG
H
10%
20%
30%
40%
50%
60%
70%
80%
90%
30% 40% 50% 60% 70% 80% 90% 100%
Outperformingin Penetration
Underperformingin Penetration
Outperformingin Digitisation
Underformingin Digitisation
Pen
etra
tio
n
LEGEND
Digitisation
Unexploited eGov
RO
HR
LU
CZ
IT
BE PT
ATMT
LV
LT
FI
NL
DK
EEEE
NL
SESE
ES
DE
CYPL
SI
FREU28
BG
HU
EL
SK
IE
UK
Average
Estonia is the only country outperform-ing in both Digitisation and Penetration. Denmark, Finland, the Netherlands and Romania are outperforming in Penetra-tion, and in line performance in Digitisa-tion. Austria, Latvia, Malta and Spain are outperforming in Digitisation, and show in line performance in Penetration.
Portugal shows good relative perfor-mances for Digitisation, but is under-performing in Penetration. France, Lithuania, Poland, Slovenia and Sweden perform in line with their characteris-
tics (i.e. relative indicators). Belgium, Cyprus, Italy and Germany are under-performing in Penetration, while they perform in line in terms of Digitisation. Looking at Digitisation instead, Bulgaria, Croatia, Greece, Ireland, Slovakia and United Kingdom, are underperforming, while they are performing in line with Penetration averages.
The Czech Republic, Luxembourg and Hungary show a relative performance below the European trend, both in Pen-etration and in Digitisation.

eGovernment Benchmark 2017
131
8.5 Improving the framework: consid-erations for future applications The benchlearning exercise aims to support understanding of a country’s eGovernment performance with respect to other countries and to suggest possible ways to overcome potential gaps. To this end, we categorised countries accord-ing to their performance on a number of relative indicators for Penetration and Digitisation. Consequently, each country can compare itself to, and try to learn from, other countries which have similar contexts, but reach better performances.
Although this study introduces important elements for reflection, there is still room for improvement in future research. In fact, we will aim at extending the relative variables that we have used in the second step of the analysis, including historical data that can strengthen and increase the accuracy of constructed groups. This will be possible in the next few years, when historical series on our variables of interest will become available. In addition, future developments should be oriented towards the identification of specific relative indicators for Penetrations and for Digitisation, in order to increase the validity and the relevance of the implica-tions, and to improve the type, the quality and the quantity of data collected for the analysis.

132
Annex I: Relative indicators
I
Figure I.1 Complete list of relative indicators analysed
Index Source
Total public expenditure in % GDP AMECO
Public investment in% of GDP AMECO
Public debt in % of GDP AMECO
Public deficit in % of GDP AMECO
Strategic planning capacity Bertelsmann Stiftung- Sustainable governance indicator
SGI implementation capacity Bertelsmann Stiftung- Sustainable governance indicator
Interministerial coordination Bertelsmann Stiftung- Sustainable governance indicator
Societal consultation Bertelsmann Stiftung- Sustainable governance indicator
Use of evidence based instruments Bertelsmann Stiftung- Sustainable governance indicator
Human Capital Digital economy and society index
STEM Graduates Digital economy and society index
Basic Digital Skills Digital economy and society index
ICT Specialists Digital economy and society index
Use of Internet Digital economy and society index
Content Digital economy and society index
Communication Digital economy and society index
Transactions Digital economy and society index
Open Data Digital economy and society index
Connectivity Digital economy and society index
Fixed Broadband Digital economy and society index
Mobile Broadband Digital economy and society index
Speed Digital economy and society index
Affordability Digital economy and society index
Integration of Digital Technology Digital economy and society index
Business digitization Digital economy and society index
eCommerce Digital economy and society index
Total expenditures as % of GDP AMECO
Government employment in % of total labour workforce OECD- government at a glance
Share of central government in general government employment OECD- government at a glance
Strategic planning capacity (1-10) Geert Hofstede's six dimension model of national culture
Trust in government Eurobarometer 85- Spring 2016
Population Eurostat
GDP per capita Eurostat
Gallup perception of corruption Gallup World Poll
Power distance Geert Hofstede's six dimension model of national culture

eGovernment Benchmark 2017
133
Index Source
Individualism / Collectivism Geert Hofstede's six dimension model of national culture
Masculinity / Feminity Geert Hofstede's six dimension model of national culture
Uncertainty avoidance Geert Hofstede's six dimension model of national culture
Long-term Orientation Geert Hofstede's six dimension model of national culture
Indulgence/self-restraint Geert Hofstede's six dimension model of national culture
Public spending on education OECD
Public unemployment spending OECD
Social spending OECD
Pension spending OECD
Family benefits public spending OECD
Public spending on incapacity OECD
Social benefits to households OECD
Perceived Corruption Transparency International
Online services UN e-government Index
Public sector performance World economic forum- Global competitiveness index
Control of corruption Worldbank- worldwide governance indicator
Voice and accountability Worldbank- worldwide governance indicator
Regulatory quality Worldbank- worldwide governance indicator
Rule of law Worldbank- worldwide governance indicator
Government effectiveness Worldbank- worldwide governance indicator
Figure I.2: Users’ characteristics
Dimension Indicator Year Description SourceData of
extraction
ICT usage Use of Internet 2016
The Use of Internet dimension accounts for the variety of activities performed by citizens already online. Such activities range from consumption of online content (videos, music, games, etc.) to modern communication activities,online shopping and banking.
DESI June 2017
Digital Skills Human Capital 2016
The Human Capital dimension measures the skills needed to take advantage of the possibilities offered by a digital society. Such skills go from basic user skills that enable individuals to interact online and consume digital goods and services, to advanced skills that empower the workforce to take advantage of technology for enhanced productivity and economic growth.
DESI June 2017

134
I
Figure I.3: Government’s characteristics
Dimension Indicator Year Description SourceData of
extraction
Quality
Regulatory quality
2015
Regulatory Quality captures perceptions of the ability of the government to formulate and implement sound policies and regulations that permit and promote private sector de-velopment. This estimate gives the country's score on the aggregate indicator, in units of a standard normal distribution.
World Bank June 2017
Rule of law 2015
Rule of Law captures perceptions of the extent to which citizens have confidence in and obey the rules of society, and in parti-cular the quality of contract enforcement, property rights, the police, and the courts, as well as the likelihood of crime and violence. This estimate gives the country's score on the aggregate indicator, in units of a standard normal distribution.
World Bank June 2017
Government effectiveness
2015
Government Effectiveness captures percepti-ons of the quality of public services, the quality of the civil service and the degree of its inde-pendence from political pressures, the quality of policy formulation and implementation, and the credibility of the government's commit-ment to such policies. This estimate gives the country's score on the aggregate indicator, in units of a standard normal distribution.
World Bank June 2017
Corruption Perception
Index2016
The Corruption Perceptions Index measures the perceived levels of public sector corrup-tion worldwide.
Transparency International
June 2017
Openness
Open Data 2016
This indicator measures to what extent countries have an Open Data policy in place (including the transposition of the revised PSI Directive), the estimated political, social and economic impact of Open Data and the characteristics (functionalities, data availability and usage) of the national data portal.
DESI June 2017
Voice and accountability
2015
Voice and Accountability captures perceptions of the extent to which country's citizens are able to select their government, as well as freedom of expression, freedom of associa-tion, and a free media. This estimate gives the country's score on the aggregate indicator, in units of a standard normal distribution.
World Bank June 2017

eGovernment Benchmark 2017
135
Figure I.4: Characteristics of the context
Dimension Indicator Year Description SourceData of
extraction
Connectivity Connectivity 2016
The Connectivity dimension measures the deployment of broadband infrastructure and its quality. Access to fast broadband-enabled services is a necessary condition for competi-tiveness.
DESI June 2017
Digital in the private sector
Integration of Digital
Technology 2016
The Integration of Digital Technology dimension measures the digitisation of businesses and their use of the online sales channel. By adopting digi-tal technology businesses can enhance efficiency, reduce costs and better engage customers, colla-borators and business partners. Furthermore, the Internet as a sales outlet offers access to wider markets and potential for growth.
DESI June 2017
Dimension Indicator Year Description SourceData of
extraction
Quality
Regulatory quality
2015
Regulatory Quality captures perceptions of the ability of the government to formulate and implement sound policies and regulations that permit and promote private sector de-velopment. This estimate gives the country's score on the aggregate indicator, in units of a standard normal distribution.
World Bank June 2017
Rule of law 2015
Rule of Law captures perceptions of the extent to which citizens have confidence in and obey the rules of society, and in parti-cular the quality of contract enforcement, property rights, the police, and the courts, as well as the likelihood of crime and violence. This estimate gives the country's score on the aggregate indicator, in units of a standard normal distribution.
World Bank June 2017
Government effectiveness
2015
Government Effectiveness captures percepti-ons of the quality of public services, the quality of the civil service and the degree of its inde-pendence from political pressures, the quality of policy formulation and implementation, and the credibility of the government's commit-ment to such policies. This estimate gives the country's score on the aggregate indicator, in units of a standard normal distribution.
World Bank June 2017
Corruption Perception
Index2016
The Corruption Perceptions Index measures the perceived levels of public sector corrup-tion worldwide.
Transparency International
June 2017
Openness
Open Data 2016
This indicator measures to what extent countries have an Open Data policy in place (including the transposition of the revised PSI Directive), the estimated political, social and economic impact of Open Data and the characteristics (functionalities, data availability and usage) of the national data portal.
DESI June 2017
Voice and accountability
2015
Voice and Accountability captures perceptions of the extent to which country's citizens are able to select their government, as well as freedom of expression, freedom of associa-tion, and a free media. This estimate gives the country's score on the aggregate indicator, in units of a standard normal distribution.
World Bank June 2017
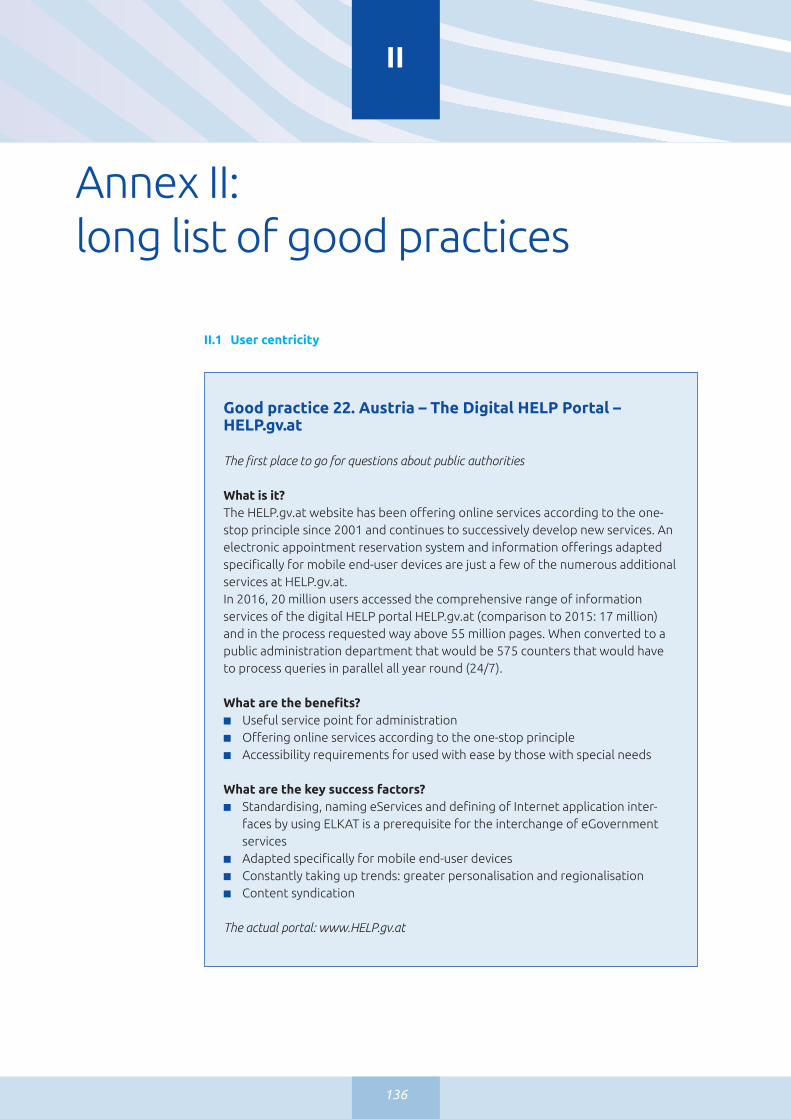
136
Annex II: long list of good practices
II
II.1 User centricity
Good practice 22. Austria – The Digital HELP Portal – HELP.gv.at
The first place to go for questions about public authorities
What is it?The HELP.gv.at website has been offering online services according to the one-stop principle since 2001 and continues to successively develop new services. An electronic appointment reservation system and information offerings adapted specifically for mobile end-user devices are just a few of the numerous additional services at HELP.gv.at. In 2016, 20 million users accessed the comprehensive range of information services of the digital HELP portal HELP.gv.at (comparison to 2015: 17 million) and in the process requested way above 55 million pages. When converted to a public administration department that would be 575 counters that would have to process queries in parallel all year round (24/7).
What are the benefits? ■ Useful service point for administration■ Offering online services according to the one-stop principle■ Accessibility requirements for used with ease by those with special needs
What are the key success factors?■ Standardising, naming eServices and defining of Internet application inter-
faces by using ELKAT is a prerequisite for the interchange of eGovernment services
■ Adapted specifically for mobile end-user devices■ Constantly taking up trends: greater personalisation and regionalisation■ Content syndication
The actual portal: www.HELP.gv.at

eGovernment Benchmark 2017
137
Good practice 23. Austria – Non Stop Service: Application-free tax credit assessment of employees
An important step towards equitable distribution
What is it?The burden will be eliminated through the loss of manual processing steps. The application-free assessment of employees that will automatically produce the tax credit for hundreds of thousands of employees for the first time in autumn 2017 for the assessment for 2016 is already regulated by law.
Statistically, lower household incomes use less frequently tax assessment of employees. In this matter the application free assessment of employees can be seen as an important step towards an equitable distribution and fair taxation at a national level.
What are the benefits? ■ Automated service■ Non-stop-government-service tax payers■ Safes tax payers valuable time and costs and refund taxes automatically
What are the key success factors?■ Re-use of information■ Reduction of administration interaction to a possible minimum
The actual portal: www.HELP.gv.at
138
Good practice 24. Austria – Petition Platform of the City of Vienna
eGovernment solution as a key element for eParticipation
What is it?One of the most important elements of eGovernment offers is more opportunities for participating and having a voice in community matters. eGovernment makes this possible because it is the basis for e-democracy: a living electronic democracy. Support platforms such as that of the city of Vienna underline the democratic potential of eGovernment services in practice. Via the platform, the city of Vienna offers citizens the opportunity of submitting specific concerns conveniently ir-respective of location and time via Internet to the municipal council committee for petitions and citizen initiatives (petition committee).
What are the benefits? ■ Meets a high level of transparency■ e-Democracy solution
What are the key success factors?■ Offers participation to the online community■ Fully eID implemented■ 24/7 available – no visit at authorities necessary
The actual portal: https://www.wien.gv.at/petition/online/

eGovernment Benchmark 2017
139
Good practice 25. France – 10 golden principles to help create exemplary digital services
What is it?It is a clear and simple synthetic document which provides the basis for digital ser-vices that are efficient and close to their users. These essential principles are one of the outcomes of the digital services dashboard SGMAP has used since 2012 to monitor user satisfaction for online services. Based on five years of results, the unit has identified success factors and best practices to help create exemplary digital services. It is designed for everyone that works in the public services.
What are the benefits? ■ Efficient tool to communicate and explain User experience ■ Better understanding of the reason behind rules and standards. ■ Better digital services
What are the key success factors?■ Focus on real procedures and real users ■ Co-design with publics services, focus group with users■ Good communication
(https://joinup.ec.europa.eu/community/epractice/news/france-shares-tips- efficient-digital-services)
140
Good practice 26. Latvia – Procurement
Centralised e-procurement
What is it?Latvia has successfully introduced Centralised e-procurement system – automatic validation of Procurement exclusion criteria as an “Once only” principle in practice. Before this introduction entrepreneur had to visit at least 3 institutions to get compliance approvals to submit with procurement documentation (on tax dets; Law offencesl Insolvency). Even when you participated in Public Procurement of State Revenue Service, one had to submit compliance approval of State Revenue Service. Now entrepreneur is not anymore involved – Real Time data are gathered from 123 state and municipal registers and to procurement commission presented via single dashboard. First year (2016) results show that each entrepreneur saves 8,2 hours per procure-ment and while government saves equivalent of work hours of 14 employees. In addition to the first year results: ■ 21036 procurement validations■ Economy for Business - €1,5mio (7856h)■ Economy for Gov – 214’756 €For more information: https://www.eis.gov.lv/EIS/
What are the benefits? ■ Centralisation of procurement■ Saves time for both entrepreneurs and public administration employees
What are the key success factors?■ Real time data

eGovernment Benchmark 2017
141
Good practice 27. Norway – Your sick leave
The Norwegian Welfare and Labour Authority (NAV) is digitalising its communication with employees, employers and doctors.
What is it?“Your sick leave” is a digitalisation of processes that arise and must be completed when a person is absent from work due to illness. Following a consultation with their doctor, a patient will receive an SMS-message with a link to nav.no where they can log in to see what will happen during their sick leave. They can also send notice of their sick leave to their employer.
The company or organisation where the patient is employed will receive a notifica-tion of the employee’s absence due to illness in Altinn, Norway’s portal for commu-nication between public authorities, businesses and citizens. The company reports back the name of the employee’s personnel manager. This personnel manager will then receive a link via SMS to their own page on nav.no, where they will find an overview of sick leave notices and tasks.
What are the benefits? NAV processes more than 3.8 million sick leave notices annually for 950 000 individuals; this means a great deal of paper work and face-to-face meetings. ■ Time saving for employers ■ Easier follow up on sick employees ■ Better awareness of content of sick leave and application for sick pay ■ Quicker and earlier access to sick employees for NAV advisors ■ Greater awareness of possible combination of sick leave and work-related or
other activities. ■ Fewer telephone and front desk enquiries at NAV■ Faster and higher quality case processing
What are the key success factors?■ Use of service design methodology■ Holistic approach to understanding processes■ Prototype testing■ Flexible development methods ■ Providing insights into benefits

142
Good practice 28. Portugal – Simplex +Program
National simplification and modernisation program
What is it?SIMPLEX+ is a collaborative and nationwide simplification program towards the co-creation new online public services, optimize existing ones and de-bureaucratize the relationship between public institutions and civil society. It was re-launched in 2016, after a successful edition that ran from 2006 to 2011.
Based on a highly collaborative approach, the public bodies in charge of the admin-istrative modernization in Portugal – Ministry, Secretary of State and Agency for the Administrative Modernization – toured the country and used numerous tools to listen and collect inputs from citizens, businesses, academia, associations and public officials, to map their priority services and what laws could be simplified.
In 2016, 255 cross-cutting measures were identified and are currently in deploy-ment, while for 2017, the programme has 172 new simplification and modernisa-tion measures.
Examples of implemented measures are the “Automatic Income Tax Assesment and Returns”, giving body to the once-only principle, or the “Citizen Caldendar”, an online cross-cutting app that stands as the single point for information about all major events and interactions with the Public Administration.
What are the benefits? ■ User-driven approach that leads to greater user satisfaction■ Improved efficiency & effectiveness in public services delivery■ Breaking of institutional silos
What are the key success factors?■ Strong political commitment■ Citizen engagement ■ Public Administration engagement■ Transparency on results

eGovernment Benchmark 2017
143
Good practice 29. Turkey – Disadvantageous group inclusiveness in e-Government Portal
e-Government Portal
What is it?Turkey eGov. Portal (www.turkiye.gov.tr) is reached nearly 35 million users (nearly %45 percentage of population), 2.500 e-Government services. Approximately 2.000 of services is served from local governments. eGov. Portal designed user-centric and also take into account vulnerable citizens who have hearing or speech impaired.
Users can connect to our sign language experts by video call at the e-Government Portal Call Center and get support by asking all your questions about the e-Gov-ernment Gate. e-Government Portal video call center serves only users who have hearing or speech impaired. If user do not have a barrier that prevents from using phone or do not know the sign language, can call 160.
What are the benefits? ■ The use of e-government services by disadvantaged groups
What are the key success factors?■ Highly based on user needs
144
Good practice 30. Turkey – eJustice SMSIS
SMS Information System
What is it?The SMS Judicial information system provides an outstanding service for the citizens and lawyers which enables them to receive SMS messages containing legal information such as ongoing cases, dates of court hearings, the last change in the case and suits or dept claims against them. Therefore, they can be instantly informed by SMS about any kind of legal event related to them without going to courts. A cooperation agreement has been signed with the GSM operators in order to establish this system that makes it possible to send SMS to the concerning par-ties’ mobile phones. This System aims automatically inform all related parties of cases when any legal event, data or announcement (which has to be sent parties) realized by the judicial units such as courts, public prosecutor offices and enforce-ment offices. Sending SMS does not replace official notification as it provides in-formation to the parties so that they can take necessary measures in time without delay in order to prevent loss of legal rights. For subscribe the this system by send-ing cost-free SMS to 4060 containing citizen ID number and the phrase of ‘’ABONE’’ (SUBSCRIBE). After that if the subscriber receive the SMS charged pittance for each SMS.
What are the benefits? ■ Reducing the process and labor■ Cost, time and paper effectiveness
What are the key success factors?■ Stakeholder involvement

eGovernment Benchmark 2017
145
Good practice 31. Malta – Maltapps
What is it?The first wave of mobile government services were launched in March 2017 with the first set of mobile apps that give access to a wide range of public services, such as taxation, education and culture. The services can be accessed by the ‘mother app’ maltapps which provides visibility and easy access to all Malta Government published mServices. It allows the user to enlist all published mServices as well as the ability to install and launch the respective apps directly from within the maltapps app.
To facilitate the identification of mServices, each service is classified under 12 sec-tors, representing the various Government entities and departments. An exam-ple of mServices under maltapps is the MyTax Toolkit which assists taxpayers in checking tax and social security contributions deducted from their salary. Another example is the Fronter app which is a learning platform that can notify students about new assignments, tests and news from their teacher.
The second wave of mobile apps, planned to be launched in March 2018, will offer citizens additional functionalities such as mTransactions. This will allow the citizens to carry out payments via their mobile devices. In addition, Malta intends to intro-duce apps to facilitate eDemocracy through the mobile channel with apps that give citizens and businesses the opportunity to provide feedback and participate in certain government decision-making processes.
What are the benefits? ■ Improves service quality■ Maltapps allows citizens to easily locate official government mServices without
the need to search them in the respective app stores■ Each enlisted mService is classified under the respective super sector allowing
easier access and identification of mServices. The mServices classification under the associated super sector also complements the servizz.gov super sector clas-sification of services
What are the key success factors?■ Total App downloads/ usage■ Reviews about use
Source: The Maltapps can be accessed from the following URLs:Android: https://play.google.com/store/apps/details?id=mt.gov.maltapps iOS: https://itunes.apple.com/us/app/maltapps/id1164384262 Windows: https://www.microsoft.com/en-mt/store/p/maltapps/9nblggh42c1x

146
Good practice 32. Malta – The Servizz.Gov Portal
SMS Information System
What is it?The Servizz.Gov Portal is the national online guide for all Government services, and allows citizens to communicate with central government, local councils and public entities in order to tell the government about their needs and expectations. To facilitate the identification of the services, each service is classified under 12 sectors, representing the various Government entities and department. The 12 sectors are the following:■ Culture and Leisure■ Police, Justice and Defence■ Education, Science and Technology■ Health and Community Care■ Environment, Energy, Agriculture and Fisheries■ Work and Employment Services■ Transport and Communications■ Inclusion, Equality and Social Welfare■ Identity, Citizenship and Immigration■ Tax and Finance■ Economy, Business and Trade■ Other
What are the benefits? ■ Improves service quality■ Simplifies access to government services■ Serves as a centralized platform through which an individual can send a request
on any government service■ Citizens do not need to worry where to address requests. This is because this
centralized system collaborates with Ministries, Department, entities and Local Councils and sends the request to the Department or entity concerned
■ Allows citizens to easily find government online services without the need to search them in the respective department / entity website
■ Each enlisted service is classified under the respective super sector allowing easier access
What are the key success factors?■ Establishing a national One-Stop-Shop Service for Citizens
Source: The Servizz.Gov portal can be accessed from http://servizz.gov.mt.

eGovernment Benchmark 2017
147
Good practice 33. Austria – data.gv.at and opendataportal.at
Open (Government) Data Portals Austria
What is it?With data.gv.at an internationally prize-winning central platform for open, non-personal and non-infrastructure-critical administration data has been created in Austria which aims to make it possible for users to find the required data and applications quickly and easily via a single electronic point of contact. The portal, as a central “Austria” catalogue, brings together the meta data of the decentralised data catalogues in Austria. The applications that have been created up to now on the basis of these data records can be retrieved directly on the platform.
The Open Data Portal of Austria (opendataportal.at) is the equivalent of data.gv.at for the open non-government data of Austria. It offers the opportunity for business, science, culture, NGOs and civilian society to provide all users with non-personal data.
What are the benefits? ■ Open data freely accessible in the interest of the general public■ Development of new products and services■ Transparency of administrative activities, to improve collaboration between
politics, administration, business, research and citizens and to strengthen de-mocracy
What are the key success factors?■ Data without any restriction regarding free use, dissemination and further use
Creates a common “data language” available
The actual portals: www.data.gv.at and www.opendataportal.at
II.2 Transparency

148
Good practice 35. Finland – TUTKI HANKINTOJA
Finnish transparency website
What is it?www.tutkihankintoja.fi is a service that shows, on a company level, where a state organization has procured something and by which amount. The site is also avail-able in English: https://tutkihankintoja.fi/?lang=en
What are the benefits? ■ Transparency on a detailed level of suppliers■ Allowing for insightful spending comparisons
What are the key success factors?■ Building an easy to use and visual tool■ Profound filtering functionality in order to offer personalised analyses
Good practice 34. Czech Republic – Monitor (graphic budgets)
Administration budget and accounting information portal
What is it?MONITOR is an information portal of Ministry of Finance of Czech Republic, which allows free entry to budget and accounting information from all levels of state administration and autonomy. Presented information come from IISSP (Integrated information system of Treasury) and Central system accounting information of state (CSUIS) and they are updated quarterly.
What are the benefits? ■ Clear graphic overview of budgets■ Information provided on state and regional level
What are the key success factors?■ to report accurate financial, accounting and analytical data■ to attract the participation of people in public life ■ to increase transparency of public administration and improve satisfaction with
the public administration
Source: http://monitor.statnipokladna.cz/en/2016/

eGovernment Benchmark 2017
149
Good practice 36. Latvia – Tax and pension services
Financial e-services
What is it?Latvia boasts that it provides citizens and good transparency in decision making in improving the work of the institutions. ICT tools help you easily to propose legisla-tive initiatives, follow the Cabinet of Ministers and the Saeima meeting broadcasts, access to the draft legislation and also provide its proposals on the work of the institutions and service improvement. Also for citizens and businesses are avail-able in more than 500 easy-to-use public e-services, which significantly reduces the administrative burden. You can easily and quickly fill out electronic tax declaration, to receive tax rebate. Tax administration is almost fully digitised. The Enterprise Register ~ 40% of cases, company registration and submission of changes taking place at a distance.
Examples of live events:
Where to obtain information about my old-age pension electronically – everyone has the opportunity to electronically access to their own pension forecast, as well as the follow-up of the old-age pension. In this life event is likely to make sure that the employer pays taxes, to verify any information on seniority is accrued into the State Social Insurance Agency, to find out what constitutes the length of periods of insurance, receive information on the already accumulated pension capital and get a forecast of possible amount of an old-age pension.
What are the benefits? ■ Save time and reduce administration burden■ Full insight in tax and pension situation
What are the key success factors?■ Level of digitalisation

150
Good practice 37. Turkey – eJustice e-Sales Portal
Sale of confiscated assets electronically
What is it?e-Sales Portal is a service for the enforcement and bankruptcy offices to publish the bids according to the provisions of the 2004 Numbered Bankruptcy and Insol-vency Act and to offer by electronic deposit collateral to the bid. Bankruptcy and insolvency departments of the foreclosure sale process, which is combined with technology has become an indispensable part of our lives is intended to be made of the sales process in more transparent environment. Transparent executive office at auction environment will further increase confidence in the judiciary by providing and will reinforce restoring the people’s rights via judgment channel.
What are the benefits? ■ Transparency■ Sales of assets on equity■ Protection of competition■ Promotion recovery of depts ratio
What are the key success factors?■ Integration of services and data

eGovernment Benchmark 2017
151
Good practice 38. Turkey – eJustice Lawyer Portal
Judicial and administrative efficiency
What is it?Lawyers can open online case and online enforcement proceedings (e-tracking) via UYAP by connecting with e-signature, mobile signature or e-government and on-line connecting during office hours. Lawyers can view their open and closed cases with procuration intra vires. Lawyers can also view the other cases without procu-ration by getting approval from the authorized judge. Lawyers can electronically take a copy of case files, commit e-signed documents (petition of alibis, response, procuration etc.) to the cases, access the phases, view the hearing dates, and electronically pay the fee and the expenses. Lawyers can also question the debtor‘s MERNIS address in the executive offices by paying deposit with their barcard or Vakıfbank account. From the Transactions menu, the lawyers can follow their approval requests of online examination of the case file and the submitted documents.
What are the benefits? ■ Electronically access to all judicial and administrative case■ Cost and time effectiveness■ Fast and easy access to judicial process■ Availability of online file a claim■ Availability of online payment judicial cost
What are the key success factors?■ Integration of different services

152
Good practice 39. Turkey – eJustice Institution Portal
Sale of confiscated assets electronically
What is it?UYAP Institution Portal is a service offered by the Ministry of Justice for both the public and private institutions. Via the Institution Portal, institutions can online fol-low their case files that are closed or pending in judicial and administrative courts and execution offices. UYAP Institution Portal Information System provides access to justice via more efficient ways by eliminating the time, labor and overtime costs for going to the courthouse to get information about the case file. With Institution Portal, legal deadlines can be identified easily and accurately, conclusions can be in a shorter time, the court’s work can be in order and under supervision and thus prevent the possible loss of rights and the occurrence of undue grievances.
What are the benefits? ■ Fast and easy access to judicial process
What are the key success factors?■ Integration of different services

eGovernment Benchmark 2017
153
Good practice 40. Turkey – Dynamic – Sport Information System
National Sports Application
What is it?Dynamic – Sport Information System provides digitalization of all sports related workflows and data. In this context, individuals are able to view self-information, can obtain verifiable documents and can fill out applications throughout E-Govern-ment gateway.
What are the benefits? ■ It provides sports related data to be used nationwide from single source■ It prevents public employees from making mistakes due to the fact that the
implemented algorithms follow written regulations■ Citizens are provided access to the services instantly■ It prevents forgery of documents■ It provides instant tracking and reporting of all data to the senior executives■ Verification of the participants to the sports competition operation is
digitalized with modern practices
What are the key success factors?■ It is used by provincial directorates & sports federations and addresses to all
sports community■ For the present, approximately 2 million operations are done, expectations for
the years to come will be multiplied by hundred■ User friendly UI design

154
Good practice 41. Malta – The eCourts Portal
What is it?The eCourts portal is a ‘mobile first’ website that provides a digital view to the work-ings of the Judicial process to both legal professionals and citizens (as litigants). Legal professionals have access to Civil Cases, Court Acts, Warrants of a civil nature such as warrant of seizure and additionally are provided with access to a log of all electronic notifications and emails sent to them by the Courts systems. Citizens have access to the MyActs that allows them to view all Acts filed in their name, and additionally fol-low the notification process thus allowing them to be informed of the progress done in the service of the documents by Court Marshalls. MyCases gives access to their civil case details and the digitized case file documents, in effect creating ‘a digital case file in your pocket’. The site allows litigants to register for Mobile Notifications. This service allows citizens to be electronically kept abreast with their civil case sittings and informed of any case deferrals. Citizens can also Pay Court Fines electronically and this provides an easy method for those citizens facing financial difficulties to pay these fines in monthly instalments.
What are the benefits? ■ The eCourts online service facilitates and possibly expedites Courts processes as
information is available digitally and therefore without the need to be physically present in the Courts to gain access to it
■ Citizens have unencumbered access to their digital civil case file, therefore allow-ing them to have better visibility and insight to the proceedings
■ Having better visibility, citizens are now in the ‘driving seat’ and no longer totally dependent on their legal professionals to drive their cause forward
■ Legal Professionals can provide a better service to their clients as they are able to digitally reference civil case files without the need to be physically present in the Courts buildings
■ It allows the legal professional to be electronically notified and to monitor the notification of official documents to third parties at any time of the day and from their offices or mobile devices
■ Citizens are kept abreast of their Court appointments as eCourts provides an easy way to register for notifications of Courts sittings that they have an interest in
■ Citizens can receive notifications of any deferred case in a timely manner therefore reducing the inconvenience and negative impact of travelling to the Courts for a sitting which has been deferred
What are the key success factors?■ The Citizen services increase the transparency of the process and allows them to
positively influence the disposition time of the case■ The Mobile Notifications will improve the attendance rates and hasten the Court
proceedings■ Electronic Payment of Court Fines facilitates the staggered payment of fines and
allows the citizen to view the residual dues, therefore reducing the number of fines that are converted into imprisonment
Source: The eCourts portal can be accessed from https://ecourts.gov.mt.

eGovernment Benchmark 2017
155
Good practice 42. Austria – Mobile Phone Signature
Your electronic ID and your signature on the Internet
What is it?The mobile phone signature makes it possible to use qualified electronic signatures with a mobile phone. In contrast to the card-based citizen card, installing software and additional hardware (card reader) is no longer necessary. With the mobile phone signature, users thus have a digital ID as well as the electronic signature function at their disposal. In future, citizens should be able to use the existing eID not just throughout the EU; it should also become an electronic identity document when it is assigned certain attributes (e.g. driving license, youth pass, identity card, etc.). An exclusively administrative registration process will provide even greater security.
What are the benefits? ■ Fast service for citizens, and services are available outside office hoursMobile
phone signature combines digital ID as well as the qualified electronic signature function
■ High level of user friendliness■ Could be used everywhere, not only for procedures with public administration,
but also in business or private matters (e.g. signing contracts)
What are the key success factors?■ High standard of security■ Legal equivalent of a handwritten signature■ Accessible process for those with special needs
Actual portal: Handy-signatur.at
II.3 Key enablers
156
Good practice 43. Czech Republic – Data boxes
Easy, economic, and environmentally-friendly delivery of official documents
What is it?The Datove Schranky (data boxes) are an electronic archival system that facilitates communications between citizens, businesses, and public administration bodies in the Czech Republic. The system’s web interface replaces the traditional exchange of printed documents, such as submitting tax returns, and allows for immediate access from any internet-connected computer. Technical specifications of the system are publicly avail-able, and applications for mobile devices are offered by third parties. The use of the system is mandatory for the state administration and legal entities, and citizens may choose to set up a data box of their own. In that case, the state administration is obliged to use the data box for communicating with them.
What are the benefits? ■ Easier and more efficient communication■ User friendly by offering mobile devices applications
What are the key success factors?■ User friendliness
Source: https://joinup.ec.europa.eu/community/epractice/case/data-boxes-%E2%80%93-easy-economic-and-environmentally-friendly-delivery-official-d

eGovernment Benchmark 2017
157
Good practice 44. Germany – De-Mail
Germany launches citizens’ email system De-Mail
What is it?Germany’s Ministry of the Interior opened De-Mail, offering citizens a central mailbox with users verified by the ministry, and end-to-end encryption. De-Mail is designed to transmit confidential documents without affecting user friendliness. Delivery via De-Mail is legally secure; the sending, receiving and the contents of De-mails can be legally proved. Still, the technically complex procedure has been made easy to use. The Federal Government aims to establish De-Mail as a safe and user-friendly standard for legally binding electronic communication of confidential content.
What are the benefits? ■ User friendly■ Safe way to send confidential e-mails■ Easy to use
What are the key success factors?■ User friendliness
Source: https://joinup.ec.europa.eu/community/epractice/news/germany-launches-citizens%E2%80%99-email-system-de-mail
158
Good practice 45. Italy – SPID
The digital identity used by citizens to access public and private services.
What is it?The SPID (Sistema Pubblico di Identità Digitale) is the authentication system that pro-vides citizens with secure access to digital public services.
The system consists of credentials classified on three levels of security, depending on the level of assurance required by the public administration providing the service.With 1.7M digital identity distributed to citizens, at a rate of 75.000 digital identity per month, the digital identity let people access digital public services offered by more than 3.700 public administration entities.
In addition to that, the already shared documentation, source code, APIs, SDKs and a test environment on Developers Italia -the open community platform for Italian digital public services- will enable the creation of third parties’ innovative digital services easily integrated with SPID.
What are the benefits? ■ easy access to digital public services providing citizens with a uniform identification
system’s user experience ■ reduced cost for public administrations to create, implement and maintain authori-
sation services into digital public services■ more robust and secure authorization systems■ cross-border mobility, providing, through compatibility with the eIDAS scheme, the
Italian citizens with credentials that can be used to be identified and to access pub-lic services in foreign countries while providing foreign citizens with the possibility to access Italian public services through their foreign country’s digital identities
What are the key success factors?■ ensure a proper security and privacy standard to make it a trustworthy platform■ ensure a high quality of user experience, especially through mobile platforms, to
guarantee maximum diffusion among the citizens■ ensure a proper, easy, fast, secure and trustworthy identification procedure to
obtain the digital identity■ ensure that the most used digital services inside the public administration will
adopt the digital identity

eGovernment Benchmark 2017
159
Good practice 46. Italy – PagoPA
The payment platform used by citizens to make payments to public administrations.
What is it?PagoPA is a unique node forto make payments to public administrations through which citizens can pay taxes, university tuition fees, school meals, fines, etc.
PagoPA allows citizen to choose the entity and how they wish to pay, whether it is online or offline; it represents an operational solution for the Public Administration for managing payments centrally, providing automated reporting and reconcilia-tion services to one (or more) state accounts, without errors and with huge savings on the cost of processing.
With 3.3M payment transactions through the node and a goal to reach 10M by the end of 2017, PagoPA has been adopted by more than 11.500 public administra-tions and more than 400 payment service providers, including PayPal.
In addition to that, the planned share of documentation, source code, APIs, SDKs and a test environment on Developers Italia - the open community platform for italian digital public services - will enable the creation of third parties’ innovative digital services easily integrated with PagoPA.
What are the benefits? ■ provide citizens with a uniform, easy and mobile friendly payment experience
throughout different digital public services■ provide the Public Administration with an operational solution for managing
payments; centrally, with automated reporting and reconciliation services to one (or more) state accounts, without errors and with huge savings on the cost of processing
What are the key success factors?■ ensure an high quality of user experience, especially through mobile platforms,
to guarantee maximum diffusion among the citizens ■ ensure a proper, easy, fast, secure payment experience■ ensure that the most used digital services inside the public administration will
adopt the payment platform■ ensure that the most innovative payment gateways will be included into the
payment solutions offered by PagoPA
160
Good practice 47. Italy – Anpr
A single national database designed to combine the demographic data of all Italian resi-dents, including those living abroad
What is it?The National Resident Population Register – ANPR – is a single national database, owned and maintained by the Ministry of the Interior, designed to combine the demographic data of all Italian residents, including those living abroad (registered at the Italian Reg-ister of Foreign Residents – AIRE). This fragmented system of data - scattered across 8,000 different registries and managed individually by each Municipality - represents the only reliable and authoritative source for vital data like place of birth, residence, and household composition.
Currently 15 municipalities are active in ANPR, corresponding to the demographic data of more 320.000 citizens. There are 720 Municipalities in the pre-migration stage, cor-responding to 6 million citizens and all forty technology and registry service providers are either testing product integration on pilot municipalities or have already developed products that can support integration.
In addition to that, the planned share of documentation, source code, APIs, SDKs and a test environment on Developers Italia - the open community platform for italian digital public services - will enable the creation of third parties’ innovative digital services re-lated to demographic data easily integrated with ANPR.
What are the benefits? ■ provide citizens with an easy, uniform (independent from the specific Municipality)
and mobile compatible digital experience to access their demographic data; ■ solve the problem of citizens who have to repeatedly provide the same demo-
graphic data to the various Public Administrations (once-only principle)■ enable the creation of innovative digital services related to demographic aspects
that can be built upon the ANPRr platform
What are the key success factors?■ create a proper migration process for the 8.000 Italian municipalities, that will en-
able them to move automatically the demographic data they own into the ANPR platform
■ ensure an high quality user experience for the ANPR platform, both from the side of the public officers and the citizens
■ ensure that the most used digital services inside the public administration will adopt the digital identity

eGovernment Benchmark 2017
161
Good practice 48. Italy – Developers Italia & Designers Italia
The open community platforms created to support the public administration in devel-oping digital services leveraging on the open communities of developers and designers and on the open source paradigm.
What is it?Developers Italia and Designers Italia are the open community platforms for developers and designers of italian digital public services that provide source code, modern document management systems, SDKs, APIs, test environments, user experience and user interface kits, and interactive tools in order to design and develop digital projects for the Public Administration more effectively.
Through Developers Italia and Designers Itali, third parties will be able to easily integrate the digital platforms and services developed by the public administration within their own digital services.
What are the benefits? ■ reduced cost for the public administration to design and develop digital ser-
vices, relying on the open community of developers and designers■ reduced barrier for third parties to integrate the digital platforms and services
developed by the public administration within their own digital services■ higher quality of source code produced and maintained, which translates into
better and more secure digital public services
What are the key success factors?■ ensure that public administration governmental agencies get used to release
the source code of the digital projects and platforms developed as open source■ ensure that the digital projects and platforms of the public administration are
developed and designed using an API based microservice (and not monolithic) approach

162
Good practice 49. Italy - Three Year Plan for the Digital Transformation of the Public Administration
A strategic document that guides and supports the entire Public Administration in an organic and coherent process of digital transformation
What is it?The Three Year Plan for the Digital Transformation of the Public Administration is a strategic document, approved by the Presidency of the Council of Ministers, that guides and supports the entire Public Administration in an organic and coherent process of digi-tal transformation. The Plan is in line with the majority of the objectives of the new Euro-pean eGovernment Action Plan 2016–2020. It sets the foundation for the construction of a number of key components upon which public administrations can deliver simpler and more effective services for citizens and businesses by adopting flexible methods, a mobile first approach, architectures that are secure, interoperable, scalable, highly reli-able, and based on clearly defined application programming interfaces (APIs).
What are the benefits? ■ define a clear medium run strategy to guide all the public sector stakeholder to-
wards a coherent and organic digital transformation process■ support the entire Public Administration’s ecosystem, which includes hundreds of
software vendors and technology and service providers, in systematically adjusting their investments and technological choices to be compatible with a clear and well defined medium run strategy
What are the key success factors?■ attract and hire tech skills and competences inside the public administration that
can support the governmental agencies in implementing the digital transformation described into the Three Year Plan
■ ensure a proper budget allocation for each governmental agencies to be used to implement the digital transformation described into the Three Year Plan
■ ensure a strong and well defined centralized governance able to push governmen-tal agencies to be used to implement the digital transformation described into the Three Year Plan
eGovernment Benchmark 2017
163
Good practice 50. Latvia – E-authentication
E-authentication
What is it?E-authentication is one of the key enablers and central elements to expand Digital Government and Digital Services. State Regional Development Agency of Latvia pro-vides Shared Authentication Service to National citizen portal and currently - 29 exter-nal portals/ digital services that belong to 20 different state and municipal institutions.
Shared Authentication Service includes 9 authentications that correspond to 3 levels of identity assurance:■ National eiD (2 PKI schemes)■ BankLink (i-bank authenticarions of 10 major banks)■ Username & Password In provision of Public services a balance between expected assurance level and ease of use must be reached. So, Shared Authentication Service provides a functionality for a user (Public service owner) to configure which identification means are enabled to access it’s portal or digital service. All agreements with identification service providers (Banks, TCSP) are managed centrally by Shared Authentication Service Provider - State Regional Development Agency. E-authentication is widely used in life events (examples):
1. How to start a business: anyone can use the portal www.latvija.lv for e-services for registration and operation of the company, registering tax payers and perform all necessary action to be able to start a business, with electronic identification and au-thentication (with eID card or electronic identification card, which can prove persons` identity and legal status, eSignature – a more secure method of identification, because it is protected with a unique PIN number, or with identification through 10 banks).
2. Life event “Studying”: contains six descriptions of the situation of the most impor-tant matters (studies in Latvia and Europe):■ How to choose the most suitable career? ■ How to choose what and in what university to study? ■ What to know when you go to college? ■ What financial support options are available for the implementation of studies?■ How to apply for studying digitally?■ What are the opportunities for studying in Europe?
What are the benefits? ■ Swift authentications■ Applicable to a broad range of life events■ better and more secure digital public services.
What are the key success factors?■ User orientated■ Harmonisation of services

164
Good practice 51. Norway - eSignature
A joint service for signing documents electronically
What is it?The e-Signature service is a stand-alone service available to Norwegian public agen-cies. The service enables people to sign documents from the public sector, either by applying an advanced digital certified signature or an electronic signature based on authentication with security level of 3 (≈substantial) or 4 (≈high). The product of an e-signature transaction is a PAdES-document with embedded LTV-SDO i XAdES-format (in accordance with the EU Commision’s Implementing Decision of 17th March 2014). The e-Signature service also provides additional support services, for example notifica-tions for the signing of documents, archiving in a citizen’s digital mailbox, signature maintenance, statistics and administration options.
What are the benefits? ■ User-friendly, secure, practical and efficient solutions for processing documents
that require citizens’ signatures■ Documents no longer manually issued and collected for signing■ Time and cost savings ■ Strengthening of the traceability and validity of document signing
What are the key success factors?■ Varying degrees of complexity depending on the user’s needs and requirements
for traceability and validity■ Legible for most of the system’s users■ User-friendly and universally designed ■ Supports the most common type of signing scenarios required by the Norwegian
public sector■ Availability of support services for personal e-signature transactions and processes■ Automatically archived signed documents

eGovernment Benchmark 2017
165
Good practice 52. Norway – User-driven consent in Altinn
The solution enables a consent for data, which has been provided by a person for the public sector once, to be shared with others
What is it?The solution is an extension of the authorisation solution in Altinn, and enables a user-driven consent – something which gives the user control of their own data. User-driven consent helps realise the “once-only” principle. Initially, a consent-based loan application has been developed; a user-driven consent from Altinn is used to give banks access to tax and income information from the Norwegian Tax Adminis-tration. Gradually, the solution will be extended to other areas.
What are the benefits? ■ Enabler and prerequisite for next-generation digital services■ Simpler and better services for citizens and business ■ Large financial savings ■ Helps to realise the “once-only” principle for public data acquisition
What are the key success factors?■ Knowledge about, and the maturity of, cooperation, transparency, cohesion,
initiative taking, information resource management and technology ■ Cross-sectorial cooperation ■ Being able to agree on common goals
166
Good practice 53. Portugal - SCAP
Professional Attributes Certification System
What is it?Based on authentication and electronic signature mechanisms, such as the Citizen Card (the Portuguese electronic identification card), the Professional Attributes Certification System allows, through the national eID Card, authentication and signature in a profes-sional quality (e.g., civil servant, architect, technical engineer, etc.).
Hence, citizens can authenticate themselves as such or in the quality of the functions that they perform in society as qualified professionals.
The Professional Attributes Certification System (SCAP) allows citizens to:■ Authenticate in the portals and websites of different public entities;■ Sign documents in their capacity as professionals.
SCAP, through a business attributes association service, allows entrepreneurs to:■ Certify Capacities – Validates the capacity present in the company’s permanent cer-
tificate, without the need for any additional documentation (e.g. “manager”)■ Certify powers – Validates the powers for a certain act, through a specific document,
such as representing a company in public procurement procedures, for instance.
Public officials may also adhere to the Professional Attributes Certification System, in accordance with the provisions of the Portuguese legislation.
What are the benefits? ■ Digital signature certifying the professional profile of a worker ■ Greater efficiency; Elimination of cards and non-necessary procedures■ Immediate access to professional capacities, without cost■ Allows signature in any format. Safety and control with legal background. Euro-
pean Directives
What are the key success factors?■ Communication■ Adoption of digital signatures■ Cultural and organizational change management

eGovernment Benchmark 2017
167
Good practice 54. Turkey – Ministry of Development e-Correspondence Project
Ministry of Development of Turkey developed the e-Correspondence Project to carry all of-ficial correspondences amongst public agencies to the electronic environment.
What is it?Ministry of Development developed a technical mechanism that enables different public agencies to exchange official documents and correspondences in the electronic environment via employing electronic signature in order to create legally valid docu-ments.
The solution relies on a technical ruleset for exchanging official correspondences among public bodies and Application Programming Interfaces (API) for .NET and JAVA platforms that public institutions can integrate to their existing electronic document management systems in order to create documents that comply with the ruleset. e-Correspondence Technical Guide explains technology neutral set of rules that all gov-ernment entities should comply with to exchange official correspondences electroni-cally while e-Correspondence APIs for .NET and JAVA platforms provide open source APIs that any government entity can use in order to create electronic documents that comply with e-Correspondence Technical Guide.
The mechanism also employs message level encryption in order to provide security as official documents traverse public communication networks. Registered e-mail is used as the transport medium for exchanging documents among public institutions.As of September 2017, more than a hundred public agencies are actively using outputs of e-Correspondence Project to exchange electronic documents online. What are the benefits? ■ Seamless, fast and secure document exchange among public agencies■ Interoperable e-government services■ Technology/vendor neutrality in e-government service development■ Cost and time savings■ Workload reduction■ Less damage to nature/less paper waste■ Reducing bureaucratic processes■ Improvement in service quality and productivity ■ Prevention of missing official documents/elimination of mail delivery problems■ Increasing security and trust
What are the key success factors?■ Bureaucratic and political ownership and support■ Technical capacity in public agencies■ Publicizing the benefits/ROI of the project
168
Good practice 56. Turkey – Ministry of Interior: Directorate General of Civil Registration and Citizenship Affairs
Smart Identity Card
What is it?Identity card contains chip, many security features electronically and visually. Imitation and copying have been made impossible.Safer, Identity Fraud Prevention, Ease of usage, Ease of Transportation, Long Term Use, Possibility of Integration with Many E-Government Applications.First months of 2017, the card number reached to 2 m. people and at the end of the year, it is estimated 30m. cards will be reached. At the end of the 2019, it is mandatory that all citizens have Smart card. What are the benefits? ■ Use to login e-Gov. services. ■ Use Instead of E-Sign and Mobil Sign
What are the key success factors?■ Strong focus on security■ Broad implementation
Good practice 55. Turkey – Revenue Administration
e-Notification
What is it?According to the provisions of the Tax Procedural Law No: 213, the system is developed to notify the documents required to be communicated quickly and effectively in elec-tronic environment.
What are the benefits? ■ Zero cost■ economic benefit, speed and efficiency■ Accessibility to taxpayers■ Central compliance
What are the key success factors?■ Taxpayers can access their notifications from where they want and when they want

eGovernment Benchmark 2017
169
Good practice 57. Austria – Unternehmensserviceportal (USP)
Austrian Business Service Portal USP reducing administrative burdens
What is it?The Austrian Business Service Portal ‘Unternehmensserviceportal’ (USP) was launched in 2010 and is jointly coordinated by the Federal Ministry of Finance and the Federal Chan-cellery. This portal aims to serve as a single entry point through which businesses can ful-fil their legal obligations and reduce their administrative burdens. Registered businesses can conduct a wide range of transactions with the government, organised according to business life events. They can, for example, use applications like FinanzOnline (a “virtual tax office””), the electronic data exchange with the Austrian Social Security Institutions (ELDA), and the Data Processing Register (DVR). The goal of the USP is to improve the business environment, and to help competitiveness and growth, by reducing administra-tive burdens for citizens and improving the quality of governmental services
What are the benefits? ■ Reduces time and costs spent of information obligations■ Improves service quality
What are the key success factors?■ Clustering all activities into a single entry point■ Categorisation along business life events
Source: https://joinup.ec.europa.eu/community/epractice/case/austrian-business-service-portal-usp-reducing-administrative-burdens + portal: https://www.usp.gv.at/Portal.Node/usp/public
II.4 Starting up a business and trading operations
170
Good practice 58. Austria – The Business Service Portal
Austrian Business Service Portal (USP) - one-stop web portal for businesses
What is it?The Business Service Portal (www.usp.gv.at) provides all the relevant information of public administration for businesses via a one-stop web portal. Since May 2012, the most important eGovernment applications of the federal government (e.g. Finan-zOnline, the services of the social insurance, data processing register, e-invoicing to the federal government, etc.) can also be reached by registered businesses after just one identification step at the USP-portal.
For businesses, a one-stop access to all eGovernment applications means not only less administration effort with handling access data and passwords but particularly a – highly secure – user administration for the eGovernment applications of the public administration.
A fundamental component of the Business Service Portal is the business register that summarises the basic data of all Austrian companies, associations and other non-natural persons at a central point. The business register is the basis for the registered section of the USP.
In near future a main goal is to set up an electronic one-stop shop for business start-ups to simplify the process of establishing a business and reduce the amount of time needed to do so.
What are the benefits? ■ Less administration effort – less costs■ Improves service quality
What are the key success factors?■ Single Sign-On Portal for businesses■ eID fully implemented■ In future: One-Stop shop for business startups
Actual portal: https://www.usp.gv.at/
eGovernment Benchmark 2017
171
Good practice 59. Turkey – Central Trade Registry System (MERSIS)
Central Trade Registry System (MERSIS) is a centralized information system allowing for the implementation of the commercial registry processes and storing them and commer-cial registry data electronically.
What is it?With MERSİS, trade in Turkey will turn to more easy and faster that a country is an im-portant step towards making it the safest way to do. MERSİS system, the commercial registration transactions are conducted electronically, and can be saved, trade registry records and registration and regularly as storage of content that should be declared is a system that is also presented in an electronic environment.
In the E-Government system, which is an important part of MERSİS system, company setup can be done through the system, record transactions can be done online, lost or stolen identity.
The company can established, with instant data analysis and reporting can be done and effective public policies that can be created with this analysis. Currently Trade Registry Offices can be served on the MERSİS. So far, 88.405 daily operations were performed, the number of registered users has reached to 529.340.
Goals: Effective and productive registry proceedings, Compliance with the innovations and principles of the Turkish Code of Commerce, Simplification of incorporation and operation, establishment of trust in business life, Compliance with the requirements of information society services, Modern registry operations at certain standards in an electronic environment.
What are the benefits? ■ Ensuring savings ■ The use of MERSIS number as a special number ■ Secure, fast and easy access to data ■ Standardisation of business processes and implementations ■ Minimization of work load ■ Becoming a member of European Business Register ■ Effective Ministry supervision and inspection
What are the key success factors?■ Combination of registry datum in a central data base. ■ Analysis and reporting through current datum
Source: http://english.gtb.gov.tr/commerce/domestic-trade/central-trade-registry-system-mersis

172
Good practice 60. United Kingdom – Government Digital Service
Taking care of business on GOV.UK
What is it?Articles published on the UK government’s website can be extensive and not always fit for the target group. As stated in a blog on their website: “when you work on GOV.UK every day, it can be easy to forget what it’s like for someone who isn’t as familiar, someone who needs something urgently, or someone who needs to do a thing with government before they can get on with the rest of their ‘to do’ list”.In a recent project to improve guidance for new businesses, the total amount of pages was reduced from 50 to 16. User needs were identified by talking to people from the very beginning and throughout the entire project. The changes resulted in a 25% increase in clicks to services that people need to use when setting up a busi-ness – showing that more people were finding what they needed. Also, it led to a 5% decrease in average numbers of pages clicked per session, in order to get to the needed services – showing that users were getting there more quickly.
What are the benefits? ■ Publications better fit citizens’ needs (e.g. when starting up a business)■ The government offers a more efficient service■ Saves time for both government and citizens
What are the key success factors? ■ Identifying user needs by talking to people from the very beginning
Source: https://gds.blog.gov.uk/2017/07/18/taking-care-of-business-on-gov-uk/

eGovernment Benchmark 2017
173
Good practice 61: StartUpGreece: Actions for the acceleration of the Greek startup ecosystem
What is it?StartUpGreece is an online platform developped for the implementation of the Small Business Act in Greece which promotes the communication, networking and collaboration and acts as an accelator for the greek startups. StartUpGreece launched since 2011, by the Ministry of Economy and Development and is operated by the Secretary General of Industry.
StartupGreece includes onlilne tools such as: i) billingual digital platform of informa-tion and networking, which combines an online society of entrepreneurship, based on collaborations and acts as a single point of knowledge and information in the doing business sector ii) active presence to social media, Facebook, Twitter,Youtube and blogs. Offline tools include i) active participation to exhibitions which promote enterpreunership ii) responsive to specialised inquiries iii) actions of training such as lectures at universities and schools iv) horizontal cooperation network between groups of young people and business people v) active public consultations and interventions in the legislation for the entepreneurship ,vi) actions of enhancing co-operation of big companies with startups thrgough “StartupGreece JoinForces”,vii) promotion of the connection of the Greek startup ecosystem with relevants in other states ,viii) mapping of the needs of the Greek startups ,ix) follow up of the greek scale ups.
What are the benefits? ■ Transparency and open government through actions of consultation■ Creation of communities of specific interest ■ Matchmaking services : funding , ideas and employment needs■ Development of joint forces
What are the key success factors? ■ Collaborative open ecosystem■ Best practices and success stories
Source:www.startupgreece.gov.grhttps://www.youtube.com/watch?v=TnuEbt-AzqUhttps://www.youtube.com/watch?v=KMGX-2zrI_whttps://joinup.ec.europa.eu/community/epractice/case/austrian-business-service-portal-usp-reducing-administrative-burdens https://www.usp.gv.at/Portal.Node/usp/public

174
Good practice 62. Malta – The BusinessFirst Portal
What is it?BusinessFirst.com.mt is Malta’s Government website for the Point of Single Contact for businesses. The formation and tools on the portal are designed specifically for business start-ups, as well as established businesses, and the people who advise and support them. BusinessFirst.com.mt provides free access to information required for the day-to-day running of the business. It acts as a gateway to government busi-ness information and services. On the website, one can find practical information and useful links to help business people plan, start, manage, grow or close down their business, and deal with day-to-day challenges; including information on Gov-ernment rules and regulations, together with compliance requirements affecting businesses in Malta.
To fulfill its commitments, and facilitate business administrative processes, Business First has entered into a number of service agreements with various public entities to give businesses the possibility to apply for various administrative services in one location such as the legal entity establishment namely the:- Request for company name search and company name reservation.- Request for registration of companies and- Request for registration of self-employed.
This service enables citizens and companies to register their business with a number of Government entities from the comfort of their home or office. The registration process sends the information to all the necessary Departments to ensure that they receive their registration numbers online. The registration with the Inland Revenue Department and VAT Department are processed automatically online and feedback on the application and the relative registration numbers are received immediately.
What are the benefits?■ Leverages the potential of ICT to give a value added service to citizens■ Improves Government Administration
What are the key success factors?■ Facilitating business administrative processes■ Submitting one or more applications for a wide range of offered services from
one single Portal■ Establishing a national One-Stop-Shop Service for Business operation
Source: The BusinessFirst portal can be accessed from https://businessfirst.com.mt.

eGovernment Benchmark 2017
175
Good practice 63. Austria - Automated Family Allowances
Non-Stop-Government solution for new families safes time and costs
What is it?Automatic Family Allowances without Application (ALF) is a no-stop-shop solution for parents with which family allowances for new-born children are paid out auto-matically. Filling in forms or a visiting the tax office is no longer necessary. This is relevant for about 80,000 families a year.
Citizens no longer need to visit the tax office, and in many cases it is no longer nec-essary to present documentation. Family allowance payments are handled automati-cally. This will save Austrian citizens 39,000 hours annually, and additionally reduces the time and cost for the Austrian public administration.
The initiative of the Federal Ministry of Finance and the Federal Ministry of Families and Youth applies to children born in Austria. Austrian tax offices start an examina-tion – without any interference from the parents- based on the data available and contact the parents for any necessary further information and to convey the result of the investigation process. Any contact with the tax office from the parents– if not requested for – is not necessary.
What are the benefits?■ Automated service■ Non-stop-government-service for familiesSafes new parents valuable time and
costs
What are the key success factors?■ Re-use of information■ Reduction of administration interaction to a possible minimum
Source: https://english.bmf.gv.at/taxation/family-allowance.html
II.5 Family

176
Good practice 64. Spain – ¡Digitalíza-t!
eGovernment guide for Spain’s local administrations
What is it?A new guidebook aims to help Spain’s local public administrations on eGovernment and digitalisation. The guide, titled ¡Digitalíza-t! (Digitalise yourself!), is published by the ICT department of Spain’s Ministry for Public Administration. The manual explains to local administrations how to transpose two national eGovernment laws (Law 39/2015 and Law 40/2015).
The book also shows how to make use of ICT solutions made available by the ministry’s ICT department. These laws give a strong impetus to the digitalisation of Spanish public administrations, and its requirements promote increased efficiency, innovation and modernisation. The guidebook describes many ICT solutions, and acts as a catalogue to help local administrations comply with the law, the IT depart-ment adds. This should result in citizen-oriented and efficient eGovernment services.
What are the benefits? ■ Efficiency■ Innovation■ Modernisation
What are the key success factors? ■ Simple, easy to understand and use ■ Dissemination and good communication■ Have feedback from the target audience
Source: https://joinup.ec.europa.eu/community/epractice/news/egovernment-guide-spain%E2%80%99s-local-administrations

eGovernment Benchmark 2017
177
Good practice 65. Turkey – Ministry of Interior – Directorate General of Civil Registration and Citizenship Affairs
MERNİS, Moving and settlement transactions
What is it?This service is used for Address Change, Temporary Identification Certificate, Certificate of Registration Document, Place of Residence and Other Address Document Inquiry.
What are the benefits? ■ Able to moving transactions online■ Zero cost■ Economic benefit, speed and efficiency
What are the key success factors? ■ Selecting and integrating different types of moving and settlement transactions
Good practice 66. Turkey – eJustice Retrieval Certificate of Inheritance Document
Digital documentation
What is it?For those who do not need judicial process, it is possible to prepare the documents of inheritance document, estate accounting, pedigree and reasoned decision docu-ments (including justification and judgment statements) with one key by using MERNIS database for whom after the date of death on 23.11.1990. In addition, if the user inputs “disclaimer of inheritance/renunciation of the inheritance”, the calcula-tion can be made again in the direction of rejection and waiver. In addition to this, project studies are being carried out to include the calculation of the birth certifi-cate used in the calculations, the calculation of the heritage share of the pre-1990 deaths, and the issues affecting the sharing of inheritance such as deprivation of citizenship, death investigation, adopted child.
What are the benefits? ■ Reducing the process and costs■ Cancel out error of fact■ Labor saving and reducing workload of courts
What are the key success factors? ■ Regularly carrying out project studies

178
Good practice 67. Turkey – Ministry of Health, e-PulseHealth records information system
What is it?It is a personal health record system where you can access all of your health informa-tion from a single location, regardless of where your examinations, examinations and treatments are conducted.
It is the world’s largest and most comprehensive health information infrastructure. Users can access safely on the internet which allows users to assess their health records. User can entitle doctor to see her/his information so that they can be evalu-ated with increasing the quality and speed of the treatment process and establish-ing a strong communication network between patient and doctor.
Users can “View Health History”, “Get Rid Of Repetitive Health Controls”, “call 112 Emergency via Mobile App Button (User can send location info vs.)”, “Assess the health care you receive”, “Access your healthcare anywhere”.
What are the benefits? ■ Reducing the process and labor■ Cost, time and paper effectiveness
What are the key success factors? ■ Focus on personalisation and data security

eGovernment Benchmark 2017
179
Good practice 68. Malta – The myHealth Portal
What is it?The Ministry for Health has launched its ‘Next Generation’ myHealth Portal (my-Health NG) which is a revamped and improved version of the previous myHealth Por-tal that has been in operation since 2012. The myHealth Portal is an online service with which citizens and private medical doctors of their choice can access and view parts of their medical records maintained in the Maltese public healthcare system using their government e-ID credentials.
myHealth is also a ‘mobile first’ website built with responsive web technologies, thus rendering the portal to be easily accessible from patients’ and doctors’ smart phones and tablets. The design, look and feel of the portal has been enhanced for an optimal viewing experience, easy reading and navigation with minimum resizing, panning and scrolling, regardless of the user’s device. Further to this, the portal has been transformed into a ‘Patient Centric’ solution with enhanced search facilities, making it easier and quicker to access part(s) of a patient’s record.
The portal, now available in both English and Maltese, provides access to patient ap-pointments, medical image reports & laboratory results, electronic case summaries, and notifications to patients and doctors via email and/or SMS messages. A phar-macy finder, with location based services, has also been included as an additional service.
What are the benefits?■ Citizens are provided with a better and faster overall service ■ Introduction of new services
What are the key success factors?■ Government’s drive for continuous improvement and accessibility to online
services■ Improving access to health information■ Empowering citizens to take a more active role in their health, and gradually
increase stakeholders’ readiness to use eHealth systems and services
The myHealth Next Generation can be accessed from www.myhealth.gov.mt.
Source: https://www.mita.gov.mt/en/ict-features/Pages/2017/A-new-myHealth-Portal-enabling-a-transformation-in-the-health-system.aspx

180
Good practice 69. Austria – eAMS Account by Public Employment Service Austria (AMS)
Austria’s Public Employment Service expands online services for business and job seekers
What is it?The Austrian Public Employment Service (AMS) is Austria’s leading provider of labour-market related services. AMS matches candidates with job openings and assist jobseekers and companies who turn to AMS by offering advice, information, qualification opportunities and financial assistance.
Within the framework of the Federal Government’s policy of full employment, the AMS renders a major contribution to preventing and eradicating unemployment in Austria. Commissioned by the Federal Ministry of Labour, Social Affairs and Consum-er protection, the AMS assumes its role as an enterprise under public law in close cooperation with labour and employers’ organisations.
The technical resources of Austria’s public employment service meet the require-ments of three pillars: process optimisation, enhancement of self-service options and management information.Employers may use the account to enter vacancies, request financial assistance or process employment permits for foreign nationals. Intensity of assistance is agreed between counsellor and client and included in the written action plan. Registration and authentication is conducted via the competent regional office or via the Federal Ministry of Finance’s online service (FinanzOnline).
What are the benefits? ■ Transparency for job seekers and businesses■ Fully mobile app version available
What are the key success factors?■ Process optimization■ Enhancement■ Self-service
Actual portal: https://www.e-ams.at/
II.6 Losing and finding a job
eGovernment Benchmark 2017
181
Good practice 70. Turkey – eJustice (Which is a part of eGovernment) Services
The Program for the Calculation of Workers’ Claims
What is it?Thousands of lawsuits are filed each year in the Labor Courts due to Receivables and Indemnity Claims arising from the connection between the employee and the employer. These cases are generally directed at the rights and claims of workers and the trial process takes a long time according to the scope of the case. In this process, it is necessary to prepare the expert report by different professional experts, due to the diversity of the sector in which the claimant worker works and the demanded items of receivables. Objections to this report are of great importance. Expert examination of objections to these reports can only be carried out in central courts located in the largest provinces. This increases the time of the judicial process exces-sively, increasing the workload of the central courts. To overcome these problems and speed up the judiciary, the Ministry of Justice has developed a Program for the Calculation of Workers’ Claims, in which every Court Judge can obtain results in min-utes. As a result of this system, a considerable amount of savings has been achieved in the judging costs and judging process.
What are the benefits? ■ Speed up Judgement Process■ Reducing Cost Expense
What are the key success factors? ■ Enabling expert reports by different professional experts

182
Good practice 71. Turkey – Finding/Appliying Job and Course Information
Job information
What is it?In eGov Portal all citizens access their job information like employment insurance. Job search service, app for unemployment benefit, course announcements, certifi-cate of professional competence services can be used by citizens via e-Government Portal.
What are the benefits? ■ Zero cost■ Economic benefit, speed and efficiency
What are the key success factors? ■ Combining many different services

eGovernment Benchmark 2017
183
Good practice 72. Malta – The JobsPlus Portal
What is it?The JobsPlus portal offers job seekers the opportunity to create a personalised digi-tal profile which covers their personal details, education, employment history, key skills and the type of roles which they’re interested in. It gives employers the option to create their vacancy profiles covering the academic background, skills, experi-ence and job type required for their vacancy. The portal matches job seekers with vacancies and vice versa through their skills and competencies. It also matches job seekers and employers without the need for having human intervention by Jobsplus staff, thus allowing a more virtual employment market environment, and offers the option of having instant matching of job seekers to vacancies. Both job seekers and employers can refine their searching criteria instantly whilst allowing them to have a matching result instantly, providing the option to identify skills and academic gaps. All registered companies and citizens with Jobsplus can feature on the JobsPlus Portal.
What are the benefits?■ Offering interactive and dynamic functions, as well as a more personalised experi-
ence through the use of customisable dashboards.■ Jobseekers and employers enjoy an overall job-matching experience, which also
results in reduced recruitment costs for employers through an immediate and ac-curate online matching process.
What are the key success factors?■ Enhancing and facilitating access to jobs and the labour market■ Providing local jobseekers and employers with successful and rewarding work
experiences by empowering, assisting and training jobseekers■ Promoting workforce development■ Assisting employers in their recruitment and training needs
Source: The JobsPlus portal can be accessed from https://jobsplus.gov.mt.
184
Good practice 73. Austria - Austrian Study Grant Authority
Electronic and seamless Study Grant procedure
What is it?Many students at Austrian universities and colleges are eligible for financial aid. It was especially important in this area to remove the most major bureaucratic hurdles by introducing eGovernment applications and make it easier for students to gain access to financial support.
The Student Support Act requires a lot of documented proof, which must then be processed by the corresponding authority. These documents had to be presented each time the grant is renewed. The online application procedure72 has drastically reduced the time and effort involved in this process.
The electronic application/inspection is possible for:■ Application for study assistance/study allowance■ Mobility allowance – Request for it to be granted■ Application status for applicants
Once an electronic application is submitted, the system automatically checks once a year if the applicant is eligible based on the available data. It then creates the application form and confirmation for renewing the grant automatically. The only other thing the student needs to have, other than fulfilling the eligibility criteria, is a card-based citizen card or the version on the mobile phone (mobile phone signature) for submitting the application form.
What are the benefits? ■ Transparent processes■ Easy back office handling
What are the key success factors? ■ eID fully implemented■ Online status check■ Free of media interruptions■ Meets customers’ expectations
Actual portal: https://www.stipendium.at/
II.7 Studying

eGovernment Benchmark 2017
185
Good practice 74. Portugal – Digitally assisted eGovernment public services delivery
Portugal adds higher education register service to eGovernment access points: the Citizen Spots
What is it?Early 2017, Portugal has added 34 new online government services to its Citizen Spots.One of the new services is the possibility for students to register online for higher education. The Citizen Spots offer digital public and private services to citizens that have no Internet access and/or to those that need help with using online services. There are currently 521 of these user-centered onsite desks being managed across the country, offering citizens a single point of access to approximately 200 online public and private services, performed with the help of civil servants and other trained as-sistants that act as “citizenship-mediators”.
What are the benefits? ■ Higher education online registration accessible for all■ Client-oriented service ■ Digital inclusion
What are the key success factors? ■ Facilitating citizens that don’t have internet access■ Providing a single interface for electronic government services
Source: https://joinup.ec.europa.eu/community/epractice/news/portugal-adds-services-egovernment-access-points
186
Good practice 75. Slovenia – Subsidised transport ticket for students
The eUprava portal
What is it?A single subsidized ticket is available to students for transport during schooling on a portal eUprava. This means that a student can travel from place of residence to the place of studying with one ticket, with different means of transport (train, bus). The state substantially subsidizes the price of the ticket.
A student must apply for a subsidized ticket before the academic year. In the year 2017 they can apply also electronically on a portal eUprava. It is not necessary that a student by himself types his personal data in his application, because the data are obtained from the state registers automatically. The application knows which stu-dent want to apply an application form, because they must use their personal digital certificate. The student must fulfil only the entry and exit stop. Upon approval, a student receives a code with which he can then pay the ticket on the web site of the carrier. A ticket is automatically loaded on his ticket at the first ride with a bus or a train.
To develop this application, we have cooperated with several ministries, companies for selling transport tickets, and students. At the time of testing of the application, we intensively worked with students and most of their comments were considered when upgrading the application.
What are the benefits? ■ Fast service for citizens, services are available outside office hours■ Higher efficiency gains■ Easy to use■ Good practice on partnership between public and private sector on common deliv-
ered public service
What are the key success factors? ■ Develop, test and improve by cooperating with relevant stakeholders.
Source: http://e-uprava.gov.si/podrocja/izobrazevanje-kultura/visoka-in-visja-sola/subvencionirana-vozovnica.html + the actual portal: http://e-uprava.gov.si/

eGovernment Benchmark 2017
187
Good practice 76. Turkey – Council of Higher Education – University e-Registiration
Online registration
What is it?Students register university via online by clicking ‘University e-Registration’ under the e-Government Portal. After checked the university exam result, high school graduation and military information, user succesfully register the university.
In 2014-2015, 34.144 students used the system for registration to state universities. In 2016-2017, 407.946 students used the system for registration to state and private universities.
What are the benefits? ■ Students do not go to college in a different city to register. ■ It saves time and cost.
What are the key success factors? ■ Making online the default option.

188
Good practice 77. Turkey – Ministry of Education- e-School (MEBBIS)
e-School Parent Information Service is prepared for parents and children who are studying at public and private elementary schools.
What is it?e-School is a school management information system which is part of the Ministry of Education Information Systems (MEBBİS) project.
It is a system that includes all the processes from the beginning of a student to the graduation of a student. State and private primary schools, kindergartens, special education institutions, secondary education institutions use e-school system.
The following information can be learned from the system:■ Announcements: There are announcements that school administrators or teachers
want to deliver to users. (Individual or all announcements)■ Course Schedule: Course schedule, course start and end times, teacher information
weekly course schedule■ Absent Information■ Course grade information: Exam results, project and performance assessment.■ Exam and Project Information: Dates of exam and projects.
What are the benefits? ■ Parents easily get information about their children■ Student assessment is fast and easy■ Get instant information
What are the key success factors? ■ Cover the entire spectrum of relevant information/progress

eGovernment Benchmark 2017
189
European Commission
eGovernment Benchmark 2017Taking stock of user-centric design and delivery of digital public services in Europe
Background reportLuxembourg, Publications Office of the European Union
2017 - 189 pages.
ISBN: 978-92-79-74295-8DOI: 10.2759/742892
© European Union, 2017. All rights reserved. Certain parts are licensed under conditions to the EU. Reproduction is authorised provided the source is acknowledged.

KK-06-17-187-EN
-N
DOI: 10.2759/742892
ISBN 978-92-79-74295-8