2017 INVESTOR & ANALYST DAY December 14, 2017 partners, uncertainties relating to collaboration...
110
2017 INVESTOR & ANALYST DAY December 14, 2017
Transcript of 2017 INVESTOR & ANALYST DAY December 14, 2017 partners, uncertainties relating to collaboration...

2017 INVESTOR & ANALYST DAY
December 14, 2017

Forward Looking StatementsStatements in this presentation that are not strictly historical, including any statements regarding events or developments that we believe or anticipate will or may occur in the future are
"forward-looking" statements within the meaning of the federal securities laws. There are a number of important factors that could cause actual results, developments and business
decisions to differ materially from those suggested or indicated by such forward-looking statements and you should not place undue reliance on any such forward-looking statements.
These factors include, among other things, deterioration of or instability in the economy, the markets we serve and the financial markets, contractions or growth rates and cyclicality of
markets we serve, competition, our ability to develop and successfully market new products and technologies and expand into new markets, the potential for improper conduct by our
employees, agents or business partners, our compliance with applicable laws and regulations (including regulations relating to medical devices and the health care industry), our ability to
effectively address cost reductions and other changes in the health care industry, our ability to successfully identify, consummate and integrate appropriate acquisitions and successfully
complete divestitures and other dispositions, our ability to integrate the recent acquisitions of Pall Corporation and Cepheid and achieve the anticipated benefits of such transactions,
contingent liabilities relating to acquisitions and divestitures (including tax-related and other contingent liabilities relating to the distributions of each of Fortive Corporation and our
communications business), security breaches or other disruptions of our information technology systems or violations of data privacy laws, the impact of our restructuring activities on
our ability to grow, risks relating to potential impairment of goodwill and other intangible assets, currency exchange rates, tax audits and changes in our tax rate and income tax liabilities,
changes in tax laws applicable to multinational companies, litigation and other contingent liabilities including intellectual property and environmental, health and safety matters, the rights
of the United States government to use, disclose and license certain intellectual property we license if we fail to commercialize it, risks relating to product, service or software defects,
product liability and recalls, risks relating to product manufacturing, the impact of our debt obligations on our operations and liquidity, our relationships with and the performance of our
channel partners, uncertainties relating to collaboration arrangements with third parties, commodity costs and surcharges, our ability to adjust purchases and manufacturing capacity to
reflect market conditions, reliance on sole sources of supply, the impact of deregulation on demand for our products and services, labor matters, international economic, political, legal,
compliance and business factors (including the impact of the UK's decision to leave the EU), disruptions relating to man-made and natural disasters, and pension plan costs. Additional
information regarding the factors that may cause actual results to differ materially from these forward-looking statements is available in our SEC filings, including our 2016 Annual Report
on Form 10-K and Quarterly Report on Form 10-Q for the third quarter of 2017. These forward-looking statements speak only as of the date of this presentation and except to the extent
required by applicable law, the Company does not assume any obligation to update or revise any forward-looking statement, whether as a result of new information, future events and
developments or otherwise.
With respect to the non-GAAP financial measures referenced in the following presentation, the accompanying information required by SEC Regulation G can be found in the back of the
presentation and in the “Investors” section of Danaher’s web site, www.danaher.com, under the heading “Events & Presentations,” and event name “Danaher 2017 Investor & Analyst
Meeting.” All references in this presentation (1) to company-specific financial metrics relate only to the continuing operations of Danaher’s business, unless otherwise noted; (2) to
“growth” or other period-to-period changes refer to year-over-year comparisons unless otherwise indicated; (3) to Operating Profit below the segment level exclude amortization; and (4)
to “today” refers to the Company’s estimated 2017 performance (“2017E”). This presentation treats 2017E as the Company’s most recent fiscal year unless otherwise indicated. We may
also describe certain products and devices which have applications submitted and pending for certain regulatory approvals.

Agenda9:30 am Welcome Matt Gugino
9:35 am Opening Remarks Tom Joyce
10:05 am Danaher Business System
Life Sciences
Dental
Q&A
Melissa Aquino
Rainer Blair
Amir Aghdaei
Aquino, Blair, Aghdaei
11:05 am Break
11:30 am Environmental & Applied Solutions (EAS)
Product Identification
Water Quality
Diagnostics
Q&A
Joakim Weidemanis
Lance Reisman
Dan Daniel
Weidemanis, Reisman, Daniel
12:30 pm Closing Remarks & Guidance Tom Joyce
12:40 pm Q&A Tom Joyce
12:55 pm Program End / Lunch


OPENING REMARKS
Tom Joyce, President & CEO
2017 INVESTOR & ANALYST DAY

Balanced approach to deliver long-term value to shareholders
Building and evolving into a stronger, better Danaher
What You’ll Hear Today
Focused execution around our strategic priorities
2017 Financial Highlights

DOUBLE-DIGIT FREE CASH FLOW & ADJUSTED EPS GROWTH
• Expect FCF to exceed Net Income for 26th consecutive year
EXPANDING MARGINS WHILE REINVESTING FOR GROWTH
• Core OMX +60bps, R&D/S&M up (as a % of sales)
RECENT ACQUISITIONS OFF TO A GREAT START
• Cepheid, Pall, Nobel all performing well
• Closed 9 deals for ~$300M of acquisition spend
2017 Financial Highlights
ACCELERATING CORE GROWTH
• Led by Life Sciences & Product ID platforms
Building momentum as we head into 2018All financial metrics refer to the 9 months ending Sep.
29, 2017 unless otherwise indicated
Balanced approach to deliver long-term value to shareholders
Building and evolving into a stronger, better Danaher
What You’ll Hear Today
Focused execution around our strategic priorities
2017 Financial Highlights
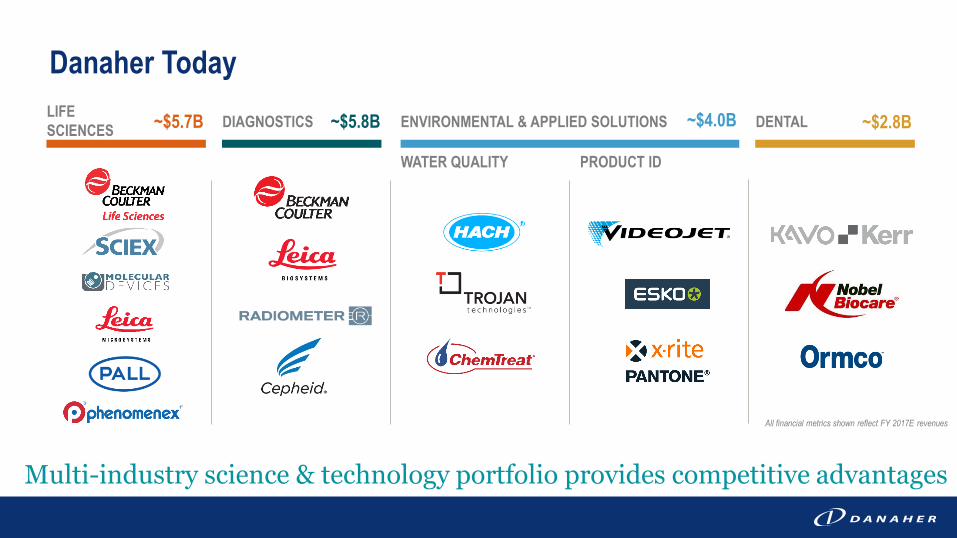
LIFE
SCIENCESDIAGNOSTICS DENTAL
WATER QUALITY
ENVIRONMENTAL & APPLIED SOLUTIONS
All financial metrics shown reflect FY 2017E revenues
PRODUCT ID
~$5.7B ~$5.8B ~$2.8B ~$4.0B
Danaher Today
Multi-industry science & technology portfolio provides competitive advantages

1984 1991 1999 2000 2001 2002 2003 2004 2005 2006 2007 2008 2009 2010 2011 2012 2013 2014 2015 2016 2017E
KEY ACQUISITIONS & PORTFOLIO MOVES
TOOLS JV
Evolution of Danaher
Significant portfolio transformation creates significant opportunity
>50%OF DANAHER TOTAL
REVENUE TODAY
~$90M REVENUE
~20% GROSS MARGIN
-- CONSUMABLES REV.
-- HGM REVENUE
~$18B REVENUE
~55% GROSS MARGIN
~65% CONSUMABLES REV.
~30% HGM
~$4B REVENUE
<40% GROSS MARGIN
<15% CONSUMABLES REV.
<10% HGM REVENUE
1984
2000
Tod
ay
Founded by
Steve & Mitch Rales OPCOS AQUIRED SINCE
2011 REPRESENT
SPINCOMMS RMT
~$18B
Shaded area represents 2017E revenue for each OpCo
~$9B

ROW
6%NA
40%
EU
24%
HGM
30%
Revenue
By Mix
By Geography
Consumables
65%
Equipment
35%
GROSS
MARGIN
FREE CASH
FLOW TO
NET INCOME
~55%
>100%
UNITED BY COMMON
BUSINESS MODEL
• Outstanding brands with market-
leading positions
• Extensive installed base
• Strong ‘captive’ recurring revenues
• High level of customer intimacy
All financial metrics based on FY 2017E unless otherwise indicated
ADJUSTED
EBITDA
MARGIN YTD>20%
Distribution
30%Direct
70%
Direct vs. Distribution
TOTAL
REVENUE~$18BSTRONG PORTFOLIO
Building & enhancing a sustainable growth, earnings
and free cash flow profile

LIFE SCIENCES DIAGNOSTICS DENTAL
~$40B ~$35B ~$20B ~$15B
REGULATORY REQUIREMENTS
ADDRESSABLE MARKET SIZE
WORKFLOW EFFICIENCY
HIGH GROWTH MARKETS
IMPROVING STANDARDS OF CARE
ENVIRONMENTAL SAFETY
Strong secular drivers with high barriers to entry
WATER QUALITY
~$10B
PRODUCT ID
Well-Positioned Portfolio Serving Attractive End-Markets

Danaher Business System (DBS) is Our Competitive Advantage

1984 1991 1999 2001 2003 2005 2007 2009 2011 2013 2015 2017E
Evolution of the Danaher Business System (DBS)
As portfolio evolved, so has DBS – from Lean to a balanced approach
OUR SHARED PURPOSEHELPING REALIZE LIFE’S POTENTIAL
Leadership
Lean Growth
Leadership
Lean Growth
Leadership
Lean Growth
Leadership
Lean Growth
TODAY
Mid-1980s
LEAN
FOCUSED
ADDED
GROWTH
2001
2016
ADDED
LEADERSHIP
2009LAUNCHED
SHARED
PURPOSE

Balanced approach to deliver long-term value to shareholders
Building and evolving into a stronger, better Danaher
What You’ll Hear Today
Focused execution around our strategic priorities
1. Strengthen our competitive advantage with DBS
2. Enhance our portfolio via strategic M&A
3. Attract & retain exceptional talent
2017 Financial Highlights

“OMX” is Operating Margin Expansion; “WC” is Working Capital
SHAREHOLDER
CORE REVENUE GROWTH
OMX
CASH FLOW / WC TURNS
ROIC
CUSTOMER QUALITY (EXTERNAL PPM)
ON-TIME DELIVERY (OTD)
ASSOCIATEINTERNAL FILL RATE
RETENTION
8 CORE VALUE DRIVERS
DBS Is Our Competitive Advantage
“Common sense vigorously applied”
Leadership
Lean Growth

Core Revenue Growth
+Margin Expansion
+Strong Free Cash Flow
+Acquisitions
=TOP QUARTILE EPS GROWTH &
COMPOUNDING RETURNS
How We Create Value: Running the Danaher Playbook
IMPROVE COST
STRUCTURE
Balanced approach to create shareholder value
CORE REVENUE GROWTH
OMX
CASH FLOW / WC TURNS
ROIC
SHAREHOLDER
G&A
S&M
OMXCore
Growth
R&D
Gross
Margins
REINVEST
FOR GROWTH
ACCELERATE
MARGINS &
CORE GROWTH

Clear Runway to Accelerate Core Revenue Growth
Line of sight to MSD core revenue growth over time
NEW LARGER ACQUISITIONS
CONTINUED EXECUTION WITH IMPROVEMENT OPPORTUNITIES
MSD~3%2017E WEIGHTED
AVG. CORE
REVENUE GROWTH
DBS IS OUR
COMPETITIVE ADVANTAGE
CORE REVENUE GROWTH
OMX
CASH FLOW / WC TURNS
ROIC
SHAREHOLDER
Leadership
Lean Growth
2017E WEIGHTED
AVG. CORE
REVENUE GROWTH

Continued Margin Improvement With
Significant Runway Ahead
75bps+ average annual core OMX last 3 years, expect 50-75bps annually
RECENT ACQUISITIONS
IMPROVEMENTOPPORTUNITIES
STRONG EXECUTION AT CORE BUSINESSES
>600BPSAVG. OMX SINCE
ACQUISITION
AVG. OMX SINCE
ACQUISITION
>25%AVG. OPM
TODAY
>$10B COMBINED
REVENUE
20%+ ANTICIPATED
OPM OVER TIME>1,000BPS
AVG. OPM
TODAY
CORE REVENUE GROWTH
OMX
CASH FLOW / WC TURNS
ROIC
SHAREHOLDER
Mid/high-
teens ~20%AVG. OPM
TODAY
Operating Profit Margin (“OPM”) excludes amortization

Superior Free Cash Flow Generation
FCF expected to exceed Net Income for 26th consecutive year
2014 2015 2016 2017E 2014 - 2016 Average
DANAHER
LIFE
SCIENCE
PEERS
FCF / ADJUSTED NET
INCOME CONVERSION
>100%
~85%
FREE CASH FLOW (FCF)
CORE REVENUE GROWTH
OMX
CASH FLOW / WC TURNS
ROIC
SHAREHOLDER
$2.2B$2.4B $2.5B
>10% Growth Y/Y

MARKET
COMPANY
VALUATION
Our Strategic Approach to M&A
• Secular growth drivers
• Fragmented
• Higher barriers to entry
• Optionality with multi-industry
portfolio
• Competitive market position
• Strong brand / channel
• Consistent revenue visibility
• Higher margin businesses
• Cultural fit
• Focus on ROIC
• DBS opportunities
• Sustainability
• Synergies with DHR OpCos
• Combination of value & growth deals
Selectively pursuing value creation opportunities
CORE REVENUE GROWTH
OMX
CASH FLOW / WC TURNS
ROIC
SHAREHOLDER
“ROIC” is Return on Invested Capital

2002 2003 2004 2005 2006 2007 2008 2009 2010 2011 2012 2013 2014 2015 2016 2017E
VIDEOJET
ROIC (%)
CORE GROWTH CAGR LSD CORE GROWTH CAGR MSD
Organic execution + M&A = compounding returns
Summing Up the Value Creation Model:
Videojet Example
CORE REVENUE GROWTH
OMX
CASH FLOW / WC TURNS
ROIC
SHAREHOLDER
MSDCORE REVENUE
CAGR OVER THE
LAST 8 YEARS
>100BPS
AVG. ANNUAL
OMX LAST 3
YEARS
>20% ROIC
14 ACQUISITIONS
SINCE 2002
EWA
BIS
(Poland)F. Armida
(Mexico)
Echter +
Konig SA
(Argentina)
Comprint
(Brazil)Vega
(Brazil)

DD DD
~50% ~55%
Flat/LSDMid-
teens
— LSD
AT ACQ. TODAY
1 YEAR IN
LSD MSD*
~50% >50%
High-
teens~25%
LSD MSD
Core Growth
Gross Margin
Operating
Profit Margin
ROIC
Flat/LSD MSD
~70% >70%
LDD >20%
LSD HSD
Core Growth
Gross Margin
Operating
Profit Margin
ROIC
Update on Recent Large Acquisitions
AT ACQ. TODAYAT ACQ. TODAY
Deals at or above initial expectations
2 YEARS IN3 YEARS IN
CORE REVENUE GROWTH
OMX
CASH FLOW / WC TURNS
ROIC
SHAREHOLDER
ACQUIRED DEC 2014 ACQUIRED AUG 2015 ACQUIRED NOV 2016
Core Growth
Gross Margin
Operating
Profit Margin
ROIC
* Reflects Q4E 2017
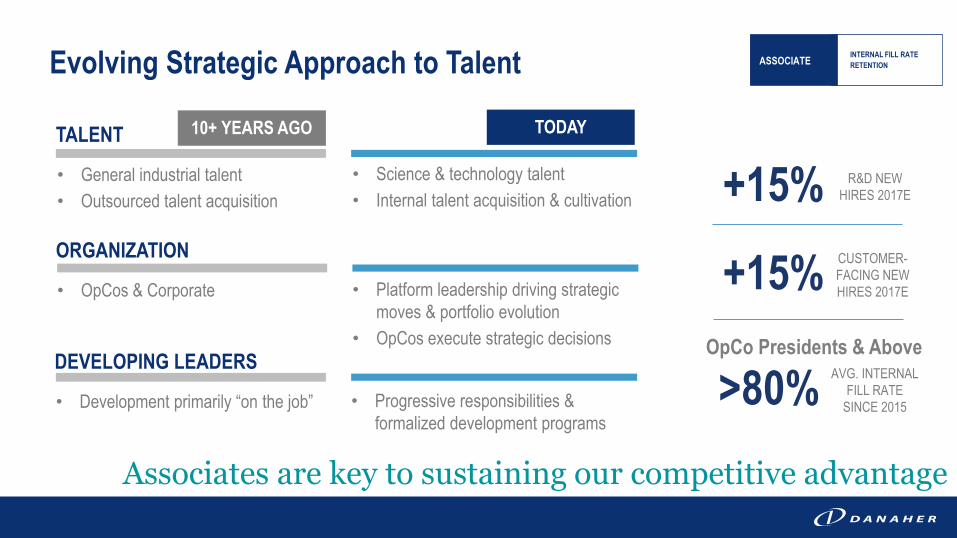
Associates are key to sustaining our competitive advantage
Evolving Strategic Approach to Talent
DEVELOPING LEADERS
• Development primarily “on the job”
TALENT
• General industrial talent
• Outsourced talent acquisition
ORGANIZATION
• OpCos & Corporate
10+ YEARS AGO
• Progressive responsibilities &
formalized development programs
• Science & technology talent
• Internal talent acquisition & cultivation
• Platform leadership driving strategic
moves & portfolio evolution
• OpCos execute strategic decisions
TODAY
OpCo Presidents & Above
>80%AVG. INTERNAL
FILL RATE
SINCE 2015
+15% R&D NEW
HIRES 2017E
+15%CUSTOMER-
FACING NEW
HIRES 2017E
INTERNAL FILL RATE
RETENTIONASSOCIATE
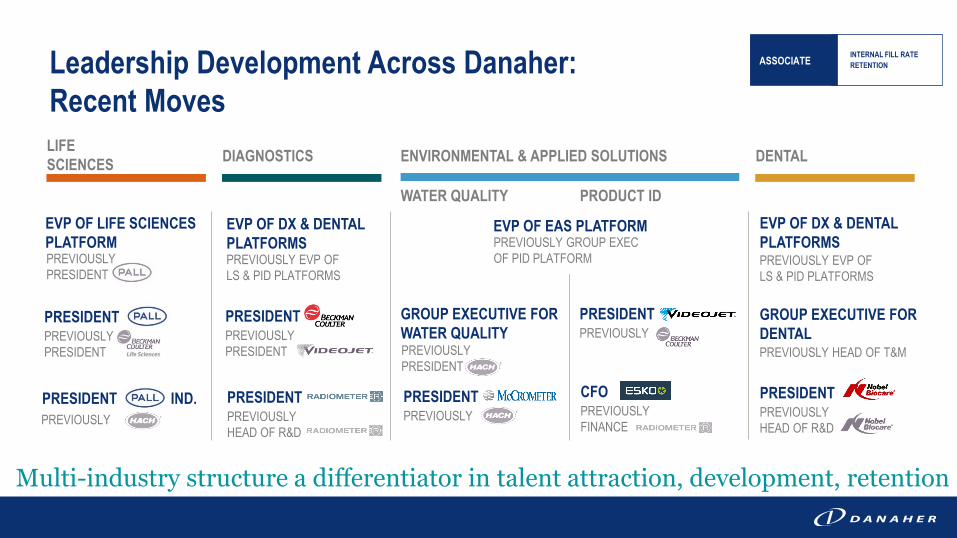
LIFE
SCIENCESDIAGNOSTICS DENTALENVIRONMENTAL & APPLIED SOLUTIONS
Leadership Development Across Danaher:
Recent Moves
Multi-industry structure a differentiator in talent attraction, development, retention
WATER QUALITY PRODUCT ID
PREVIOUSLY
PRESIDENT
EVP OF LIFE SCIENCES
PLATFORM
PREVIOUSLY
PRESIDENT
PRESIDENT
PREVIOUSLY EVP OF
LS & PID PLATFORMS
EVP OF DX & DENTAL
PLATFORMSPREVIOUSLY EVP OF
LS & PID PLATFORMS
EVP OF DX & DENTAL
PLATFORMS
PREVIOUSLY
PRESIDENT
PRESIDENT
PREVIOUSLY
HEAD OF R&D
PRESIDENT
PREVIOUSLY HEAD OF T&M
GROUP EXECUTIVE FOR
DENTAL
PREVIOUSLY
PRESIDENT
PREVIOUSLY
PRESIDENT IND.
PREVIOUSLY
PRESIDENT
PREVIOUSLY GROUP EXEC
OF PID PLATFORM
EVP OF EAS PLATFORM
PREVIOUSLY
HEAD OF R&D
PRESIDENT
INTERNAL FILL RATE
RETENTIONASSOCIATE
PREVIOUSLY
PRESIDENT
GROUP EXECUTIVE FOR
WATER QUALITY
PREVIOUSLY
FINANCE
CFO

Core Revenue Growth
+Margin Expansion
+Strong Free Cash Flow
+Acquisitions
=TOP QUARTILE EPS GROWTH &
COMPOUNDING RETURNS
Putting It All Together
DBS driving the creation of shareholder value
G&A
S&M
OMXCore
Growth
R&D
Gross
Margins
G&A
AS % OF SALES
AVG. ANNUAL
CORE OMX
GROSS
MARGIN+200BPS
RESULTS: LAST 3 YEARS
-50BPS
+50BPS
>75BPS
AVG. ANNUAL
EPS GROWTHMid-teens
R&D
AS % OF SALES
Leadership
Lean Growth

Balanced approach to deliver long-term value to shareholders
Summary
Portfolio & DBS evolution have contributed to better,
stronger Danaher – with significant runway ahead
Superior FCF generation enables us to enhance our
portfolio via strategic M&A
Exceptional talent & leadership is critical to delivering and
sustaining results


DANAHER BUSINESS SYSTEM
Melissa Aquino
Vice President, DBSO
2017 INVESTOR & ANALYST DAY

DBS Enables a Balanced Approach
Not just Lean – but also Leadership and Growth
DBS FUNDAMENTALS
PROBLEM SOLVING
PROCESS
VOICE OF THE
CUSTOMER
STANDARD WORK VALUE STREAM MAPPING
TRANSACTIONAL
PROCESS IMPROVEMENT
VISUAL & DAILY
MANAGEMENT
KAIZEN 5S
Leadership
Lean Growth

DBS Growth Tools
DBS Growth comprised of innovation & commercial tools
Strategic Product
Envelope
Product Planning
Group
Customer
Segmentation
Danaher Innovation
Process
Accelerated
Product Development
Speed Design
Review…
COMMERCIAL TOOLS
EXAMPLES:
EXAMPLES:
Transformative
Marketing
Value
Selling
Lead
Nurturing
Funnel ManagementStrategic
Negotiations
Sales Force
Initiative…
Leadership
Lean Growth
Leadership
Lean Growth
INNOVATION TOOLS

DBS Innovation Tools
Replicable process for innovation provides competitive advantage
Strategic
Product
Envelope
Problem to
Portfolio
(P2P)
Product
Planning
Group
NPD
Project
Management
Launch
Excellence
Define the
attractive domain
for innovation
Define a winning
roadmap for
attractive segments
Coordinate execution
& resources across
multiple projects
Drive cross-functional
development
of each new product
Generate & fulfill
demand for the
new product
DOMAIN ROADMAP
EXECUTION &
RESOURCES
CROSS-
FUNCTIONAL DEV. FULFILL DEMAND
FROM MARKET
INSIGHT…
…TO MARKET
SHARE
Leadership
Lean Growth

DBS Innovation in Action: Speed Design Review at Hach
BASICS OF SPEED DESIGN
REVIEW (SDR)
• Gather VOC; go to Gemba
• Obeya room with cross-functional
teams together
• Simultaneous product & process
optimization
• Rapid prototyping & evaluation
SDR IN ACTION: HACH CM130 CHLORINE
MONITORING SYSTEM FOR DIALYSIS
RESULTS
NEW ADJACENT
ADDRESSABLE MARKET
+$50M1ST FDA
CLEAREDONLINE CHLORINE ANALYZER
FOR DIALYSIS
Customer purchased Hach drinking water
product to try in a dialysis capacityVOC
GEMBA
SPEED 15 product design “sprints”
Dialysis clinics are required to test
water every 4 hours

DBS Commercial Tools
Integrated marketing & sales tools to drive commercial execution, accelerate growth
DAILY MANAGEMENT | GROWTH ROOM | STANDARD WORK
Market Insight
and Visibility
Sales
Productivity
and
Prospecting
Lead
Generation
and Campaign
Awareness
Customer
Buying
Journey &
Insight
TRANSFORMATIVE MARKETINGSALES
STANDARD WORK
Market Overview
and Channel
Strategy
Sales Funnel
Management
Market attractiveness
—
How do we win?
Market segmentation
—
Customer profile
What triggers interest?
—
Sources of info
Value Proposition
—
Customer benefit
Customer Buying
BehaviorMonthly “Key”
Opportunity Review
Are we in control? What’s working? What’s not working?
Leadership
Lean Growth

Commercial Execution Driving Growth at Pall
Using DBS to improve S&M processes and drive better growth
+50%CONTACTS / VISIBILITY
LEADS
+6.5xOPPORTUNITIES
+2xWIN RATE %
+15%
RESULTS
2017 YTD
MA
RK
ET
ING
FU
NN
EL
SA
LES
FU
NN
EL
SITUATION AT ACQUISTION
• Limited process for improving market visibility
• Little to no digital marketing capabilities
• No repeatable process for generating / nurturing high-quality
sales leads
DBS ACTIONS
• Transformative Marketing: Disciplined marketing campaigns to
improve visibility & account coverage
• Lead Handling: Prioritize & deliver more qualified leads to sales
• Funnel Management: Streamlined sales funnel process to improve
win rates
BIOPHARMA
“WIN THE SPEC”

Balanced approach to deliver long-term value to shareholders
DBS is our culture and our competitive advantage
Today, DBS is not just Lean – it’s about Growth & Leadership as well
DBS Growth Tools are helping across all platforms – you’ll hear
many examples today
Summary


LIFE SCIENCES
Rainer Blair, Executive Vice President
2017 INVESTOR & ANALYST DAY
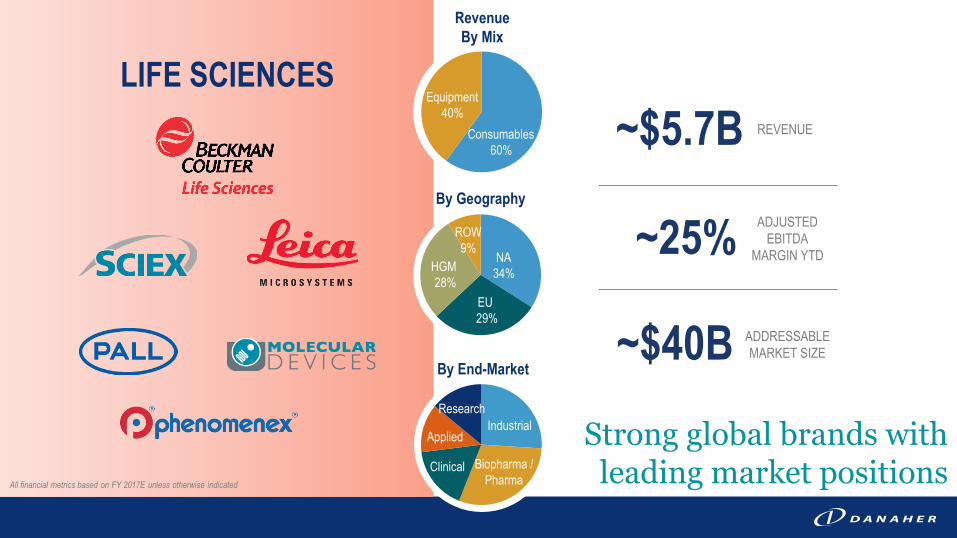
Strong global brands with leading market positions
LIFE SCIENCES
REVENUE
ADJUSTED
EBITDA
MARGIN YTD
ADDRESSABLE
MARKET SIZE
~$5.7B
~$40B
~25%
Revenue
By Mix
By Geography
By End-Market
Industrial
Clinical Biopharma /
Pharma
Research
Applied
Consumables
60%
Equipment
40%
ROW
9%NA
34%
EU
29%
HGM
28%
All financial metrics based on FY 2017E unless otherwise indicated

Strong core operating margin expansion driven by broad-based
execution across the platform
Pall continues to deliver meaningful improvements since acquisition;
building momentum and expect higher core growth in Q4
Accelerating core growth across the platform
Attractive value creation via M&A
• Phenomenex up MSD
• IDBS enhances our informatics software capabilities in biologics
2017 Highlights
Strong execution providing good momentum into 2018
LIFE SCIENCES
CORE OMX
>150BPS
PALL CORE OMX
SINCE ACQUISITION
>600BPS
LIFE SCIENCES CORE
REVENUE GROWTH 2017E
MSD
All financial metrics refer to the 9 months ending Sep. 29, 2017 unless otherwise indicated

Focused on areas of highest growth & highest customer impact
How We Win in Life Sciences
Indexing our portfolio to high-growth end markets –
geographically and in terms of applications
Best-in-Class analytical technologies & high level of
innovation focused on key applications
Increasing aftermarket business with frequent, high-
quality touch points and differentiated offering
Global high-tech sales force to target highest growth
segments & regional opportunities
OUR STRATEGIC FOCUS
INNOVATION
SERVICE
COMMERCIAL
HIGH GROWTH
SEGMENTS

~25% ~25% ~15% ~15%% OF LS SEGMENT REVENUE
Strong secular drivers underpinning growth opportunities
~15%
Leading Global Brands Serving Attractive Markets
BIOLOGICS INDUSTRIALAPPLIED (FOOD, ENV., FORENSICS)
RESEARCH &
ACADEMIC CLINICAL

Well-positioned to win in attractive market segments
Strong Secular Growth Drivers
600
DATA SENSOR CHIPS
IN FUTURE CARS VS
300 TODAY
~100
PESTICIDES &
VETERINARY DRUGS’
MAXIMUM RESIDUAL
LEVELS TIGHTENED BY
GOV’T AGENCIES IN 2017
80%
OF TOTAL LIFE SCIENCE
R&D SPEND IS ON
BIOPHARMACEUTICALS
BIOLOGICSEVOLUTION OF
LIFE SCIENCE
RESEARCH
HIGH GROWTH
MARKETS
FOOD &
ENVIRONMENTALMICRO-
ELECTRONICS
+20%
NUMBER OF BIOLOGICS
IN THE APPROVAL
PIPELINE VS 2016
~20%
BIOPHARMA CAGR IN
CHINA EXPECTED
THROUGH 2020

New Product Innovation Driving Growth at SCIEX
TOPAZ CLINICAL MASS SPEC & VITAMIN D ASSAY
1STFULLY INTEGRATED LC-MS
SYSTEM & ASSAY FOR
CLINICAL DX TESTING
~10M VITAMIN D TESTS RUN BY
US LABS ANNUALLY
+$100M ADDRESSABLE MARKET
EXPANSION FOR SCIEX
FDA
CLEARED
Year 1 Year 2 Year 3
ASSAY
1
VIT
D
VIT
DVIT
D
Increasing customer savings & profits as additional tests are added
Helping clinical lab customers do more, save more, and deliver more confident results
ASSAY
1
ASSAY
2

New Product Innovation Driving Growth at BEC LS
Stronger cadence of innovation helping drive share gains
FlatCORE GROWTH
AT THE TIME OF
ACQUISITIONMSD
CORE REVENUE
GROWTH
CAGR LAST 3 YEARS
BIOMEK I-SERIES
AUTOMATED
WORKSTATIONS
CYTOFLEX LX
3 Years
Pre-Acq.Last 3
Years
LDT
1~3
~20Number of New Product Launches
S&M*
R&D*
+200BPS
+50BPS
RESULTS OVER THE
LAST 5 YEARS
* As a % of sales

Differentiating With Our Service Offering at SCIEX
Strategic approach to service helping drive share gains
SERVICE CONTRACT
CAPTURE RATE
SINCE 2015
SERVICE REVENUE
CAGR
LAST 5 YEARSHSD+
+500BPS
IMPROVEMENT IN
FIRST-TIME-FIX
RATE SINCE 2015>700BPSCUSTOMER-CENTRIC
• Proactive vs reactive
• Focused on customer workflow, helping
customers achieve superior results
• Improving quality & efficiencies
COMPREHENSIVE OFFERING
• Enhancing with new aftermarket products & tools
• Leveraging commercial capabilities
HOW WE WIN WITH SERVICE

Pall Update: Actions & Results Since Acquisition
Improving operational & commercial execution with DBS
ANTICIPATED CUMULATIVE COST
SAVINGS SINCE
ACQUISITIONYEAR 1: ~$125M
YEAR 2: ~$200M
YEAR 5: ~$350M
Reducing manufacturing & operating costs
Meaningful gains in quality & delivery
DBS commercial initiatives driving better go-to-
market capabilities
Accelerating innovation through reinvestment and
focused R&D processes
OPERATIONS
COMMERCIAL
INNOVATION
NUMBER OF
NEW PRODUCT LAUNCHES
NET WORKING CAPITAL
IMPROVEMENT~$100M
+50%
ON-TIME-DELIVERY
IMPROVEMENT>2,000BPS
CORE REVENUE
GROWTH EXPECTED IN
Q4 2017MSD

Running the Danaher Playbook: Life Sciences Platform
~$2.4B REVENUE
<40% AFTERMARKET
5 YEARS AGO
~$5.7B REVENUE
~60% AFTERMARKET
TODAY
2005 2009 2010 2011 2012 2013 2014 2015 2016 2017
~$19B SPENT ON 25+ ACQUISITIONS SINCE 2005
Enhancing our growth trajectory with DBS rigor & inorganic opportunities
MSD CORE REVENUE
CAGR
~300BPSGROSS MARGIN
EXPANSION
>20% OP CAGR
OPM EXPANSION
~1,000BPS
All financial metrics shown are over the last 5 years, unless otherwise indicated
OPM excludes amortization

Balanced approach to deliver long-term value to shareholders
Outstanding global brands built on best-in-class technologies,
in attractive markets
Terrific margin performance enabling reinvestment in new
product & commercial innovation
Pall executing well two years post acquisition, and performing
ahead of initial expectations
Summary


DENTAL
Amir Aghdaei, Group Executive
2017 INVESTOR & ANALYST DAY

All financial metrics based on FY 2017E unless otherwise indicated
ROW
6%NA
49%
EU 23%HGM
22%
Revenue
By Mix
By Geography
Equipment
Specialty
Consum.(implants, ortho)
Traditional
Consum.
DENTAL
REVENUE
ADJUSTED
EBITDA
MARGIN YTD
ADDRESSABLE
MARKET SIZE
~$2.8B
~$20B
~20%
Direct vs. Distribution
DirectDistribution A leading global player covering entire dental workflow

Completed year 2 of treating Dental as a “new acquisition”
Seeing benefits of Dental platform integration
Continuing to improve performance and re-invest in growth, M&A
Executing well in HGM; good growth in specialty businesses
(implants & orthodontics)
2017 Highlights
GROSS MARGIN
EXPANSION
SINCE 2015
R&D
INVESTMENT
CORE REVENUE
GROWTH AT NOBEL &
ORMCO 2017E
>100BPS
MSD
+10%
Good relative performance – with ample upside
REVENUE
GROWTH IN HGMDD
All financial metrics refer to the 9 months ending Sep.
29, 2017 unless otherwise indicated

Strong Global Growth Drivers
Strong fundamental growth drivers, diverse global customer base
PATIENT
• Aging population
• Higher aesthetic motivation
• Growing middle class & better access to care (HGM)
DENTIST
• Shifting from analog to digital technologies
• Seeking predictable treatment results
CLINIC
• “Dentistry as a business”
• Seeking efficiency and economic results (DSOs)
OF US DENTISTS
USE DIGITAL
TECHNOLOGY
DENTAL SPEND
PER CAPITA IN THE
US VS CHINA
IMPLANT
PENETRATION
GLOBALLY
<50%
~5%
30x

Pursue
Winning Vision3
Rejuvenate Innovation
and Growth2
Build a Strong Foundation 1 Reduce business complexity
Create funds for investments
Accelerate growth
Build our competitive advantage
Long-term, sustainable market leadership
1 2 3
STRONG
FOUNDATION
INNOVATION &
GROWTH
WINNING
VISION
Our Frame for Treating Dental as a “New Acquisition”

1 2 3
ACTIONS
• Consolidated number of OpCos from 10 to 4
• Reduced manufacturing & back-office sites by 30%
• Shared platform services
• DBS “basics”
RESULTS OVER THE LAST 2 YEARS
Reduce Business Complexity & Create Funds for Investment
>100BPSGROSS MARGIN
IMPROVEMENT
-50BPSG&A
AS % OF SALES
Step 1: Building a Strong Foundation
Focused structure to facilitate improving core growth & margins
STRONG
FOUNDATION
INNOVATION &
GROWTH
WINNING
VISION

1 2 3
DENTAL PLATFORM ACTIONS
OVER LAST TWO YEARS
Drive Sustainable Growth & Build Out Competitive Advantage
CORE
GROWTH Flat/LSD
At Acq.
Step 2: Rejuvenate Innovation & Growth
Today
MSD
INCREASE
IN FOTS
R&D SPEND
AS % OF SALES
>10%
+100BPS
Accelerating growth trajectory through reinvestment
STRONG
FOUNDATION
INNOVATION &
GROWTH
WINNING
VISION
EXAMPLE
>25NEW PRODUCTS
LAUNCHED SINCE
ACQUISITION
+20%R&D SPEND
SINCE 2015
>800BPSOMX SINCE
ACQUISITION
RESULTS
ACQUIRED 2014

HOW WE WIN IN CHINA
• “One stop solution” product portfolio of leading brands
• Increasing commercial coverage, invest in localized sites and R&D
• Strategic partnerships
RESULTS
1 2 3Step 2: Rejuvenate Innovation & Growth
LEADING PLAYER IN
CITIES IN CHINA
WHERE WE HAVE
A PRESENCE
‘In China for China’
>50
Leading market position in China
STRONG
FOUNDATION
INNOVATION &
GROWTH
WINNING
VISION
~$35M
2012 Today
>$150MChina Dental
Revenue
CORE REVENUE
CAGR IN CHINA
LAST 5 YEARSDD+
58

1 2 3
YESTERDAY / TODAY
POINT SOLUTIONS
Build Long-Term, Sustainable Leadership
TODAY / TOMORROW
INTEGRATED WORKFLOWS
Step 3: Pursue Winning Vision
EQUIPMENT
CONSUMABLES
SOFTWARE/DIGITAL
DIAGNOSTICS
TREATMENT PLANNING
TREATMENT EXECUTION
Integrate & optimize dentists’ workflows
STRONG
FOUNDATION
INNOVATION &
GROWTH
WINNING
VISION
NUMBER OF SOFTWARE
ENGINEERS OVER
LAST 2 YEARS
IMAGING INSTALLED BASE
GLOBALLY
OF DENTISTS’
CLINICAL SPEND
CAN BE CAPTURED
BY OUR PRODUCTS
+2.5x
>90%
Largest

Balanced approach to deliver long-term value to shareholders
Executing the DHR playbook and delivering on key strategic
priorities
Making good progress toward accelerating core growth, with
runway to 20%+ OPM
Specialty consumables businesses and High Growth Markets
performing very well
Summary


Giving Back
As a global platform supporting the packaging
value chain for food products, Product ID is
proud to support WFP’s mission to end
hunger and improve nutrition.
Hach is proud to support an
organization dedicated to improving
lives across the globe with the most
basic of human needs: clean water.
Direct Relief uses innovative approaches
for the efficient delivery of medical aid,
serving the needs of communities close to
our associates around the world.
WCRF’s cause aligns with SCIEX’s vision of
placing the power of life-changing answers
into the hands of those who care,
everywhere.
Beckman Coulter’s long-standing
partnership with LLS enables the team
to support active research projects and
help patients afford treatments.
Nobel is proud to partner with Brighter
Way as they help future dental health
professionals train to care for vulnerable
children, adults, and families.


PRODUCT ID
Joakim Weidemanis,
Executive Vice President
2017 INVESTOR & ANALYST DAY

All financial metrics based on FY 2017E unless otherwise indicated
Revenue
By Mix
By Geography
PRODUCT IDREVENUE
EAS ADJUSTED
EBITDA
MARGIN YTD
ADDRESSABLE
MARKET SIZE
~$1.8B
~$10B
>25%
By End-Market
CPG Food
& Bev
Pharma
ROW
4%
NA
30%
EU
30%
HGM
36%
Equipment
45%Consumables
55%
Other
CPG
Industrial
Leading global player supporting the entire packaging value chain
Packaging
Supply
Chain
ENVIRONMENTAL & APPLIED SOLUTIONS (EAS)

Continued share gains driven by new products, expanded service offering
• Videojet: largest installed base of remotely connected printers
• Esko: evolving software offering for digitizing packaging workflows
• X-Rite: early traction with digitizing appearance
Consistent DBS execution helping to fund reinvestment and sustain strong
track record of MSD core growth
Recent acquisitions augmenting core growth: AVT, Laetus, MediaBeacon
2017 Highlights
Running the Danaher playbook at Product ID
MAJOR NEW PRODUCT
LAUNCHES IN 2017
16
AVG. ANNUAL OMX
SINCE 2014
>100BPS
CORE REVENUE CAGR AT
VIDEOJET LAST 8 YEARS
MSD
All financial metrics refer to the 9 months ending Sep.
29, 2017 unless otherwise indicated

Growing Suite of Solutions Across the Packaging Value Chain
Solutions from concept & design through production
Pharma inspection
Pharma and food Track and Trace
Marking and
Coding
Spectrophotometers
Color formulation SW
Color standards
Color management workflow
Digital asset management and distribution SW
Packaging management SW
Packaging CAD
Pre-press automation SW
Flexography imagers
Packaging
Design
Concept and
Ideation
Artwork
Creation
Packaging
Converting
Package
Filling
Inline
Printing
Warehouse &
Logistics
Distribution &
Retail
Packaging
Strategy
In-line
inspection

Strong secular drivers across the packaging value chain
Packaging Macro Growth Drivers
OF CPG BRAND PURCHASE
DECISIONS ARE MADE AT
THE POINT OF SALE
>900
DIFFERENT FACILITIES THAT
MANUFACTURE & BOTTLE
COCA COLA GLOBALLY
PACKAGING
PROLIFERATION
GLOBAL BRAND
CONSISTENCY &
ACCURACY
REGULATORY &
CLAIMS INFORMATION
PACKAGING AS A
MARKETING VEHICLE
+85%
NUMBER OF OREO SKUs
LAUNCHED PER YEAR
TODAY VS 2012
~50%
OF GLOBAL PACKAGING
TRACK & TRACE REGULATIONS
HAVE BEEN ADDED SINCE 2015
>50%

Focused on Supporting Our Customers’ Needs
PACKAGING
VARIABILITYPACKAGING
PROLIFERATION
BRAND CONSISTENCY &
ACCURACY
REGULATORY & CLAIMS
INFORMATION
PACKAGING AS A
MARKETING VEHICLE
CONSUMER TRENDS
• Uptime & scalability
• Rapid diagnostics & recovery
• Global deployment & service capabilities
• Deep domain knowledge
• Digital workflows linking physical & digital worlds
CUSTOMER NEEDS
• Increased product launch velocity
• Focus on connectivity & remote service
• Local digital and vertical marketing
• Trusted advisor on customers’ application
• Ongoing digitization of physical workflows
OUR STRATEGIC FOCUS
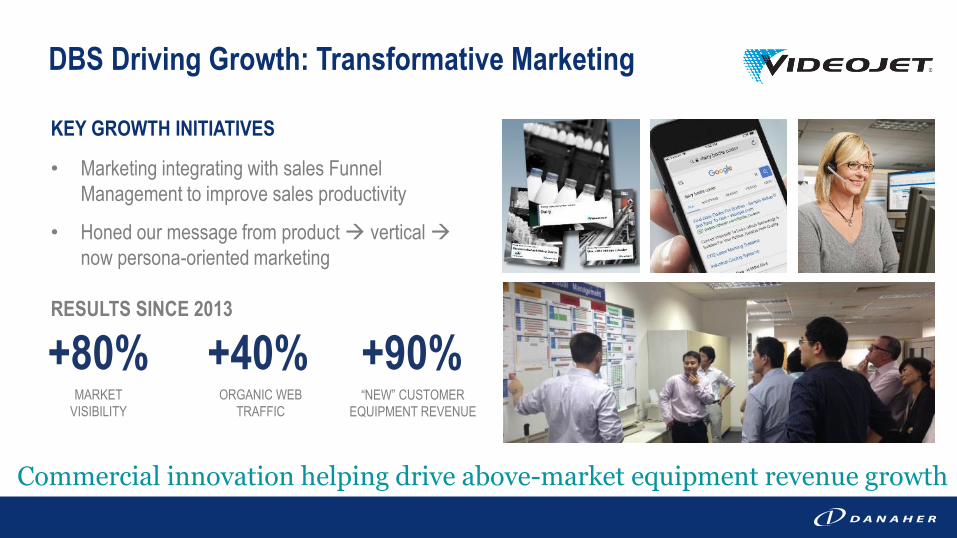
DBS Driving Growth: Transformative Marketing
KEY GROWTH INITIATIVES
• Marketing integrating with sales Funnel
Management to improve sales productivity
• Honed our message from product vertical
now persona-oriented marketing
RESULTS SINCE 2013
+80%MARKET
VISIBILITY
+40%ORGANIC WEB
TRAFFIC
+90%“NEW” CUSTOMER
EQUIPMENT REVENUE
Commercial innovation helping drive above-market equipment revenue growth

Differentiating With Our Service Offering
Differentiating with service to drive share gains
• Growing through disciplined service commercialization
• Differentiating our portfolio to better address customer
needs, drive replacement
• Expanding Remote Service Solutions:
IoT-enabled 1860 printer launched in 2017
EARLY INNINGS OF REMOTE OFFERING
LARGEST REMOTELY CONNECTED
INSTALLED BASE GLOBALLY
PRINTERS CONNECTED
WITH REMOTE SERVICE
SINCE 2015
PRINTERS UNDER
SERVICE CONTRACT
SINCE 2014
SERVICE REVENUE
GROWTH 4 YEARS
IN A ROW
12x
DD
+65%

Differentiating Through Product Innovation
Innovative solutions rooted in customer needs underpin our growth
ORGANICALLY INORGANICALLYMAJOR CORE NEW PRODUCT INTRODUCTIONS
Expansion beyond core products
CIJ 1860 Platform
Predictive analytics
& remote service
TTO
iAssure
inspection
Total
Appearance
Capture
Acquisition in 2017
Expands our
in-line print
inspection
offering
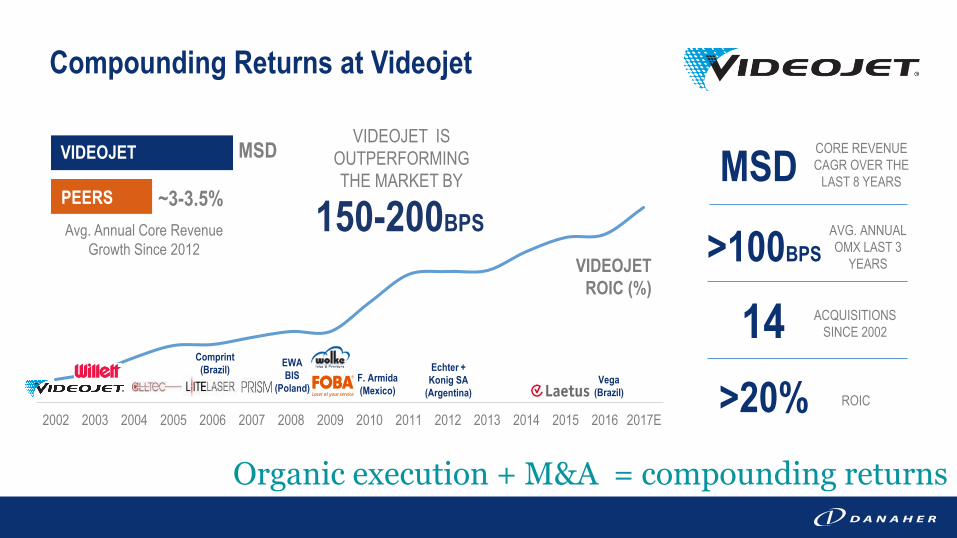
2002 2003 2004 2005 2006 2007 2008 2009 2010 2011 2012 2013 2014 2015 2016 2017E
VIDEOJET
ROIC (%)
Organic execution + M&A = compounding returns
Compounding Returns at Videojet
MSD
~3-3.5%
VIDEOJET IS
OUTPERFORMING
THE MARKET BY
150-200BPSPEERS
Avg. Annual Core Revenue
Growth Since 2012
VIDEOJET
EWA
BIS
(Poland)F. Armida
(Mexico)
Echter +
Konig SA
(Argentina)
Comprint
(Brazil)Vega
(Brazil)
MSDCORE REVENUE
CAGR OVER THE
LAST 8 YEARS
>100BPS
AVG. ANNUAL
OMX LAST 3
YEARS
>20% ROIC
14 ACQUISITIONS
SINCE 2002
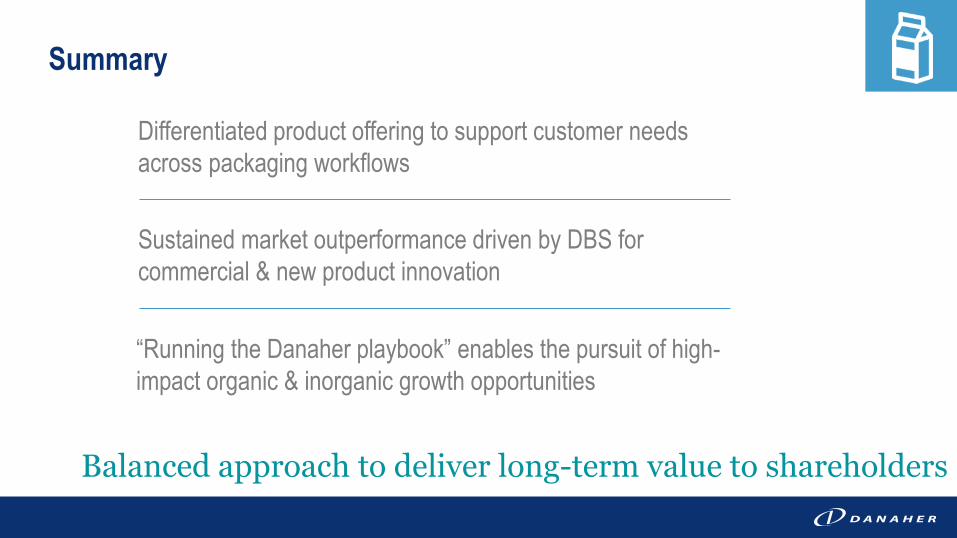
Balanced approach to deliver long-term value to shareholders
Differentiated product offering to support customer needs
across packaging workflows
Sustained market outperformance driven by DBS for
commercial & new product innovation
“Running the Danaher playbook” enables the pursuit of high-
impact organic & inorganic growth opportunities
Summary


WATER QUALITY
Lance Reisman, Group Executive
2017 INVESTOR & ANALYST DAY
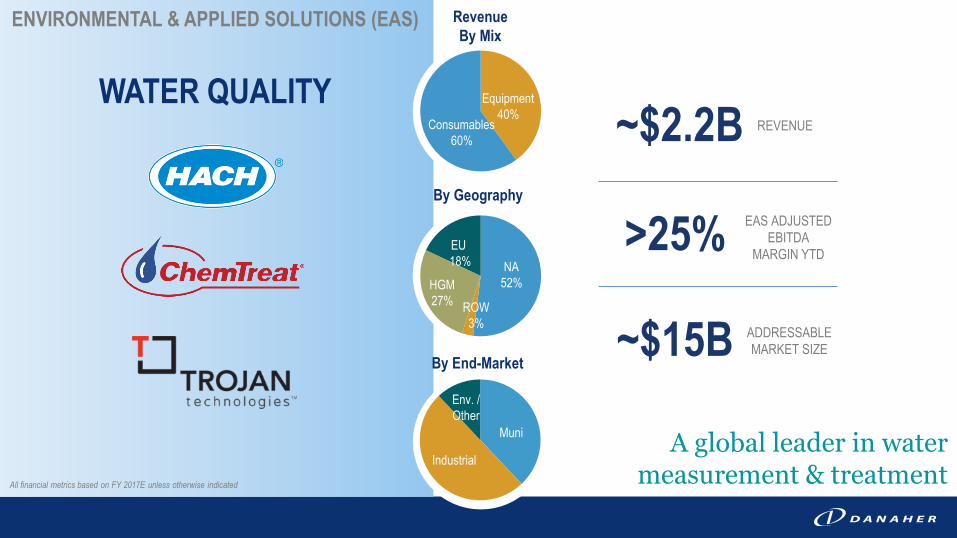
All financial metrics based on FY 2017E unless otherwise indicated
REVENUE
ADDRESSABLE
MARKET SIZE
~$2.2B
~$15B
WATER QUALITY
Revenue
By Mix
By Geography
By End-Market
Muni
ROW
3%
NA
52%
EU
18%
HGM
27%
Equipment
40%Consumables
60%
Industrial
Env. /
Other
A global leader in water measurement & treatment
ENVIRONMENTAL & APPLIED SOLUTIONS (EAS)
EAS ADJUSTED
EBITDA
MARGIN YTD>25%

Continued share gains across the platform
• ChemTreat & Trojan executing well
• Solid performance at Hach in core muni & industrial businesses
DBS growth tools helping drive new product & commercial innovation,
while enabling entry into new market segments
• Trojan win rate up >750bps y/y
• Introduced Hach CM130 dialysis chlorine monitoring system
Bolt-on acquisitions enhancing platform growth trajectory
• Closed 2 deals: AppliTek (online analyzers) and Enviscience
(Thailand distributor)
2017 Highlights
New markets, new products & commercial execution driving share gains
2017E CORE REVENUE GROWTH
AT TROJAN & CHEMTREAT
MSD
INCREASE IN FOTS
IN NA & HGM
DD
ACQUISITIONS
OVER THE LAST 4 YEARS
10
All financial metrics refer to the 9 months ending Sep. 29, 2017 unless otherwise indicated

TREATING
MEASURING
Winning with strong brands, full water cycle expertise & DBS
Where We Play & How We Win in Water Quality
WATER
STORED WATER
TREATED WATER
USED
Environmental Municipal IndustrialBRAND LEADERSHIP:
LEADING PLAYER
PRODUCT INNOVATION &
COMMERCIAL EXECUTION
DIFFERENTIATED
CHANNEL
Winning
Dimensions

Well-positioned for long-term trends
Strong Secular Growth Drivers
OF MUNICIPAL ENERGY
BUDGETS ARE CONSUMED
BY WATER TREATMENT
+220M
PEOPLE NEWLY CONNECTED
TO WASTEWATER TREATMENT
UNDER CHINA’S LATEST 5
YEAR PLAN
INCREASING
REGULATORY
REQUIREMENTS
HIGH GROWTH
MARKETS
WATER SCARCITY /
SUSTAINABILITY
DATA ANALYTICS &
GREATER
EFFICIENCIES
+50%
NUMBER OF US STATES THAT
HAVE ADOPTED NUTRIENT
DISCHARGE LIMIT STANDARDS
SINCE 2008
~500M
PEOPLE GLOBALLY
EXPERIENCE WATER
SCARCITY YEAR-ROUND
~35%

Strategic Focus: Supporting Customers’ Needs
PACKAGING
VARIABILITYWATER SCARCITY /
SUSTAINABILITY
REGULATORY
REQUIREMENTS
HIGH GROWTH
MARKETS
DATA ANALYTICS &
GREATER EFFICIENCIES
TRENDS IN WATER QUALITY
• Respond to increasing & changing reporting
requirements
• Greater interest in conservation &
addressing scarcity challenges
• Demand for full workflow solutions
CUSTOMER NEEDS
• Maximizing commercial investments and
effectiveness in HGM
• Enhancing strategic account management
• Accelerating digital marketing capabilities
• Increasing cadence of new product innovation
including software
OUR STRATEGIC FOCUS

How We Differentiate and Win Through Innovation
Customers talk, we listen
CM130 Chlorine
Monitoring System
1st FDA cleared
system for dialysis
Claros™
Data, instrument
& process
management
CUSTOMER ADOPTION OF
CHEMTREAT’S WEB-BASED
WATER MANAGEMENT SINCE 2015DDREVENUE GROWTH IN
TROJAN REUSE
SINCE 2015>10%
UVFlex™
Expanded
technology
capabilities to
include water reuse application
at nearly any sized wastewater
facility
NEW ADDRESSABLE
MARKET WITH
CLAROS CAPABILITIES+$500M
CTVista+®
Water
management
software tracks
& records real-time
data 24/7 to help customers
optimize water treatment

Commercial Execution: Leveraging Scale at the Platform Level
Expanding commercial leadership contributing to share gains
KEY GROWTH INITIATIVES
• Accelerating digital marketing capabilities using DBS
• Platform approach to strategic key accounts
• Increasing local presence in High Growth Markets
RESULTS
~40%DIGITAL REVENUE
CAGR SINCE 2014
+DDCAGR IN KEY ACCOUNT
WINS & RENEWALS
SINCE 2015
+40%HGM REVENUE
GROWTH
OVER LAST 5 YEARS
EXAMPLES OF KEY ACCOUNTS
ACROSS WATER QUALITY
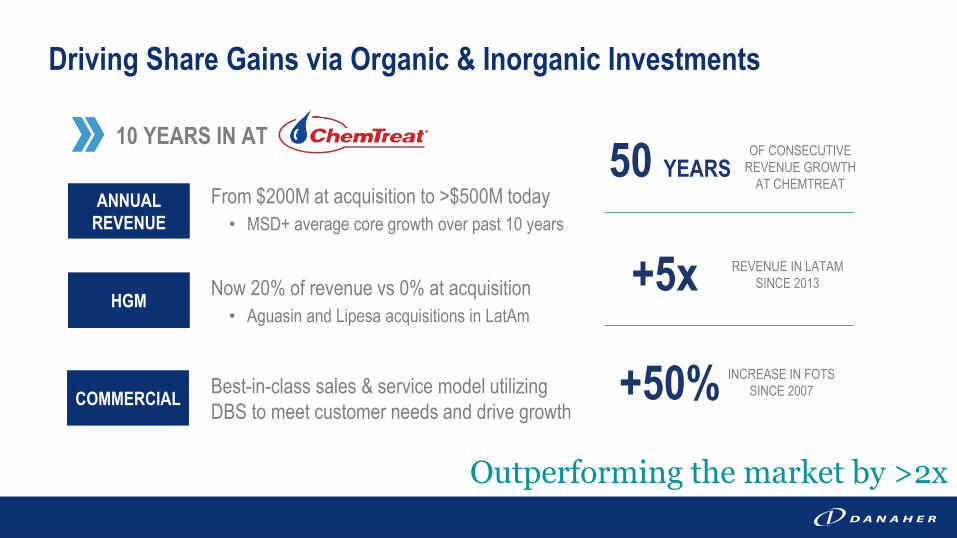
Driving Share Gains via Organic & Inorganic Investments
Outperforming the market by >2x
10 YEARS IN AT
From $200M at acquisition to >$500M today
• MSD+ average core growth over past 10 years
Now 20% of revenue vs 0% at acquisition
• Aguasin and Lipesa acquisitions in LatAm
Best-in-class sales & service model utilizing
DBS to meet customer needs and drive growth
ANNUAL
REVENUE
HGM
COMMERCIAL
OF CONSECUTIVE
REVENUE GROWTH
AT CHEMTREAT
REVENUE IN LATAM
SINCE 2013
INCREASE IN FOTS
SINCE 2007
50 YEARS
+50%
+5x

Balanced approach to deliver long-term value to shareholders
Strong position in highly attractive end-markets
Winning in our markets through product innovation &
commercial execution
Continuing to invest organically and inorganically to expand
our market opportunity
Summary


DIAGNOSTICS
Dan Daniel, Executive Vice President
2017 INVESTOR & ANALYST DAY

Strong brands with a broad global presence
DIAGNOSTICS
REVENUE
ADJUSTED
EBITDA
MARGIN YTD
ADDRESSABLE
MARKET SIZE
~$5.8B
~$35B
>20%
Revenue
By Mix
By Geography
By End-Market
Beckman
Diagnostics
Radiometer
LBS
Cepheid
Consumables
80%
Equipment
20%
All financial metrics based on FY 2017E unless otherwise indicated
ROW
6%NA
39%
EU 19%
HGM
36%

Outstanding first year at Cepheid, with DBS having a meaningful
impact helping to deliver & sustain mid-teens operating margins
Innovation & test menu expansion contributing to MSD core
revenue growth at Leica Biosystems and Radiometer
High growth markets continue to drive growth
• Cepheid increased FOS in China 2x resulting in >40% core growth
• Beckman continues to expand its direct channel in China & Middle East
2017 Highlights
Focus on innovation, accelerating growth and driving long-term results
CORE REVENUE
GROWTH AT CEPHEID
DD
NEW PRODUCTS’
CONTRIBUTION TO CORE
GROWTH AT LBS
~100BPS
REVENUE GROWTH IN
HIGH GROWTH MARKETS
HSDAll financial metrics refer to the 9 months ending Sep. 29, 2017 unless otherwise indicated

Well-positioned to win in an attractive market
Strong Secular Growth Drivers
>350%
INCREASE IN
HEALTHCARE SPEND
IN CHINA FROM
2005-2015
~30%
PENETRATION OF
MOLECULAR DX
IN THE US TODAY
~10K
PEOPLE IN THE US
TURN 65
EVERY DAY
PREDICTIVE &
PREVENTIVE CAREAGING
POPULATION
SKILLED LABOR
SHORTAGE
ADOPTION OF
NEW
TECHNOLOGIES
HIGH GROWTH
MARKETS
>70%
OF TREATMENT
DECISIONS ARE
INFORMED BY CLINICAL
DIAGNOSTICS
>50%
OF A TYPICAL
HOSPITAL LAB’S
COSTS ARE
PERSONNEL

Innovative clinical workflow solutions enable customers to improve operations
How We Win & Where We Play in Diagnostics
OUR COMPETITIVE ADVANTAGE
COMPREHENSIVE PRODUCT SUITE
PROVIDING SUPERIOR WORKFLOW EFFICIENCY
AUTOMATION &
SOFTWARE
DIFFERENTIATED OFFERING FOR OUR CUSTOMERS
FASTEST TURN-
AROUND TIMEHIGHEST
THROUGHPUT
HIGH QUALITY,
WITH BROADEST
MENUBOND / Advanced Staining Chemistry / IA & Automation
WHERE WE PLAY
TEST MENU
EXPANSION
GLOBAL
DISTRIBUTION &
SERVICE NETWORK
Surgical,
Intensive Care
Anatomic Pathology,
Cytology,Molecular Medicine Labs
Hematology,
Chemistry, Microbiology
Blood Banking,
Urinalysis
Point of Care
Oncology,
Tumor Boards
Emergency
Neo-natal

Cepheid Update: Actions & Results Since Acquisition
DBS helping to deliver sustainable core growth & margin expansion
Lean tools contribute to manufacturing productivity
gains and capacity expansion
DBS driving meaningful improvement in OTD
+3x sales team in China, small hospitals, POLs
Using Funnel Management to drive +2X increase in
qualified leads and win rate tracking
Continued menu expansion with Flu Express &
Group A Strep
OPERATIONS
COMMERCIAL
INNOVATION
DD DD
~50% ~55%
Flat/LSDMid-
teens
<80% >95%
AT ACQ. TODAY1 YEAR IN
Core Growth
Gross Margin
Operating
Profit Margin
On-time Delivery
(OTD)

Accelerating Growth Through Product Innovation
Well-positioned for improved growth in 2018 and beyond
DX R&D SPEND AS
% OF SALES OVER
LAST 3 YEARS+100BPS
RECENT NEW INSTRUMENTS & TECHNOLOGIES
Beckman DxC 700AU, DxH
500, Access 2, DxONE
LBS Bond III, Spectra
Stainer, Peloris III
Radiometer ABL 800,
TCM 5
PELORIS IIIXPERT XPRESS
GROUP A STREPRECENT TEST MENU ADDITIONS
Beckman hsTnI: High-
sensitivity troponin (CE),
Vitamin D, AMH
Radiometer Creatinine,
urea (CE), PCT (China)
Cepheid Flu Xpress, Group
A Strep Xpress

Accelerating Growth Through Commercial Execution
Strong execution with DBS accelerating growth opportunities
CONTINUE TO WIN INHIGH GROWTH MARKETS
DBS GROWTH TOOLS
China, Mexico
Expanding direct channel
Funnel Management, Lead
Generation
Strategic Account
Management
Clinical trial execution
NUMBER OF DX
PLATFORM’S
CLINICAL TRIALS
OVER LAST 3 YEARS+>2x
BEC DX FOTS
ADDED IN CHINA
SINCE 2015>50%
Adding FOTS
At Beckman, Cepheid
Localizing
China R&D, manufacturing
REVENUE GROWTH
IN HGM LAST 10
CONSEC. QUARTERSHSD+

Balanced approach to deliver long-term value to shareholders
Great start at Cepheid, expected to add ~100 bps of annual
organic growth for the platform
DBS accelerating new product innovation and improved
growth trajectory
Commercial execution continuing to improve organic growth
and driving penetration in High Growth Markets
Summary


SUMMARY & OUTLOOK
Tom Joyce, President & CEO
2017 INVESTOR & ANALYST DAY
Balanced approach to deliver long-term value to shareholders
What You Heard Today
Solid 2017 performance with momentum building as we
head into 2018
Continue to strategically build a better, stronger Danaher –
but with significant growth and margin runway ahead
Enhancing our competitive advantage through the evolution
of the Danaher Business System

Core revenue growth of 3.5-4.0%, accelerating from 2017 levels, with ~35% fall-through
• Cepheid & Phenomenex now part of core growth
• Expect improved core growth performance at Pall & Water Quality
F/X tailwind of ~$200M in revenue and ~$0.04 in adjusted EPS
Tax rate of ~21%, consistent with 2017
Anticipated EPS seasonality (as a % of FY 2018 adjusted EPS guidance)
• Q1: ~21% Q2: ~25% Q3: ~24% Q4: ~30%
2018 Outlook
2018 adjusted EPS guidance of $4.25-4.35* *Does not include accretion from any future acquisitions

5 Year Adjusted EPS Summary
Low-teens adjusted EPS CAGR from 2014 – 2018E
2014 2015 2016 2017E 2018E*
$2.98
$3.96 - $4.00$3.61
$2.66
$4.25 - $4.35
*Does not include accretion
from any future acquisitions


NON-GAAP RECONCILIATIONS
2017 INVESTOR & ANALYST DAY

Non-GAAP Reconciliations
($ in Millions)
Life Sciences Diagnostics Dental EASCorporate
Office
Total
Danaher
Operating Profit (GAAP) 680.0$ 554.9$ 301.4$ 666.0$ (127.2)$ 2,075.1$
Depreciation 88.6 271.8 29.7 31.6 5.6 427.3
Amortization 229.9 160.2 61.0 41.8 0.0 492.9
Adjusted EBITDA (Non-GAAP) (1) 998.5$ 986.9$ 392.1$ 739.4$ (121.6)$ 2,995.3$
Interest, net (115.3)
Income Taxes (346.6)
Depreciation (427.3)
Amortization (492.9)
Net Income Continuing Ops (GAAP) 1,613.2$
Net Sales 4,085.0$ 4,216.0$ 2,052.1$ 2,890.9$ 13,244.0$
Adjusted EBITDA Margin (Non-GAAP) (1) ≈25% >20% ≈20% >25% >20%
Nine-Month Period Ended September 29, 2017
(1) Management defines "Adjusted EBITDA" as GAAP operating income for the segment excluding (1) depreciation and (2) amortization, and
defines "Adjusted EBITDA Margin" as Adjusted EBITDA divided by sales for the particular segment.

Non-GAAP Reconciliations
($ in Billions)
Free Cash Flow from Continuing Operations: 2014 2015 2016
Operating Cash Flows from Continuing Operations (GAAP) 2.7$ 2.8$ 3.1$
Less: purchases of property, plant & equipment (capital expenditures) from continuing operations
(GAAP) (0.5) (0.5) (0.6)
Plus: proceeds from sale of property, plant & equipment (capital disposals) from continuing
operations (GAAP) 0.0 0.1 0.0
Free Cash Flow from Continuing Operations (Non-GAAP) 2.2$ 2.4$ 2.5$
Adjusted Net Earnings from Continuing Operations: 2014 2015 2016
1.6$ 1.7$ 2.2$
Pretax amortization of acquisition-related intangible assets 0.3 A 0.4 A 0.6 A
Pretax charge for early extinguishment of borrowings - - 0.2 B
Pretax acquisition-related transaction costs deemed significant, change in control payments,
restructuring costs and fair value adjustments to inventory and deferred revenue
- 0.2 C 0.1 D
Pretax gain on sales of marketable equity securities (0.1) E - -
Pretax gain on sales of investments - - (0.2) F
Tax effect of all adjustments reflected above - (0.1) G (0.3) G
Discrete tax adjustments and other tax-related adjustments 0.1 H (0.1) H (0.1) H
1.9$ 2.1$ 2.5$
Net Earnings from Continuing Operations (GAAP)
Adjusted Net Earnings from Continuing Operations (Non-GAAP)
Years Ended December 31

Non-GAAP Reconciliations
Ratio of Free Cash Flow to Adjusted Net Earnings from Continuing Operations ($ in
billions): 2014 2015 2016
2014 - 2016
Average
(rounded to
nearest 5%)
Free Cash Flow from Continuing Operations (Non-GAAP) 2.2$ 2.4$ 2.5$
Adjusted Net Earnings from Continuing Operations (Non-GAAP) 1.9 2.1 2.5
Free Cash Flow from Continuing Operations to Adjusted Net Earnings from Continuing Operations
Conversion Ratio (Non-GAAP) ~115% ~110% ~100% >100%
We define free cash flow as operating cash flows from continuing operations, less payments for purchases of property, plant and equipment from continuing
operations (“capital expenditures”) plus the proceeds from the sale of plant, property and equipment from continuing operations (“capital disposals”).

Non-GAAP Reconciliations
Adjusted Net Earnings from Continuing Operations Notes
A
2014 2015 2016
Pretax $ 0.3 $ 0.4 $ 0.6
After-tax 0.2 0.3 0.4
B
C
Amortization of acquisition-related intangible assets in the following historical periods ($ in billions) (only the pretax amounts set forth
below are reflected in the amortization line item above):
Years Ended December 31
Charge for early extinguishment of borrowings ($0.2 billion pretax as presented in this line item, $0.1 billion after-tax) incurred in the third
quarter of 2016. The Company did not incur any charges related to the early extinguishment of borrowings in 2014 or 2015, and therefore
no such elimination item is reflected in the calculation of Adjusted Net Earnings From Continuing Operations for any other period
presented.
Fair value adjustments to inventory ($0.02 billion pretax as presented in this line item, $0.02 billion after-tax) incurred in the year ended
December 31, 2015, in connection with the acquisition of Nobel Biocare. Acquisition-related transaction costs deemed significant ($0.02
billion pretax as presented in this line item, $0.02 billion after-tax), change in control payments, and fair value adjustments to inventory
and deferred revenue, net of the impact of freezing pension benefits, in each case related primarily to the acquisition of Pall Corporation
and incurred in the year ended December 31, 2015 ($0.1 billion pretax as presented in this line item, $0.08 billion after-tax). The Company
deems acquisition-related transaction costs incurred in a given period to be significant (generally relating to the Company's larger
acquisitions) if it determines that such costs exceed the range of acquisition-related transaction costs typical for the Company in a given
period.
D
E
F
G
H
Gain on sales of investments in the year ended December 31, 2016 ($0.2 billion pretax as presented in this line item, $0.1 billion after-tax).
This line item reflects the aggregate tax effect of all nontax adjustments reflected in the table above. In addition, the footnotes above
indicate the after-tax amount of each individual adjustment item. Danaher estimates the tax effect of the adjustment items identified in
the reconciliation schedule above by applying Danaher's overall estimated effective tax rate to the pretax amount, unless the nature of
the item and/or the tax jurisdiction in which the item has been recorded requires application of a specific tax rate or tax treatment, in
which case the tax effect of such item is estimated by applying such specific tax rate or tax treatment.
For 2014, discrete income tax charges net of discrete income tax gains and benefits from a lower than expected effective tax rate
(compared to the anticipated 2014 effective tax rate publicly communicated in December 2013), due primarily to year-end tax law
changes for the year ended December 31, 2014. For 2015, discrete income tax gains net of discrete income tax charges ($0.1 billion)
incurred in the year ended December 31, 2015. For 2016, discrete income tax gains net of discrete income tax charges and Fortive
separation-related tax costs related to repatriation of earnings and legal entity realignments incurred in the year ended December 31,
2016 ($0.1 billion).
Acquisition-related transaction costs deemed significant ($0.01 billion pretax as presented in this line item, $0.01 billion after-tax), change
in control payments and restructuring costs ($0.05 billion pretax as presented in this line item, $0.03 billion after-tax), and fair value
adjustments to inventory and deferred revenue ($0.02 billion pretax as presented in this line item, $0.01 billion after-tax), in each case
related primarily to the acquisition of Cepheid and incurred in the year ended December 31, 2016.
Gain on sales of marketable equity securities in the year ended December 31, 2014 ($0.1 billion pretax is presented in this line item, $0.08
billion after-tax).

Non-GAAP Reconciliations
Adjusted Forecasted Diluted Net Earnings Per Share from Continuing Operations
Low End of
Guidance Range
High End of
Guidance
Range
3.50$ 3.60$
Pretax amortization of acquisition-related intangible assets 0.95 A 0.95 A
Tax effect of all adjustments reflected above (0.20) B (0.20) B
4.25$ 4.35$
1
Year Ending December 31, 2018
Forecasted Diluted Net Earnings Per Share from Continuing Operations
(GAAP) 1
Forecasted Adjusted Diluted Net Earnings Per Share from Continuing
Operations (Non-GAAP) 1
The forward-looking estimates set forth above do not reflect future gains and charges that are inherently difficult to
predict and estimate due to their unknown timing, effect and/or significance, such as certain future gains or losses on
the sale of investments, acquisition or divestiture-related gains or charges and discrete tax items.

Non-GAAP Reconciliations
Adjusted Forecasted Diluted Net Earnings Per Share from Continuing Operations Notes
A
Year Ending
December 31,
2018 E
Pretax $ 671
After-tax 530
B
Amortization of acquisition-related intangible assets as quantified below ($ in millions) (only the pretax amounts set forth below are
reflected in the amortization line item above):
This line item reflects the aggregate tax effect of all nontax adjustments reflected in the table above. In addition, the footnote above
indicates the after-tax amount of each individual adjustment item. Danaher estimates the tax effect of the adjustment items identified in
the reconciliation schedule above by applying Danaher's overall estimated effective tax rate to the pretax amount, unless the nature of
the item and/or the tax jurisdiction in which the item has been recorded requires application of a specific tax rate or tax treatment, in
which case the tax effect of such item is estimated by applying such specific tax rate or tax treatment.