Environmental Uncertainties
20
Research and Operations Marine Optical Buoy Design Review July 18-19, Plan for calibration and maintenance of AHAB Uncertainty Budget: Environmental Components Ken Voss University of Miami
-
Upload
francis-alvarez -
Category
Documents
-
view
42 -
download
3
description
Plan for calibration and maintenance of AHAB Uncertainty Budget: Environmental Components Ken Voss University of Miami. Environmental Uncertainties. Variability in downwelling light field during measurement time Wave focusing BRDF effects in Satellite matchups Instrument self-shading - PowerPoint PPT Presentation
Transcript of Environmental Uncertainties
NOAA Research and Operations Marine Optical Buoy Design Review July 18-19, 2006
Plan for calibration and maintenance of AHAB
Uncertainty Budget: Environmental Components
Ken VossUniversity of Miami
NOAA Research and Operations Marine Optical Buoy Design Review July 18-19, 2006
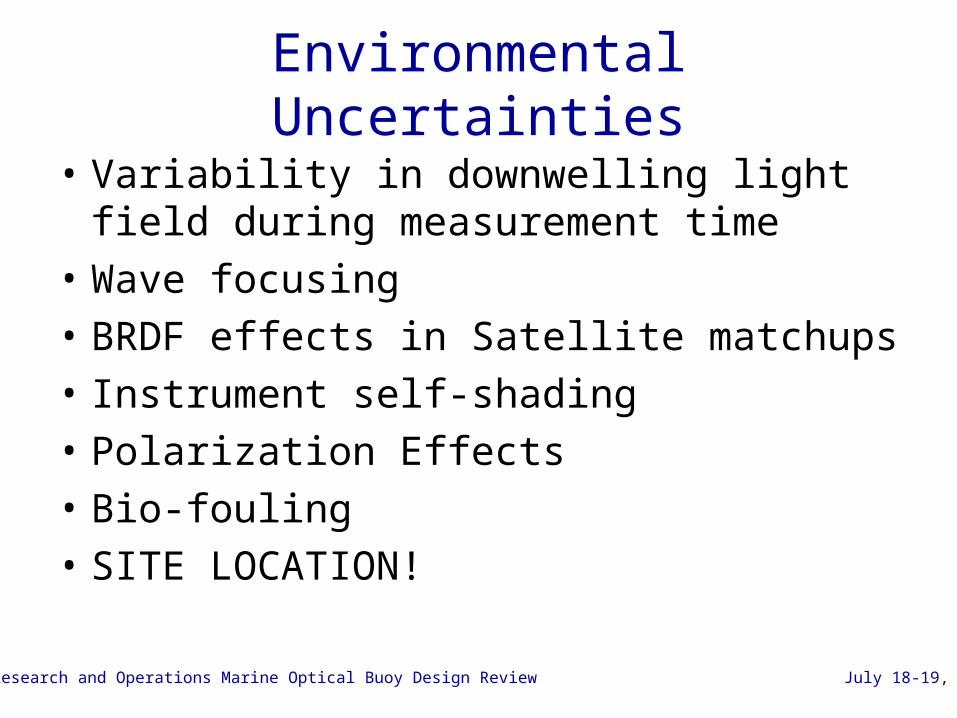
Environmental Uncertainties
• Variability in downwelling light field during measurement time
• Wave focusing
• BRDF effects in Satellite matchups
• Instrument self-shading
• Polarization Effects
• Bio-fouling
• SITE LOCATION!
NOAA Research and Operations Marine Optical Buoy Design Review July 18-19, 2006
Variability in downwelling light field
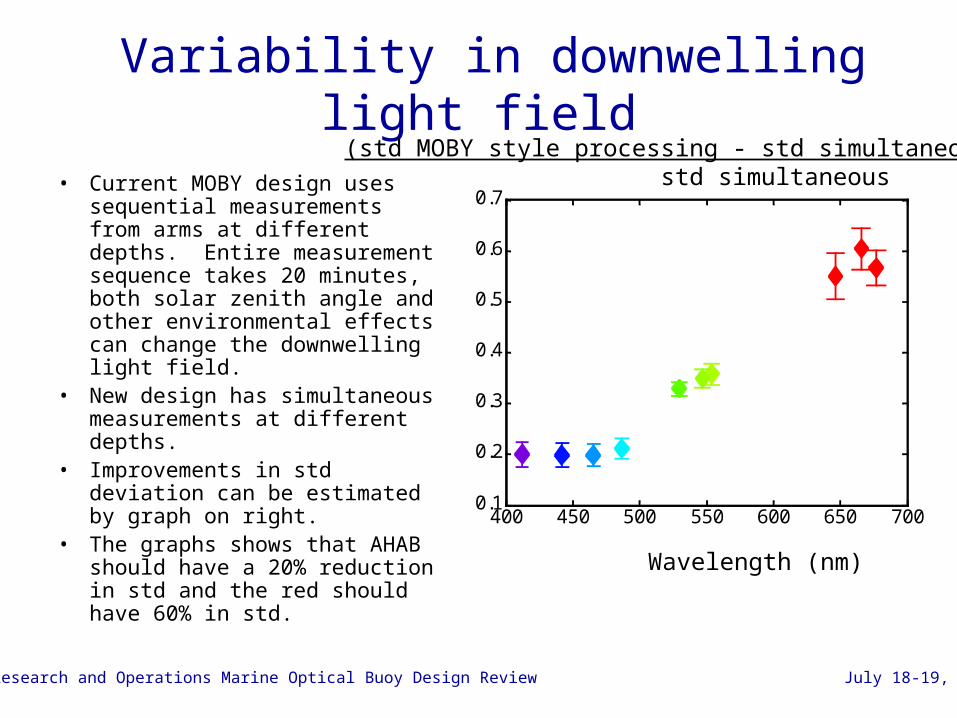
• Current MOBY design uses sequential measurements from arms at different depths. Entire measurement sequence takes 20 minutes, both solar zenith angle and other environmental effects can change the downwelling light field.
• New design has simultaneous measurements at different depths.
• Improvements in std deviation can be estimated by graph on right.
• The graphs shows that AHAB should have a 20% reduction in std and the red should have 60% in std.
400 450 500 550 600 650 7000.1
0.2
0.3
0.4
0.5
0.6
0.7
Wavelength (nm)Change in std (MOBY- ANDOR)/MOBY
All 4 Station 4 data sets
Wavelength (nm)
(std MOBY style processing - std simultaneous) std simultaneous
NOAA Research and Operations Marine Optical Buoy Design Review July 18-19, 2006
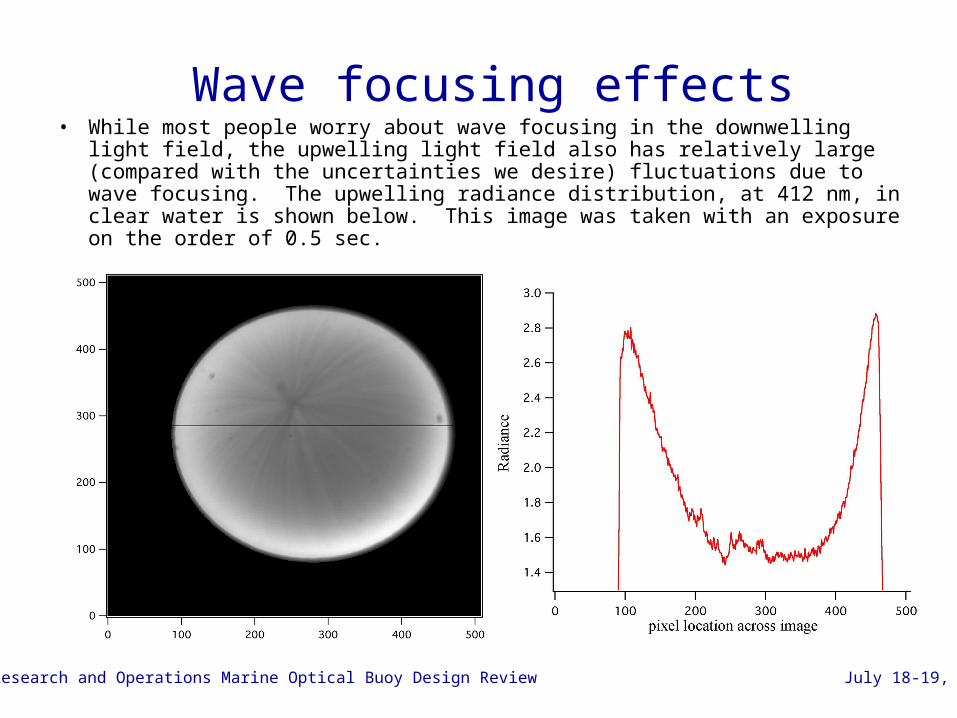
Wave focusing effects• While most people worry about wave focusing in the downwelling light field, the
upwelling light field also has relatively large (compared with the uncertainties we desire) fluctuations due to wave focusing. The upwelling radiance distribution, at 412 nm, in clear water is shown below. This image was taken with an exposure on the order of 0.5 sec.
NOAA Research and Operations Marine Optical Buoy Design Review July 18-19, 2006
Averaging over wave focusing events
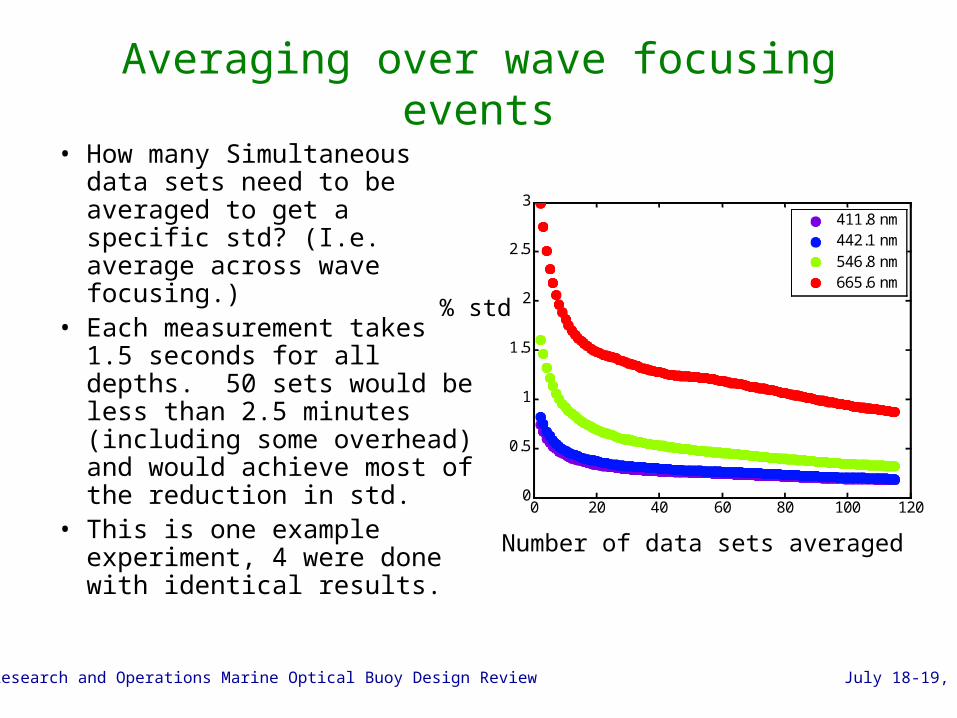
• How many Simultaneous data sets need to be averaged to get a specific std? (I.e. average across wave focusing.)
• Each measurement takes 1.5 seconds for all depths. 50 sets would be less than 2.5 minutes (including some overhead) and would achieve most of the reduction in std.
• This is one example experiment, 4 were done with identical results.
0 20 40 60 80 100 1200
0.5
1
1.5
2
2.5
3
Number of Sets Averaged
% Standard deviation of the mean
411.8 nm442.1 nm546.8 nm665.6 nm
Number of data sets averaged
% std
NOAA Research and Operations Marine Optical Buoy Design Review July 18-19, 2006
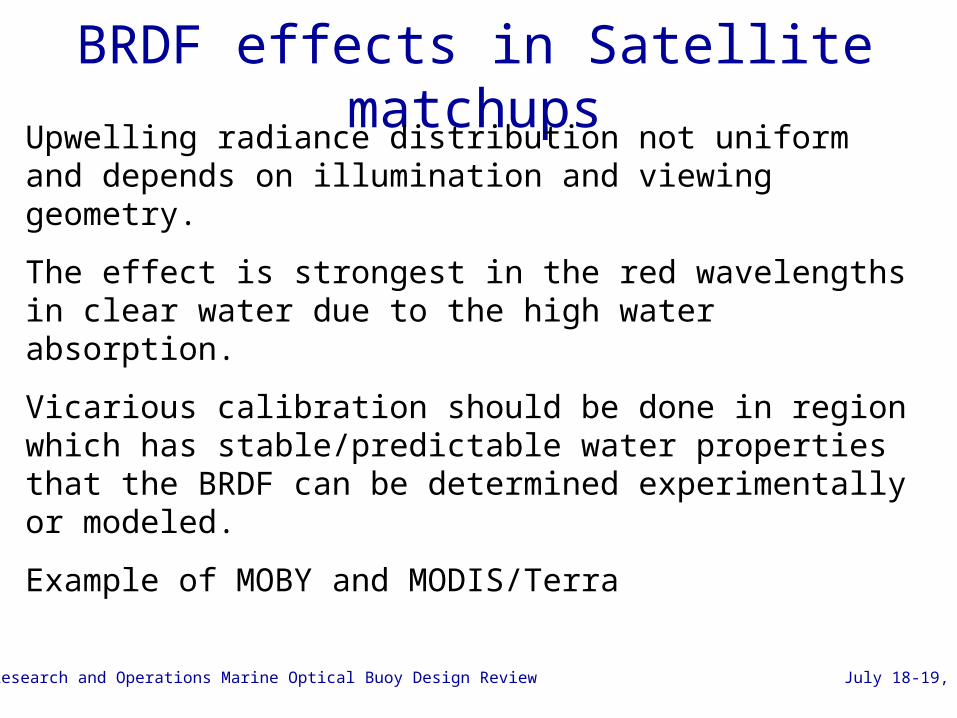
BRDF effects in Satellite matchupsUpwelling radiance distribution not uniform and depends on illumination and viewing geometry.
The effect is strongest in the red wavelengths in clear water due to the high water absorption.
Vicarious calibration should be done in region which has stable/predictable water properties that the BRDF can be determined experimentally or modeled.
Example of MOBY and MODIS/Terra
NOAA Research and Operations Marine Optical Buoy Design Review July 18-19, 2006
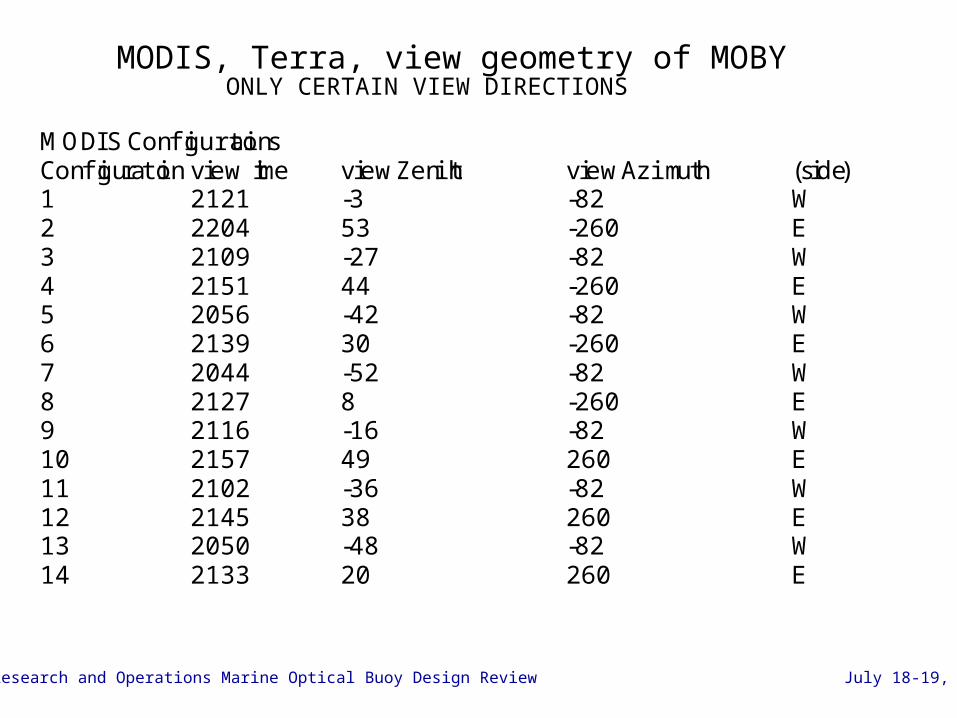
MODIS, Terra, view geometry of MOBY
MODIS ConfigurationsConfiguration view time view Zenith view Azimuth (side)1 2121 -3 -82 W2 2204 53 -260 E3 2109 -27 -82 W4 2151 44 -260 E5 2056 -42 -82 W6 2139 30 -260 E7 2044 -52 -82 W8 2127 8 -260 E9 2116 -16 -82 W10 2157 49 260 E11 2102 -36 -82 W12 2145 38 260 E13 2050 -48 -82 W14 2133 20 260 E
ONLY CERTAIN VIEW DIRECTIONS
NOAA Research and Operations Marine Optical Buoy Design Review July 18-19, 2006
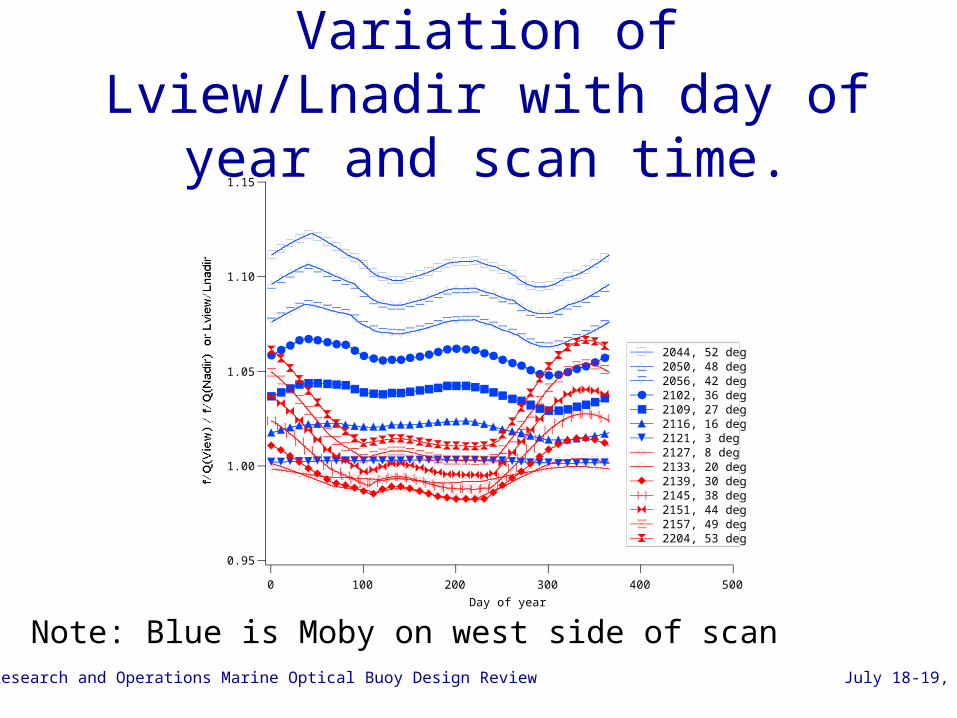
Variation of Lview/Lnadir with day of year and scan time.
1.15
1.10
1.05
1.00
0.95
f/Q(View) / f/Q(Nadir) or Lview/Lnadir
5004003002001000
Day of year
2044, 52 deg 2050, 48 deg 2056, 42 deg 2102, 36 deg 2109, 27 deg 2116, 16 deg 2121, 3 deg 2127, 8 deg 2133, 20 deg 2139, 30 deg 2145, 38 deg 2151, 44 deg 2157, 49 deg 2204, 53 deg
Note: Blue is Moby on west side of scan
NOAA Research and Operations Marine Optical Buoy Design Review July 18-19, 2006
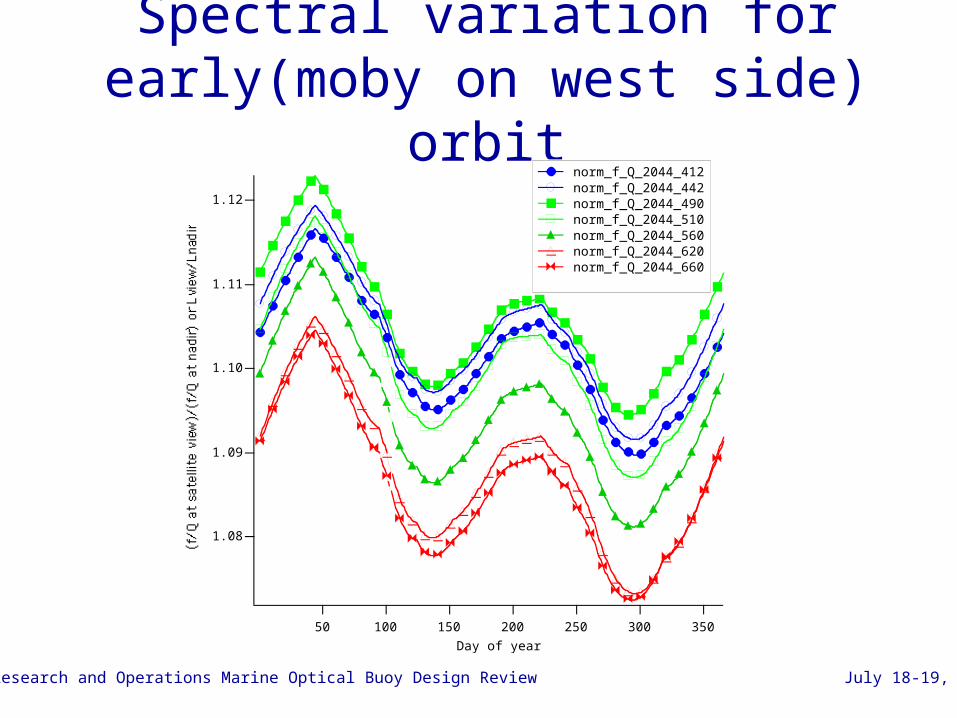
Spectral variation for early(moby on west side) orbit
1.12
1.11
1.10
1.09
1.08
(f/Q at satellite view)/(f/Q at nadir) or Lview/Lnadir
35030025020015010050
Day of year
norm_f_Q_2044_412 norm_f_Q_2044_442 norm_f_Q_2044_490 norm_f_Q_2044_510 norm_f_Q_2044_560 norm_f_Q_2044_620 norm_f_Q_2044_660
NOAA Research and Operations Marine Optical Buoy Design Review July 18-19, 2006
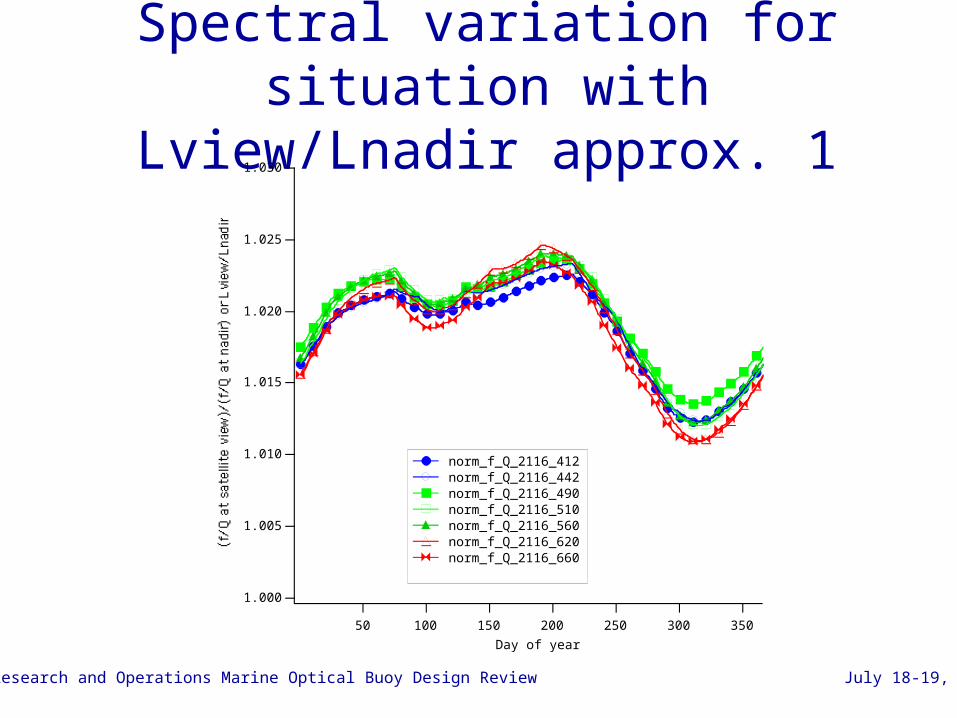
Spectral variation for situation with Lview/Lnadir approx. 1
1.030
1.025
1.020
1.015
1.010
1.005
1.000
(f/Q at satellite view)/(f/Q at nadir) or Lview/Lnadir
35030025020015010050
Day of year
norm_f_Q_2116_412 norm_f_Q_2116_442 norm_f_Q_2116_490 norm_f_Q_2116_510 norm_f_Q_2116_560 norm_f_Q_2116_620 norm_f_Q_2116_660
NOAA Research and Operations Marine Optical Buoy Design Review July 18-19, 2006
BRDF conclusion
NEED BRDF MODEL for ViCal site! Nothing you can do with the design to get around this.
NOAA Research and Operations Marine Optical Buoy Design Review July 18-19, 2006
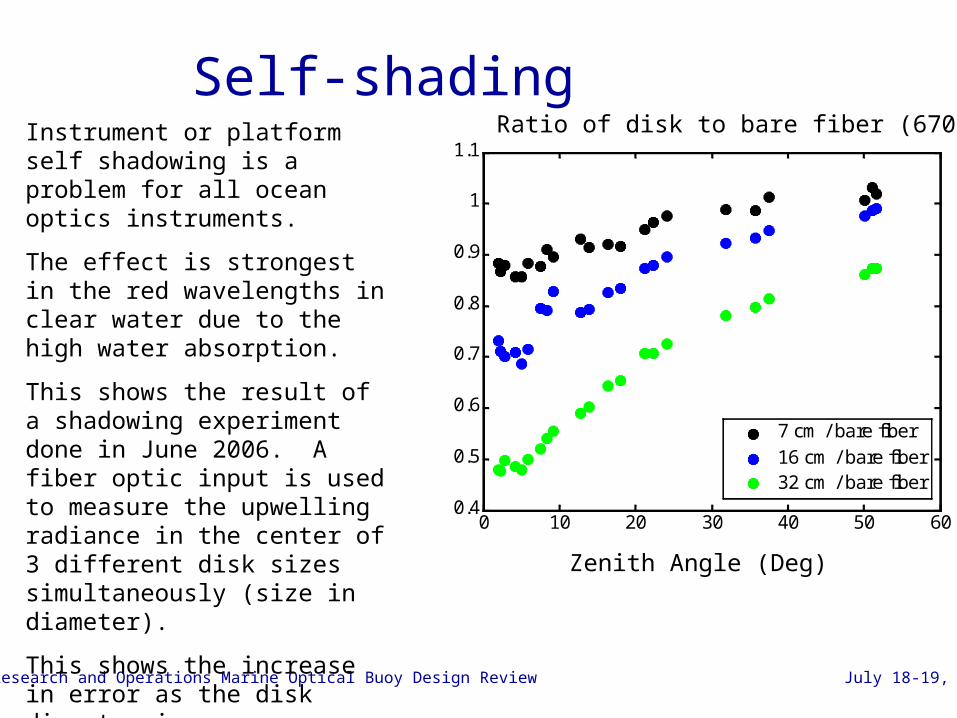
Self-shadingInstrument or platform self shadowing is a problem for all ocean optics instruments.
The effect is strongest in the red wavelengths in clear water due to the high water absorption.
This shows the result of a shadowing experiment done in June 2006. A fiber optic input is used to measure the upwelling radiance in the center of 3 different disk sizes simultaneously (size in diameter).
This shows the increase in error as the disk diameter increases or solar zenith angle decreases (sun more directly overhead) as predicted by Gordon and Ding.
0 10 20 30 40 50 600.4
0.5
0.6
0.7
0.8
0.9
1
1.1
Zenith Angle (deg)
Ratio of disk to bare Fiber for 670 nm
7 cm / bare fiber16 cm / bare fiber32 cm / bare fiber
Ratio of disk to bare fiber (670 nm)
Zenith Angle (Deg)
NOAA Research and Operations Marine Optical Buoy Design Review July 18-19, 2006
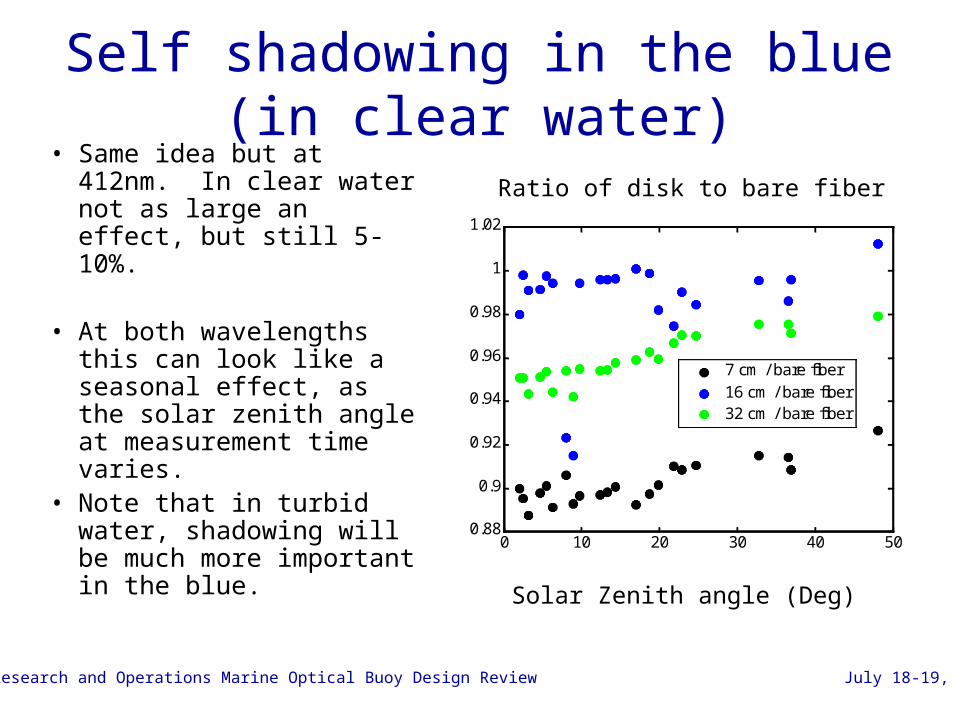
Self shadowing in the blue (in clear water)
• Same idea but at 412nm. In clear water not as large an effect, but still 5-10%.
• At both wavelengths this can look like a seasonal effect, as the solar zenith angle at measurement time varies.
• Note that in turbid water, shadowing will be much more important in the blue.
0 10 20 30 40 500.88
0.9
0.92
0.94
0.96
0.98
1
1.02
Zenith Angle (deg)
Ratio of disk to bare Fiber for 412 nm
7 cm / bare fiber16 cm / bare fiber32 cm / bare fiber
Solar Zenith angle (Deg)
Ratio of disk to bare fiber

NOAA Research and Operations Marine Optical Buoy Design Review July 18-19, 2006
Self shadowing in the blue (in clear water)
• Same idea but at 412nm. In clear water not as large an effect, but still 5-10%.
• At both wavelengths this can look like a seasonal effect, as the solar zenith angle at measurement time varies.
• Note that in turbid water, shadowing will be much more important in the blue.
0 10 20 30 40 500.88
0.9
0.92
0.94
0.96
0.98
1
1.02
Zenith Angle (deg)
Ratio of disk to bare Fiber for 412 nm
7 cm / bare fiber16 cm / bare fiber32 cm / bare fiber
Solar Zenith angle (Deg)
Ratio of disk to bare fiber
NOAA Research and Operations Marine Optical Buoy Design Review July 18-19, 2006
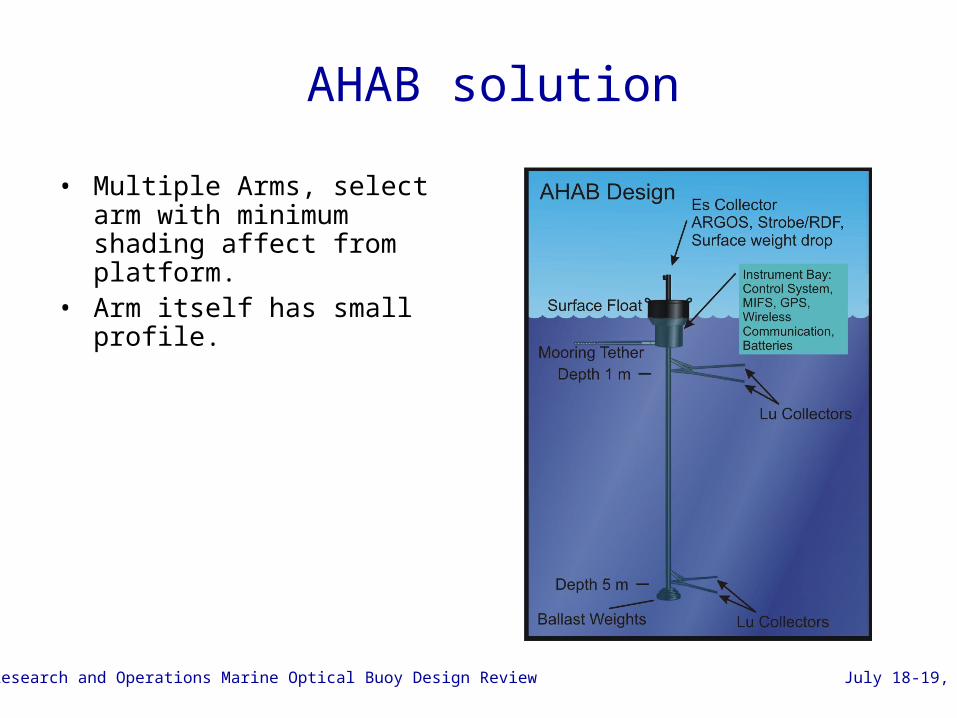
AHAB solution
• Multiple Arms, select arm with minimum shading affect from platform.
• Arm itself has small profile.
NOAA Research and Operations Marine Optical Buoy Design Review July 18-19, 2006
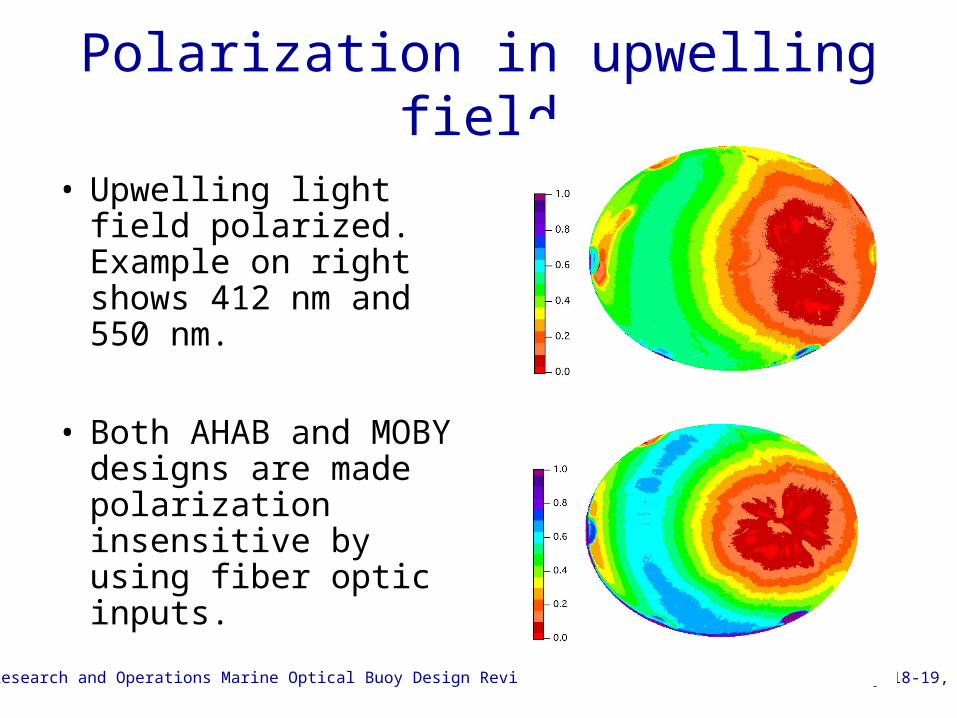
Polarization in upwelling field
• Upwelling light field polarized. Example on right shows 412 nm and 550 nm.
• Both AHAB and MOBY designs are made polarization insensitive by using fiber optic inputs.
NOAA Research and Operations Marine Optical Buoy Design Review July 18-19, 2006
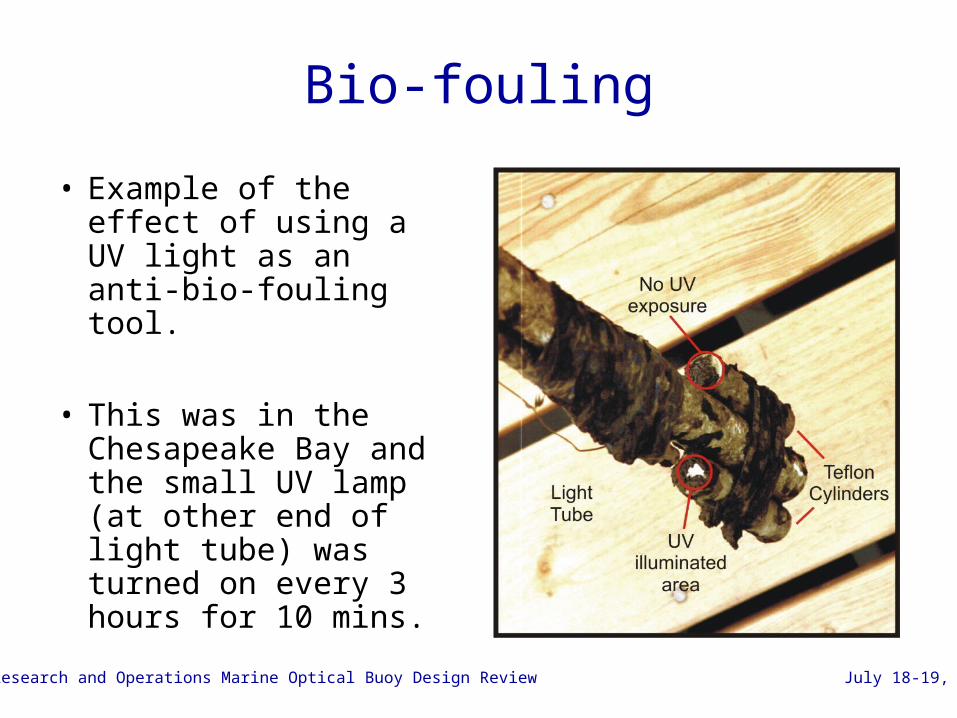
Bio-fouling
• Example of the effect of using a UV light as an anti-bio-fouling tool.
• This was in the Chesapeake Bay and the small UV lamp (at other end of light tube) was turned on every 3 hours for 10 mins.
NOAA Research and Operations Marine Optical Buoy Design Review July 18-19, 2006
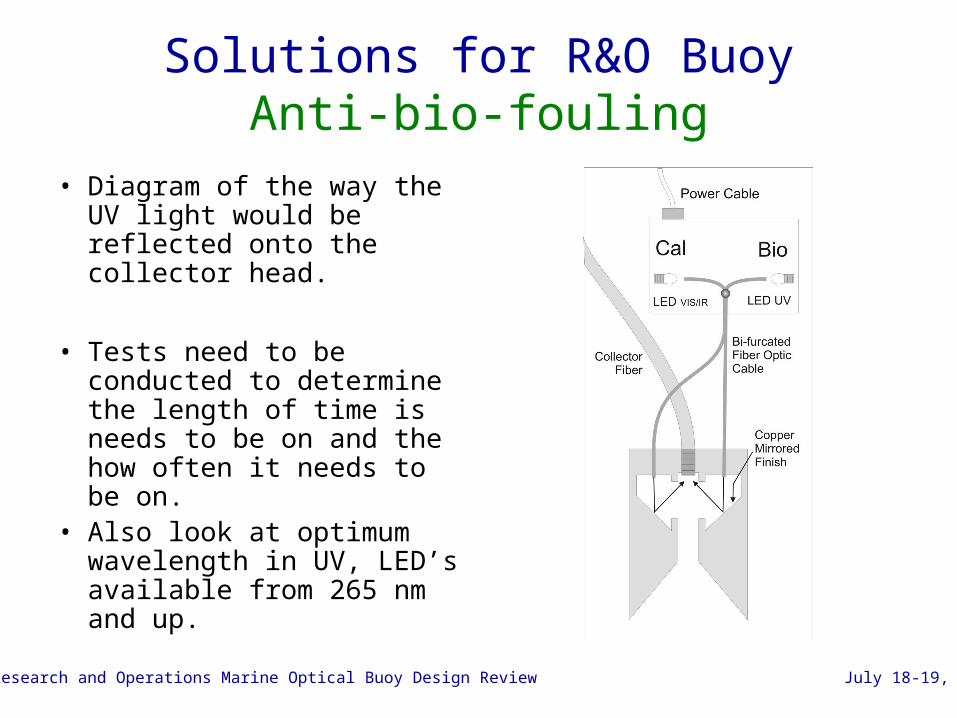
Solutions for R&O BuoyAnti-bio-fouling
• Diagram of the way the UV light would be reflected onto the collector head.
• Tests need to be conducted to determine the length of time is needs to be on and the how often it needs to be on.
• Also look at optimum wavelength in UV, LED’s available from 265 nm and up.
NOAA Research and Operations Marine Optical Buoy Design Review July 18-19, 2006
Site Location for ViCal• Want the least stressful, most accurate, frequent satellite
retrieval of nLw– Deep site (no bottom effects to stress atm. Corr)[Hi good]– Spatially and temporally homogeneous[Hi good]
• Enable good matchups easily, particularly with necessary scale mismatch
– Clear, non-absorbing atmosphere[Hi good most of the time]• Easy Atm. Corr with errors minimized in final nLw
– Large nLw signal relative to atmosphere• Points to blue rich site: clear water
– Good frequency of clear weather[Hi relatively good]• Want as many possible matchups as possible
– Satellite overpass fairly near Nadir[Hi as good as any for polar orbiter]
Hi not as good as some spots for MODIS because of glitter
NOAA Research and Operations Marine Optical Buoy Design Review July 18-19, 2006
R&O BuoyTechnical Modifications to reduce effects
of Environmental uncertainties• Simultaneous multi-arm observations, also
shortens measurement time and allows more measurements to be averaged.
• Two arms at each depth to help with platform self shading.
• Fiber optic inputs act as polarization scramblers.
• UV LEDs for anti-bio-fouling