2017 Annual Report - Nutrien...and balance sheet of Nutrien is provided on pages 40 and 42,...
131
2017 Annual Report
Transcript of 2017 Annual Report - Nutrien...and balance sheet of Nutrien is provided on pages 40 and 42,...

2017 Annual Report
Contents
Management’s Discussion & Analysis
Financial & Operational Highlights 1
Business & Operating Environment 2
Strategic Performance 6
Nutrient Performance
Industry 10
Potash 11
Nitrogen 16
Phosphate 20
2017 Earnings per Share 24
Other Expenses and Income 25
Other Non-Financial Information 27
Quarterly Results 28
Financial Condition Review 30
Liquidity and Capital Resources 31
Capital Structure and Management 34
Other Financial Information 36
Controls and Procedures 37
2018 Nutrien Guidance 38
Nutrien Pro Forma Earnings and Balance Sheet 39
Forward-Looking Statements 44
Non-IFRS Financial Measures in MD&A 45
11 Year Data 46
Financials & Notes 54
Other Information
Appendix 128
Terms and Measures 129
To learn more, watch for the following icons:
a Annual Information Form
F Financial Statements
Financial data in this report are stated in US dollars unless
otherwise noted.
Management’s Discussion & Analysisof Financial Conditions and Results of Operations (in US dollars)
On January 1, 2018, PotashCorp and Agrium completed a merger of
equals creating the world’s largest provider of crop inputs and
services (the “Merger”). The new company, Nutrien Ltd. (“Nutrien”),
will play a critical role in helping growers increase food production in
a sustainable manner.
This report primarily focuses on PotashCorp’s historical results and
includes certain information on Nutrien, including Nutrien financial
guidance and certain pro forma financial information.
The following discussion and analysis is the responsibility of management and is as of February 20, 2018. The Board of Directors of PotashCorp
carries out its responsibility for review of this disclosure principally through its audit committee, comprised exclusively of independent directors. The
audit committee reviews this disclosure and recommends its approval by the Board of Directors. The term “PCS” refers to Potash Corporation of
Saskatchewan Inc. and the terms “we,” “us,” “our,” “PotashCorp” and “the company” refer to PCS and, as applicable, PCS and its direct and indirect
subsidiaries as a group. Additional information relating to PotashCorp (which is not incorporated by reference herein) can be found in our regulatory
filings on SEDAR at www.sedar.com and on EDGAR at www.sec.gov.
All references to per-share amounts pertain to diluted net income per share (EPS) as described in Note 9 to the consolidated financial statements.
As a foreign private issuer, beginning January 1, 2018, we changed from an SEC voluntary filer on Form 10-K to an SEC filer on Form 40-F to align with
the Nutrien expected filing format. Readers are directed to the company’s Annual Information Form, including the discussion of risk factors therein,
for more information.
PotashCorp applies International Financial Reporting Standards as issued by the International Accounting Standards Board (IFRS). PotashCorp is
considered the acquirer and continuing reporting entity for accounting purposes resulting from the Merger and, as a result, the financial statements
and related notes of Nutrien for 2017 and prior will reflect the operations of PotashCorp. Readers are cautioned that the historical financial results
herein are of PotashCorp only and they are not indicative of the expected future operating performance of Nutrien. A pro forma statement of earnings
and balance sheet of Nutrien is provided on pages 40 and 42, respectively.
For a description of risk factors that may affect the company, see “Risk Factors” in our most recent Annual Information Form on file with the SEC and
Canadian provincial securities regulatory authorities. Also see the cautionary statement on forward-looking information on Page 44.
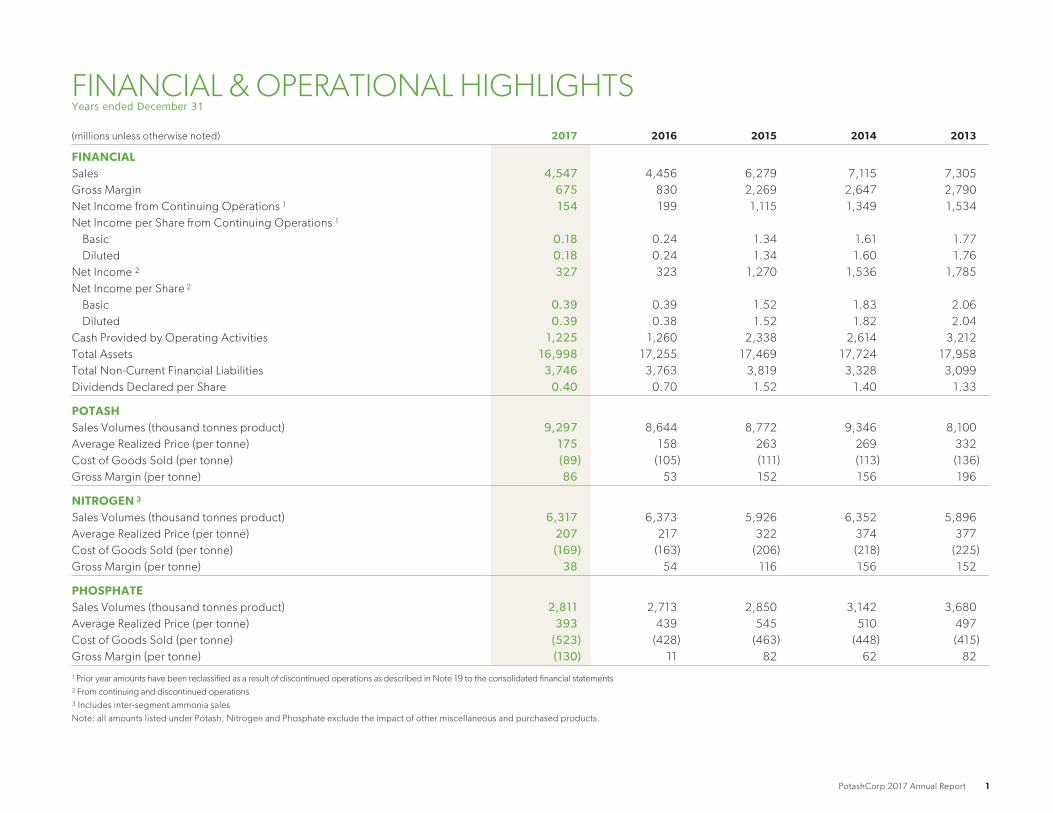
FINANCIAL & OPERATIONAL HIGHLIGHTSYears ended December 31
(millions unless otherwise noted) 2017 2016 2015 2014 2013
FINANCIALSales 4,547 4,456 6,279 7,115 7,305
Gross Margin 675 830 2,269 2,647 2,790
Net Income from Continuing Operations 1 154 199 1,115 1,349 1,534
Net Income per Share from Continuing Operations 1
Basic 0.18 0.24 1.34 1.61 1.77
Diluted 0.18 0.24 1.34 1.60 1.76
Net Income 2 327 323 1,270 1,536 1,785
Net Income per Share 2
Basic 0.39 0.39 1.52 1.83 2.06
Diluted 0.39 0.38 1.52 1.82 2.04
Cash Provided by Operating Activities 1,225 1,260 2,338 2,614 3,212
Total Assets 16,998 17,255 17,469 17,724 17,958
Total Non-Current Financial Liabilities 3,746 3,763 3,819 3,328 3,099
Dividends Declared per Share 0.40 0.70 1.52 1.40 1.33
POTASHSales Volumes (thousand tonnes product) 9,297 8,644 8,772 9,346 8,100
Average Realized Price (per tonne) 175 158 263 269 332
Cost of Goods Sold (per tonne) (89) (105) (111) (113) (136)
Gross Margin (per tonne) 86 53 152 156 196
NITROGEN 3
Sales Volumes (thousand tonnes product) 6,317 6,373 5,926 6,352 5,896
Average Realized Price (per tonne) 207 217 322 374 377
Cost of Goods Sold (per tonne) (169) (163) (206) (218) (225)
Gross Margin (per tonne) 38 54 116 156 152
PHOSPHATESales Volumes (thousand tonnes product) 2,811 2,713 2,850 3,142 3,680
Average Realized Price (per tonne) 393 439 545 510 497
Cost of Goods Sold (per tonne) (523) (428) (463) (448) (415)
Gross Margin (per tonne) (130) 11 82 62 82
1 Prior year amounts have been reclassified as a result of discontinued operations as described in Note 19 to the consolidated financial statements
2 From continuing and discontinued operations
3 Includes inter-segment ammonia sales
Note: all amounts listed under Potash, Nitrogen and Phosphate exclude the impact of other miscellaneous and purchased products.
PotashCorp 2017 Annual Report 1
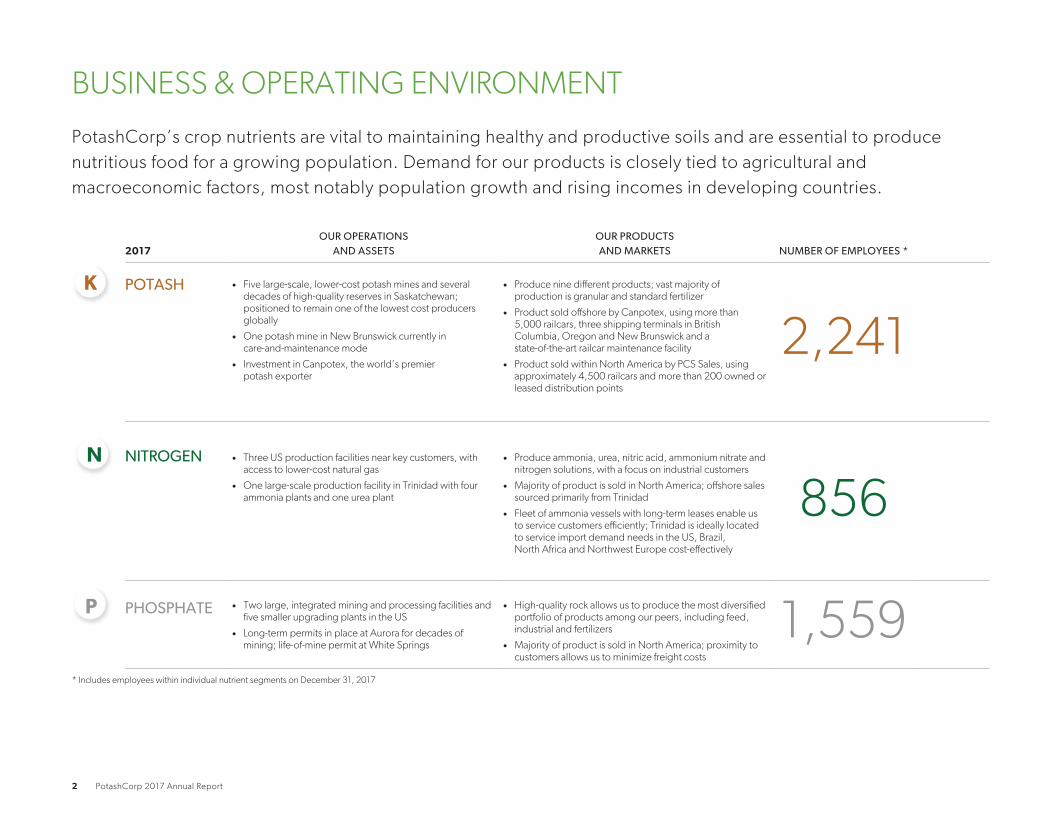
BUSINESS & OPERATING ENVIRONMENT
PotashCorp’s crop nutrients are vital to maintaining healthy and productive soils and are essential to produce
nutritious food for a growing population. Demand for our products is closely tied to agricultural and
macroeconomic factors, most notably population growth and rising incomes in developing countries.
2017OUR OPERATIONS
AND ASSETSOUR PRODUCTSAND MARKETS NUMBER OF EMPLOYEES *
K POTASH • Five large-scale, lower-cost potash mines and several
decades of high-quality reserves in Saskatchewan;
positioned to remain one of the lowest cost producers
globally
• One potash mine in New Brunswick currently in
care-and-maintenance mode
• Investment in Canpotex, the world’s premier
potash exporter
• Produce nine different products; vast majority of
production is granular and standard fertilizer
• Product sold offshore by Canpotex, using more than
5,000 railcars, three shipping terminals in British
Columbia, Oregon and New Brunswick and a
state-of-the-art railcar maintenance facility
• Product sold within North America by PCS Sales, using
approximately 4,500 railcars and more than 200 owned or
leased distribution points
2,241
N NITROGEN • Three US production facilities near key customers, with
access to lower-cost natural gas
• One large-scale production facility in Trinidad with four
ammonia plants and one urea plant
• Produce ammonia, urea, nitric acid, ammonium nitrate and
nitrogen solutions, with a focus on industrial customers
• Majority of product is sold in North America; offshore sales
sourced primarily from Trinidad
• Fleet of ammonia vessels with long-term leases enable us
to service customers efficiently; Trinidad is ideally located
to service import demand needs in the US, Brazil,
North Africa and Northwest Europe cost-effectively
856
P PHOSPHATE • Two large, integrated mining and processing facilities and
five smaller upgrading plants in the US
• Long-term permits in place at Aurora for decades of
mining; life-of-mine permit at White Springs
• High-quality rock allows us to produce the most diversified
portfolio of products among our peers, including feed,
industrial and fertilizers
• Majority of product is sold in North America; proximity to
customers allows us to minimize freight costs
1,559* Includes employees within individual nutrient segments on December 31, 2017
2 PotashCorp 2017 Annual Report

POTASH OPERATING ENVIRONMENT
USES NUMBER OF MAJOR PRODUCING COUNTRIES*
FertilizerImproves root and stem strength, water
utilization and disease resistance; enhances
taste, color and texture of food
FeedAids in animal growth and
milk production
IndustrialUsed in soaps, water softeners,
de-icers, drilling muds
and food products10
* Countries producing more than 500,000 tonnes annually
INDUSTRY OVERVIEW
Economically mineable depositsare geographically concentrated
Regions that have historically under-appliedpotash expected to drive growth in demand
New capacity requires significant investmentof time and money
• Securing an economically mineable deposit in a
country that has both political stability and available
infrastructure presents significant challenges.
• Producers in Canada and the FSU account for
approximately 40 percent and 30 percent of world
capacity, respectively.
• Crop production requirements and improving soil
fertility practices – particularly in emerging markets
where potash has been under-applied and crop
yields lag – are expected to drive strong growth in
potash demand.
• Economic conditions and government policies in
consuming regions can create variability in growth.
• Entry into the potash business is challenging because
building new capacity is costly and time-consuming.
• Brownfield projects, especially those already
completed, have a significant per-tonne capital cost
advantage over greenfield projects.
Competitive Advantage Competitive Advantage Competitive AdvantageWe have access to decades of high-quality, permitted
potash reserves in a politically stable region with
well-established infrastructure.
Canpotex is well-positioned to efficiently supply its
customers in approximately 40 countries around the world.
With a lower fixed-cost profile, we can cost-effectively adjust
production to respond to variability in demand.
With our expansions completed at a cost well below
that of greenfield, we are the largest potash producer in
the world by capacity, and have a lower-cost growth
platform that is paid for.
PotashCorp 2017 Annual Report 3

NITROGEN OPERATING ENVIRONMENT
USES NUMBER OF MAJOR PRODUCING COUNTRIES
FertilizerEssential for protein synthesis;
speeds plant growth
FeedPlays a key role in animal growth
and development
IndustrialUsed in plastics, resins, adhesives
and emission controls ~65
INDUSTRY OVERVIEW
Lower-cost energy is essential to success Proximity to end markets provides advantages Pricing can be volatile
• Natural gas can make up 70-85 percent of the cash
cost of producing a tonne of ammonia.
• With lower-cost natural gas, North America, Russia,
North Africa and the Middle East are major producing
regions.
• Producers in China and Europe are typically higher-
cost suppliers and play a significant role in determining
global nitrogen prices.
• The need for expensive, specialized transportation
vessels is an obstacle to economical transportation of
ammonia over long distances.
• Global ammonia trade has historically been limited
compared to urea, which can be more easily
transported.
• With natural gas feedstock widely available, the
nitrogen industry is highly fragmented and
regionalized.
• Geopolitical events and the influence of Chinese urea
and Russian ammonia exports can impact global trade.
• These factors typically make nitrogen markets more
volatile than other fertilizer markets.
Competitive Advantage Competitive Advantage Competitive Advantage
Significant supply of lower-priced shale gas provides an
advantaged cost position for our US nitrogen production. In
Trinidad, our gas costs are indexed to Tampa ammonia prices,
sheltering margins.
Our production facilities in the US and Trinidad are well-
positioned to serve the key domestic and international
consuming regions.
We produce a broad range of nitrogen products and
have a relatively stable industrial customer base. Sales to
industrial customers make up almost 60 percent of our
total nitrogen sales volumes.
4 PotashCorp 2017 Annual Report

PHOSPHATE OPERATING ENVIRONMENT
USES NUMBER OF MAJOR PRODUCING COUNTRIES
FertilizerRequired for energy storage and
transfer; speeds crop maturity
FeedAssists in muscle repair and
skeletal development of animals
IndustrialUsed in soft drinks, food additives
and metal treatments ~40
INDUSTRY OVERVIEW
High-quality, lower-cost rock is criticalto long-term success
Raw material cost changesaffect profitability
Changes in global trade impactmarket fundamentals
• Phosphate rock is geographically concentrated:
China, Morocco and the US together produce
approximately 70 percent of the world’s supply.
• Approximately one-third of global producers are
non-integrated and rely on purchased rock; those
with direct access to a high-quality, lower-cost rock
supply have a significant competitive advantage.
• Changing prices for raw material inputs – sulfur and
ammonia – have historically resulted in production
cost volatility.
• Phosphate prices have historically reflected changes
in the costs of these inputs, along with rock costs.
• With limited indigenous rock supply, India is the largest
importer of phosphate in the world, and its demand
can have a significant impact on global markets.
• Increased export supply from Morocco, Saudi Arabia
and China has lowered US exports of solid fertilizers.
• US producers rely more on trade with Latin America
and production of specialty phosphate products.
Competitive Advantage Competitive Advantage Competitive Advantage
We are an integrated producer with access to many years
of high-quality, permitted phosphate reserves.
We sell liquid phosphate fertilizer, feed and industrial
phosphate products that require little to no ammonia as a
raw material input.
We have the most diversified product offering in the
industry with approximately 80 percent of our sales in
North America.
PotashCorp 2017 Annual Report 5
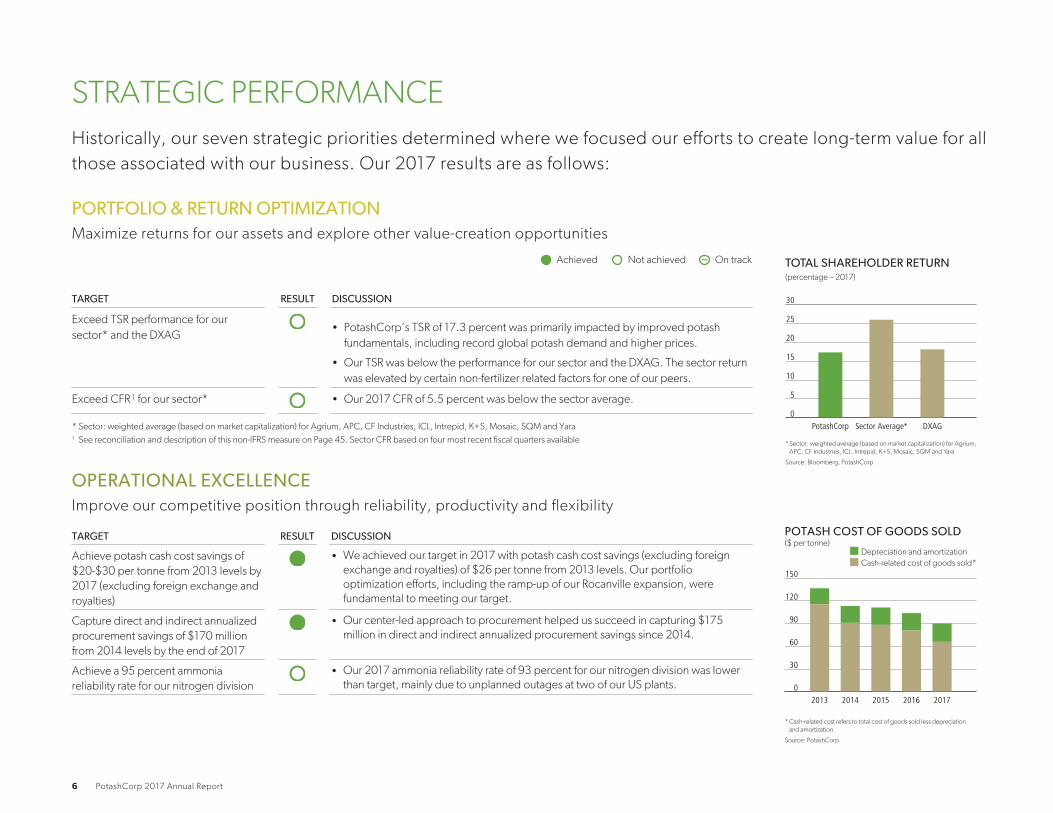
STRATEGIC PERFORMANCE
Historically, our seven strategic priorities determined where we focused our efforts to create long-term value for all
those associated with our business. Our 2017 results are as follows:
PORTFOLIO & RETURN OPTIMIZATIONMaximize returns for our assets and explore other value-creation opportunities
Achieved Not achieved On track
TARGET RESULT DISCUSSION
Exceed TSR performance for our
sector* and the DXAG• PotashCorp’s TSR of 17.3 percent was primarily impacted by improved potash
fundamentals, including record global potash demand and higher prices.
• Our TSR was below the performance for our sector and the DXAG. The sector return
was elevated by certain non-fertilizer related factors for one of our peers.
Exceed CFR 1 for our sector* • Our 2017 CFR of 5.5 percent was below the sector average.
* Sector: weighted average (based on market capitalization) for Agrium, APC, CF Industries, ICL, Intrepid, K+S, Mosaic, SQM and Yara
1 See reconciliation and description of this non-IFRS measure on Page 45. Sector CFR based on four most recent fiscal quarters available
OPERATIONAL EXCELLENCEImprove our competitive position through reliability, productivity and flexibility
TARGET RESULT DISCUSSION
Achieve potash cash cost savings of
$20-$30 per tonne from 2013 levels by
2017 (excluding foreign exchange and
royalties)
• We achieved our target in 2017 with potash cash cost savings (excluding foreign
exchange and royalties) of $26 per tonne from 2013 levels. Our portfolio
optimization efforts, including the ramp-up of our Rocanville expansion, were
fundamental to meeting our target.
Capture direct and indirect annualized
procurement savings of $170 million
from 2014 levels by the end of 2017
• Our center-led approach to procurement helped us succeed in capturing $175
million in direct and indirect annualized procurement savings since 2014.
Achieve a 95 percent ammonia
reliability rate for our nitrogen division
• Our 2017 ammonia reliability rate of 93 percent for our nitrogen division was lower
than target, mainly due to unplanned outages at two of our US plants.
0
5
10
15
20
25
30
DXAGSector Average*PotashCorp
* Sector: weighted average (based on market capitalization) for Agrium,
APC, CF Industries, ICL, Intrepid, K+S, Mosaic, SQM and Yara
Source: Bloomberg, PotashCorp
TOTAL SHAREHOLDER RETURN(percentage – 2017)
0
30
60
90
120
150
20172016201520142013
* Cash-related cost refers to total cost of goods sold less depreciation
and amortization.
Source: PotashCorp
POTASH COST OF GOODS SOLD($ per tonne)
Depreciation and amortization
Cash-related cost of goods sold*
6 PotashCorp 2017 Annual Report
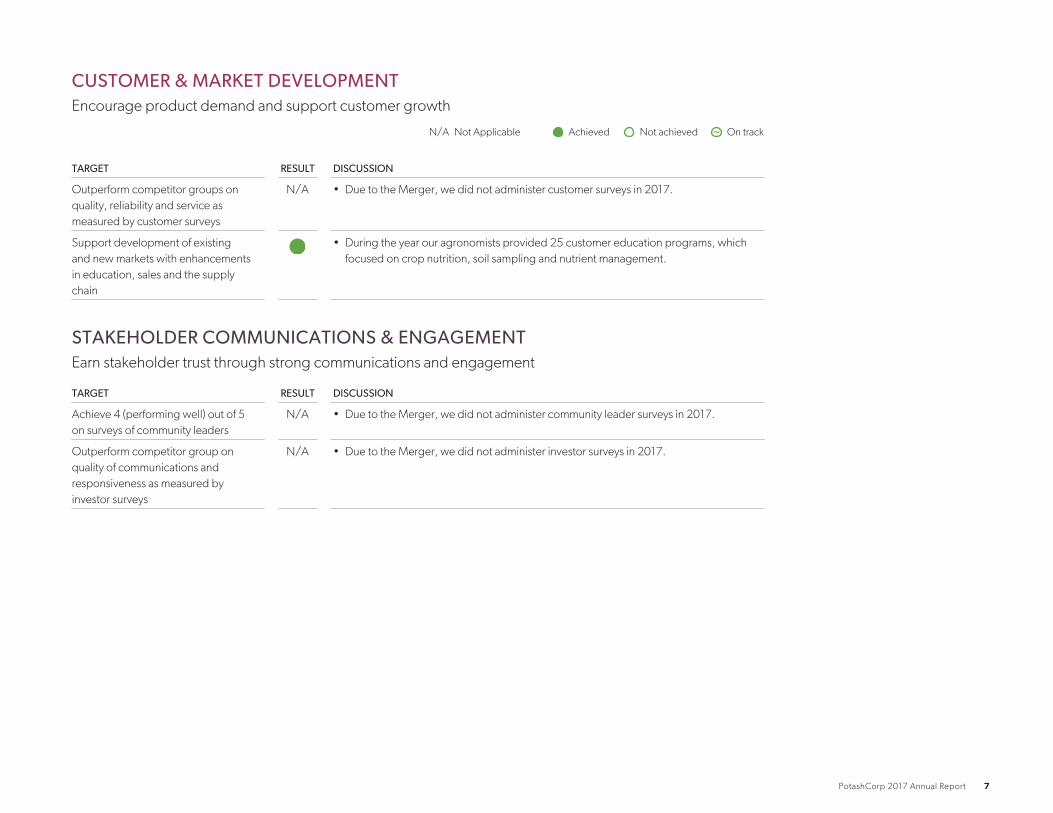
CUSTOMER & MARKET DEVELOPMENTEncourage product demand and support customer growth
N/A Not Applicable Achieved Not achieved On track
TARGET RESULT DISCUSSION
Outperform competitor groups on
quality, reliability and service as
measured by customer surveys
N/A • Due to the Merger, we did not administer customer surveys in 2017.
Support development of existing
and new markets with enhancements
in education, sales and the supply
chain
• During the year our agronomists provided 25 customer education programs, which
focused on crop nutrition, soil sampling and nutrient management.
STAKEHOLDER COMMUNICATIONS & ENGAGEMENTEarn stakeholder trust through strong communications and engagement
TARGET RESULT DISCUSSION
Achieve 4 (performing well) out of 5
on surveys of community leaders
N/A • Due to the Merger, we did not administer community leader surveys in 2017.
Outperform competitor group on
quality of communications and
responsiveness as measured by
investor surveys
N/A • Due to the Merger, we did not administer investor surveys in 2017.
PotashCorp 2017 Annual Report 7

PEOPLE DEVELOPMENTAttract, develop and retain engaged employees
Achieved Not achieved On track
TARGET RESULT DISCUSSION
Have 95 percent of salaried staff
submit and review business goals
and individual development plans
through our new performance
management process
• We achieved our targeted participation with over 95 percent of salaried staff
completing their annual performance management process.
Maintain an annual employee
turnover rate of 5 percent or less
• Our 2017 annual employee turnover rate was 3 percent.
Achieve progress toward our
diversity priorities of increasing the
representation of women in
management to 25 percent or more
by 2025 and becoming
representative of Aboriginal people
in our Canadian operations by 2020
• In 2017, we launched a Women in Leadership Development Mentorship Program that
provides mentorship, guided coaching and other resources for our senior female staff.
During the year, 46 female leaders participated in the program.
• We continued facilitating our Aboriginal Internship Program, which provides internship
opportunities in the areas of engineering, business, and information technology. Since
2015, the program has provided opportunities to 49 participants.
GOOD GOVERNANCEFoster a culture of accountability, fairness and transparency
TARGET RESULT DISCUSSION
Remain in the top quartile of
governance practices as measured
by external reviews
• We ranked in the top quartile of governance practices in The Globe and Mail’s Board
Games 2017.
• Our governance practices were highly ranked by the Dow Jones Sustainability Index
and the FTSE4Good Index in 2017.
• Our 2016 Annual Integrated Report was one of only three – out of ~300 reports judged
worldwide – to receive an A+ rating from reportwatch.com. It also received a gold
award at the 2017 Awards of Excellence in Corporate Reporting by CPA Canada.
0
4
8
12
16
20
20172016201520142013
Source: PotashCorp
EMPLOYEE TURNOVER RATE(percentage)
0
20
40
60
80
100
DJSIWorld
DJSINA
IndustryAverage 1
PotashCorp
1 RobecoSAM CHM Chemicals industry average
Source: 2017 RobecoSAM Corporate Sustainability Assessment in
collaboration with DJSI
CORPORATE GOVERNANCE RATING(out of 100)
8 PotashCorp 2017 Annual Report

SAFETY, HEALTH & ENVIRONMENTAL EXCELLENCEBe relentless in pursuit of the safety of our people and protection of the environment
Achieved Not achieved On track
TARGET RESULT DISCUSSION
Achieve zero life-altering injuries at our
sites
• There were no life-altering injuries at our sites in 2017. Our efforts focused on
effective execution of our four key safety priorities, which include preventing
serious injuries and fatalities (SIF) through implementation of our international
award-winning SIF Prevention Program.
Reduce total recordable injury rate to
0.75 or lower
• Our total recordable injury rate of 0.85 in 2017 was our lowest on record;
however, we fell short of our target.
Reduce total lost-time injury rate to
0.07 or lower
• Our total lost-time injury rate for the year was 0.11, which did not meet our target.
By 2018, reduce GHG emissions per
tonne of nitrogen product by 5 percent
from 2014 levels
• Our GHG emissions per tonne of nitrogen product decreased by 8 percent
compared to 2014 levels. This was mainly the result of our previously installed
enhanced emission controls at our largest nitric acid plant and less CO2 vented to
the atmosphere.
By 2018, reduce environmental
incidents by 40 percent from 2014
levels
• In 2017, we had nine environmental incidents, our lowest total on record and a
63 percent decrease from 2014 levels. This demonstrates our attention to sharing
best practices across our operations, observing our leading indicators and
effectively executing our four key environmental priorities.
• Those four key environmental priorities are: environmental job hazard assessments,
work pausing to reassess hazards, serious incident prevention and environmental
leadership.
By 2018, reduce water consumption
per tonne of phosphate product by
10 percent from 2014 levels
• Water consumption has decreased by 8 percent compared to 2014 levels. Our
Eagle Creek water recycling project at White Springs, which became operational
in the fourth quarter of 2016, is helping us reduce our consumption.
Total lost-time injury rate
Total recordable injury rate
20172016201520142013
1.5
1.2
0.9
0.6
0.3
0.0
Source: PotashCorp
SAFETY PERFORMANCE
0
5
10
15
20
25
20172016201520142013
Source: PotashCorp
ENVIRONMENTAL INCIDENTS(number of incidents)
PotashCorp 2017 Annual Report 9

NUTRIENT PERFORMANCE
INDUSTRY PERFORMANCE
POTASH
Global potash demand was supported by strong
growth in consumption in most major markets and
consistent customer engagement throughout the year.
As a result, global potash shipments rose to a record of
approximately 64 million tonnes in 2017, an increase of
6 percent compared to 2016.
In China, consumption growth was supported by
affordability and a move to high-value, nutrient-intensive
crops. Good monsoon rains supported crop plantings
and potash demand in India, while supportive palm oil
prices and improved weather benefited potash demand
in Other Asian countries. Demand in Latin America was
boosted by favorable barter ratios and crop acreage
expansion. In North America, demand remained healthy
in response to strong affordability and a significant need
to replenish soil nutrients.
New supply from producers in Canada and the FSU was
outpaced by growth in demand, resulting in tighter
supply/demand fundamentals compared to 2016. As a
result, potash prices increased in all major markets. In
Brazil and North America, spot market prices increased
by 21 percent and 7 percent, respectively, compared to
the end of 2016.
NITROGEN
Global nitrogen markets were volatile as the start-up of
new capacity, including the ramp-up of projects in the
US, impacted trade flows. Trade patterns started
shifting, including a 30 percent reduction in US nitrogen
net imports, a 20 percent reduction in Black Sea
ammonia exports and a 50 percent decline in Chinese
urea exports.
As this supply transition unfolded, prices for many
nitrogen products reached multi-year lows during the
first half of 2017 before partially recovering in the
second half due to strong consumption and global
production outages.
PHOSPHATE
Global phosphate markets remained subdued in 2017,
largely due to increased supply and lower shipments to
India. Phosphate fertilizer prices increased late in the
year due to tightening supply and higher raw material
costs. US feed and industrial phosphate prices were
well below prior-year levels, due primarily to increased
supply from offshore producers.
60
61
62
63
64
65
2017ERest ofWorld
NorthAmerica
LatinAmerica
OtherAsia
IndiaChina2016
Source: CRU, Fertecon, Industry Publications
GLOBAL POTASH DEMAND GROWTH(million tonnes KCl)
64.00.40.10.3
0.50.7
1.7
60.3
150
200
250
300
350
400
DNOSAJJMAMFJDNOSAJJMAMFJ
Source: Fertilizer Week
GLOBAL FERTILIZER PRICES($ per tonne)
Potash – CFR Brazil Ammonia – CFR Tampa DAP – FOB New Tampa
2016 2017
10 PotashCorp 2017 Annual Report

POTASH FINANCIAL PERFORMANCEDollars (millions) % Change Tonnes (thousands) % Change Average per Tonne 1 % Change
2017 2016 2015 2017 2016 2017 2016 2015 2017 2016 2017 2016 2015 2017 2016
Manufactured productNet sales
North America $ 639 $ 589 $ 825 8 (29) 3,201 3,367 2,591 (5) 30 $ 200 $ 175 $ 318 14 (45)Offshore 989 781 1,487 27 (47) 6,096 5,277 6,181 16 (15) $ 162 $ 148 $ 241 9 (39)
1,628 1,370 2,312 19 (41) 9,297 8,644 8,772 8 (1) $ 175 $ 158 $ 263 11 (40)Cost of goods sold (824) (913) (977) (10) (7) $ (89) $ (105) $ (111) (15) (5)
Gross margin 804 457 1,335 76 (66) $ 86 $ 53 $ 152 62 (65)Other miscellaneous and purchased
product gross margin 2 (19) (20) (13) (5) 54
Gross Margin $ 785 $ 437 $ 1,322 80 (67) $ 84 $ 51 $ 151 65 (66)1 Rounding differences may occur due to the use of whole dollars in per-tonne calculations.2 Comprised of net sales $5 million (2016 – $10 million, 2015 – $17 million) less cost of goods sold $24 million (2016 – $30 million, 2015 – $30 million).
F Note 3
0
300
600
900
1,200
1,500
2017OtherOffshoreNorthAmerica
2016OtherOffshoreNorthAmerica
20150
300
600
900
1,200
1,500
2017OtherCost ofGoodsSold
NetSalesPrices
SalesVolumes
2016OtherCost ofGoodsSold
NetSalesPrices
SalesVolumes
2015
Source: PotashCorp Source: PotashCorp
1,322 (343)
(535)
(7) 437154
193 1 785
1,322 (37) (907)
66 (7) 437 34
156157 1 785
POTASH GROSS MARGIN CHANGES BY MARKET($ millions)
POTASH GROSS MARGIN CHANGES BY VOLUMES, PRICES AND COSTS($ millions)
2017 vs 2016 2016 vs 2015
Change in Prices/Costs Change in Prices/Costs
Dollars (millions)
Change inSales Volumes Net Sales
Cost ofGoods Sold Total
Change inSales Volumes Net Sales
Cost ofGoods Sold Total
Manufactured productNorth America $ (15) $ 79 $ 90 $ 154 $ 161 $ (481) $ (23) $ (343)Offshore 41 88 64 193 (134) (489) 88 (535)
Change in market mix 8 (11) 3 – (64) 63 1 –
Total manufactured product $ 34 $ 156 $ 157 $ 347 $ (37) $ (907) $ 66 $ (878)Other miscellaneous and purchased product 1 (7)
Total $ 348 $ (885)
PotashCorp 2017 Annual Report 11

Sales to major offshore markets were as follows:
By Canpotex From New Brunswick
Percentage of Annual Sales Volumes % Change Percentage of Annual Sales Volumes % Change
2017 2016 2015 2017 2016 2017 2 2016 2 2015 2017 2 2016
Other Asian markets 1 33 36 34 (8) 6 –Latin America 30 33 30 (9) 10 100China 18 16 20 13 (20) –India 12 9 9 33 – –Other markets 7 6 7 17 (14) –
100 100 100 100
1 All Asian markets except China and India.2 Our international customers were served by New Brunswick through 2015 and have since been served by Canpotex.
The most significant contributors to the change in total gross margin were as follows (direction of arrows refers to impact on gross margin):
Sales Volumes Net Sales Prices Cost of Goods Sold
2017 vs 2016 ▲
▼
Offshore volumes were higher due mainly to
affordability of potash fertilizer relative to
crop prices, and agronomic need.
North American volumes were slightly lower
than the near-record volumes in 2016.
▲
▲
Prices were higher due to strong
demand supporting a continued
recovery in most global markets.
Offshore prices were also higher
due to 2016 results reflecting the
impact of our share of Canpotex’s
project exit costs following its
decision not to proceed with
development of an export terminal
in Prince Rupert, British Columbia.
▲
▲
▲
Costs were lower in 2017 due to our portfolio optimization
effort, including a greater share of production coming from
our lower-cost mines, particularly Rocanville.
Costs were also lower in 2017 as the first quarter of 2016
included costs associated with the indefinite suspension of
potash operations at Picadilly.
Offshore cost of goods sold variance was less positive than
North America as a relatively higher percentage of products
sold was produced at higher-cost mines.
12 PotashCorp 2017 Annual Report
Sales Volumes Net Sales Prices Cost of Goods Sold
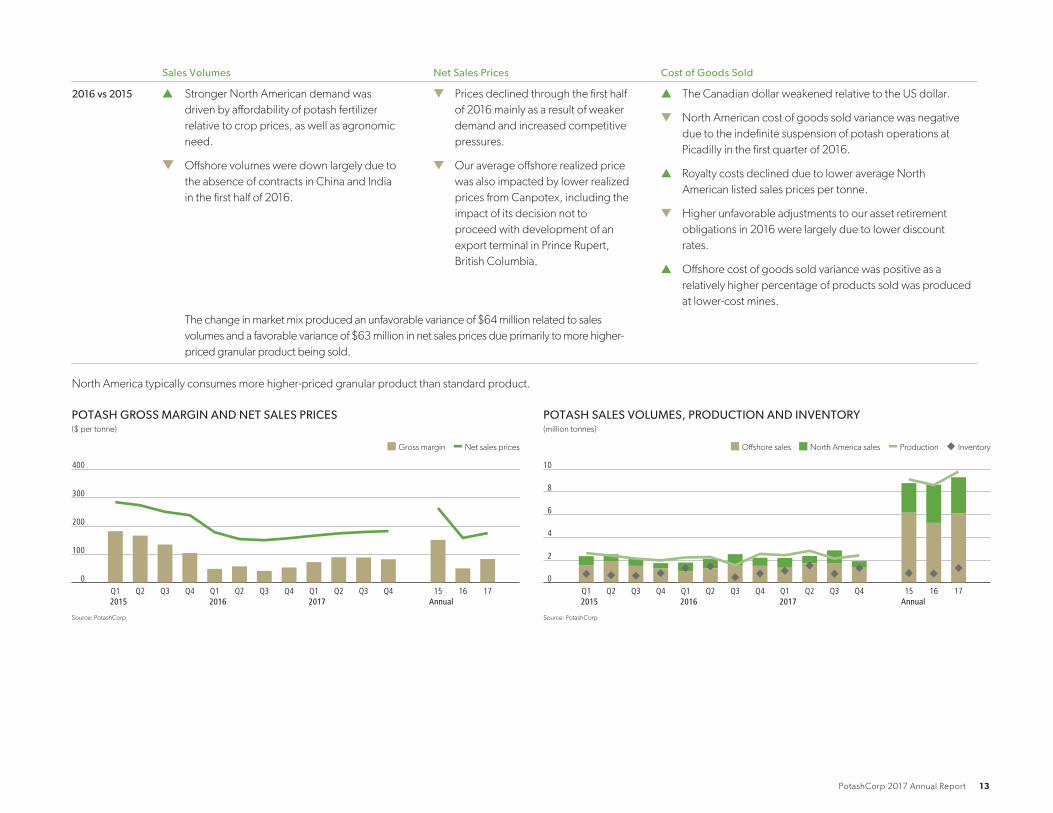
2016 vs 2015 ▲
▼
Stronger North American demand was
driven by affordability of potash fertilizer
relative to crop prices, as well as agronomic
need.
Offshore volumes were down largely due to
the absence of contracts in China and India
in the first half of 2016.
▼
▼
Prices declined through the first half
of 2016 mainly as a result of weaker
demand and increased competitive
pressures.
Our average offshore realized price
was also impacted by lower realized
prices from Canpotex, including the
impact of its decision not to
proceed with development of an
export terminal in Prince Rupert,
British Columbia.
▲
▼
▲
▼
▲
The Canadian dollar weakened relative to the US dollar.
North American cost of goods sold variance was negative
due to the indefinite suspension of potash operations at
Picadilly in the first quarter of 2016.
Royalty costs declined due to lower average North
American listed sales prices per tonne.
Higher unfavorable adjustments to our asset retirement
obligations in 2016 were largely due to lower discount
rates.
Offshore cost of goods sold variance was positive as a
relatively higher percentage of products sold was produced
at lower-cost mines.
The change in market mix produced an unfavorable variance of $64 million related to sales
volumes and a favorable variance of $63 million in net sales prices due primarily to more higher-
priced granular product being sold.
North America typically consumes more higher-priced granular product than standard product.
Gross margin Net sales prices
0
100
200
300
400
171615 Annual
Q4Q3Q2Q1 2017
Q4Q3Q2Q1 2016
Q4Q3Q2Q1 2015
Offshore sales North America sales Production Inventory
0
2
4
6
8
10
171615 Annual
Q4Q3Q2Q1 2017
Q4Q3Q2Q1 2016
Q4Q3Q2Q1 2015
Source: PotashCorp
POTASH GROSS MARGIN AND NET SALES PRICES($ per tonne)
Source: PotashCorp
POTASH SALES VOLUMES, PRODUCTION AND INVENTORY(million tonnes)
PotashCorp 2017 Annual Report 13

POTASH NON-FINANCIAL PERFORMANCE
0
2
4
6
8
10
12
201720162015
Total recordable injury rate Total lost-time injury rate
0.0
0.5
1.0
1.5
2.0
2017201620150
1
2
3
4
5
6
201720162015
Environmental incidents Waste
0
4
8
12
16
2017201620150
6
12
18
24
POTASH PRODUCTION HIGHLIGHTS(KCl tonnes produced – millions)
POTASH SAFETY HIGHLIGHTS(rate)
POTASH EMPLOYEE HIGHLIGHTS(Employee turnover rate)
POTASH ENVIRONMENTAL HIGHLIGHTS(incidents) (million tonnes)
Source: PotashCorp Source: PotashCorp Source: PotashCorp Source: PotashCorp
Production increased in 2017 in response to strongerdemand, the completion of the Rocanville expansion andramp-up, and an increase in our Canpotex salesentitlement.
Production was down in 2016 due to the indefinitesuspension of our Picadilly operations, in response todecreased offshore demand.
In 2017, there were 46 recordable injuries and five lost-time injuries. In 2016, there were 47 recordable injuriesand two lost-time injuries. The increase in the totalrecordable injury rate was primarily due to fewer hoursworked in 2017 compared to 2016.
In 2016, the total recordable injury rate and total lost-time injury rate decreased mainly due to 47 recordableinjuries and two lost-time injuries occurring compared to77 recordable injuries and five lost-time injuries in 2015.The decrease in injury rates was partially offset by fewerhours worked in 2016 compared to 2015.
There were no life-altering injuries from 2015 to 2017.
There were no significant changes from 2016 to 2017.Based on the company’s definition of employee turnoverrate, announced workforce reductions are excluded. In2016, we suspended our Picadilly operations, impacting443 employees. Changes announced at Cory in late2016 impacted approximately 140 employees, starting in2017.
New collective bargaining agreements at our Allan,Cory, Lanigan and Patience Lake sites were signed in thefourth quarter of 2015. The Lanigan agreementextended through January 2018 and is under negotiationwhile the remaining agreements extend through April2019. The Rocanville agreement expires in May 2018.
In 2017, nearly all employees benefited fromenhancements to technical training, supported by a newlearning management system and strategy to createconsistency in training across all sites. Leadershiptraining on our core competencies and safetyengagement continued to be a focus for more than 500employees in 2017, 2016 and 2015.
In 2017, we experienced four environmental incidents,consisting of two potash spills and two brine spills. In2016, we experienced six incidents: two potash spills,a brine spill, an oil spill, a release of suspended solidsinto a river, and a non-compliance for partially filling awetland. In 2015, environmental incidents includedbrine spills and a minor propane gas release.
2017 vs 2016 – more waste was produced duringmanufacturing due to higher potash production.
2016 vs 2015 – less waste was produced duringmanufacturing due to lower potash production.
COMMUNITY HIGHLIGHTS
In 2017, 2016 and 2015, we continued our career informationefforts and reached more than 30,000 Aboriginal people. In2017, more than 11 percent of new employees were self-identified Aboriginal applicants (2016 – 15 percent and2015 – 6 percent). We continue to leverage our communityinvestments to support programs and services that benefitAboriginal people in Saskatchewan.
MINERAL RESERVES 1
(millions of tonnes of estimated recoverable ore) 2
All Potash Locations 3 Proven Probable TotalYears of Remaining
Mine Life
As at December 31, 2017 633 4 1,182 1,815 52 – 811 For a more complete discussion of important information related to our potash reserves, see “Mineral Projects” in our Annual Information Form for the year ended December 31, 2017. Craig Funk, P.Eng.,
P.Geo., Director, Earth Science – Engineering, Technology and Captial, an employee of the company, prepared the following technical reports, each dated effective December 31, 2017: (i) National Instrument43-101 Technical Report on Allan Potash Deposit (KL 112R A), Saskatchewan, Canada; (ii) National Instrument 43-101 Technical Report on Cory Potash Deposit (KL 103B), Saskatchewan, Canada; (iii) NationalInstrument 43-101 Technical Report on Lanigan Potash Deposit (KLSA 001B), Saskatchewan, Canada; (iv) National Instrument 43-101 Technical Report on Rocanville Potash Deposit (KLSA 002B & KL 249),Saskatchewan, Canada. Mr. Funk is a qualified person under National Instrument 43-101 – Standards of Disclosure for Mineral Projects and has reviewed and approved the scientific and technicalinformation herein relating to the company’s Allan, Cory, Lanigan and Rocanville potash operations.
2 Average grade % K2O equivalent of 20.3-24.8.3 Given the characteristics of the solution mining method at Patience Lake, those results are excluded from the above table as it is not possible to estimate reliably the recoverable ore reserve.4 Includes 159 million tonnes at New Brunswick.
14 PotashCorp 2017 Annual Report
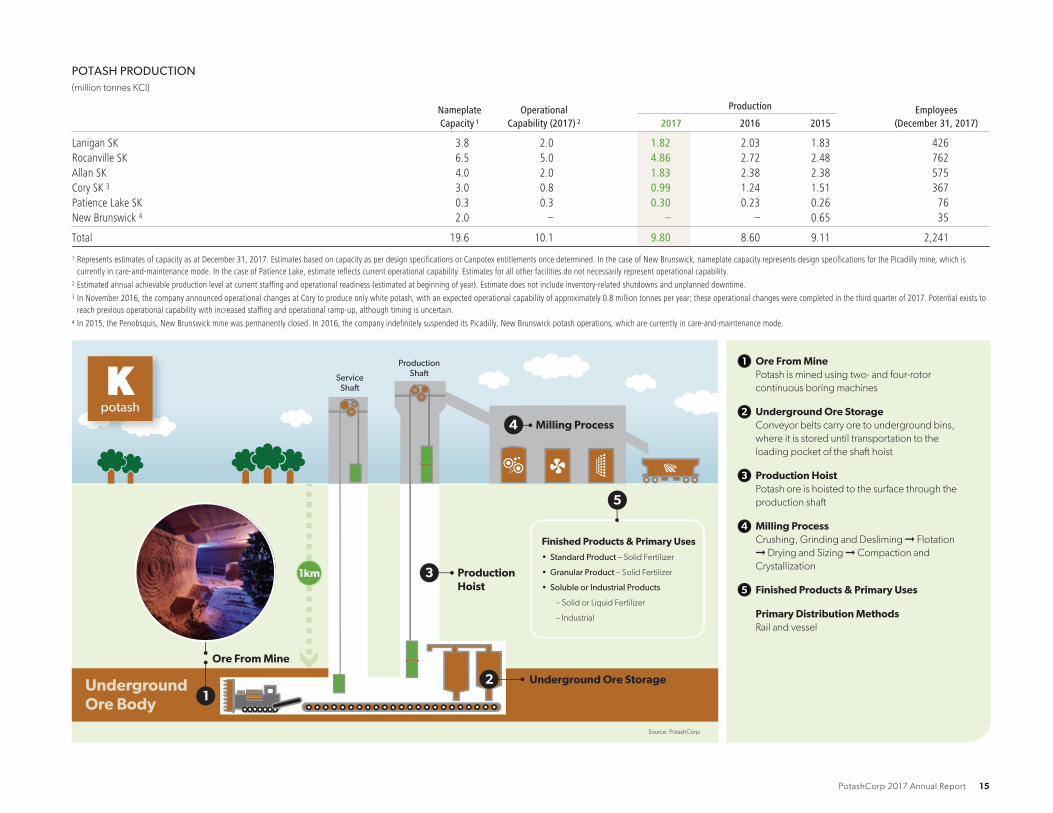
POTASH PRODUCTION(million tonnes KCl)
NameplateCapacity 1
OperationalCapability (2017) 2
Production Employees(December 31, 2017)2017 2016 2015
Lanigan SK 3.8 2.0 1.82 2.03 1.83 426Rocanville SK 6.5 5.0 4.86 2.72 2.48 762Allan SK 4.0 2.0 1.83 2.38 2.38 575Cory SK 3 3.0 0.8 0.99 1.24 1.51 367Patience Lake SK 0.3 0.3 0.30 0.23 0.26 76New Brunswick 4 2.0 – – – 0.65 35
Total 19.6 10.1 9.80 8.60 9.11 2,241
1 Represents estimates of capacity as at December 31, 2017. Estimates based on capacity as per design specifications or Canpotex entitlements once determined. In the case of New Brunswick, nameplate capacity represents design specifications for the Picadilly mine, which iscurrently in care-and-maintenance mode. In the case of Patience Lake, estimate reflects current operational capability. Estimates for all other facilities do not necessarily represent operational capability.
2 Estimated annual achievable production level at current staffing and operational readiness (estimated at beginning of year). Estimate does not include inventory-related shutdowns and unplanned downtime.3 In November 2016, the company announced operational changes at Cory to produce only white potash, with an expected operational capability of approximately 0.8 million tonnes per year; these operational changes were completed in the third quarter of 2017. Potential exists to
reach previous operational capability with increased staffing and operational ramp-up, although timing is uncertain.4 In 2015, the Penobsquis, New Brunswick mine was permanently closed. In 2016, the company indefinitely suspended its Picadilly, New Brunswick potash operations, which are currently in care-and-maintenance mode.
4
ServiceShaft
ProductionShaft
Milling Process
12
5
Source: PotashCorp
UndergroundOre Body
Underground Ore Storage
Production Hoist
Ore From Mine
1km 3
Finished Products & Primary Uses
• Standard Product – Solid Fertilizer
• Granular Product – Solid Fertilizer
• Soluble or Industrial Products
– Solid or Liquid Fertilizer
– Industrial
1
2
3
4
5
Ore From MinePotash is mined using two- and four-rotor
continuous boring machines
Underground Ore StorageConveyor belts carry ore to underground bins,
where it is stored until transportation to the
loading pocket of the shaft hoist
Production HoistPotash ore is hoisted to the surface through the
production shaft
Milling ProcessCrushing, Grinding and Desliming ➞ Flotation
➞ Drying and Sizing ➞ Compaction and
Crystallization
Finished Products & Primary Uses
Primary Distribution MethodsRail and vessel
Kpotash
PotashCorp 2017 Annual Report 15

NITROGEN FINANCIAL PERFORMANCE
Dollars (millions) % Change Tonnes (thousands) % Change Average per Tonne 1 % Change
2017 2016 2015 2017 2016 2017 2016 2015 2017 2016 2017 2016 2015 2017 2016
Manufactured product 2
Net salesAmmonia $ 584 $ 612 $ 978 (5) (37) 2,205 2,197 2,228 – (1) $ 265 $ 278 $ 439 (5) (37)Urea 302 297 362 2 (18) 1,166 1,161 1,048 – 11 $ 259 $ 256 $ 346 1 (26)Solutions, nitric acid,
ammonium nitrate 421 477 567 (12) (16) 2,946 3,015 2,650 (2) 14 $ 143 $ 158 $ 214 (9) (26)
1,307 1,386 1,907 (6) (27) 6,317 6,373 5,926 (1) 8 $ 207 $ 217 $ 322 (5) (33)Cost of goods sold (1,066) (1,041) (1,219) 2 (15) $ (169) $ (163) $ (206) 4 (21)
Gross margin 241 345 688 (30) (50) $ 38 $ 54 $ 116 (30) (53)Other miscellaneous and
purchased productgross margin 3 15 16 18 (6) (11)
Gross Margin $ 256 $ 361 $ 706 (29) (49) $ 41 $ 57 $ 119 (28) (52)
1 Rounding differences may occur due to the use of whole dollars in per-tonne calculations.2 Includes inter-segment ammonia sales, comprised of net sales $73 million, cost of goods sold $38 million and 191,000 sales tonnes (2016 – net sales $61 million, cost of goods sold $30 million and 160,000 sales tonnes, 2015 – net sales $86 million, cost of goods sold
$30 million and 161,000 sales tonnes). Inter-segment profits are eliminated on consolidation.3 Comprised of third-party and inter-segment sales, including third-party net sales $32 million less cost of goods sold $18 million (2016 – net sales $20 million less cost of goods sold $5 million, 2015 – net sales $38 million less cost of goods sold $21 million) and inter-segment net
sales $1 million less cost of goods sold $NIL (2016 – net sales $1 million less cost of goods sold $NIL, 2015 – net sales $1 million less cost of goods sold $NIL). Inter-segment profits are eliminated on consolidation.
F Note 3
0
300
600
900
2017Hedge,Other
Solutions/NA/AN
UreaAmmonia2016Hedge,Other
Solutions/NA/AN
UreaAmmonia20150
300
600
900
2017OtherCost ofGoodsSold
NetSalesPrices
SalesVolumes
2016OtherCost ofGoodsSold
NetSalesPrices
SalesVolumes
2015
Source: PotashCorp Source: PotashCorp
706 (203)
(51)(100)
9 361 (17) (6) (103)21 256
361 (4) (66)(34) (1) 256
(2)238
(665)706
84
NITROGEN GROSS MARGIN CHANGES BY PRODUCT MIX($ millions)
NITROGEN GROSS MARGIN CHANGES BY VOLUMES, PRICES AND COSTS($ millions)
16 PotashCorp 2017 Annual Report

2017 vs 2016 2016 vs 2015
Change in Prices/Costs Change in Prices/Costs
Dollars (millions)
Change inSales Volumes Net Sales
Cost ofGoods Sold Total
Change inSales Volumes Net Sales
Cost ofGoods Sold Total
Manufactured productAmmonia $ 1 $ (29) $ 11 $ (17) $ (5) $ (353) $ 155 $ (203)Urea – 3 (9) (6) 12 (103) 40 (51)Solutions, nitric acid, ammonium nitrate (1) (46) (56) (103) 29 (161) 32 (100)
Hedge – – 22 22 – – 11 11Change in product mix (4) 6 (2) – 48 (48) – –
Total manufactured product $ (4) $ (66) $ (34) $ (104) $ 84 $ (665) $ 238 $ (343)Other miscellaneous and purchased product (1) (2)
Total $ (105) $ (345)
Sales Tonnes (thousands) % Change Average Net Sales Price per Tonne % Change
2017 2016 2015 2017 2016 2017 2016 2015 2017 2016
Fertilizer 2,564 2,455 1,989 4 23 $ 215 $ 216 $ 321 – (33)Industrial and feed 3,753 3,918 3,937 (4) – $ 201 $ 218 $ 323 (8) (33)
6,317 6,373 5,926 (1) 8 $ 207 $ 217 $ 322 (5) (33)
The most significant contributors to the change in total gross margin were as follows (direction of arrows refers to impact on gross margin while Š symbol is neutral):
Sales Volumes Net Sales Prices Cost of Goods Sold
2017 vs 2016 Š There were no significant changes. ▼
▲
Our average realized price was impacted bylower benchmark pricing as a result ofincreased global supply.
Pricing for urea increased slightly due totighter supply and demand fundamentalsrelative to the other products.
▼
▲
Average costs, including our hedge position, for natural gas used asfeedstock in production increased 4 percent. Costs for natural gasused as feedstock in Trinidad production increased 1 percent(contract price indexed, in part, to Tampa ammonia prices) while ourUS spot costs for natural gas increased 23 percent. Including losseson our hedge position, our US gas prices increased 8 percent.
Ammonia cost of goods sold variance was mainly positive due to thesale of inventory containing lower-cost natural gas used as feedstockin production and higher production at lower-cost plants.
2016 vs 2015 ▲ Volumes grew due to additional production at ourrecently expanded Lima facility. Total ammonia salesdeclined modestly due to additional ammonia beingdirected to downstream products. In 2015, volumeswere impacted by weaker fertilizer demand anddowntime at Lima.
▼ Our average realized price declined due tolower global energy costs and new nitrogensupply that pressured prices for all products.
▲ Average costs, including our hedge position, for natural gas used asfeedstock in production decreased 31 percent. Costs for natural gasused as feedstock in Trinidad production fell 44 percent (contractprice indexed primarily to Tampa ammonia prices) while our US spotcosts for natural gas decreased 8 percent. Including losses on ourhedge position, our US gas prices fell 14 percent.
The change in product mix produced favorable variances of $48 million related to sales volumes and anunfavorable variance of $48 million in sales prices due to increased sales of urea and solutions.
PotashCorp 2017 Annual Report 17

0
100
200
300
400
500
171615 Annual
Q4Q3Q2Q1 2017
Q4Q3Q2Q1 2016
Q4Q3Q2Q1 2015
0
2
4
6
8
171615 Annual
Q4 Q3 Q2Q1 2017
Q4 Q3 Q2Q1 2016
Q4 Q3 Q2Q1 2015
0
2
4
6
8
10
* In production, including hedge
Source: PotashCorp
NITROGEN GROSS MARGIN, NET SALES PRICES AND NATURAL GAS COSTS($ per tonne) ($ per MMBtu)
Source: PotashCorp
NITROGEN SALES VOLUMES(million tonnes)
Average natural gas costs*Gross margin Net sales prices Ammonia Urea Solutions, nitric acid, ammonium nitrate
NITROGEN NON-FINANCIAL PERFORMANCE
0
1
2
3
4
2017201620150.0
0.5
1.0
1.5
2.0
2017201620150
1
2
3
4
5
6
2017201620150
2
4
6
8
10
2017201620150.5
1.0
1.5
2.0
2.5
3.0
0
25
50
75
100
NITROGEN PRODUCTION HIGHLIGHTS(millions) (percentage)
NITROGEN SAFETY HIGHLIGHTS(rate)
NITROGEN EMPLOYEE HIGHLIGHTS(Employee turnover rate)
NITROGEN ENVIRONMENTAL HIGHLIGHTS(incidents) (ratio)
N tonnes produced Total recordable injury rateAmmonia operating rate Total lost-time injury rate Environmental incidents Greenhouse gas emissions 1
Source: PotashCorp Source: PotashCorp Source: PotashCorp Source: PotashCorp 1 CO2 equivalent tonnes/tonne of product
Changes to nitrogen production and ammonia operatingrate are not considered significant.
There were 14 recordable injuries, including two lost-timeinjuries, in 2017 compared to 11 recordable injuries andthree lost-time injuries in 2016.
In 2016, there were 11 recordable injuries compared to14 in 2015. The total lost-time injury rate increased from2015 to 2016 mainly due to three lost-time injuriesoccurring in 2016 compared to two in 2015.
There were no life-altering injuries from 2015 to 2017.
In 2017, employee turnover increased as a result of31 departures in 2017 compared to 21 in 2016. Based onthe company’s definition of employee turnover rate,announced workforce reductions are excluded.
In 2017, nearly all employees benefited fromenhancements to technical training, supported by a newlearning management system and strategy to createconsistency in training across all sites. Leadership trainingon our core competencies and safety engagementcontinued to be a focus for nearly 500 employees in 2017(2016 – more than 250 employees; 2015 – more than 200employees).
In 2017, we had five environmental incidents, consistingof four ammonia releases and one nitrogen permitexceedance. The seven incidents in 2016 consisted offour ammonia releases, a urea release, a hydrogenfluoride release exceedance and a NOx/nitric acidrelease.
There were no significant changes in environmentalincidents from 2015 to 2016.
There were no significant changes in greenhouse gasemissions from 2015 to 2017.
18 PotashCorp 2017 Annual Report
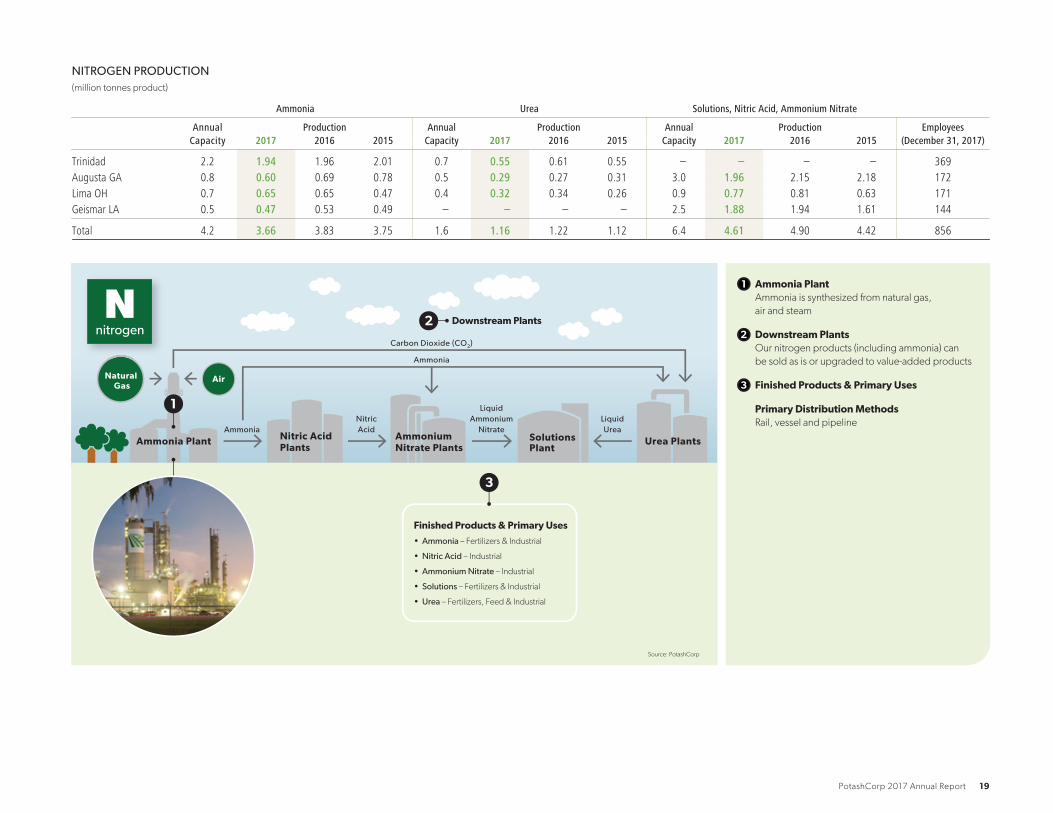
NITROGEN PRODUCTION(million tonnes product)
Ammonia Urea Solutions, Nitric Acid, Ammonium Nitrate
AnnualCapacity 2017
Production2016 2015
AnnualCapacity 2017
Production2016 2015
AnnualCapacity 2017
Production2016 2015
Employees(December 31, 2017)
Trinidad 2.2 1.94 1.96 2.01 0.7 0.55 0.61 0.55 – – – – 369Augusta GA 0.8 0.60 0.69 0.78 0.5 0.29 0.27 0.31 3.0 1.96 2.15 2.18 172Lima OH 0.7 0.65 0.65 0.47 0.4 0.32 0.34 0.26 0.9 0.77 0.81 0.63 171Geismar LA 0.5 0.47 0.53 0.49 – – – – 2.5 1.88 1.94 1.61 144
Total 4.2 3.66 3.83 3.75 1.6 1.16 1.22 1.12 6.4 4.61 4.90 4.42 856
1
2
3
Ammonia PlantAmmonia is synthesized from natural gas,
air and steam
Downstream PlantsOur nitrogen products (including ammonia) can
be sold as is or upgraded to value-added products
Finished Products & Primary Uses
Primary Distribution MethodsRail, vessel and pipeline
Urea PlantsAmmoniumNitrate Plants
Nitric Acid Plants
SolutionsPlant
Natural Gas
Air
Ammonia PlantAmmonia
Source: PotashCorp
NitricAcid
LiquidAmmonium
NitrateLiquidUrea
Ammonia
Carbon Dioxide (CO2)
1
Finished Products & Primary Uses
• Ammonia – Fertilizers & Industrial
• Nitric Acid – Industrial
• Ammonium Nitrate – Industrial
• Solutions – Fertilizers & Industrial
• Urea – Fertilizers, Feed & Industrial
Downstream Plants2
3
Nnitrogen
PotashCorp 2017 Annual Report 19

PHOSPHATE FINANCIAL PERFORMANCEDollars (millions) % Change Tonnes (thousands) % Change Average per Tonne 1 % Change
2017 2016 2015 2017 2016 2017 2016 2015 2017 2016 2017 2016 2015 2017 2016
Manufactured productNet sales
Fertilizer $ 609 $ 622 $ 827 (2) (25) 1,809 1,720 1,713 5 – $ 337 $ 362 $ 483 (7) (25)Feed and industrial 494 569 727 (13) (22) 1,002 993 1,137 1 (13) $ 493 $ 573 $ 640 (14) (10)
1,103 1,191 1,554 (7) (23) 2,811 2,713 2,850 4 (5) $ 393 $ 439 $ 545 (10) (19)Cost of goods sold (1,471) (1,161) (1,320) 27 (12) $ (523) $ (428) $ (463) 22 (8)
Gross margin (368) 30 234 n/m (87) $ (130) $ 11 $ 82 n/m (87)Other miscellaneous and purchased
product gross margin 2 2 2 7 – (71)
Gross Margin $ (366) $ 32 $ 241 n/m (87) $ (130) $ 12 $ 85 n/m (86)
1 Rounding differences may occur due to the use of whole dollars in per-tonne calculations.2 Comprised of net sales $8 million (2016 – $5 million, 2015 – $49 million) less cost of goods sold $6 million (2016 – $3 million, 2015 – $42 million).
n/m = not meaningful
F Note 3
-400
-300
-200
-100
0
100
200
300
2017Feed &Industrial
Fertilizer2016OtherFeed &Industrial
Fertilizer2015-400
-300
-200
-100
0
100
200
300
2017Cost ofGoodsSold
NetSalesPrices
SalesVolumes
2016OtherCost ofGoodsSold
NetSalesPrices
SalesVolumes
2015
Source: PotashCorp Source: PotashCorp
241 (93)
(111)
(5) 32 (329)
(69)
(366) (5) 32 5 (132)
(271)
(366)
241 (15) (288)
99
PHOSPHATE GROSS MARGIN CHANGES BY PRODUCT MIX($ millions)
PHOSPHATE GROSS MARGIN CHANGES BY VOLUMES, PRICES AND COSTS($ millions)
2017 vs 2016 2016 vs 2015
Change in Prices/Costs Change in Prices/Costs
Dollars (millions)
Change inSales Volumes Net Sales
Cost ofGoods Sold Total
Change inSales Volumes Net Sales
Cost ofGoods Sold Total
Manufactured productFertilizer $ 2 $ (45) $ (286) $ (329) $ 1 $ (208) $ 114 $ (93)Feed and industrial 1 (82) 12 (69) (19) (72) (20) (111)
Change in product mix 2 (5) 3 – 3 (8) 5 –
Total manufactured product $ 5 $ (132) $ (271) $ (398) $ (15) $ (288) $ 99 $ (204)Other miscellaneous and purchased product – (5)
Total $ (398) $ (209)
20 PotashCorp 2017 Annual Report

The most significant contributors to the change in total gross margin were as follows (direction of arrows refers to impact on gross margin while Š symbol is neutral):
Sales Volumes Net Sales Prices Cost of Goods Sold
2017 vs 2016 Š There were no significant changes. ▼ Our average realized price was downdue to increased competitive supply andlower input costs.
▼ Fertilizer cost of goods sold variance was significantly more negative as the resultof an impairment of White Springs assets due to sustained negative performanceand the write-off of other assets that are no longer used. There were no suchimpairments impacting fertilizer cost of goods sold in 2016.F Note 13
▲ Feed and industrial was positive as the increase in asset retirement obligationsdue to discount rate adjustments was lower than in 2016, which more than offseta slight increase in impairments (2017 – related to feed plants and a product thatwill no longer be produced, 2016 – related to an industrial product we no longerproduce and sustained losses on a contract). F Note 13
2016 vs 2015 ▼ Volumes fell for feed primarily as a result ofslightly lower demand and increasedcompetitor supply.
▼ Our average realized price was down,most notably for fertilizer products, as aresult of lower input costs and increasedcompetitive pressures.
▲ Cost of goods sold fell primarily due to a 38 percent decrease in the average costfor sulfur and a 29 percent decrease in the average cost for ammonia.
▼ Impairments related to a product that the company will no longer produce andsustained losses in a contract more than offset the impact of the above in feedand industrial. F Note 13
Š Lower provisions for asset retirement obligations, due to higher discount rates,decreased cost of goods sold in 2016 and 2015.
-600
-400
-200
0
200
400
600
171615 Annual
Q4Q3Q2Q1 2017
Q4Q3Q2Q1 2016
Q4Q3Q2Q1 2015
0
1
2
3
4
171615 Annual
Q4Q3Q2Q1 2017
Q4Q3Q2Q1 2016
Q4Q3Q2Q1 2015
Source: PotashCorp
PHOSPHATE GROSS MARGIN AND NET SALES PRICES($ per tonne)
Source: PotashCorp
PHOSPHATE SALES VOLUMES(million tonnes)
Gross margin Net sales prices Fertilizer Feed & Industrial
PotashCorp 2017 Annual Report 21

PHOSPHATE NON-FINANCIAL PERFORMANCE
0.0
0.4
0.8
1.2
1.6
2.0
2017201620150.0
0.5
1.0
1.5
2.0
2017201620150
1
2
3
4
5
6
2017201620150
3
6
9
12
2017201620150
1
2
0
9
18
27
36
0
20
40
60
80
100
PHOSPHATE PRODUCTION HIGHLIGHTS(millions) (percentage)
PHOSPHATE SAFETY HIGHLIGHTS(rate) (number)
PHOSPHATE EMPLOYEE HIGHLIGHTS(Employee turnover rate)
PHOSPHATE ENVIRONMENTAL HIGHLIGHTS(incidents) (cubic meters per tonne)
Life-altering injuriesP2O5 tonnes produced Total recordable injury rateP2O5 operating rateTotal lost-time injury rate
Environmental incidents Water consumption
Source: PotashCorp Source: PotashCorp Source: PotashCorp Source: PotashCorp
Changes to phosphate production and P2O5 operating rateare not considered significant.
There were 18 recordable injuries, including three lost-time injuries, in 2017 compared to 28 recordable injuriesand three lost-time injuries in 2016.
Sadly, a workplace accident resulted in a fatality at ourWhite Springs operation during the first quarter of 2015.
The total lost-time injury rate decreased from 2015 to2016 mainly due to three lost-time injuries occurring in2016 compared to five in 2015. The lost-time injury ratechange from 2016 to 2017 is not considered significant.
There were no significant changes from 2015 to 2017. Basedon the company’s definition of employee turnover rate,announced workforce reductions are excluded.
In 2017, nearly all employees benefited fromenhancements to technical training, supported by a newlearning management system and strategy to createconsistency in training across all sites. Leadership trainingon our core competencies and safety engagementcontinued to be a focus for nearly 400 employees in 2017(2016 and 2015 – nearly 300 employees).
In 2017, we experienced no environmental incidents.
Environmental incidents in 2016 included a totalsuspended solids release to waste water, an ammoniarelease, exceedance of a mercury air emission limit, and apH exceedance. Environmental incidents in 2015 primarilyrelated to permit exceedances for total suspended solids inwater and air emission stack test exceedances.
Water consumption fell from 2016 to 2017 due toincreased rainfall at our White Springs facility, whichrecycles rainwater into the process, and the impact of awater recycling project that began operating in late 2016.
Water consumption rose from 2015 to 2016 due in largepart to drought affecting our White Springs facility.
PHOSPHATE ROCK RESERVES(millions of estimated tonnes – stated average grade 30.66% P2O5)
As at December 31, 2017 Proven Probable Total
Average EstimatedYears of Remaining
Mine Life
Aurora NC 1 92.6 39.7 132.3 31White Springs FL 2 23.0 – 23.0 13
Total 115.6 39.7 155.3
1 The reserves set forth for Aurora would support mining to continue at annual production rates for about 31 years, based on anaverage annual production rate of approximately 4.31 million tonnes of 30.66% concentrate over the three-year period endedDecember 31, 2017. The reserve evaluation was updated in 2017 based on mine advance and a drilling program completed in 2016.
2 The reserves set forth for White Springs would support mining to continue at annual production rates for about 13 years, based on anaverage annual production rate of approximately 1.73 million tonnes of 30.66% concentrate over the three-year period endedDecember 31, 2017.
22 PotashCorp 2017 Annual Report
PHOSPHATE PRODUCTION(million tonnes)
Phosphate Rock Phosphoric Acid (P2O5) Liquid Products Solid Fertilizer Products
AnnualCapacity 2017
Production2016 2015
AnnualCapacity 2017
Production2016 2015
AnnualCapacity 2017
Production2016 2015
AnnualCapacity 2017
Production2016 2015
Employees(December 31, 2017)
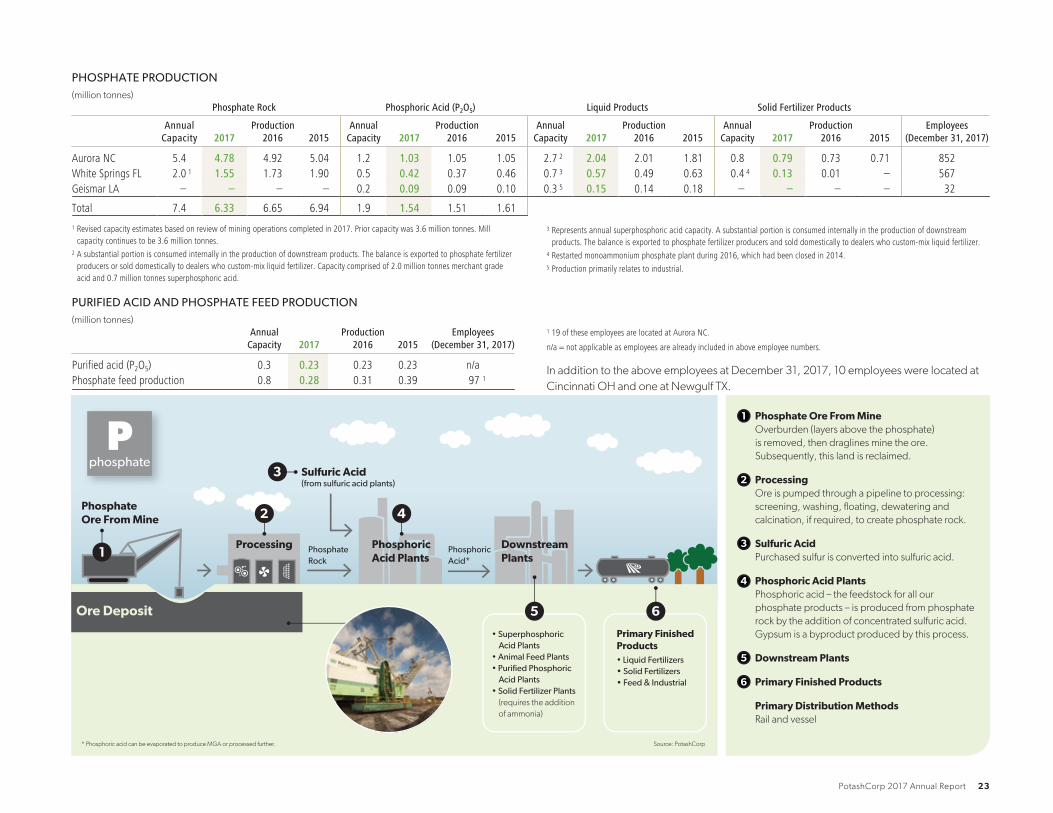
Aurora NC 5.4 4.78 4.92 5.04 1.2 1.03 1.05 1.05 2.7 2 2.04 2.01 1.81 0.8 0.79 0.73 0.71 852White Springs FL 2.0 1 1.55 1.73 1.90 0.5 0.42 0.37 0.46 0.7 3 0.57 0.49 0.63 0.4 4 0.13 0.01 – 567Geismar LA – – – – 0.2 0.09 0.09 0.10 0.3 5 0.15 0.14 0.18 – – – – 32
Total 7.4 6.33 6.65 6.94 1.9 1.54 1.51 1.61
1 Revised capacity estimates based on review of mining operations completed in 2017. Prior capacity was 3.6 million tonnes. Millcapacity continues to be 3.6 million tonnes.
2 A substantial portion is consumed internally in the production of downstream products. The balance is exported to phosphate fertilizerproducers or sold domestically to dealers who custom-mix liquid fertilizer. Capacity comprised of 2.0 million tonnes merchant gradeacid and 0.7 million tonnes superphosphoric acid.
3 Represents annual superphosphoric acid capacity. A substantial portion is consumed internally in the production of downstreamproducts. The balance is exported to phosphate fertilizer producers and sold domestically to dealers who custom-mix liquid fertilizer.
4 Restarted monoammonium phosphate plant during 2016, which had been closed in 2014.5 Production primarily relates to industrial.
PURIFIED ACID AND PHOSPHATE FEED PRODUCTION(million tonnes)
AnnualCapacity 2017
Production2016 2015
Employees(December 31, 2017)
Purified acid (P2O5) 0.3 0.23 0.23 0.23 n/aPhosphate feed production 0.8 0.28 0.31 0.39 97 1
1 19 of these employees are located at Aurora NC.
n/a = not applicable as employees are already included in above employee numbers.
In addition to the above employees at December 31, 2017, 10 employees were located at
Cincinnati OH and one at Newgulf TX.
1
2
3
4
5
6
Phosphate Ore From MineOverburden (layers above the phosphate)
is removed, then draglines mine the ore.
Subsequently, this land is reclaimed.
ProcessingOre is pumped through a pipeline to processing:
screening, washing, floating, dewatering and
calcination, if required, to create phosphate rock.
Sulfuric AcidPurchased sulfur is converted into sulfuric acid.
Phosphoric Acid PlantsPhosphoric acid – the feedstock for all our
phosphate products – is produced from phosphate
rock by the addition of concentrated sulfuric acid.
Gypsum is a byproduct produced by this process.
Downstream Plants
Primary Finished Products
Primary Distribution MethodsRail and vessel
Phosphate Rock
Phosphoric Acid*
1
PhosphateOre From Mine
Processing
Sulfuric Acid (from sulfuric acid plants)
3
PhosphoricAcid Plants
42
Downstream Plants
* Phosphoric acid can be evaporated to produce MGA or processed further. Source: PotashCorp
• Superphosphoric Acid Plants• Animal Feed Plants• Purified Phosphoric Acid Plants• Solid Fertilizer Plants (requires the addition
of ammonia)
• Liquid Fertilizers
• Solid Fertilizers • Feed & Industrial
Primary Finished Products
Ore Deposit 65
Pphosphate
PotashCorp 2017 Annual Report 23

2017 EARNINGS PER SHARE
We report our results (including gross
margin) in three business segments:
potash, nitrogen and phosphate –
reflecting how we manage our
business, plan our operations and
measure performance.
Net sales 1 (and the related per-tonne amounts), as a
component of gross margin, are:
• the primary revenue measures we use and review to make
decisions about operating matters;
• included in assessments of potash, nitrogen and
phosphate performance and the resources to be allocated
to these segments;
• used for business planning and monthly forecasting;
• calculated as sales revenues less freight, transportation
and distribution expenses; and
• also referred to as realized prices.
F Note 3 for our operating segments
1 Included in our segment disclosures in the consolidated financial statements
in accordance with IFRS, which require segmentation based upon our internal
organization and reporting of revenue and profit measures.
The direction of the arrows in the table below refers to effect on earnings per share (EPS).
Effect on EPS
2017 EPS Comparedto Initial Guidance
2017 EPS Comparedto 2016 Actual
Initial midpoint estimate for 2017 EPS 1 $ 0.45EPS for 2016 $ 0.38
Potash realized prices 0.05 0.17Potash sales volumes 0.02 0.03Share of Canpotex’s Prince Rupert exit costs – 0.02Termination benefit costs – 0.03Discount rate changes to asset retirement obligations – 0.02Provincial mining taxes 2 (0.02) (0.03)Other 0.02 0.08
Subtotal potash ▲ 0.07 ▲ 0.32
Nitrogen realized prices 0.06 (0.07)Nitrogen sales volumes (0.02) –Natural gas costs (0.03) (0.03)Hedge loss and other nitrogen costs (0.02) (0.01)
Subtotal nitrogen ▼ (0.01) ▼ (0.11)
Phosphate realized prices 0.01 (0.13)Impairment of property, plant and equipment (0.32) (0.29)Other phosphate costs (0.04) 0.02
Subtotal phosphate ▼ (0.35) ▼ (0.40)
Discontinued operations 0.03 0.07Transaction costs (0.03) (0.07)Other (0.02) (0.03)
Subtotal other ▼ (0.02) ▼ (0.03)
Subtotal of the above (0.31) (0.22)Income tax rate on ordinary income 0.02 0.03Discrete items impacting income taxes 0.23 0.20
Total variance ▼ (0.06) ▲ 0.01
EPS from continuing and discontinued operations for 2017 $ 0.39 $ 0.391 Based on outlook and assumptions described in our 2016 Annual Integrated Report.2 Although provincial mining taxes are not part of the potash segment, the effect on EPS is included within potash as these taxes pertain to potash.
24 PotashCorp 2017 Annual Report

OTHER EXPENSES AND INCOME
% Change
Dollars (millions), except percentage amounts 2017 2016 1 2015 1 2017 2016
Selling and administrative expenses $ (214) $ (212) $ (239) 1 (11)Provincial mining and other taxes (151) (124) (310) 22 (60)Transaction costs (84) (18) – 367 n/mOther (expenses) income (17) (17) 33 – n/mFinance costs (238) (216) (192) 10 13Income tax recovery (expense) 183 (44) (446) n/m (90)Net income from discontinued operations 173 124 155 40 (20)1 Certain amounts have been reclassified from share of earnings of equity-accounted investees, dividend income and income taxes to net income from discontinued operations as the related assets were classified as held for sale in 2017. Other (expenses) income amounts have been
reclassified to conform to the current year’s presentation. The variance explanations below for 2016 vs 2015 have been revised for these changes.
n/m = not meaningful
PERFORMANCE
The most significant contributors to the change in other expenses and income results were as follows:
2017 vs 2016 2016 vs 2015
Provincial Mining and
Other Taxes
F Note 5
Under Saskatchewan provincial legislation, the company is subject to resource taxes,including the potash production tax and the resource surcharge. Provincial mining andother taxes increased primarily due to stronger potash prices.
Provincial mining and other taxes decreased primarily due to weaker potash prices.
Transaction Costs
FNote 32
Transaction costs pertained to the Merger. Costs increased in late 2017 due topreparation for completion of the Merger on January 1, 2018.
Transaction costs pertained to the Merger.
Other (Expenses) Income
F Note 6
There were no significant changes. Other expenses in 2016 were primarily the result of foreign exchange losses and theimpairment of our available-for-sale investment in Sinofert. Other income in 2015 mainlyconsisted of foreign exchange gains.
PotashCorp 2017 Annual Report 25

2017 vs 2016 2016 vs 2015
0
1
2
3
4
5
2017201620150
2
4
6
8
10
* Includes current portion
Source: PotashCorp
WEIGHTED AVERAGE DEBT OBLIGATIONSOUTSTANDING AND EFFECTIVE INTEREST RATES($ billions) (percentage)
Short-term rateShort-term debt Long-term debt* Long-term rate
4.7%
0.4%
4.8%
0.8%
4.7%
1.3%
Finance Costs
F Note 7
There were no significant changes. There were no significant changes.
Income Tax
Recovery
(Expense)
F Note 8
Income taxes decreased due to substantially lowerearnings in the United States, partially offset byhigher earnings in Canada and Trinidad.
Significant items to note include the following:
• In 2017, a deferred tax recovery of $187 millionwas recorded as a result of a federal income taxrate decrease pursuant to US tax reformlegislation.
• In 2016, a current tax recovery of $16 million wasrecorded to adjust accruals after tax authorityexaminations.
In 2017, due to a loss before taxes realized foraccounting purposes and different weightingsbetween jurisdictions, the split between current anddeferred income taxes is not meaningful. In 2016,125 percent of the effective tax rate on the year’sordinary earnings pertained to current income taxesand (25) percent related to deferred income taxes.
Income taxes decreased due to significantly lower earnings inhigher tax jurisdictions.
Significant items to note include the following:
• In 2016, a current tax recovery of $16 million was recordedto adjust accruals after tax authority examinations.
• In 2015, a current tax recovery of $17 million was recordedupon the conclusion of a tax authority audit.
In 2016, 125 percent of the effective tax rate on the year’sordinary earnings pertained to current income taxes (2015 –57 percent) and (25) percent related to deferred income taxes(2015 – 43 percent). The decrease in the deferred portion wasdue to the substantial reduction in Canadian earnings.
EFFECTIVE TAX RATES AND DISCRETE ITEMSDollars (millions), except percentage amounts
2017 2016 1 2015 1
Actual effective tax rate onordinary earnings (7)% 24% 29%
Actual effective tax rateincluding discrete items n/m 18% 29%
Discrete tax adjustments thatimpacted the rate $ 185 $ 17 $ 7
n/m = not meaningful1 Rates have been adjusted as a result of our investments in SQM, APC and ICL beingclassified as discontinued operations in 2017.
Net Income From
Discontinued
Operations
F Note 19
Increases related primarily to higher earnings relatedto the investments in SQM and APC more thanoffsetting lower dividend income from ouravailable-for-sale investment in ICL.
Decreases were due to lower earnings related to APC andlower dividends from our investment in ICL, partially offset byhigher earnings related to SQM.
26 PotashCorp 2017 Annual Report
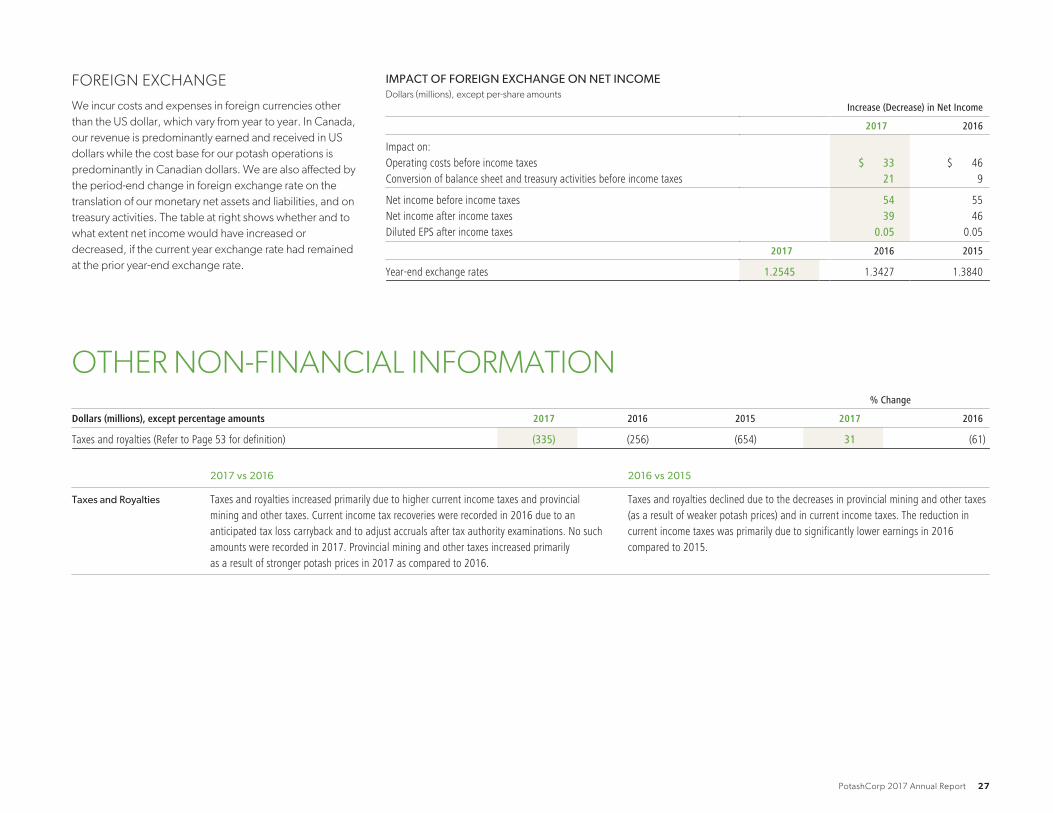
FOREIGN EXCHANGE
We incur costs and expenses in foreign currencies other
than the US dollar, which vary from year to year. In Canada,
our revenue is predominantly earned and received in US
dollars while the cost base for our potash operations is
predominantly in Canadian dollars. We are also affected by
the period-end change in foreign exchange rate on the
translation of our monetary net assets and liabilities, and on
treasury activities. The table at right shows whether and to
what extent net income would have increased or
decreased, if the current year exchange rate had remained
at the prior year-end exchange rate.
IMPACT OF FOREIGN EXCHANGE ON NET INCOMEDollars (millions), except per-share amounts
Increase (Decrease) in Net Income
2017 2016
Impact on:Operating costs before income taxes $ 33 $ 46Conversion of balance sheet and treasury activities before income taxes 21 9
Net income before income taxes 54 55Net income after income taxes 39 46Diluted EPS after income taxes 0.05 0.05
2017 2016 2015
Year-end exchange rates 1.2545 1.3427 1.3840
OTHER NON-FINANCIAL INFORMATION% Change
Dollars (millions), except percentage amounts 2017 2016 2015 2017 2016
Taxes and royalties (Refer to Page 53 for definition) (335) (256) (654) 31 (61)
2017 vs 2016 2016 vs 2015
Taxes and Royalties Taxes and royalties increased primarily due to higher current income taxes and provincialmining and other taxes. Current income tax recoveries were recorded in 2016 due to ananticipated tax loss carryback and to adjust accruals after tax authority examinations. No suchamounts were recorded in 2017. Provincial mining and other taxes increased primarilyas a result of stronger potash prices in 2017 as compared to 2016.
Taxes and royalties declined due to the decreases in provincial mining and other taxes(as a result of weaker potash prices) and in current income taxes. The reduction incurrent income taxes was primarily due to significantly lower earnings in 2016compared to 2015.
PotashCorp 2017 Annual Report 27

QUARTERLY RESULTSQUARTERLY RESULTS AND REVIEW OF FOURTH-QUARTER PERFORMANCE
(in millions of US dollars except as otherwise noted)
2017 2016
Q1 1 Q2 1 Q3 1 Q4 Total Q1 1 Q2 1 Q3 1 Q4 1 Total 1
Financial ResultsSales $ 1,112 $ 1,120 $ 1,234 $ 1,081 $ 4,547 $ 1,209 $ 1,053 $ 1,136 $ 1,058 $ 4,456Freight, transportation and distribution (133) (116) (172) (116) (537) (133) (118) (154) (130) (535)Cost of goods sold (711) (749) (832) (1,043) (3,335) (842) (692) (792) (765) (3,091)Gross margin 268 255 230 (78) 675 234 243 190 163 830Operating income (loss) 175 149 100 (215) 209 138 156 107 58 459Net income (loss) from continuing operations 106 152 16 (120) 154 55 78 53 13 199Net income (loss) 2 149 201 53 (76) 327 75 121 81 46 323Other comprehensive income (loss) 39 69 42 (54) 96 11 (184) 21 193 41Net income (loss) per share from continuing operations 3 0.13 0.18 0.02 (0.14) 0.18 0.07 0.09 0.06 0.02 0.24Net income (loss) per share 2, 3 0.18 0.24 0.06 (0.09) 0.39 0.09 0.14 0.10 0.05 0.38Cash provided by operating activities 223 328 293 381 1,225 188 424 295 353 1,260
Non-Financial ResultsProduction (KCl tonnes – thousands) 2,429 2,813 2,134 2,419 9,795 2,230 2,273 1,557 2,544 8,604Production (N tonnes – thousands) 771 728 749 765 3,013 771 789 799 788 3,147Production (P2O5 tonnes – thousands) 365 349 392 435 1,541 411 297 399 397 1,504PotashCorp’s total shareholder return percentage (5) (4) 19 8 17 2 (3) 2 12 12Product tonnes involved in customer complaints (thousands) 14 17 1 26 58 25 37 21 23 106Taxes and royalties $ 94 $ 80 $ 92 $ 69 $ 335 $ 78 $ 81 $ 40 $ 57 $ 256Employee turnover rate (percentage) 4 4 4 2 3 3 4 3 3 3Total recordable injury rate 0.95 0.85 0.77 0.79 0.85 1.15 0.69 0.92 0.74 0.87Total lost-time injury rate 0.05 0.04 0.21 0.08 0.11 0.20 0.04 – 0.04 0.08Environmental incidents 2 3 1 3 9 9 3 5 1 181 Certain amounts have been reclassified as a result of discontinued operations discussed in Note 19 of the consolidated financial statements.2 From continuing and discontinued operations.3 Basic and diluted net income per share for each quarter has been computed based on the weighted average number of shares issued and outstanding during the respective quarter; therefore, quarterly amounts may not add to the annual total. Per-share calculations are based ondollar and share amounts each rounded to the nearest thousand.
The company’s sales of fertilizer can be seasonal. Typically, fertilizer sales are highest in the second quarter of the year, due to the Northern Hemisphere’s spring planting season. However, planting conditions and the timing of customer purchases will vary each year, and fertilizersales can be expected to shift from one quarter to another. Feed and industrial sales are more evenly distributed throughout the year.
Highlights of our 2017 fourth quarter compared to the same
quarter in 2016 include (direction of arrows refers to impact
on comprehensive income):
K Potash
▲ Potash gross margin increased primarily due to higher
prices and reduced per-tonne costs.
▼ Sales volumes were lower as North America shipments
fell, while offshore shipments also decreased. The
majority of Canpotex’s shipments were to China
(28 percent) and Other Asian markets outside of China
and India (28 percent), while Latin America and India
accounted for 25 percent and 11 percent, respectively.
▲ Our average realized potash price increased, as strong
customer engagement in all key markets continued to
support prices.
▲ Average per-tonne manufactured cost of goods sold was
lower primarily due to an unfavorable adjustment to asset
retirement obligations recorded in 2016.
28 PotashCorp 2017 Annual Report

N Nitrogen
▲ Gross margin increased as stronger prices more than
offset higher per-tonne costs.
▼ Total sales volumes were down primarily due to lower
availability of product related to a turnaround at our
Augusta facility.
▲ Our average realized price was up primarily due to
global pricing support from lower Chinese urea exports
and ammonia production curtailments in key exporting
regions.
▼ Cost of goods sold was up, primarily as a result of higher
natural gas costs in Trinidad.
P Phosphate
▼ Negative gross margin was lower primarily due to non-
cash impairment charges.
▲ Sales volumes increased, mainly due to higher
availability of our fertilizer products.
▼ Our average realized phosphate price per tonne was
down as higher prices for fertilizer products were more
than offset by lower realizations for our feed and
industrial products.
▼ Cost of goods sold was significantly higher,
predominantly due to impairment charges at our White
Springs and feed plant facilities.F Note 13
Sales Tonnes (thousands) Average Net Sales Price per MT
Three months ended December 31 2017 2016 % Change 2017 2016 % Change
PotashManufactured Product
North America 568 720 (21) $ 214 $ 176 22Offshore 1,340 1,489 (10) $ 169 $ 148 14
Manufactured Product 1,908 2,209 (14) $ 182 $ 157 16
NitrogenManufactured Product
Ammonia 505 477 6 $ 270 $ 213 27Urea 283 304 (7) $ 288 $ 245 18Solutions, nitric acid, ammonium nitrate 795 855 (7) $ 138 $ 142 (3)
Manufactured Product 1,583 1,636 (3) $ 207 $ 182 14
PhosphateManufactured Product
Fertilizer 534 472 13 $ 342 $ 328 4Feed and Industrial 239 243 (2) $ 483 $ 551 (12)
Manufactured Product 773 715 8 $ 385 $ 404 (5)
-400
-200
0
200
400
Q4Q3Q2Q1 2017
Q4Q3Q2Q1 2016
Potash Nitrogen PhosphatePotash Nitrogen Phosphate
Source: PotashCorp
SEGMENT GROSS MARGIN($ millions)
Other Financial Results
Transaction costs during the fourth quarter of 2017 were
$51 million (2016 – $10 million).
The actual effective tax rate, including discrete items, was
56 percent (2016 – not meaningful). Compared to the
same period last year, earnings were significantly lower in
the United States and only slightly offset by increased
earnings in Trinidad. Discrete tax recoveries were
$118 million in the fourth quarter of 2017 compared to
$6 million in the fourth quarter of 2016.
Other comprehensive loss in the fourth quarter of 2017
was mainly the result of decreases in the fair value of our
investments in ICL and Sinofert exceeding net actuarial
gains from a remeasurement of our defined benefit plans.
Other comprehensive income in the fourth quarter of 2016
was mainly the result of a remeasurement of our defined
benefit plans and an increase in the fair value of our
investments in ICL and Sinofert.
PotashCorp 2017 Annual Report 29
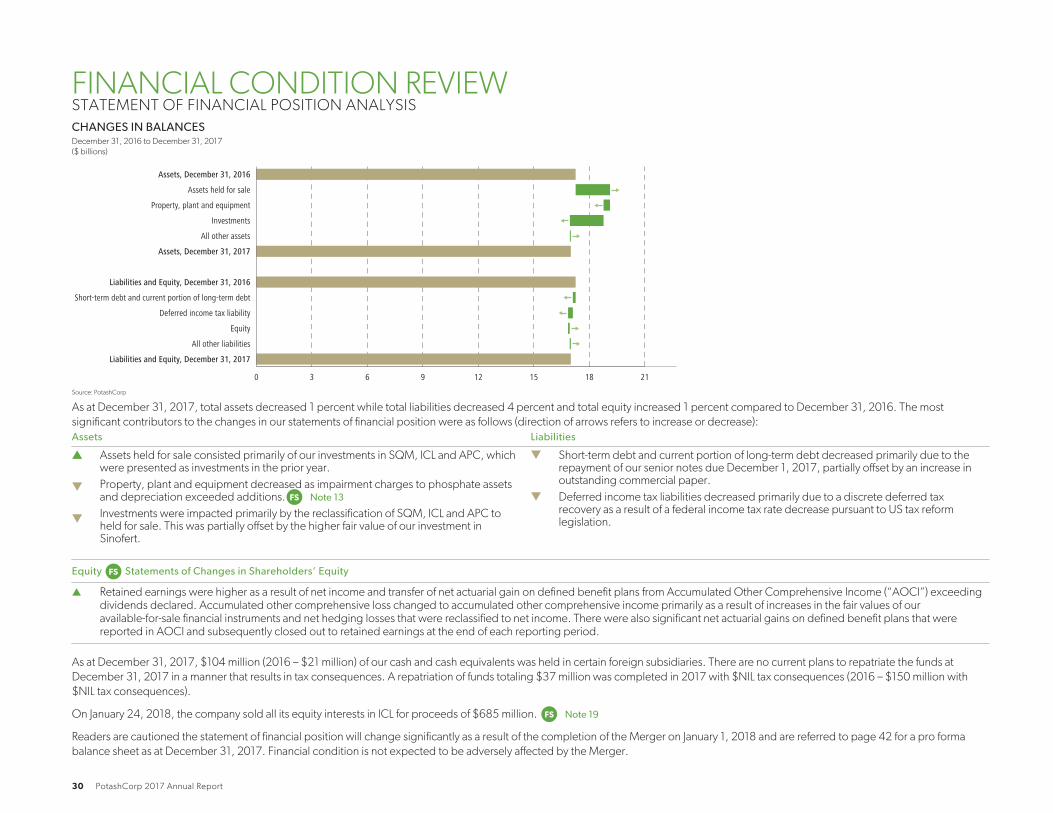
FINANCIAL CONDITION REVIEWSTATEMENT OF FINANCIAL POSITION ANALYSIS
0 3 6 9 12 15 18 21
Liabilities and Equity, December 31, 2017
All other liabilities
Equity
Deferred income tax liability
Short-term debt and current portion of long-term debt
Liabilities and Equity, December 31, 2016
Assets, December 31, 2017
All other assets
Investments
Property, plant and equipment
Assets held for sale
Assets, December 31, 2016
Source: PotashCorp
CHANGES IN BALANCESDecember 31, 2016 to December 31, 2017
($ billions)
As at December 31, 2017, total assets decreased 1 percent while total liabilities decreased 4 percent and total equity increased 1 percent compared to December 31, 2016. The most
significant contributors to the changes in our statements of financial position were as follows (direction of arrows refers to increase or decrease):
Assets Liabilities
▲
▼
▼
Assets held for sale consisted primarily of our investments in SQM, ICL and APC, whichwere presented as investments in the prior year.
Property, plant and equipment decreased as impairment charges to phosphate assetsand depreciation exceeded additions.F Note 13
Investments were impacted primarily by the reclassification of SQM, ICL and APC toheld for sale. This was partially offset by the higher fair value of our investment inSinofert.
▼ Short-term debt and current portion of long-term debt decreased primarily due to therepayment of our senior notes due December 1, 2017, partially offset by an increase inoutstanding commercial paper.
▼ Deferred income tax liabilities decreased primarily due to a discrete deferred taxrecovery as a result of a federal income tax rate decrease pursuant to US tax reformlegislation.
Equity F Statements of Changes in Shareholders’ Equity
▲ Retained earnings were higher as a result of net income and transfer of net actuarial gain on defined benefit plans from Accumulated Other Comprehensive Income (“AOCI”) exceeding
dividends declared. Accumulated other comprehensive loss changed to accumulated other comprehensive income primarily as a result of increases in the fair values of our
available-for-sale financial instruments and net hedging losses that were reclassified to net income. There were also significant net actuarial gains on defined benefit plans that were
reported in AOCI and subsequently closed out to retained earnings at the end of each reporting period.
As at December 31, 2017, $104 million (2016 – $21 million) of our cash and cash equivalents was held in certain foreign subsidiaries. There are no current plans to repatriate the funds at
December 31, 2017 in a manner that results in tax consequences. A repatriation of funds totaling $37 million was completed in 2017 with $NIL tax consequences (2016 – $150 million with
$NIL tax consequences).
On January 24, 2018, the company sold all its equity interests in ICL for proceeds of $685 million. F Note 19
Readers are cautioned the statement of financial position will change significantly as a result of the completion of the Merger on January 1, 2018 and are referred to page 42 for a pro forma
balance sheet as at December 31, 2017. Financial condition is not expected to be adversely affected by the Merger.
30 PotashCorp 2017 Annual Report

LIQUIDITY AND CAPITAL RESOURCES
The following section explains how we manage our cash and capital resources to carry out our strategy and deliver results.
Liquidity risk arises from our general funding needs and in the management of our assets, liabilities and capital structure. We manage liquidity risk to maintain sufficient liquid financial resources
to fund our financial position and meet our commitments and obligations in a cost-effective manner.
Liquidity needs can be met through a variety of sources, excluding the effects of the Merger,
including:
Our primary uses of funds are:
• operational expenses;
• cash generated from operations; • sustaining and opportunity capital spending;
• drawdowns under our revolving credit facility; • intercorporate investments;
• issuances of commercial paper; • dividends and interest;
• short-term borrowings under our line of credit; and • principal payments on our debt securities; and
• proceeds from sales of investments. • share repurchases.
We expect Nutrien’s liquidity needs will continue to be met through similar sources and that its primary uses of funds will be similar to our historical uses, although no assurances can be
provided. Based on a forecasted exchange rate of 1.26 Canadian dollars per US dollar in 2018, Nutrien expects to incur capital expenditures, including capitalized interest, of approximately
$1,055 to sustain operations at existing levels and for major repairs and maintenance (including plant turnarounds). Nutrien has announced plans for a growing and sustainable dividend of
40-60 percent of its free cash flow, depending on the agricultural cycle.
CASH REQUIREMENTS
The following aggregated information about our contractual obligations and other commitments summarizes certain of our liquidity and capital resource requirements as of December 31,
2017. The information presented in the table below does not include obligations that have original maturities of less than one year, planned (but not legally committed) capital expenditures, or
potential share repurchases, nor does it give effect to any matters that may be impacted as a result of the completion of the Merger.
CONTRACTUAL OBLIGATIONS AND OTHER COMMITMENTSDollars (millions) at December 31, 2017
Payments Due by Period
F Total Within 1 Year 1 to 3 Years 3 to 5 Years Over 5 Years
Long-term debt obligations 1 Note 21 $ 3,750 $ – $ 1,000 $ – $ 2,750Estimated interest payments on long-term debt obligations 1,792 178 295 242 1,077Operating leases Note 24 501 85 129 105 182Purchase commitments 2 Note 24 303 303 – – –Capital commitments Note 24 41 18 13 10 –Other commitments Note 24 159 44 49 42 24Asset retirement obligations and environmental costs 3 Note 18 723 72 152 103 396Other long-term liabilities 4 Notes 8, 17, 26 2,846 79 71 85 2,611
Total $ 10,115 $ 779 $ 1,709 $ 587 $ 7,0401 Long-term debt consists of $3,750 million of senior notes that were issued under US shelf registration statements. The estimated interest payments on long-term debt in the above table include our cumulative scheduled interest payments on fixed and variable rate long-term debt.
Interest on variable rate debt is based on interest rates prevailing at December 31, 2017.2 Purchase commitments include $94 million of natural gas contracts in Trinidad that will expire in 2018. As new contracts for future operations have not yet been completed, there are no commitments presented beyond one year at this time.3 Commitments associated with our asset retirement obligations are expected to occur principally over the next 85 years for phosphate (with the majority taking place over the next 35 years) and between 40 and 360 years for potash. Environmental costs consist of restoration
obligations, which are expected to occur through 2031.4 Other long-term liabilities consist primarily of pension and other post-retirement benefits, derivative instruments, income taxes and deferred income taxes. Deferred income tax liabilities may vary according to changes in tax laws, tax rates and the operating results of the company.
Since it is impractical to determine whether there will be a cash impact in any particular year, all deferred income tax liabilities have been reflected as other long-term liabilities in the Over 5 Years category.
PotashCorp 2017 Annual Report 31
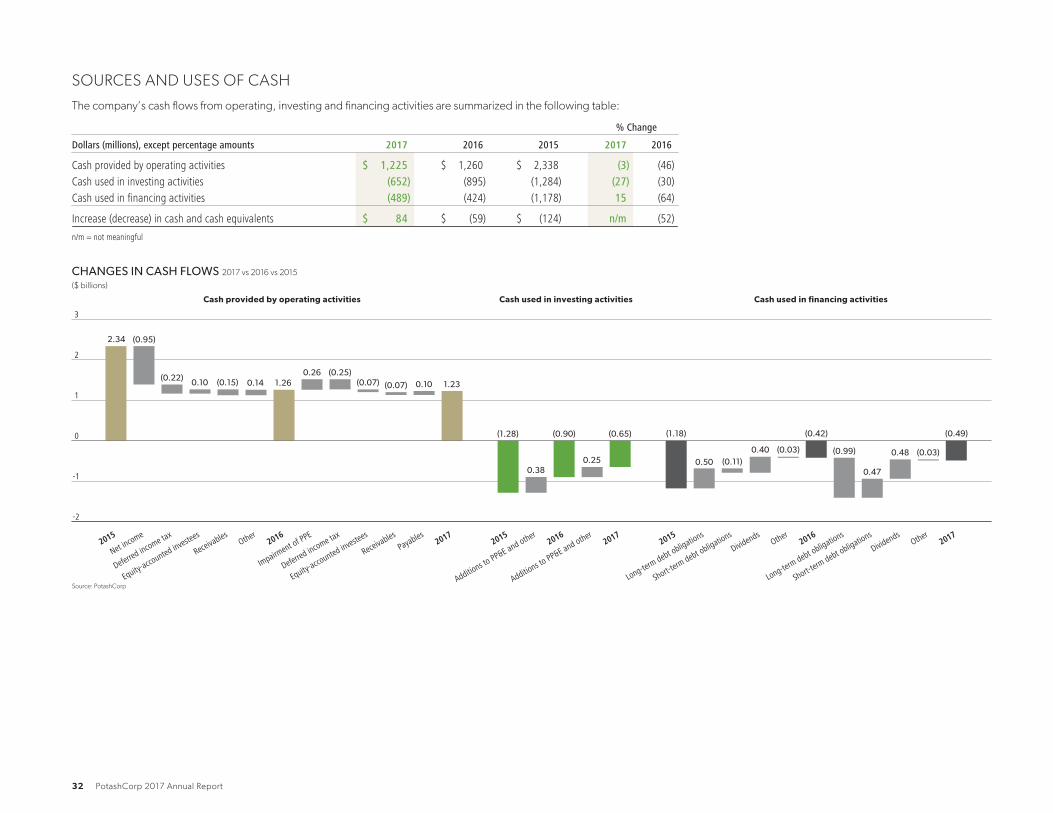
SOURCES AND USES OF CASH
The company’s cash flows from operating, investing and financing activities are summarized in the following table:
% Change
Dollars (millions), except percentage amounts 2017 2016 2015 2017 2016
Cash provided by operating activities $ 1,225 $ 1,260 $ 2,338 (3) (46)Cash used in investing activities (652) (895) (1,284) (27) (30)Cash used in financing activities (489) (424) (1,178) 15 (64)
Increase (decrease) in cash and cash equivalents $ 84 $ (59) $ (124) n/m (52)
n/m = not meaningful
-2
-1
0
1
2
3
2017Other
Dividends
Short-term debt obligations
Long-term debt obligations2016
Other
Dividends
Short-term debt obligations
Long-term debt obligations2015
2017
Additions to
PP&E and other2016
Additions to
PP&E and other2015
2017Payables
Receivables
Equity-acco
unted investees
Deferred income tax
Impairment of PPE
2016Other
Receivables
Equity-acco
unted investees
Deferred income tax
Net income
2015
Source: PotashCorp
CHANGES IN CASH FLOWS 2017 vs 2016 vs 2015
($ billions)
2.34 (0.95)
(0.22)0.26 (0.25)
(0.07) (0.07) 0.10 1.230.10 (0.15) 0.14 1.26
(1.28)
0.380.25
(0.90) (0.65) (1.18) (0.42) (0.49)
0.50 (0.11)0.40 (0.03) (0.99)
0.47
0.48 (0.03)
Cash provided by operating activities Cash used in investing activities Cash used in financing activities
32 PotashCorp 2017 Annual Report
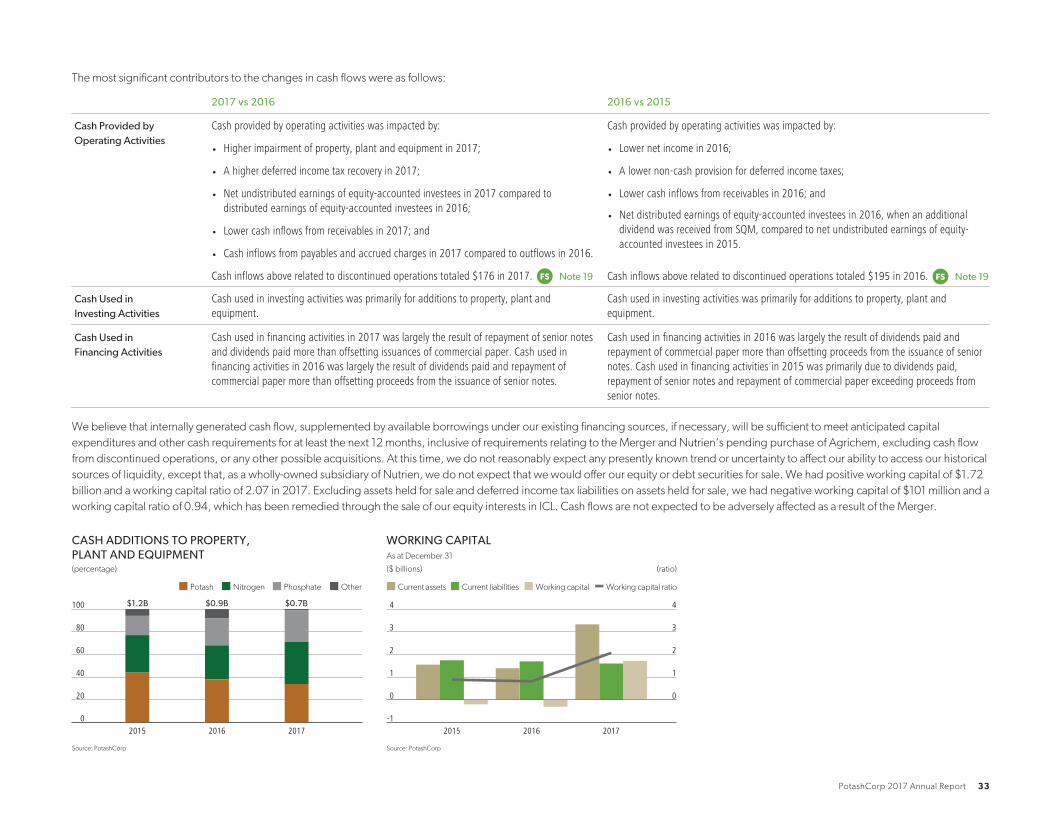
The most significant contributors to the changes in cash flows were as follows:
2017 vs 2016 2016 vs 2015
Cash Provided byOperating Activities
Cash provided by operating activities was impacted by: Cash provided by operating activities was impacted by:
• Higher impairment of property, plant and equipment in 2017; • Lower net income in 2016;
• A higher deferred income tax recovery in 2017;
• Net undistributed earnings of equity-accounted investees in 2017 compared todistributed earnings of equity-accounted investees in 2016;
• A lower non-cash provision for deferred income taxes;
• Lower cash inflows from receivables in 2016; and
• Lower cash inflows from receivables in 2017; and
• Cash inflows from payables and accrued charges in 2017 compared to outflows in 2016.
Cash inflows above related to discontinued operations totaled $176 in 2017. F Note 19
• Net distributed earnings of equity-accounted investees in 2016, when an additionaldividend was received from SQM, compared to net undistributed earnings of equity-accounted investees in 2015.
Cash inflows above related to discontinued operations totaled $195 in 2016. F Note 19
Cash Used inInvesting Activities
Cash used in investing activities was primarily for additions to property, plant andequipment.
Cash used in investing activities was primarily for additions to property, plant andequipment.
Cash Used inFinancing Activities
Cash used in financing activities in 2017 was largely the result of repayment of senior notesand dividends paid more than offsetting issuances of commercial paper. Cash used infinancing activities in 2016 was largely the result of dividends paid and repayment ofcommercial paper more than offsetting proceeds from the issuance of senior notes.
Cash used in financing activities in 2016 was largely the result of dividends paid andrepayment of commercial paper more than offsetting proceeds from the issuance of seniornotes. Cash used in financing activities in 2015 was primarily due to dividends paid,repayment of senior notes and repayment of commercial paper exceeding proceeds fromsenior notes.
We believe that internally generated cash flow, supplemented by available borrowings under our existing financing sources, if necessary, will be sufficient to meet anticipated capital
expenditures and other cash requirements for at least the next 12 months, inclusive of requirements relating to the Merger and Nutrien’s pending purchase of Agrichem, excluding cash flow
from discontinued operations, or any other possible acquisitions. At this time, we do not reasonably expect any presently known trend or uncertainty to affect our ability to access our historical
sources of liquidity, except that, as a wholly-owned subsidiary of Nutrien, we do not expect that we would offer our equity or debt securities for sale. We had positive working capital of $1.72
billion and a working capital ratio of 2.07 in 2017. Excluding assets held for sale and deferred income tax liabilities on assets held for sale, we had negative working capital of $101 million and a
working capital ratio of 0.94, which has been remedied through the sale of our equity interests in ICL. Cash flows are not expected to be adversely affected as a result of the Merger.
0
20
40
60
80
100
201720162015
Phosphate OtherPotash Nitrogen
-1
0
1
2
3
4
201720162015
Source: PotashCorp
CASH ADDITIONS TO PROPERTY, PLANT AND EQUIPMENT(percentage)
$1.2B $0.9B $0.7B
0
1
2
3
4
Source: PotashCorp
WORKING CAPITALAs at December 31
($ billions) (ratio)
Current assets Current liabilities Working capital Working capital ratio
PotashCorp 2017 Annual Report 33
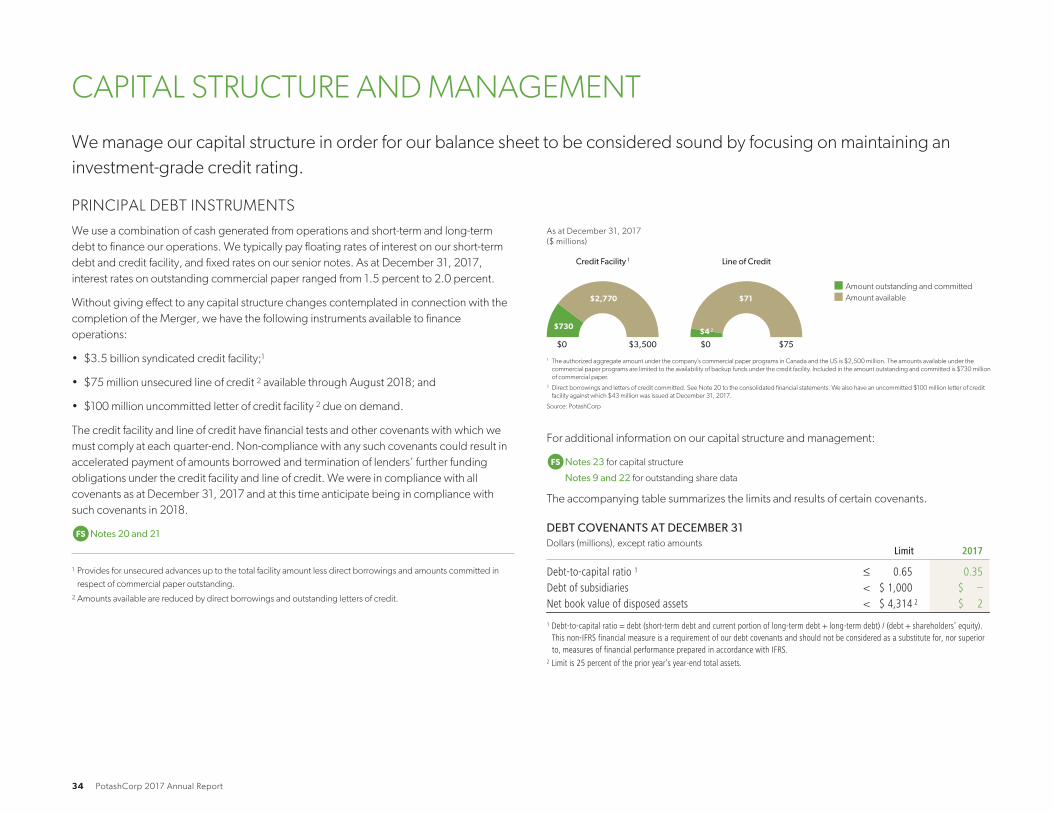
CAPITAL STRUCTURE AND MANAGEMENT
We manage our capital structure in order for our balance sheet to be considered sound by focusing on maintaining an
investment-grade credit rating.
PRINCIPAL DEBT INSTRUMENTS
We use a combination of cash generated from operations and short-term and long-term
debt to finance our operations. We typically pay floating rates of interest on our short-term
debt and credit facility, and fixed rates on our senior notes. As at December 31, 2017,
interest rates on outstanding commercial paper ranged from 1.5 percent to 2.0 percent.
Without giving effect to any capital structure changes contemplated in connection with the
completion of the Merger, we have the following instruments available to finance
operations:
• $3.5 billion syndicated credit facility;1
• $75 million unsecured line of credit 2 available through August 2018; and
• $100 million uncommitted letter of credit facility 2 due on demand.
The credit facility and line of credit have financial tests and other covenants with which we
must comply at each quarter-end. Non-compliance with any such covenants could result in
accelerated payment of amounts borrowed and termination of lenders’ further funding
obligations under the credit facility and line of credit. We were in compliance with all
covenants as at December 31, 2017 and at this time anticipate being in compliance with
such covenants in 2018.
FNotes 20 and 21
1 Provides for unsecured advances up to the total facility amount less direct borrowings and amounts committed in
respect of commercial paper outstanding.
2 Amounts available are reduced by direct borrowings and outstanding letters of credit.
As at December 31, 2017
($ millions)
Credit Facility 1
$0
$730
$2,770 $71
$4 2
$3,500 $0 $75
Line of Credit
Amount outstanding and committed
Amount available
1 The authorized aggregate amount under the company’s commercial paper programs in Canada and the US is $2,500 million. The amounts available under the
commercial paper programs are limited to the availability of backup funds under the credit facility. Included in the amount outstanding and committed is $730 million
of commercial paper.
2 Direct borrowings and letters of credit committed. See Note 20 to the consolidated financial statements. We also have an uncommitted $100 million letter of credit
facility against which $43 million was issued at December 31, 2017.
Source: PotashCorp
For additional information on our capital structure and management:
FNotes 23 for capital structure
Notes 9 and 22 for outstanding share data
The accompanying table summarizes the limits and results of certain covenants.
DEBT COVENANTS AT DECEMBER 31Dollars (millions), except ratio amounts
Limit 2017
Debt-to-capital ratio 1 ≤ 0.65 0.35Debt of subsidiaries < $ 1,000 $ –Net book value of disposed assets < $ 4,314 2 $ 2
1 Debt-to-capital ratio = debt (short-term debt and current portion of long-term debt + long-term debt) / (debt + shareholders’ equity).This non-IFRS financial measure is a requirement of our debt covenants and should not be considered as a substitute for, nor superiorto, measures of financial performance prepared in accordance with IFRS.
2 Limit is 25 percent of the prior year’s year-end total assets.
34 PotashCorp 2017 Annual Report

Our ability to access reasonably priced debt in the capital markets is dependent, in part, on
the quality of our credit ratings. We continue to maintain investment-grade credit ratings for
our long-term debt. A downgrade of the credit rating of our long-term debt would increase
the interest rates applicable to borrowings under our credit facility and our line of credit.
Commercial paper markets are normally a source of same-day cash for the company. Our
access to the US commercial paper market primarily depends on maintaining our current
short-term credit ratings as well as general conditions in the money markets.
Long-Term Debt Short-Term Debt
Rating (Outlook) Rating
At December 31 2017 2016 2017 2016
Moody’s Baa1 (negative) 1 Baa1 (negative) P-2 P-2Standard & Poor’s BBB+ (negative) BBB+ (stable) A-2 2 A-2 2
1 Subsequent to December 31,2017, Moody’s assigned a Baa2 (stable) rating.2 S&P assigned a global commercial paper rating of A-2, but rated our commercial paper A-1 (low) on a Canadian scale.
A security rating is not a recommendation to buy, sell or hold securities. Such ratings may be
subject to revision or withdrawal at any time by the respective credit rating agency and each
rating should be evaluated independently of any other rating.
Our $3,750 million of senior notes were issued under US shelf registration statements. A
downgrade in the company’s credit ratings below investment-grade following the Merger
or other transaction involving a change in control within a certain period of time following
the change in control could trigger a change in control offer under existing debt securities,
except for the notes issued in 2016, and the company could be required to make an offer to
purchase all, or any part, of the senior notes at 101 percent of the $3,250 million
outstanding principal amount of the notes to be repurchased, plus accrued and unpaid
interest.
For 2017, our weighted average cost of capital was 6.6 percent (2016 – 7.3 percent), of
which 76 percent represented the cost of equity (2016 – 75 percent).
OFF-BALANCE SHEET ARRANGEMENTS
In the normal course of operations, PotashCorp engages in a variety of transactions that,
under IFRS, are either not recorded on our consolidated statements of financial position or
are recorded at amounts that differ from the full contract amounts. Principal off-balance
sheet activities include operating leases, agreement to reimburse losses of Canpotex,
issuance of guarantee contracts, certain derivative instruments and long-term contracts. We
do not reasonably expect any presently known trend or uncertainty to affect our ability to
continue using these arrangements, which are discussed below and exclude the impact of
the Merger.
Derivative Instruments
We use derivative financial instruments to manage exposure to commodity price and
exchange rate fluctuations. Except for certain non-financial derivatives that were entered
into and continued to be held for the purpose of the receipt or delivery of a non-financial
item in accordance with expected purchase, sale or usage requirements, derivatives are
recorded on the consolidated statements of financial position at fair value and
marked-to-market each reporting period regardless of whether they are designated as
hedges for IFRS purposes.
F Note 17
Leases and Long-Term Contracts
Certain of our long-term raw materials agreements contain fixed price and/or volume
components. Our significant agreements, and the related obligations under such
agreements, are discussed in Cash Requirements on Page 31.
Additional information about our off-balance sheet arrangements:
F Note 25 for guarantee contracts
Note 30 for contingencies related to Canpotex
PotashCorp 2017 Annual Report 35

OTHER FINANCIAL INFORMATIONExcluding the impact of the Merger.
MARKET RISKS ASSOCIATED WITH FINANCIAL INSTRUMENTS
Market risk is the potential for loss from adverse changes in the market value of financial
instruments. The level of market risk to which we are exposed varies depending on the
composition of our derivative instrument portfolio, as well as current and expected
market conditions.
F Note 29 for financial risks, including relevant risk sensitivities
a Page 20 – Risk Factors
CRITICAL ACCOUNTING ESTIMATES
Our discussion and analysis of our financial condition and results of operations are based upon
our consolidated financial statements, which have been prepared in accordance with IFRS.
Our significant accounting policies and accounting estimates are contained in the consolidated
financial statements. Certain of these policies, such as long-lived asset impairment,
reclassification of investments as held for sale and discontinued operations, derivative
instruments, provisions and contingencies for asset retirement, environmental and other
obligations, and capitalization and depreciation of property, plant and equipment, involve
critical accounting estimates because they require us to make subjective or complex judgments
about matters that are inherently uncertain and because of the likelihood that materially different
amounts could be reported under different conditions or using different assumptions.
The company identified indicators of potential impairment in its operations in the fourth
quarter of 2017. See Note 13 to the consolidated financial statements for impairments
recorded during 2017.
The following table highlights sensitivities to recoverable amounts which could result in
additional impairment losses or reversals of previously recorded losses across cash-
generating units (“CGUs”) within the phosphate segment that had impairment indicators for
which significant judgment and estimates were required:
IMPAIRMENT SENSITIVITIES 1
At December 31, 2017
Dollars (millions), except as noted
PotentialChange
Increase (Decrease)to
Recoverable Amount
Phosphate sales prices ± 1% 2 ±$ 21Discount rate ± 0.5% ±$ 5Ammonia costs ±$ 20/tonne ±$ 3
1 These sensitivities are hypothetical, should be used with caution and cannot be extrapolated because the relationship of the change inassumption to the change in amounts may not be linear. The sensitivities have been calculated independently of changes in other keyvariables. Changes in one factor may result in changes in another, which could amplify or reduce certain sensitivities.
2 Distributed evenly over all periods.
We have discussed the development, selection and application of our key accounting
policies, and the critical accounting estimates and assumptions they involve, with the audit
committee of the Board.
Refer to Note 31 to the consolidated financial statements for recent accounting changes and
effective dates. The company is in the process of finalizing its implementation plan of IFRS
15, Revenue from Contracts with Customers, which will be adopted using the modified
retrospective method. We expect revenue recognition to remain largely unchanged and do
not anticipate any significant impacts in our underlying profitability trends. Key areas are
undergoing final review and we do not expect any significant changes as a result. Our key
areas include: principal versus agent relationships, variable priced contracts, shipping as a
separate performance obligation, required disclosures and documentation and
implementation of changes to key controls.
The company expects to complete scoping of the IFRS 16 Leases implementation in 2018.
The company has a number of operating leases that are not currently recorded on the
statement of financial position and we expect, upon implementation of IFRS 16, additional
assets and liabilities will be recorded. In addition, we expect a component of lease-related
costs to move from cost of goods sold to interest expense on the statement of operations.
F Notes 2 and 31 for accounting policies, estimates and judgments
Additional financial information:
F Note 31 for recent accounting changes and effective dates
Note 28 for related party transactions
36 PotashCorp 2017 Annual Report

CONTROLS AND PROCEDURES
DISCLOSURE CONTROLS AND PROCEDURES
As of December 31, 2017, we carried out an evaluation under the supervision and with the
participation of our management, including our Chief Executive Officer and Chief Financial
Officer, of the effectiveness of the design and operation of our disclosure controls and
procedures. There are inherent limitations to the effectiveness of any system of disclosure
controls and procedures, including the possibility of human error and the circumvention or
overriding of the controls and procedures. Accordingly, even effective disclosure controls
and procedures can only provide reasonable assurance of achieving their control objectives.
Based upon that evaluation and as of December 31, 2017, the Chief Executive Officer and
Chief Financial Officer concluded that the disclosure controls and procedures were effective
to provide reasonable assurance that information required to be disclosed in the reports the
company files and submits under securities legislation is recorded, processed, summarized
and reported as and when required and that such information is accumulated and
communicated to our management, including our Chief Executive Officer and Chief
Financial Officer, as appropriate to allow timely decisions regarding required disclosure.
INTERNAL CONTROL OVER FINANCIAL REPORTING
See “Management’s Report on Internal Control Over Financial Reporting” and the “Reports
of Independent Registered Public Accounting Firm” contained on pages 55 and 56 in our
consolidated financial statements for the year ended December 31, 2017.
PotashCorp 2017 Annual Report 37
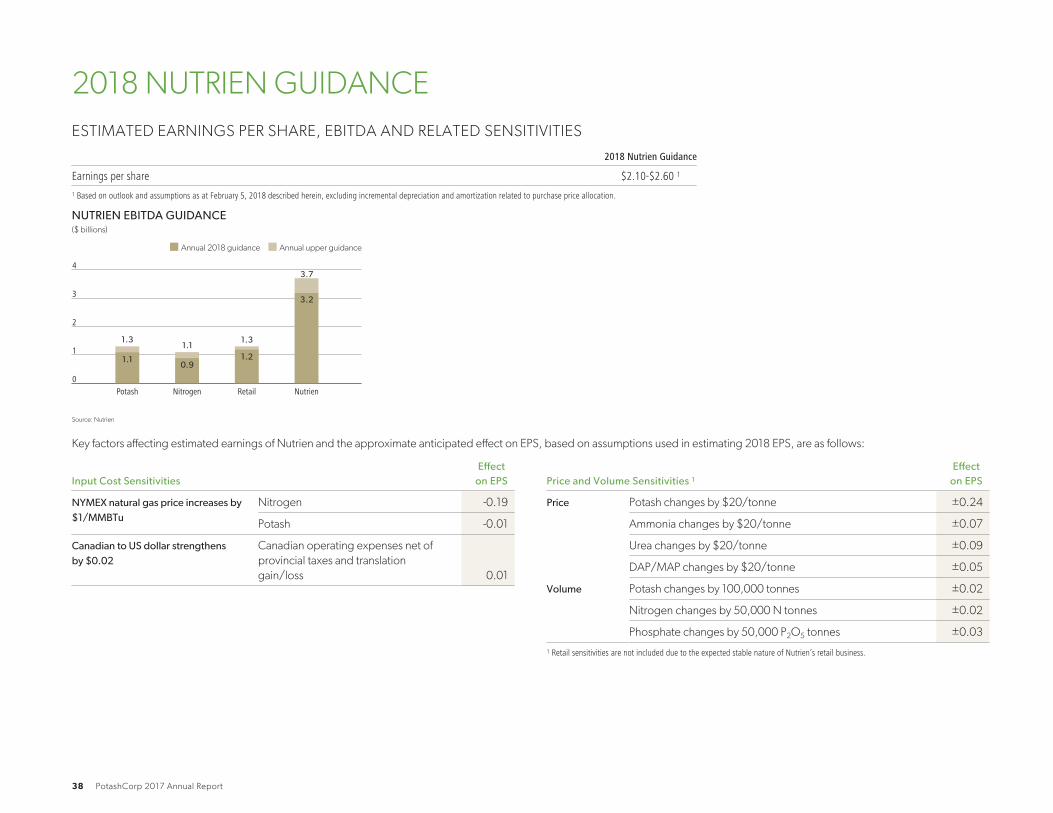
2018 NUTRIEN GUIDANCE
ESTIMATED EARNINGS PER SHARE, EBITDA AND RELATED SENSITIVITIES
2018 Nutrien Guidance
Earnings per share $2.10-$2.60 1
1 Based on outlook and assumptions as at February 5, 2018 described herein, excluding incremental depreciation and amortization related to purchase price allocation.
0
1
2
3
4
NutrienRetailNitrogenPotash
Annual 2018 guidance Annual upper guidance
Source: Nutrien
NUTRIEN EBITDA GUIDANCE($ billions)
1.31.1
1.3
3.7
1.10.9
1.2
3.2
Key factors affecting estimated earnings of Nutrien and the approximate anticipated effect on EPS, based on assumptions used in estimating 2018 EPS, are as follows:
Input Cost SensitivitiesEffect
on EPS
NYMEX natural gas price increases by$1/MMBTu
Nitrogen -0.19
Potash -0.01
Canadian to US dollar strengthensby $0.02
Canadian operating expenses net of
provincial taxes and translation
gain/loss 0.01
Price and Volume Sensitivities 1
Effecton EPS
Price Potash changes by $20/tonne ±0.24
Ammonia changes by $20/tonne ±0.07
Urea changes by $20/tonne ±0.09
DAP/MAP changes by $20/tonne ±0.05
Volume Potash changes by 100,000 tonnes ±0.02
Nitrogen changes by 50,000 N tonnes ±0.02
Phosphate changes by 50,000 P2O5 tonnes ±0.03
1 Retail sensitivities are not included due to the expected stable nature of Nutrien’s retail business.
38 PotashCorp 2017 Annual Report

NUTRIEN PRO FORMA EARNINGS AND BALANCE SHEET
Management prepared a non-IFRS pro forma statement of earnings to show 2017 earnings
information had the Merger taken place on January 1, 2017, and a non-IFRS pro forma
balance sheet to show 2017 figures had the Merger taken place on December 31,2017. The
balance sheet has not been adjusted for the earnings impacts presented in the pro forma
statement of earnings. This pro forma information is expected to be used by management to
evaluate the earnings performance of Nutrien. Historical financial statements of PotashCorp
and Agrium, both prepared under IFRS, were combined and then adjusted to eliminate
intercompany transactions, reclassify line items in accordance with Nutrien’s expected
method of presentation and remove transactions directly attributable to the Merger,
including required divestitures. The pro forma financial statements are presented for
illustrative purposes only and do not include, among other things, estimated cost synergies,
adjustments related to restructuring or integration activities, further acquisitions or disposals,
or impacts of Merger-related change in control provisions that are currently not factually
supportable and/or probable of occurring.
Generally, IFRS requires statements of earnings, comprehensive income, cash flows,
shareholders’ equity, balance sheet and associated notes with relevant comparative figures.
In evaluating these figures, investors should consider that the methodology applied in
presenting such information may differ among companies and analysts. For additional
information regarding preparation of these pro forma financial statements, see appendix A to
Nutrien’s business acquisition report dated February 20, 2018.
Management believes the 2017 pro forma earnings and balance sheet information for
Nutrien provides useful supplemental information to investors to evaluate financial
performance using the same measures as management. Management believes that, as a
result, the investor is afforded greater transparency in assessing the financial performance of
Nutrien. These amounts have not been audited and should not be considered as substitute
for, nor superior to, financial statements prepared in accordance with IFRS. The preparation
of pro forma financial information necessarily requires estimates, assumptions and
judgments.
No assurances can be provided that actual results or financial condition will not differ
materially from the pro forma amounts set forth herein.
F Note 32 Merger of Equals with Agrium
PotashCorp 2017 Annual Report 39

NUTRIEN PRO FORMA CONDENSED COMBINED STATEMENT OF EARNINGS FOR THE TWELVE MONTHS ENDED DECEMBER 31, 2017
HistoricalPotashCorp
HistoricalAgrium Divestitures 1
Pro formaAdjustments
CombinedPro forma
Sales $ 4,547 $13,766 $ – $ (71) 2 $ 18,242Freight, transportation and distribution (537) (346) – – (883)Cost of goods sold (3,335) (9,994) – 68 2 (13,261)
Gross Margin 675 3,426 – (3) 4,098Selling expenses (30) (2,014) – – (2,044)General and administrative expenses (184) (316) – 1 3, 7 (499)Provincial mining and other taxes (151) (13) – – (164)Earnings of equity-accounted investees 7 39 – – 46Other expenses (108) (141) – 178 4 (71)
Earnings before Finance Costs and Income Taxes 209 981 – 176 1,366Finance costs (238) (276) – 44 5 (470)
(Loss) Earnings before Income Taxes (29) 705 – 220 896Income tax recovery (expense) 183 (203) – (60) 6 (80)
Earnings from Continuing Operations 154 502 – 160 816Net earnings (loss) from discontinued operations 173 (187) 14 – –
Net Earnings $ 327 $ 315 $ 14 $ 160 $ 816
Net Earnings per ShareBasic $ 1.27Diluted $ 1.27
Weighted average shares outstanding for basic EPS 644,150,000Weighted average shares outstanding for diluted EPS 644,420,0001 Net earnings (loss) from discontinued operations was adjusted as if the required divestitures of SQM, APC, ICL and the Conda Idaho phosphate production facility and adjacent phosphate mineral rights, resulting from the Merger, had taken place on January 1, 2017.2 Intercompany sales and related costs were eliminated.3 Change in control payments for Agrium executives were eliminated.4 Transaction costs related directly to the Merger were eliminated.5 Finance costs were reduced as a result of amortizing the change in carrying amount of Agrium’s debt using the effective interest rate method.6 Taxes were adjusted to reflect the impact of the above noted items.7 General and administrative expenses were adjusted to reflect expenses incurred directly by Nutrien.
40 PotashCorp 2017 Annual Report

POTASHCORP STATEMENT OF INCOME RECLASSIFICATIONS FOR THE TWELVEMONTHS ENDED DECEMBER 31, 2017
PotashCorp BeforeReclassifications
ReclassificationAmounts
PotashCorp AfterReclassifications
Sales $ 4,547 $ – $ 4,547Freight, transportation and
distribution (537) – (537)Cost of goods sold (3,335) – (3,335)
Gross Margin 675 – 675Selling and administrative expenses (214) 214 2 –Selling expenses – (30) 2 (30)General and administrative expenses – (184) 2 (184)Provincial mining and other taxes (151) – (151)Earnings of equity-accounted
investees – 7 3 7Transaction costs (84) 84 4 –Other expenses (17) (91) 3, 4 (108)
Operating Income 209 – 209Finance costs (238) – (238)
Loss before Income Taxes (29) – (29)Income tax recovery 183 – 183
Net Income from Continuing
Operations 154 – 154Net income from discontinued
operations 173 – 173
Net Income 1 $ 327 $ – $ 3271 Nutrien uses the terminology “Net Earnings”.2 Selling expenses and general and administrative expenses were disaggregated from selling and administrative expenses.3 Earnings of equity-accounted investees was disaggregated from other expenses.4 Transaction costs relating to the Merger were aggregated with other expenses.
AGRIUM STATEMENT OF OPERATIONS RECLASSIFICATIONS FOR THE TWELVEMONTHS ENDED DECEMBER 31, 2017
Agrium BeforeReclassifications
ReclassificationAmounts
Agrium AfterReclassifications
Sales $ 13,766 $ – $ 13,766Freight, transportation and
distribution – (346) 5 (346)Cost of product sold (10,340) 346 5 (9,994)
Gross Margin 3,426 – 3,426Selling (2,014) – (2,014)General and administrative (247) (69) 7 (316)Provincial, mining and other taxes – (13) 6 (13)Other expenses (119) (22) 6, 9 (141)Earnings from associates and
joint ventures 39 – 39Share-based payments (69) 69 7 –
Earnings before Finance
Costs and Income Taxes 1,016 (35) 981Finance costs (101) (175) 8, 9 (276)Finance costs related to long-term
debt (210) 210 8 –
Earnings before Income
Taxes 705 – 705Income tax expense (203) – (203)
Net Earnings from
Continuing Operations 502 – 502Net loss from discontinued
operations (187) – (187)
Net Earnings $ 315 $ – $ 3155 Freight, transportation and distribution was disaggregated from cost of goods sold.6 Provincial, mining and other taxes was disaggregated from other expenses.7 Share-based payments was reclassified to general and administrative expenses.8 Finance costs related to long-term debt was reclassified to finance costs.9 Interest expense related to customer prepayments was reclassified from finance costs to other expenses.
PotashCorp 2017 Annual Report 41

NUTRIEN PRO FORMA CONDENSED COMBINED BALANCE SHEET AS AT DECEMBER 31, 2017Historical
PotashCorpHistoricalAgrium Divestitures 1
Pro formaAdjustments
CombinedPro forma
AssetsCurrent assets
Cash and cash equivalents $ 116 $ 466 $ 4,822 $ (3) 6 $ 5,401Receivables 489 2,424 – (1) 2 2,912Inventories 788 3,321 – (3) 3 4,106Prepaid expenses and other current assets 72 1,124 – – 1,196
1,465 7,335 4,822 (7) 13,615Assets held for sale 1,858 105 (1,963) – –
3,323 7,440 2,859 (7) 13,615Non-current assets
Property, plant and equipment 12,971 7,091 – – 20,062Goodwill 97 2,228 – 10,264 4 12,589Other intangible assets 69 518 – – 587Investments 292 522 – – 814Other assets 246 143 – – 389
Total Assets $ 16,998 $ 17,942 $ 2,859 $ 10,257 $ 48,056
LiabilitiesCurrent liabilities
Short-term debt $ 730 $ 867 $ – $ – $ 1,597Current portion of long-term debt – 11 – – 11Payables and accrued charges 836 5,296 – – 2, 7 6,132
1,566 6,174 – – 7,740Deferred income tax liabilities on assets held for sale 36 – (36) – –
1,602 6,174 (36) – 7,740Non-current liabilities
Long-term debt 3,711 4,397 – 533 4 8,641Deferred income tax liabilities 2,205 473 – (144) 5 2,534Pension and other post-retirement benefit liabilities 440 142 – – 582Asset retirement obligations and accrued environmental costs 651 517 – – 1,168Other non-current liabilities 86 118 – – 204
Total Liabilities 8,695 11,821 (36) 389 20,869
Shareholders’ EquityShare capital 1,806 1,776 – 14,122 4, 6 17,704Contributed surplus 230 – – – 230Accumulated other comprehensive income (loss) 25 (1,116) – 1,116 6 25Retained earnings 6,242 5,461 2,895 (5,370) 6 9,228
Total Shareholders’ Equity 8,303 6,121 2,895 9,868 27,187
Total Liabilities and Shareholders’ Equity $ 16,998 $ 17,942 $ 2,859 $ 10,257 $ 48,056
1 To adjust for the estimated proceeds net of taxes for the required divestitures of SQM, APC, ICL and Agrium’s Conda Idaho phosphate production facility and adjacent phosphate mineral rights had the divestitures taken place on December 31, 2017.2 To eliminate intercompany receivables and payables.3 To eliminate intercompany profit remaining in inventory.4 The fair values of Agrium’s identifiable assets and liabilities to be assumed and the full impact of applying acquisition accounting have not been fully determined. After reflecting the pro forma adjustments made herein, the excess of the purchase consideration over the fair value ofAgrium’s net assets was presented as goodwill. Once detailed valuations and related calculations are completed in 2018, a material portion of the amount allocated to goodwill will be attributable to property, plant and equipment, other intangible assets, other assets, otherliabilities, and the related deferred income tax balances. Some property, plant and equipment and intangible assets are expected to be finite-lived, and accordingly subject to depreciation and amortization. Depreciation and amortization of the actual amounts assigned to the fairvalues of the identifiable assets and liabilities acquired will result in changes to earnings in periods subsequent to the completion of the Arrangement, and those changes are expected to be material. We estimate the incremental depreciation and amortization related to fair valueincreases could range between $150 and $300.5 To record the tax impact of the fair value adjustments.6 To record and eliminate Agrium’s equity balances and the issuance of share capital related to Agrium’s vested share-based payment awards.7 To record the liabilities incurred directly by Nutrien.
42 PotashCorp 2017 Annual Report

POTASHCORP STATEMENT OF FINANCIAL POSITION RECLASSIFICATIONS AS ATDECEMBER 31, 2017
PotashCorp BeforeReclassifications
ReclassificationAmounts
PotashCorp AfterReclassifications
AssetsCurrent assets
Cash and cash equivalents $ 116 $ – $ 116Receivables 489 – 489Inventories 788 – 788Prepaid expenses and other current assets 72 – 72
1,465 – 1,465Assets held for sale 1,858 – 1,858
3,323 – 3,323Non-current assets
Property, plant and equipment 12,971 – 12,971Goodwill – 97 1 97Investments – 292 2 292Investments in equity-accounted investees 30 (30) 2 –Available-for-sale investments 262 (262) 2 –Other assets 246 – 246Intangible assets 166 (97) 1 69
Total Assets $ 16,998 $ – $ 16,998
LiabilitiesCurrent liabilities
Short-term debt and current portion of long-termdebt $ 730 $ (730) 3 $ –
Short-term debt – 730 3 730Payables and accrued charges 807 29 4 836Current portion of derivative instrument liabilities 29 (29) 4 –
1,566 – 1,566Deferred income tax liabilities on assets held for
sale 36 – 36
1,602 – 1,602Non-current liabilities
Long-term debt 3,711 – 3,711Derivative instrument liabilities 35 (35) 4 –Deferred income tax liabilities 2,205 – 2,205Pension and other post-retirement benefit
liabilities 440 – 440Asset retirement obligations and accrued
environmental costs 651 – 651Other non-current liabilities and deferred credits 51 35 4 86
Total Liabilities 8,695 – 8,695
Shareholders’ EquityShare capital 1,806 – 1,806Contributed surplus 230 – 230Accumulated other comprehensive income 25 – 25Retained earnings 6,242 – 6,242
Total Shareholders’ Equity 8,303 – 8,303
Total Liabilities and Shareholders’ Equity $ 16,998 $ – $ 16,998
1 Goodwill was disaggregated from other intangible assets.2 Available-for-sale investments and investments in equity-accounted investees were aggregated.3 Short-term debt and current portion of long-term debt were disaggregated.4 Derivative instrument liabilities were reclassified to payables and accrued charges, and other non-current liabilities and deferredcredits.
AGRIUM BALANCE SHEET RECLASSIFICATIONS AS AT DECEMBER 31, 2017
AgriumBefore
ReclassificationsReclassification
AmountsAgrium After
Reclassifications
AssetsCurrent assets
Cash and cash equivalents $ 466 $ – $ 466Receivables 2,406 18 5 2,424Income taxes receivable 18 (18) 5 –Inventories 3,321 – 3,321Prepaid expenses and other current assets 1,004 120 6 1,124Other current assets 120 (120) 6 –Assets held for sale 105 – 105
7,440 – 7,440Non-current assets
Property, plant and equipment 7,091 – 7,091Other intangible assets 518 – 518Goodwill 2,228 – 2,228Investments 522 – 522Other assets 58 85 7 143Deferred income tax assets 85 (85) 7 –
Total Assets $ 17,942 $ – $ 17,942
LiabilitiesCurrent liabilities
Short-term debt $ 867 $ – $ 867Payables and accrued charges 5,206 90 8 5,296Income taxes payable 27 (27) 8 –Current portion of long-term debt 11 – 11Current portion of other provisions 63 (63) 8 –
6,174 – 6,174Non-current liabilities
Long-term debt 4,397 – 4,397Deferred income tax liabilities 473 – 473Pension and other post-retirement benefit
liabilities 142 – 142Asset retirement obligations and accrued
environmental costs – 517 9 517Other provisions 522 (522) 9 –Other non-current liabilities 106 12 9,10 118
Total Liabilities 11,814 7 11,821
Shareholders’ EquityShare capital 1,776 – 1,776Accumulated other comprehensive income loss (1,116) – (1,116)Retained earnings 5,461 – 5,461Non-controlling interest 7 (7) 10 –
Total Shareholders’ Equity 6,128 (7) 6,121
Total Liabilities and Shareholders’ Equity $ 17,942 $ – $ 17,942
5 Income taxes receivable was reclassified to receivables.6 Other current assets were reclassified to prepaid expenses and other current assets.7 Deferred income tax assets were reclassified to other assets.8 Income taxes payable and current portion of other provisions were reclassified to payables and accrued charges.9 Other provisions was reclassified to asset retirement obligations and accrued environmental costs, and non-current liabilities.10 Non-controlling interest was reclassified to other non-current liabilities.
PotashCorp 2017 Annual Report 43

FORWARD-LOOKING STATEMENTS
This 2017 Annual Report, including the “Financial Outlook”
section of “Management’s Discussion & Analysis of
Financial Condition and Results of Operations,” contains
and incorporates by reference forward-looking statements
or forward-looking information (within the meaning of the
US Private Securities Litigation Reform Act of 1995, and
other US federal securities laws and applicable Canadian
securities laws) (“forward-looking statements”) that relate
to future events or our future financial performance. These
statements can be identified by expressions of belief,
expectation or intention, as well as those statements that
are not historical fact. These statements often contain
words such as “should,” “could,” “expect,” “may,”
“anticipate,” “forecast,” “believe,” “intend,” “estimates,”
“plans” and similar expressions. These statements are
based on certain factors and assumptions as set forth in this
2017 Annual Report, including with respect to: foreign
exchange rates, expected growth, results of operations,
performance, business prospects and opportunities, the
effect of the completion of the Merger and effective tax
rates. While the company considers these factors and
assumptions to be reasonable based on information
currently available, they may prove to be incorrect.
Forward-looking statements are subject to risks and
uncertainties that are difficult to predict. The results or
events set forth in forward-looking statements may differ
materially from actual results or events. Several factors
could cause actual results or events to differ materially from
those expressed in forward-looking statements, including,
but not limited to, the following: a number of matters
relating to the Merger including the failure to realize the
anticipated benefits of the Merger and to successfully
integrate PotashCorp and Agrium, certain costs that we
may incur as a result of the Merger, the ability to retain
personnel as a result of the Merger and the effect of the
Merger on our business and operations generally; risks
related to diversion of management time from ongoing
business operations due to the Merger; the risk that our
credit ratings may be downgraded or there may be
adverse conditions in the credit markets; any significant
impairment of the carrying amount of certain of our assets;
variations from our assumptions with respect to foreign
exchange rates, expected growth, results of operations,
performance, business prospects and opportunities, and
effective tax rates; fluctuations in supply and demand in the
fertilizer, sulfur and petrochemical markets; changes in
competitive pressures, including pricing pressures; risks
and uncertainties related to any operating and workforce
changes made in response to our industry and the markets
we serve, including mine and inventory shutdowns;
adverse or uncertain economic conditions and changes in
credit and financial markets; economic and political
uncertainty around the world; changes in capital markets;
the results of sales contract negotiations; unexpected or
adverse weather conditions; changes in currency and
exchange rates; risks related to reputational loss; the
occurrence of a major safety incident; inadequate
insurance coverage for a significant liability; inability to
obtain relevant permits for our operations; catastrophic
events or malicious acts, including terrorism; certain
complications that may arise in our mining process,
including water inflows; risks and uncertainties related to
our international operations and assets; our ownership of
non-controlling equity interests in other companies; our
prospects to reinvest capital in strategic opportunities and
acquisitions; risks associated with natural gas and other
hedging activities; security risks related to our information
technology systems; imprecision in reserve estimates;
costs and availability of transportation and distribution for
our raw materials and products, including railcars and
ocean freight; changes in, and the effects of, government
policies and regulations; earnings and the decisions of
taxing authorities which could affect our effective tax rates;
increases in the price or reduced availability of the raw
materials that we use; our ability to attract, develop,
engage and retain skilled employees; strikes or other forms
of work stoppage or slowdowns; rates of return on, and
the risks associated with, our investments and capital
expenditures; timing and impact of capital expenditures;
the impact of further innovation; adverse developments in
new and pending legal proceedings or government
investigations; and violations of our governance and
compliance policies. These risks and uncertainties and
additional risks and uncertainties can be found in our
Annual Information Form for the fiscal year ended
December 31, 2017 under the captions “Forward-Looking
Statements” and “Risk Factors” and in our filings with the
US Securities and Exchange Commission and the
Canadian provincial securities commissions. Forward-
looking statements in or incorporated into this report are
given only as at the date of this report or the document
incorporated into this report and the company disclaims
any obligation to update or revise any forward-looking
statements, whether as a result of new information, future
events or otherwise, except as required by law.
44 PotashCorp 2017 Annual Report

NON-IFRS FINANCIAL MEASURES IN MD&A
PotashCorp uses cash flow and cash flow return (both non-IFRS financial measures) as
supplemental measures to evaluate the performance of the company’s assets in terms of the
cash flow they have generated. Calculated on the total cost basis of the company’s assets
rather than on the depreciated value, these measures reflect cash returned on the total
investment outlay. The company believes these measures are valuable to assess shareholder
value.
Generally, these measures are a numerical measure of a company’s performance, financial
position or cash flows that either excludes or includes amounts that are not normally
excluded or included in the most directly comparable measure calculated and presented in
accordance with IFRS. Cash flow and cash flow return are not measures of financial
performance (nor do they have standardized meanings) under IFRS. In evaluating these
measures, investors should consider that the methodology applied in calculating such
measures may differ among companies and analysts.
The company uses both IFRS and certain non-IFRS measures to assess performance.
Management believes the non-IFRS measures provide useful supplemental information to
investors in order that they may evaluate PotashCorp’s financial performance using the same
measures as management. Management believes that, as a result, the investor is afforded
greater transparency in assessing the financial performance of the company. These non-IFRS
financial measures should not be considered as a substitute for, nor superior to, measures of
financial performance prepared in accordance with IFRS.
IFRS Previous Canadian GAAP
(in millions of US dollars except percentage amounts) 2017 2016 2015 2014 2013 2012 2011 2010 2009 2008 2007
Net income 327 323 1,270 1,536 1,785 2,079 3,081 1,775 981 3,466 1,104Total assets 16,998 17,255 17,469 17,724 17,958 18,206 16,257 15,547 12,922 10,249 9,717
Return on assets 1 1.9% 1.9% 7.3% 8.7% 9.9% 11.4% 19.0% 11.4% 7.6% 33.8% 11.4%
Net income 327 323 1,270 1,536 1,785 2,079 3,081 1,775 981 3,466 1,104Income taxes from continuing and discontinued operations (181) 43 451 628 687 826 1,066 701 79 1,060 417Change in unrealized loss (gain) on derivatives included in net income 3 (3) (3) 5 4 3 1 – (56) 69 (17)Finance costs 238 216 192 184 144 114 159 121 121 63 69Current income taxes 2 (92) (65) (244) (356) (272) (404) (700) (479) 120 (995) (297)Depreciation and amortization 692 695 685 701 666 578 489 449 312 328 291Impairment of available-for-sale investment – 10 – 38 – 341 – – – – –Impairment of property, plant and equipment 305 47 – – – – – – – – –
Cash flow 3 1,292 1,266 2,351 2,736 3,014 3,537 4,096 2,567 1,557 3,991 1,567
Total assets 16,998 17,255 17,469 17,724 17,958 18,206 16,257 15,547 12,922 10,249 9,717Cash and cash equivalents (116) (32) (91) (215) (628) (562) (430) (412) (385) (277) (720)Fair value of derivative assets (10) (6) (9) (7) (8) (10) (10) (5) (9) (18) (135)Accumulated depreciation of property, plant and equipment 7,171 6,408 5,871 5,276 4,668 4,176 3,653 3,171 2,712 2,527 2,281Net unrealized loss (gain) on available-for-sale investments 316 346 302 (244) (439) (1,197) (982) (2,563) (1,900) (886) (2,284)Accumulated amortization of other assets and intangible assets 157 131 105 129 121 104 93 76 57 81 66Payables and accrued charges (807) (772) (1,146) (1,086) (1,104) (1,188) (1,295) (1,198) (798) (1,191) (912)Impairment of property, plant and equipment 305 47 – – – – – – – – –
Adjusted assets 24,014 23,377 22,501 21,577 20,568 19,529 17,286 14,616 12,599 10,485 8,013
Average adjusted assets 23,696 22,939 22,039 21,073 20,049 18,408 15,951 13,627 5 11,542 9,249 7,757
Cash flow return 4 5.5% 5.5% 10.7% 13.0% 15.0% 19.2% 25.7% 18.8% 13.5% 43.2% 20.2%1 Return on assets = net income / total assets.2 Current income taxes = current income tax expense from continuing and discontinued operations (which was already reduced by the realized excess tax benefit related to share-based compensation under previous Canadian GAAP) – realized excess tax benefit related to share-
based compensation (under IFRS).3 Cash flow = net income + income taxes from continuing and discontinued operations + change in unrealized loss (gain) on derivatives included in net income + finance costs – current income taxes + depreciation and amortization + impairment of available-for-sale investment +
impairment of property, plant and equipment.4 Cash flow return = cash flow / average adjusted assets (total assets – cash and cash equivalents – fair value of derivative assets + accumulated depreciation and amortization + impairment of property, plant and equipment – net unrealized loss (gain) on available-for-sale
investments – payables and accrued charges).5 Based on adjusted assets as at January 1, 2010 of $12,637, which was calculated similarly to 2009 under previous Canadian GAAP except the following IFRS amounts were used: total assets of $12,842, accumulated depreciation of property, plant and equipment of $2,850 and
payables and accrued charges of $(817).
PotashCorp 2017 Annual Report 45

In millions of US dollars except share, per-share, percentage and tonnage amounts, and as otherwise noted
11 YEAR DATA
The following information is not part of our MD&A on SEDAR and EDGAR and is furnished for those readers who may find value in the use of such information over the long term.
Summary Financial Performance IndicatorsIFRS Previous Canadian GAAP
2017 2016 2015 2014 2013 2012 2011 2010 2009 2008 2007
Net income 327 323 1,270 1,536 1,785 2,079 3,081 1,775 981 3,466 1,104Net income per share – diluted 0.39 0.38 1.52 1.82 2.04 2.37 3.51 1.95 1.08 3.64 1.13EBITDA 1 901 1,154 2,438 2,839 3,010 3,189 4,401 2,708 1,297 4,559 1,750Net income as percentage of sales 3.4% 7.2% 20.2% 21.6% 24.4% 26.2% 35.4% 27.1% 24.7% 36.7% 21.1%Adjusted EBITDA margin 1 32.2% 33.0% 42.1% 44.2% 45.6% 47.5% 53.6% 46.0% 32.5% 51.5% 37.3%Cash flow prior to working capital changes 1,153 1,200 2,211 2,704 2,927 3,358 3,704 2,509 1,351 3,781 1,525Cash provided by operating activities 1,225 1,260 2,338 2,614 3,212 3,225 3,485 3,131 924 3,013 1,689Free cash flow 1 325 110 800 1,260 1,045 810 1,195 119 (660) 2,345 830Return on assets see Page 45 1.9% 1.9% 7.3% 8.7% 9.9% 11.4% 19.0% 11.4% 7.6% 33.8% 11.4%Cash flow return see Page 45 5.5% 5.5% 10.7% 13.0% 15.0% 19.2% 25.7% 18.8% 13.5% 43.2% 20.2%Weighted average cost of capital 6.6% 7.3% 7.3% 9.2% 9.8% 9.1% 9.6% 10.2% 10.1% 12.0% 10.0%Total shareholder return 17.3% 12.4% (49.0%) 11.6% (16.4%) (0.2%) (19.7%) 43.2% 48.9% (49.0%) 202.2%Total debt to capital 34.8% 35.9% 33.5% 32.6% 29.0% 29.2% 36.6% 45.5% 38.6% 40.3% 19.3%Net debt to capital 34.2% 35.7% 33.0% 31.4% 25.6% 26.2% 34.4% 43.6% 36.3% 38.1% 10.6%Total debt to net income 13.6 14.2 3.3 2.8 2.2 2.0 1.5 3.1 4.1 0.9 1.3Net debt to EBITDA 1 4.8 4.0 1.7 1.4 1.1 1.1 0.9 1.9 2.8 0.6 0.4Total assets 16,998 17,255 17,469 17,724 17,958 18,206 16,257 15,547 12,922 10,249 9,717Shareholders’ equity 8,303 8,199 8,382 8,792 9,628 9,912 7,847 6,685 6,440 4,535 5,994
1 EBITDA, adjusted EBITDA margin, free cash flow and net debt to EBITDA for 2007 to 2016 have been restated to reflect the discontinued operations in Note 19.
0
2
4
6
8
10
201720162015201420132012201120102009*2008*2007*-1
0
1
2
3
4
201720162015201420132012201120102009*2008*2007*0
20
40
60
80
100
1 See Page 47 for non-IFRS reconciliation.
* Figures were prepared in accordance with previous Canadian GAAP.
Source: PotashCorp
($ billions) (percentage)
1 See Page 47 for non-IFRS reconciliation.
* Figures were prepared in accordance with previous Canadian GAAP.
Source: PotashCorp
($ billions)
Net income as a percentage of sales Adjusted EBITDA margin 1Net income EBITDA1 Cash provided by operating activities Free cash flow 1
46 PotashCorp 2017 Annual Report

Share Information and Calculations
IFRS Previous Canadian GAAP
2017 2016 2015 2014 2013 2012 2011 2010 2009 2008 2007
End of year closing share price (dollars) 20.65 18.09 17.12 35.32 32.96 40.69 41.28 51.61 36.17 24.41 47.99Dividends per share, ex-dividend date (dollars) 0.50 0.98 1.49 1.40 1.19 0.56 0.24 0.13 0.13 0.13 0.10Total shareholder return 17.3% 12.4% (49.0%) 11.6% (16.4%) (0.2%) (19.7%) 43.2% 48.9% (49.0%) 202.2%
5-year total shareholder return: (37%) 10-year total shareholder return: (45%)
Weighted average shares outstandingBasic (thousands) 840,079 838,928 834,141 838,101 864,596 860,033 855,677 886,371 886,740 922,439 946,923Diluted (thousands) 840,316 839,459 837,349 844,544 873,982 875,907 876,637 911,093 911,828 952,313 972,924
Shares outstanding, end of year (thousands) 1 840,223 839,790 836,540 830,243 856,116 864,901 858,703 853,123 887,927 885,603 949,233
1 Common shares were repurchased in 2014, 2013, 2010 and 2008 in the amounts of 29.201 million, 14.145 million, 42.190 million and 68.547 million, respectively.
Financial Data, Reconciliations and Calculations
IFRS Previous Canadian GAAP
2017 2016 2015 2014 2013 2012 2011 2010 2009 2008 2007
Net income from continuing operations 1 154 199 1,115 1,349 1,534 1,685 2,687 1,447 676 3,130 979Finance costs 238 216 192 184 144 114 159 121 121 63 69Income taxes (183) 44 446 605 666 812 1,066 691 188 1,038 411Depreciation and amortization 692 695 685 701 666 578 489 449 312 328 291
EBITDA 2 901 1,154 2,438 2,839 3,010 3,189 4,401 2,708 1,297 4,559 1,750
Net income as percentage of sales 1 3.4% 4.5% 20.2% 21.6% 24.4% 26.2% 35.4% 27.1% 24.7% 36.7% 21.1%Adjusted EBITDA margin 3 32.2% 33.0% 42.1% 44.2% 45.6% 47.5% 53.6% 46.0% 32.5% 51.5% 37.3%
Cash flow prior to working capital changes 4 1,153 1,200 2,211 2,704 2,927 3,358 3,704 2,509 1,351 3,781 1,525Receivables 47 114 259 (220) 276 188 (155) 256 53 (594) (155)Inventories (10) (21) (99) 70 28 (7) (146) 66 88 (324) 61Prepaid expenses and other current assets (13) 17 (19) 29 (1) (32) (1) (6) 21 (24) 7Payables and accrued charges 48 (50) (14) 31 (18) (282) 83 306 (589) 174 251
Changes in non-cash operating working capital 72 60 127 (90) 285 (133) (219) 622 (427) (768) 164
Cash provided by operating activities 1,225 1,260 2,338 2,614 3,212 3,225 3,485 3,131 924 3,013 1,689Cash additions to property, plant and equipment (651) (893) (1,217) (1,138) (1,624) (2,133) (2,176) (2,079) (1,764) (1,198) (607)Other assets and intangible assets (1) (2) (67) (22) – (71) (72) (71) (54) (47) 8Dividends from discontinued operations (176) (195) (127) (284) (258) (344) (261) (240) (193) (191) (96)Changes in non-cash operating working capital (72) (60) (127) 90 (285) 133 219 (622) 427 768 (164)
Free cash flow 5 325 110 800 1,260 1,045 810 1,195 119 (660) 2,345 830
See footnotes on Page 49
PotashCorp 2017 Annual Report 47

IFRS Previous Canadian GAAP
2017 2016 2015 2014 2013 2012 2011 2010 2009 2008 2007
Short-term debt 730 389 517 536 470 369 829 1,274 727 1,324 90Current portion of long-term debt – 495 – 496 497 246 3 597 2 – –Long-term debt 3,711 3,707 3,710 3,213 2,970 3,466 3,705 3,707 3,319 1,740 1,339
Total debt 4,441 4,591 4,227 4,245 3,937 4,081 4,537 5,578 4,048 3,064 1,429Cash and cash equivalents (116) (32) (91) (215) (628) (562) (430) (412) (385) (277) (720)
Net debt 6 4,325 4,559 4,136 4,030 3,309 3,519 4,107 5,166 3,663 2,787 709
Total shareholders’ equity 8,303 8,199 8,382 8,792 9,628 9,912 7,847 6,685 6,440 4,535 5,994
Total debt to capital 34.8% 35.9% 33.5% 32.6% 29.0% 29.2% 36.6% 45.5% 38.6% 40.3% 19.3%Net debt to capital 6 34.2% 35.7% 33.0% 31.4% 25.6% 26.2% 34.4% 43.6% 36.3% 38.1% 10.6%
Total debt to net income 13.6 14.2 3.3 2.8 2.2 2.0 1.5 3.1 4.1 0.9 1.3Net debt to EBITDA 7 4.8 4.0 1.7 1.4 1.1 1.1 0.9 1.9 2.8 0.6 0.4
Current assets 3,323 1,394 1,553 1,938 2,189 2,496 2,408 2,095 2,272 2,267 1,811Current liabilities (1,602) (1,697) (1,747) (2,198) (2,113) (1,854) (2,194) (3,144) (1,577) (2,623) (1,002)
Working capital 1,721 (303) (194) (260) 76 642 214 (1,049) 695 (356) 809Cash and cash equivalents (116) (32) (91) (215) (628) (562) (430) (412) (385) (277) (720)Short-term debt 730 389 517 536 470 369 829 1,274 727 1,324 90Current portion of long-term debt – 495 – 496 497 246 3 597 2 – –
Non-cash operating working capital 2,335 549 232 557 415 695 616 410 1,039 691 179
See footnotes on Page 49
48 PotashCorp 2017 Annual Report
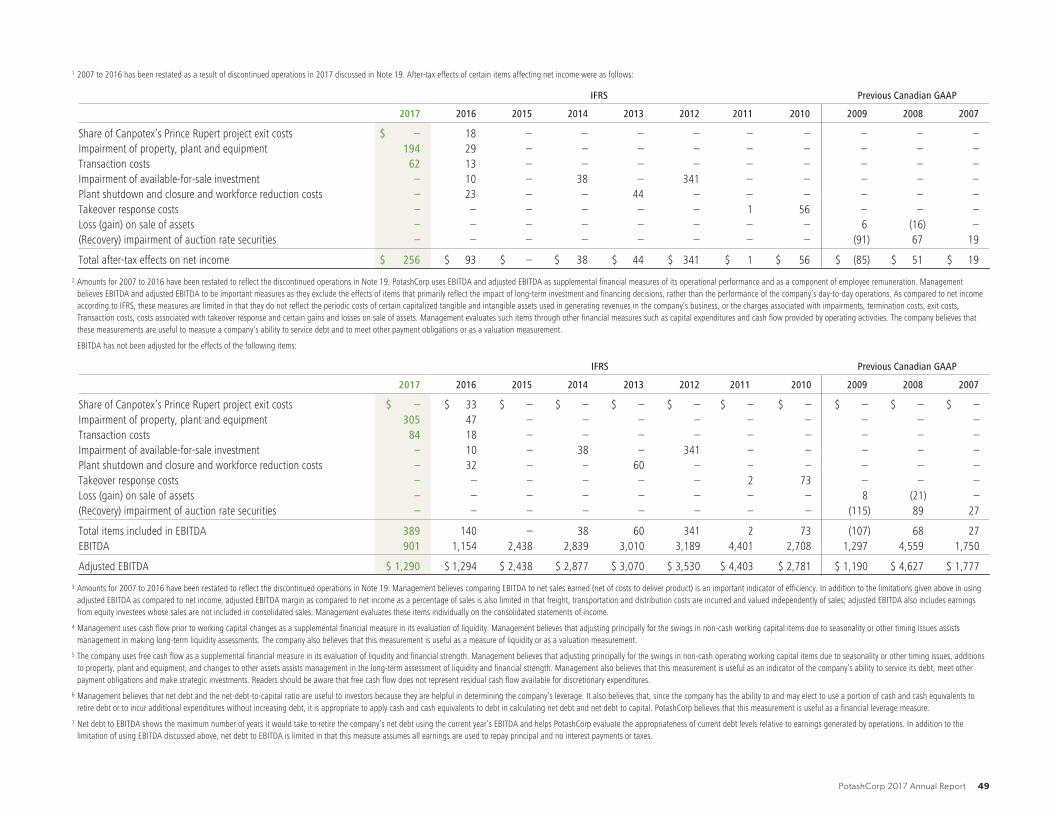
1 2007 to 2016 has been restated as a result of discontinued operations in 2017 discussed in Note 19. After-tax effects of certain items affecting net income were as follows:
IFRS Previous Canadian GAAP
2017 2016 2015 2014 2013 2012 2011 2010 2009 2008 2007
Share of Canpotex’s Prince Rupert project exit costs $ – 18 – – – – – – – – –Impairment of property, plant and equipment 194 29 – – – – – – – – –Transaction costs 62 13 – – – – – – – – –Impairment of available-for-sale investment – 10 – 38 – 341 – – – – –Plant shutdown and closure and workforce reduction costs – 23 – – 44 – – – – – –Takeover response costs – – – – – – 1 56 – – –Loss (gain) on sale of assets – – – – – – – – 6 (16) –(Recovery) impairment of auction rate securities – – – – – – – – (91) 67 19
Total after-tax effects on net income $ 256 $ 93 $ – $ 38 $ 44 $ 341 $ 1 $ 56 $ (85) $ 51 $ 19
2 Amounts for 2007 to 2016 have been restated to reflect the discontinued operations in Note 19. PotashCorp uses EBITDA and adjusted EBITDA as supplemental financial measures of its operational performance and as a component of employee remuneration. Managementbelieves EBITDA and adjusted EBITDA to be important measures as they exclude the effects of items that primarily reflect the impact of long-term investment and financing decisions, rather than the performance of the company’s day-to-day operations. As compared to net incomeaccording to IFRS, these measures are limited in that they do not reflect the periodic costs of certain capitalized tangible and intangible assets used in generating revenues in the company’s business, or the charges associated with impairments, termination costs, exit costs,Transaction costs, costs associated with takeover response and certain gains and losses on sale of assets. Management evaluates such items through other financial measures such as capital expenditures and cash flow provided by operating activities. The company believes thatthese measurements are useful to measure a company’s ability to service debt and to meet other payment obligations or as a valuation measurement.
EBITDA has not been adjusted for the effects of the following items:
IFRS Previous Canadian GAAP
2017 2016 2015 2014 2013 2012 2011 2010 2009 2008 2007
Share of Canpotex’s Prince Rupert project exit costs $ – $ 33 $ – $ – $ – $ – $ – $ – $ – $ – $ –Impairment of property, plant and equipment 305 47 – – – – – – – – –Transaction costs 84 18 – – – – – – – – –Impairment of available-for-sale investment – 10 – 38 – 341 – – – – –Plant shutdown and closure and workforce reduction costs – 32 – – 60 – – – – – –Takeover response costs – – – – – – 2 73 – – –Loss (gain) on sale of assets – – – – – – – – 8 (21) –(Recovery) impairment of auction rate securities – – – – – – – – (115) 89 27
Total items included in EBITDA 389 140 – 38 60 341 2 73 (107) 68 27EBITDA 901 1,154 2,438 2,839 3,010 3,189 4,401 2,708 1,297 4,559 1,750
Adjusted EBITDA $ 1,290 $ 1,294 $ 2,438 $ 2,877 $ 3,070 $ 3,530 $ 4,403 $ 2,781 $ 1,190 $ 4,627 $ 1,777
3 Amounts for 2007 to 2016 have been restated to reflect the discontinued operations in Note 19. Management believes comparing EBITDA to net sales earned (net of costs to deliver product) is an important indicator of efficiency. In addition to the limitations given above in usingadjusted EBITDA as compared to net income, adjusted EBITDA margin as compared to net income as a percentage of sales is also limited in that freight, transportation and distribution costs are incurred and valued independently of sales; adjusted EBITDA also includes earningsfrom equity investees whose sales are not included in consolidated sales. Management evaluates these items individually on the consolidated statements of income.
4 Management uses cash flow prior to working capital changes as a supplemental financial measure in its evaluation of liquidity. Management believes that adjusting principally for the swings in non-cash working capital items due to seasonality or other timing issues assistsmanagement in making long-term liquidity assessments. The company also believes that this measurement is useful as a measure of liquidity or as a valuation measurement.
5 The company uses free cash flow as a supplemental financial measure in its evaluation of liquidity and financial strength. Management believes that adjusting principally for the swings in non-cash operating working capital items due to seasonality or other timing issues, additionsto property, plant and equipment, and changes to other assets assists management in the long-term assessment of liquidity and financial strength. Management also believes that this measurement is useful as an indicator of the company’s ability to service its debt, meet otherpayment obligations and make strategic investments. Readers should be aware that free cash flow does not represent residual cash flow available for discretionary expenditures.
6 Management believes that net debt and the net-debt-to-capital ratio are useful to investors because they are helpful in determining the company’s leverage. It also believes that, since the company has the ability to and may elect to use a portion of cash and cash equivalents toretire debt or to incur additional expenditures without increasing debt, it is appropriate to apply cash and cash equivalents to debt in calculating net debt and net debt to capital. PotashCorp believes that this measurement is useful as a financial leverage measure.
7 Net debt to EBITDA shows the maximum number of years it would take to retire the company’s net debt using the current year’s EBITDA and helps PotashCorp evaluate the appropriateness of current debt levels relative to earnings generated by operations. In addition to thelimitation of using EBITDA discussed above, net debt to EBITDA is limited in that this measure assumes all earnings are used to repay principal and no interest payments or taxes.
PotashCorp 2017 Annual Report 49
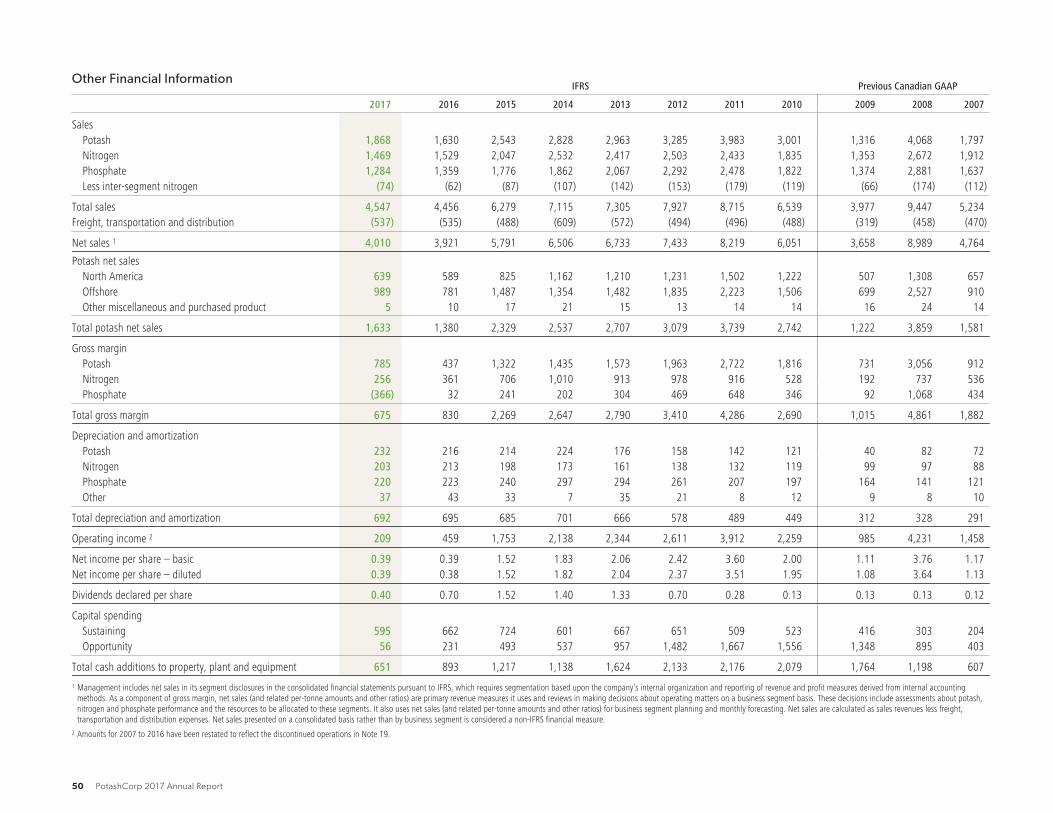
Other Financial InformationIFRS Previous Canadian GAAP
2017 2016 2015 2014 2013 2012 2011 2010 2009 2008 2007
SalesPotash 1,868 1,630 2,543 2,828 2,963 3,285 3,983 3,001 1,316 4,068 1,797Nitrogen 1,469 1,529 2,047 2,532 2,417 2,503 2,433 1,835 1,353 2,672 1,912Phosphate 1,284 1,359 1,776 1,862 2,067 2,292 2,478 1,822 1,374 2,881 1,637Less inter-segment nitrogen (74) (62) (87) (107) (142) (153) (179) (119) (66) (174) (112)
Total sales 4,547 4,456 6,279 7,115 7,305 7,927 8,715 6,539 3,977 9,447 5,234Freight, transportation and distribution (537) (535) (488) (609) (572) (494) (496) (488) (319) (458) (470)
Net sales 1 4,010 3,921 5,791 6,506 6,733 7,433 8,219 6,051 3,658 8,989 4,764
Potash net salesNorth America 639 589 825 1,162 1,210 1,231 1,502 1,222 507 1,308 657Offshore 989 781 1,487 1,354 1,482 1,835 2,223 1,506 699 2,527 910Other miscellaneous and purchased product 5 10 17 21 15 13 14 14 16 24 14
Total potash net sales 1,633 1,380 2,329 2,537 2,707 3,079 3,739 2,742 1,222 3,859 1,581
Gross marginPotash 785 437 1,322 1,435 1,573 1,963 2,722 1,816 731 3,056 912Nitrogen 256 361 706 1,010 913 978 916 528 192 737 536Phosphate (366) 32 241 202 304 469 648 346 92 1,068 434
Total gross margin 675 830 2,269 2,647 2,790 3,410 4,286 2,690 1,015 4,861 1,882
Depreciation and amortizationPotash 232 216 214 224 176 158 142 121 40 82 72Nitrogen 203 213 198 173 161 138 132 119 99 97 88Phosphate 220 223 240 297 294 261 207 197 164 141 121Other 37 43 33 7 35 21 8 12 9 8 10
Total depreciation and amortization 692 695 685 701 666 578 489 449 312 328 291
Operating income 2 209 459 1,753 2,138 2,344 2,611 3,912 2,259 985 4,231 1,458
Net income per share – basic 0.39 0.39 1.52 1.83 2.06 2.42 3.60 2.00 1.11 3.76 1.17Net income per share – diluted 0.39 0.38 1.52 1.82 2.04 2.37 3.51 1.95 1.08 3.64 1.13
Dividends declared per share 0.40 0.70 1.52 1.40 1.33 0.70 0.28 0.13 0.13 0.13 0.12
Capital spendingSustaining 595 662 724 601 667 651 509 523 416 303 204Opportunity 56 231 493 537 957 1,482 1,667 1,556 1,348 895 403
Total cash additions to property, plant and equipment 651 893 1,217 1,138 1,624 2,133 2,176 2,079 1,764 1,198 607
1 Management includes net sales in its segment disclosures in the consolidated financial statements pursuant to IFRS, which requires segmentation based upon the company’s internal organization and reporting of revenue and profit measures derived from internal accountingmethods. As a component of gross margin, net sales (and related per-tonne amounts and other ratios) are primary revenue measures it uses and reviews in making decisions about operating matters on a business segment basis. These decisions include assessments about potash,nitrogen and phosphate performance and the resources to be allocated to these segments. It also uses net sales (and related per-tonne amounts and other ratios) for business segment planning and monthly forecasting. Net sales are calculated as sales revenues less freight,transportation and distribution expenses. Net sales presented on a consolidated basis rather than by business segment is considered a non-IFRS financial measure.
2 Amounts for 2007 to 2016 have been restated to reflect the discontinued operations in Note 19.
50 PotashCorp 2017 Annual Report

Non-Financial Data2017 2016 2015 2014 2013 2012 2011 2010 2009 2008 2007
CustomersCustomer survey score n/a 1 89% 92% 89% 90% 92% 90% 90% 89% 91% 90%Product tonnes involved in customer complaints (thousands) 2 58 106 59 63 43 64 59 97 190 191 152
CommunityCommunity investment ($ millions) 10 15 28 26 31 28 21 17 10 7 4Taxes and royalties ($ millions) 335 256 654 715 568 654 997 620 (8) 1,684 507Community survey score (out of 5) n/a 3 4.2 4.5 4.4 4.2 4.5 4.4 4.2 4.1 4.0 4.1
EmployeesEmployees at year-end 5,104 5,130 5,395 5,136 5,787 5,779 5,703 5,486 5,136 5,301 5,003Employee engagement score 4 n/a 75% n/a 67% n/a 79% 73% 73% 76% 79% 69%Annual employee turnover rate 3% 3% 4% 5% 5% 5% 4% 3% 6% 6% n/aProportion of women 10% 9% 8% 8% 8% 8% 8% 8% 9% 9% 9%Women in management (percent) 20% 20% 17% 17% 17% 16% 17% n/a 5 n/a 5 n/a 5 n/a 5
SafetyTotal recordable injury rate 0.85 0.87 1.01 1.01 1.06 1.29 1.42 1.29 1.54 2.21 n/aTotal lost-time injury rate 0.11 0.08 0.10 0.10 0.05 0.10 0.14 0.15 0.22 0.39 n/aTotal severity injury rate 0.35 0.44 0.32 0.46 0.40 0.55 0.54 0.38 0.74 0.97 n/a
EnvironmentEnvironmental incidents 9 18 24 24 17 19 14 20 22 19 25Waste (million tonnes) 29 26 29 28 29 24 30 26 15 26 28Direct energy used (thousand terajoules) 6 179 184 184 186 180 160 166 162 152 154 159
n/a = not available1 Due to the Merger, we did not administer customer surveys in 2017.2 A complaint occurs when our product does not meet our product specification sheet requirements, our chemical analysis requirements or our physical size specifications (for example, product is undersized, has too many lumps or has too much dust).3 Due to the Merger, we did not administer community surveys in 2017.4 Engagement survey completed annually for half of employees prior to 2013; beginning in 2014, survey conducted biennially for all employees.5 Data had not been previously compiled consistent with current methodology.6 Direct energy used is energy consumed by our operations in order to mine, mill and manufacture our products. Energy is used by burning fossil fuels, reforming natural gas and consuming electricity.
Production and Sales Volumes Information2017 2016 2015 2014 2013 2012 2011 2010 2009 2008 2007
Production (thousands)Potash production (KCI) tonnage 9,795 8,604 9,105 8,726 7,792 7,724 9,343 8,078 3,405 8,697 9,159Nitrogen production (N) tonnage 3,013 3,147 3,081 3,170 2,952 2,602 2,813 2,767 2,551 2,780 2,986Phosphate production (P2O5) tonnage 1,541 1,504 1,614 1,671 2,058 1,983 2,204 1,987 1,505 1,942 2,164
Sales – manufactured product tonnes (thousands)Potash sales
North America 3,201 3,367 2,591 3,549 3,185 2,590 3,114 3,355 1,093 2,962 3,471Offshore 6,096 5,277 6,181 5,797 4,915 4,640 5,932 5,289 1,895 5,585 5,929
Total potash sales 9,297 8,644 8,772 9,346 8,100 7,230 9,046 8,644 2,988 8,547 9,400Nitrogen sales 6,317 6,373 5,926 6,352 5,896 4,946 5,147 5,329 5,086 5,050 5,756Phosphate sales 2,811 2,713 2,850 3,142 3,680 3,643 3,854 3,632 3,055 3,322 4,151
PotashCorp 2017 Annual Report 51
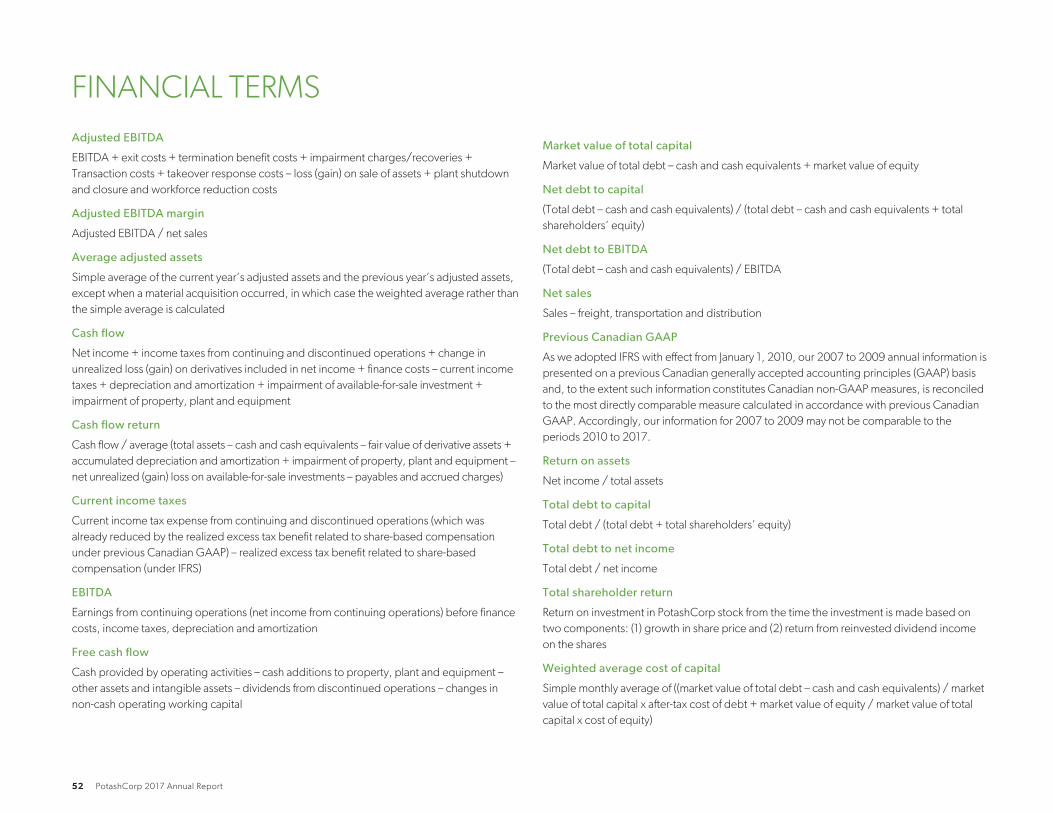
FINANCIAL TERMS
Adjusted EBITDA
EBITDA + exit costs + termination benefit costs + impairment charges/recoveries +
Transaction costs + takeover response costs – loss (gain) on sale of assets + plant shutdown
and closure and workforce reduction costs
Adjusted EBITDA margin
Adjusted EBITDA / net sales
Average adjusted assets
Simple average of the current year’s adjusted assets and the previous year’s adjusted assets,
except when a material acquisition occurred, in which case the weighted average rather than
the simple average is calculated
Cash flow
Net income + income taxes from continuing and discontinued operations + change in
unrealized loss (gain) on derivatives included in net income + finance costs – current income
taxes + depreciation and amortization + impairment of available-for-sale investment +
impairment of property, plant and equipment
Cash flow return
Cash flow / average (total assets – cash and cash equivalents – fair value of derivative assets +
accumulated depreciation and amortization + impairment of property, plant and equipment –
net unrealized (gain) loss on available-for-sale investments – payables and accrued charges)
Current income taxes
Current income tax expense from continuing and discontinued operations (which was
already reduced by the realized excess tax benefit related to share-based compensation
under previous Canadian GAAP) – realized excess tax benefit related to share-based
compensation (under IFRS)
EBITDA
Earnings from continuing operations (net income from continuing operations) before finance
costs, income taxes, depreciation and amortization
Free cash flow
Cash provided by operating activities – cash additions to property, plant and equipment –
other assets and intangible assets – dividends from discontinued operations – changes in
non-cash operating working capital
Market value of total capital
Market value of total debt – cash and cash equivalents + market value of equity
Net debt to capital
(Total debt – cash and cash equivalents) / (total debt – cash and cash equivalents + total
shareholders’ equity)
Net debt to EBITDA
(Total debt – cash and cash equivalents) / EBITDA
Net sales
Sales – freight, transportation and distribution
Previous Canadian GAAP
As we adopted IFRS with effect from January 1, 2010, our 2007 to 2009 annual information is
presented on a previous Canadian generally accepted accounting principles (GAAP) basis
and, to the extent such information constitutes Canadian non-GAAP measures, is reconciled
to the most directly comparable measure calculated in accordance with previous Canadian
GAAP. Accordingly, our information for 2007 to 2009 may not be comparable to the
periods 2010 to 2017.
Return on assets
Net income / total assets
Total debt to capital
Total debt / (total debt + total shareholders’ equity)
Total debt to net income
Total debt / net income
Total shareholder return
Return on investment in PotashCorp stock from the time the investment is made based on
two components: (1) growth in share price and (2) return from reinvested dividend income
on the shares
Weighted average cost of capital
Simple monthly average of ((market value of total debt – cash and cash equivalents) / market
value of total capital x after-tax cost of debt + market value of equity / market value of total
capital x cost of equity)
52 PotashCorp 2017 Annual Report

NON-FINANCIAL TERMS
Community investment
Represents cash disbursements, matching of employee gifts and in-kind contributions of
equipment, goods, services and employee volunteerism (on corporate time).
Community survey score
Survey conducted annually by an independent third party in the communities where
PotashCorp has significant operations; each community is generally surveyed every three
years. Community leaders and representatives are asked to provide a ranking in three broad
areas: perception of community involvement, business practices and economic issues. Each
question is rated on a scale of 1 (low) to 5 (high) and results are determined by taking a
simple average of the metrics described above.
Customer survey score
Online survey conducted by an independent third party measuring performance in product
quality and customer service, which includes a selection of top customers from each sales
segment. Results are determined by taking a simple average of individual product quality
and customer service scores in fertilizer, feed, industrial nitrogen and purified phosphate.
Employee engagement score
Measures employee responses of “agree” or “strongly agree” on a combination of
perceptions in the workplace that have a positive impact on behavior. These perceptions
include satisfaction, commitment, pride, loyalty, a strong sense of personal responsibility,
and a willingness to be an advocate for the organization.
Employee turnover rate
The number of permanent employees who left the company (due to deaths and voluntary
and involuntary terminations, and excluding retirements and announced workforce
reductions) as a percentage of average total employees during the year. Retirements and
terminations of temporary employees are excluded.
Environmental incidents
Number of incidents includes reportable quantity releases, permit non-compliance and
Canadian reportable releases. Calculated as: reportable quantity releases (a release whose
quantity equals or exceeds the US Environmental Protection Agency’s notification level and
is reportable to the National Response Center (NRC)) + permit non-compliance (an
exceedance of a federal, state, provincial or local permit condition or regulatory limit) +
Canadian reportable releases (an unconfined spill or release into the environment).
Greenhouse gas (GHG) emissions
Based on 2007 United Nations International Panel on Climate Change Fourth Assessment
Report (UN IPCC Fourth AR).
Merger
The merger of equals transaction between PotashCorp and Agrium completed effective
January 1, 2018 pursuant to which the company and Agrium combined their businesses
pursuant to a statutory plan of arrangement under the Canada Business Corporations Act and
became wholly owned subsidiaries of Nutrien Ltd.
Taxes and royalties
Includes tax and royalty amounts on an accrual basis calculated as: current income tax
expense from continuing and discontinued operations (which was already reduced by the
realized excess tax benefit related to share-based compensation under previous Canadian
GAAP) – investment tax credits – realized excess tax benefit related to share-based
compensation (under IFRS) + potash production tax + resource surcharge + royalties +
municipal taxes + other miscellaneous taxes.
Total lost-time injury rate
Total lost-time injuries for every 200,000 hours worked for all PotashCorp employees,
contractors and others on site. Calculated as the total lost-time injuries multiplied by
200,000 hours worked divided by the actual number of hours worked.
Total recordable injury rate
Total recordable injuries for every 200,000 hours worked for all PotashCorp employees,
contractors and others on site. Calculated as the total recordable injuries multiplied by
200,000 hours worked divided by the actual number of hours worked.
Total severity injury rate
Total of lost-time injuries (a lost-time injury occurs when the injured person is unable to return
to work on his/her next scheduled workday after the injury) + modified work injuries (a work-
related injury where a licensed health care professional or the employer recommends the
employee not perform one or more of the routine functions of the job or not work the full
workday that he/she would have otherwise worked) for every 200,000 hours worked for all
PotashCorp employees, contractors and others on site.
Waste
Comprised of waste or byproducts from mining, including: coarse and fine tailings from
potash mining, salt as brine to injection wells and gypsum (related to phosphate operations).
PotashCorp 2017 Annual Report 53

Financials &Notes Contents
Reports
Management’s Responsibility for
Financial Reporting 55
Reports of Independent Registered
Public Accounting Firm 56
Consolidated Statements of
Income 58
Comprehensive Income 59
Cash Flow 60
Changes in Shareholders’ Equity 61
Financial Position 62
Business and Environment
Note 1 Description of Business 64
Note 2 Basis of Presentation 65
Income, Expenses and Cash Flow
Note 3 Segment Information 66
Note 4 Nature of Expenses 70
Note 5 Provincial Mining and Other Taxes 71
Note 6 Other (Expenses) Income 71
Note 7 Finance Costs 71
Note 8 Income Taxes 72
Note 9 Net Income per Share 76
Note 10 Consolidated Statements of Cash Flow 77
Operating Assets and Liabilities
Note 11 Receivables 78
Note 12 Inventories 79
Note 13 Property, Plant and Equipment 80
Note 14 Other Assets 83
Note 15 Intangible Assets 84
Note 16 Payables and Accrued Charges 85
Note 17 Derivative Instruments 86
Note 18 Provisions for Asset Retirement,
Environmental and Other Obligations 87
Investments, Financing and Capital Structure
Note 19 Investments 90
Note 20 Short-Term Debt 95
Note 21 Long-Term Debt 95
Note 22 Share Capital 97
Note 23 Capital Management 98
Note 24 Commitments 99
Note 25 Guarantees 100
Personnel
Note 26 Pension and Other Post-Retirement Benefits 101
Note 27 Share-Based Compensation 108
Other
Note 28 Related Party Transactions 111
Note 29 Financial Instruments and
Related Risk Management 112
Note 30 Contingencies and Other Matters 118
Note 31 Accounting Policies, Estimates and
Judgments 120
Note 32 Merger of Equals with Agrium 125
Note 33 Comparative Figures 127
To learn more, watch for the following icon:
Management’s Discussion & AnalysisMDA
54 PotashCorp 2017 Annual Report

MANAGEMENT’S RESPONSIBILITYManagement’s Responsibility for Financial Reporting
MANAGEMENT’S REPORT ONFINANCIAL STATEMENTS
The accompanying consolidated financial statements
and related financial information are the responsibility of
PotashCorp management. They have been prepared in
accordance with International Financial Reporting Standards
as issued by the International Accounting Standards Board
and include amounts based on estimates and judgments.
Financial information included elsewhere in this report is
consistent with the consolidated financial statements.
The consolidated financial statements are approved by the
Board of Directors on the recommendation of the audit
committee. The audit committee of the Board of Directors
is composed entirely of independent directors. The audit
committee discusses and analyzes PotashCorp’s interim
condensed consolidated financial statements and MD&A
with management before such information is approved by
the committee and submitted to securities commissions or
other regulatory authorities. The annual consolidated
financial statements and MD&A are also analyzed by the
audit committee and management and are approved by
the Board of Directors.
In addition, the audit committee has the duty to review
critical accounting policies and significant estimates and
judgments underlying the consolidated financial statements
as presented by management, and to approve the fees of
our independent registered public accounting firm.
Our independent registered public accounting firm,
Deloitte LLP, performs an audit of the consolidated financial
statements, the results of which are reflected in their report
for 2017 included on Page 57. Deloitte LLP have full and
independent access to the audit committee to discuss their
audit and related matters.
MANAGEMENT’S REPORT ONINTERNAL CONTROL OVER FINANCIALREPORTING
Management is responsible for establishing and maintaining
an adequate system of internal control over financial
reporting as defined in Rules 13a-15(f) and 15d-15(f) under
the Securities Exchange Act of 1934, as amended. Internal
control over financial reporting includes maintaining records
that accurately and fairly reflect our transactions, providing
reasonable assurance that: transactions are recorded
for preparation of consolidated financial statements in
accordance with International Financial Reporting Standards
as issued by the International Accounting Standards
Board; receipts and expenditures of company assets are
made in accordance with management authorization; and
unauthorized acquisition, use or disposition of company
assets that could have a material effect on our financial
statements would be prevented or detected on a timely
basis. Due to its inherent limitations, internal control over
financial reporting may not prevent or detect misstatements.
Also, projections of any evaluation of effectiveness to future
periods are subject to the risk that controls may become
inadequate because of changes in conditions, or that the
degree of compliance with the policies or procedures
may deteriorate.
Management has assessed the effectiveness of the
company’s internal control over financial reporting
based on the framework in Internal Control – IntegratedFramework (2013) issued by the Committee of Sponsoring
Organizations of the Treadway Commission (COSO) and
concluded that the company’s internal control over financial
reporting was effective as at December 31, 2017. The
effectiveness of the company’s internal control over financial
reporting as at December 31, 2017 has been audited by
Deloitte LLP, as reflected in their report for 2017 included
on Page 56.
There has been no change in our internal control over
financial reporting in 2017 that has materially affected, or is
reasonably likely to materially affect, our internal control
over financial reporting. During 2017, we implemented
internal controls to ensure we have adequately evaluated
our contracts and properly assessed the impact of the new
accounting standard related to revenue recognition on our
financial statements to facilitate the adoption on January 1,
2018. We do not expect significant changes to our internal
control over financial reporting due to the adoption of the
new standard.
J. TilkPresident and Chief Executive Officer
February 20, 2018
W. BrownleeExecutive Vice President and
Chief Financial Officer
PotashCorp 2017 Annual Report 55

REPORT OF INDEPENDENT REGISTERED PUBLIC ACCOUNTING FIRMTo the Shareholders and the Board of Directors of Potash Corporation of Saskatchewan Inc.
OPINION ON INTERNAL CONTROL OVERFINANCIAL REPORTING
We have audited the internal control over financial reporting
of Potash Corporation of Saskatchewan Inc. and subsidiaries
(the “Company”) as of December 31, 2017, based on criteria
established in Internal Control – Integrated Framework
(2013) issued by the Committee of Sponsoring
Organizations of the Treadway Commission (“COSO”). In
our opinion, the Company maintained, in all material
respects, effective internal control over financial reporting as
of December 31, 2017, based on criteria established in
Internal Control – Integrated Framework (2013) issued by
COSO.
We have also audited, in accordance with the standards of
the Public Company Accounting Oversight Board (United
States) (“PCAOB”), the consolidated financial statements as
of and for the year ended December 31, 2017, of the
Company and our report dated February 20, 2018,
expressed an unqualified opinion on those financial
statements.
BASIS FOR OPINION
The Company’s management is responsible for maintaining
effective internal control over financial reporting and for its
assessment of the effectiveness of internal control over
financial reporting, included in the accompanying
Management’s Report on Internal Control Over Financial
Reporting. Our responsibility is to express an opinion on the
Company’s internal control over financial reporting based
on our audit. We are a public accounting firm registered
with the PCAOB and are required to be independent with
respect to the Company in accordance with the U.S. federal
securities laws and the applicable rules and regulations of
the Securities and Exchange Commission and the PCAOB.
We conducted our audit in accordance with the standards
of the PCAOB. Those standards require that we plan and
perform the audit to obtain reasonable assurance about
whether effective internal control over financial reporting
was maintained in all material respects. Our audit included
obtaining an understanding of internal control over financial
reporting, assessing the risk that a material weakness exists,
testing and evaluating the design and operating
effectiveness of internal control based on the assessed risk,
and performing such other procedures as we considered
necessary in the circumstances. We believe that our audit
provides a reasonable basis for our opinion.
DEFINITION AND LIMITATIONS OFINTERNAL CONTROL OVER FINANCIALREPORTING
A company’s internal control over financial reporting is a
process designed to provide reasonable assurance
regarding the reliability of financial reporting and the
preparation of financial statements for external purposes in
accordance with International Financial Reporting Standards
as issued by the International Accounting Standards Board.
A company’s internal control over financial reporting
includes those policies and procedures that (1) pertain to
the maintenance of records that, in reasonable detail,
accurately and fairly reflect the transactions and dispositions
of the assets of the company; (2) provide reasonable
assurance that transactions are recorded as necessary to
permit preparation of financial statements in accordance
with International Financial Reporting Standards as issued by
the International Accounting Standards Board, and that
receipts and expenditures of the company are being made
only in accordance with authorizations of management and
directors of the company; and (3) provide reasonable
assurance regarding prevention or timely detection of
unauthorized acquisition, use, or disposition of the
company’s assets that could have a material effect on the
financial statements.
Because of its inherent limitations, internal control over
financial reporting may not prevent or detect misstatements.
Also, projections of any evaluation of effectiveness to future
periods are subject to the risk that controls may become
inadequate because of changes in conditions, or that the
degree of compliance with the policies or procedures may
deteriorate.
Chartered Professional AccountantsLicensed Professional Accountants
Saskatoon, Canada
February 20, 2018
56 PotashCorp 2017 Annual Report

REPORT OF INDEPENDENT REGISTERED PUBLIC ACCOUNTING FIRMTo the Shareholders and the Board of Directors of Potash Corporation of Saskatchewan Inc.
OPINION ON THE FINANCIALSTATEMENTS
We have audited the accompanying consolidated
statements of financial position of Potash Corporation of
Saskatchewan Inc. and subsidiaries (the “Company”) as of
December 31, 2017 and 2016, the related consolidated
statements of income, comprehensive income, changes in
shareholders’ equity, and cash flows, for each of the three
years in the period ended December 31, 2017, and the
related notes (collectively referred to as the “financial
statements”). In our opinion, the financial statements
present fairly, in all material respects, the financial position
of the Company as of December 31, 2017 and 2016, and
the results of its operations and its cash flows for each of the
three years in the period ended December 31, 2017, in
conformity with International Financial Reporting Standards
as issued by the International Accounting Standards Board.
We have also audited, in accordance with the standards of
the Public Company Accounting Oversight Board (United
States) (“PCAOB”), the Company’s internal control over
financial reporting as of December 31, 2017, based on
criteria established in Internal Control – Integrated
Framework (2013) issued by the Committee of Sponsoring
Organizations of the Treadway Commission and our report
dated February 20, 2018, expressed an unqualified opinion
on the Company’s internal control over financial reporting.
BASIS FOR OPINION
These financial statements are the responsibility of the
Company’s management. Our responsibility is to express an
opinion on the Company’s financial statements based on
our audits. We are a public accounting firm registered with
the PCAOB and are required to be independent with
respect to the Company in accordance with the U.S. federal
securities laws and the applicable rules and regulations of
the Securities and Exchange Commission and the PCAOB.
We conducted our audits in accordance with the standards
of the PCAOB. Those standards require that we plan and
perform the audit to obtain reasonable assurance about
whether the financial statements are free of material
misstatement, whether due to error or fraud. Our audits
included performing procedures to assess the risks of
material misstatement of the financial statements, whether
due to error or fraud, and performing procedures that
respond to those risks. Such procedures included
examining, on a test basis, evidence regarding the amounts
and disclosures in the financial statements. Our audits also
included evaluating the accounting principles used and
significant estimates made by management, as well as
evaluating the overall presentation of the financial
statements. We believe that our audits provide a reasonable
basis for our opinion.
Chartered Professional AccountantsLicensed Professional Accountants
Saskatoon, Canada
February 20, 2018
We have served as the Company’s auditors since 1977.
PotashCorp 2017 Annual Report 57

CONSOLIDATED FINANCIAL STATEMENTS
For the years ended December 31 in millions of US dollars except as otherwise noted
Consolidated Statements of IncomeThe consolidated statements of income present a summary of earnings.
2017
HIGHLIGHTS
(UNAUDITED)
2017 2016 1 2015 1
Sales Note 3 $ 4,547 $ 4,456 $ 6,279Freight, transportation and distribution Note 4 (537) (535) (488)Cost of goods sold Note 4 (3,335) (3,091) (3,522)
Gross Margin 675 830 2,269Selling and administrative expenses Note 4 (214) (212) (239)Provincial mining and other taxes Note 5 (151) (124) (310)Transaction costs Note 32 (84) (18) –Other (expenses) income Note 6 (17) (17) 33
Operating Income 209 459 1,753Finance costs Note 7 (238) (216) (192)
(Loss) Income Before Income Taxes (29) 243 1,561Income tax recovery (expense) Note 8 183 (44) (446)
Net Income from Continuing Operations $ 154 $ 199 $ 1,115Net Income from discontinued operations Note 19 173 124 155
Net Income $ 327 $ 323 $ 1,270
Net Income per Share from Continuing Operations Note 9Basic $ 0.18 $ 0.24 $ 1.34Diluted $ 0.18 $ 0.24 $ 1.34
Net Income per Share from Continuing and DiscontinuedOperations Note 9Basic $ 0.39 $ 0.39 $ 1.52Diluted $ 0.39 $ 0.38 $ 1.52
Weighted Average Shares Outstanding Note 9Basic 840,079,000 838,928,000 834,141,000Diluted 840,316,000 839,459,000 837,349,000
1 Certain amounts have been reclassified as a result of discontinued operations described in Note 19.
(See Notes to the Consolidated Financial Statements)
• $785 of 2017 gross margin was earned in the potash segment;nitrogen earned $256 and phosphate realized a loss of $366.
• Cost of goods sold includes $305 of impairment losses related tophosphate.
• Earnings from Sociedad Quimica y Minera de Chile S.A. (“SQM”)and Arab Potash Company (“APC”) and income from IsraelChemicals Ltd. (“ICL”) are presented as discontinued operationsfor all years to reflect required divestitures of these investments.
0.00
0.50
1.00
1.50
2.00
201720162015
Source: PotashCorp
NET INCOME PER SHARE Unaudited
($ per share)Net income per share – basic
Net income per share – diluted
Dividends declared per share
Pages 11-13 – Potash Financial Performance
Pages 16-18 – Nitrogen Financial Performance
Pages 20-21 – Phosphate Financial Performance
Pages 25-27 – Other Expenses and Income
MDA
58 PotashCorp 2017 Annual Report

2017
HIGHLIGHTS
(UNAUDITED)
• The net fair value gain on available-for-sale investments in2017, compared to the net fair value loss in 2016, was primarilydue to the increase in the fair value of the company’s investmentin Sinofert Holdings Limited (“Sinofert”) in 2017, whereas the fairvalue of Sinofert decreased in 2016.
For the years ended December 31 in millions of US dollars except as otherwise noted
Consolidated Statements ofComprehensive IncomeThe consolidated statements of comprehensive income present changes in net assets during the yearother than transactions with shareholders. Amounts recorded in other comprehensive income (loss)may be subsequently reclassified to net income or may not pass through net income.
(net of related income taxes) 2017 2016 2015
Net Income $ 327 $ 323 $ 1,270
Other comprehensive income (loss)
Items that will not be reclassified to net income:
Net actuarial gain on defined benefit plans 1 46 16 36
Items that have been or may be subsequently reclassified to net income:
Available-for-sale investments 2
Net fair value gain (loss) during the year 30 (34) (546)
Cash flow hedges
Net fair value (loss) gain during the year 3 (17) 7 (52)
Reclassification to income of net loss 4 34 50 54
Other 3 2 (9)
Other Comprehensive Income (Loss) 96 41 (517)
Comprehensive Income $ 423 $ 364 $ 753
1 Net of income taxes of $(20) (2016 – $(16), 2015 – $(22)).
2 Available-for-sale investments are comprised of shares in ICL, Sinofert and other. The company’s investment in ICL was classified as held for sale on December 31, 2017 and thedivestiture of all equity interests in ICL was completed on January 24, 2018.
3 Cash flow hedges are comprised of natural gas derivative instruments and were net of income taxes of $(3) (2016 – $(4), 2015 – $31). In the fourth quarter of 2017, related deferredincome tax assets were reduced by $8 due to a US federal income tax rate decrease.
4 Net of income taxes of $(20) (2016 – $(28), 2015 – $(30)).
(See Notes to the Consolidated Financial Statements)
PotashCorp 2017 Annual Report 59

2017
HIGHLIGHTS
(UNAUDITED)
For the years ended December 31 in millions of US dollars except as otherwise noted
Consolidated Statements of Cash FlowThe consolidated statements of cash flow start with net income adjusted for non-cash items affectingnet income to arrive at cash flow from operating activities, and present cash used in investing andfinancing activities.
2017 2016 2015
Operating Activities
Net income $ 327 $ 323 $ 1,270
Adjustments to reconcile net income to cash provided by operating activities Note 10 826 877 941
Changes in non-cash operating working capital Note 10 72 60 127
Cash provided by operating activities 1,225 1,260 2,338
Investing Activities
Additions to property, plant and equipment (651) (893) (1,217)
Other assets and intangible assets (1) (2) (67)
Cash used in investing activities (652) (895) (1,284)
Financing Activities
Proceeds from long-term debt obligations – 496 494
Repayment of, and finance costs on, long-term debt obligations (501) (8) (502)
Proceeds from (repayment of) short-term debt obligations 341 (128) (19)
Dividends (330) (809) (1,204)
Issuance of common shares 1 25 53
Cash used in financing activities (489) (424) (1,178)
Increase (Decrease) in Cash and Cash Equivalents 84 (59) (124)
Cash and Cash Equivalents, Beginning of Year 32 91 215
Cash and Cash Equivalents, End of Year $ 116 $ 32 $ 91
Cash and cash equivalents comprised of:
Cash $ 14 $ 13 $ 30
Short-term investments 102 19 61
$ 116 $ 32 $ 91
(See Notes to the Consolidated Financial Statements)
• Cash used in financing activities was primarily impacted bythe repayment of $500 of 3.25 percent senior notes anddividends paid, partly offset by the issuance of commercial paper.
-3
-2
-1
0
1
2
3
201720162015
Source: PotashCorp
CASH FLOW Unaudited
($ billions)
Cash provided by operating activities
Year ended December 31
Cash used in investing activities
Cash used in financing activities
Cash and cash equivalents
As at December 31
Pages 32-33 – Sources and Uses of CashMDA
60 PotashCorp 2017 Annual Report

in millions of US dollars
Consolidated Statements of Changes in Shareholders’ EquityThe consolidated statements of changes in shareholders’ equity show the movements in shareholders’ equity.
Accumulated Other Comprehensive Income (Loss)
ShareCapital
ContributedSurplus
Net unrealizedgain (loss) onavailable-for-
sale investments 1
Net (loss) gainon derivatives
designated as cashflow hedges
Net actuarialgain ondefined
benefit plans Other
Total AccumulatedOther Comprehensive
Income (Loss)RetainedEarnings
TotalEquity 2
Balance – December 31, 2014 $ 1,632 $ 234 $ 623 $ (119) $ – 3 $ (1) $ 503 $ 6,423 $ 8,792Net income – – – – – – – 1,270 1,270Other comprehensive (loss) income – – (546) 2 36 (9) (517) – (517)Dividends declared – – – – – – – (1,274) (1,274)Effect of share-based compensation including issuance
of common shares 72 (4) – – – – – – 68Shares issued for dividend reinvestment plan 43 – – – – – – – 43Transfer of net actuarial gain on defined benefit plans – – – – (36) – (36) 36 –
Balance – December 31, 2015 $ 1,747 $ 230 $ 77 $ (117) $ – 3 $ (10) $ (50) $ 6,455 $ 8,382Net income – – – – – – – 323 323Other comprehensive (loss) income – – (34) 57 16 2 41 – 41Dividends declared – – – – – – – (590) (590)Effect of share-based compensation including issuance
of common shares 36 (8) – – – – – – 28Shares issued for dividend reinvestment plan 15 – – – – – – – 15Transfer of net actuarial gain on defined benefit plans – – – – (16) – (16) 16 –
Balance – December 31, 2016 $ 1,798 $ 222 $ 43 $ (60) $ – 3 $ (8) $ (25) $ 6,204 $ 8,199Net income – – – – – – – 327 327Other comprehensive income – – 30 17 46 3 96 – 96Dividends declared – – – – – – – (335) (335)Effect of share-based compensation including issuance
of common shares 2 8 – – – – – – 10Shares issued for dividend reinvestment plan 6 – – – – – – – 6Transfer of net actuarial gain on defined benefit plans – – – – (46) – (46) 46 –
Balance – December 31, 2017 $ 1,806 $ 230 $ 73 $ (43) $ – 3 $ (5) $ 25 $ 6,242 $ 8,303
1 The cumulative net unrealized gain on the available-for-sale investment in ICL, classified as held for sale as described in Note 19, was $4 at December 31, 2017.2 All equity transactions were attributable to common shareholders.3 Any amounts incurred during a period were closed out to retained earnings at each period-end. Therefore, no balance exists at the beginning or end of period.
(See Notes to the Consolidated Financial Statements)
PotashCorp 2017 Annual Report 61

As at December 31 in millions of US dollars
Consolidated Statements of Financial PositionThe consolidated statements of financial position present assets, liabilities and shareholders’ equity.
2017 2016
AssetsCurrent assets
Cash and cash equivalents $ 116 $ 32Receivables Note 11 489 545Inventories Note 12 788 768Prepaid expenses and other current assets 72 49
1,465 1,394Assets held for sale Note 19 1,858 –
3,323 1,394Non-current assets
Property, plant and equipment Note 13 12,971 13,318Investments in equity-accounted investees Note 19 30 1,173Available-for-sale investments Note 19 262 940Other assets Note 14 246 250Intangible assets Note 15 166 180
Total Assets $ 16,998 $ 17,255
(See Notes to the Consolidated Financial Statements)
2017 2016
LiabilitiesCurrent liabilities
Short-term debt and current portion of long-term debt Note 20, 21 $ 730 $ 884Payables and accrued charges Note 16 807 772Current portion of derivative instrument liabilities Note 17 29 41
1,566 1,697Deferred income tax liabilities on assets held for sale Note 19 36 –
1,602 1,697Non-current liabilities
Long-term debt Note 21 3,711 3,707Derivative instrument liabilities Note 17 35 56Deferred income tax liabilities Note 8 2,205 2,463Pension and other post-retirement benefit liabilities Note 26 440 443Asset retirement obligations and accrued
environmental costs Note 18 651 643Other non-current liabilities and deferred credits 51 47
Total Liabilities 8,695 9,056
Shareholders’ EquityShare capital Note 22 1,806 1,798Contributed surplus 230 222Accumulated other comprehensive income (loss) 25 (25)Retained earnings 6,242 6,204
Total Shareholders’ Equity 8,303 8,199
Total Liabilities and Shareholders’ Equity $ 16,998 $ 17,255
(See Notes to the Consolidated Financial Statements)
Approved by the Board of Directors,
Director Director
62 PotashCorp 2017 Annual Report

in millions of US dollars except as otherwise noted
2017
HIGHLIGHTS
(UNAUDITED)
Highlights to the consolidated statements of financial position
• The current ratio 1 was 2.07 as at December 31, 2017 (2016 –0.82).
• As at December 31, 2017, the company’s property, plant andequipment accounted for 76 percent of total assets (2016 –77 percent).
• The total debt-to-capital ratio 2 was 35 percent as atDecember 31, 2017 (2016 – 36 percent).
• As at December 31, 2017, the company’s defined benefitpension plans were 96 percent funded (2016 – 94 percent).The company’s other defined benefit plans are non-funded.
• SQM, APC and ICL were classified as held for sale at December 31,2017 due to a regulatory requirement to divest in connection withthe Merger.
Page 30 – Financial Condition Review
Pages 34-35 – Capital Structure and Management
1 Current assets / current liabilities.2 Total debt / (total debt + total shareholders’ equity).
0
1
2
3
4
5
2017201620150
10
20
30
40
50
TOTAL ASSETSAs at December 31 – Unaudited
(percentage)
Property, plant and equipment
Assets held for sale
Current assets
All other non-current assets
Investments
TOTAL LIABILITIES AND SHAREHOLDERS’ EQUITYAs at December 31 – Unaudited
(percentage)
Retained earnings
Share capital
All other shareholders’ equity
Long-term debt
Deferred income tax liabilities
Current liabilities
All other non-current liabilities
Deferred income tax liabilitieson assets held for sale
TOTAL DEBT AND TOTAL DEBT TO CAPITALAs at December 31 – Unaudited
($ billions) (percentage)
Total debt Total debt to capital
Source: PotashCorpSource: PotashCorp Source: PotashCorp
20172017
MDA
PotashCorp 2017 Annual Report 63

in millions of US dollars except as otherwise noted
Note 1 Description of Business
Potash Corporation of Saskatchewan Inc. is a crop nutrient company and plays an integral role in global food production. The company produces the threeessential nutrients – potash, nitrogen and phosphate – required to help farmers grow healthier, more abundant crops.
With its subsidiaries, Potash Corporation of Saskatchewan Inc.(“PCS”) – together known as “PotashCorp” or “the company” exceptto the extent the context otherwise requires – forms an integratedfertilizer and related industrial and feed products company. Thecompany is a corporation organized under the laws of Canada andits principal executive office is located at Suite 500,122 – 1st Avenue South, Saskatoon, Saskatchewan, Canada. As atDecember 31, 2017, the company had assets as follows:
Production(Owned)
K Potash
• five operations in the province of Saskatchewan
• one operation in the province of New Brunswick(indefinitely suspended in early 2016 and placed in care-and-maintenance mode)
N Nitrogen
• three plants, one located in each of the states of Georgia,Louisiana and Ohio
• one large-scale operation in the country of Trinidad
P Phosphate
• a mine and processing plants in the state of North Carolina
• a mine and processing plants in the state of Florida
• a processing plant in the state of Louisiana
• phosphate feed plants in the states of Illinois, Missouri, Nebraskaand North Carolina
• an industrial phosphoric acid plant in the state of Ohio
Investments in OtherPotash-Related Companies
I Investments
• Arab Potash Company (“APC”), Jordan
• Canpotex Limited (“Canpotex”) 1
• Israel Chemicals Ltd. (“ICL”), Israel 2
• Sinofert Holdings Limited (“Sinofert”), China
• Sociedad Quimica y Minera de Chile S.A. (“SQM”), Chile
See Note 19 for additional information.
Marketing
Potash for use outside Canada and the US is sold exclusively toCanpotex, which resells potash to offshore customers.
Under its own name, PotashCorp markets and sells potash productsin North America and nitrogen and phosphate products in NorthAmerica and offshore.
Transportation and Distribution(Leased and Owned)
• leased or owned 294 terminals and warehouses(411 multi-product distribution points) in North America
• leased or owned approximately 10,500 railcars in North America
• leased a warehouse in Malaysia
• ownership in a joint venture that leases a dry bulk fertilizer portterminal in Brazil
• leased three vessels used for ammonia transportation
• owned one multi-purpose vessel used for molten sulfur andphosphoric acid transportation
On January 1, 2018, PotashCorp and Agrium combined their businesses in a merger of equals by becoming wholly owned subsidiaries of a new parent company named Nutrien Ltd. (“Nutrien”). See Note 32 foradditional information.
1 A potash export, sales and marketing company owned as at December 31, 2017 in equal shares by PotashCorp and two other Canadian potash producers.2 Subsequent to December 31, 2017, the company divested all of its equity interests in ICL.
I
64 PotashCorp 2017 Annual Report
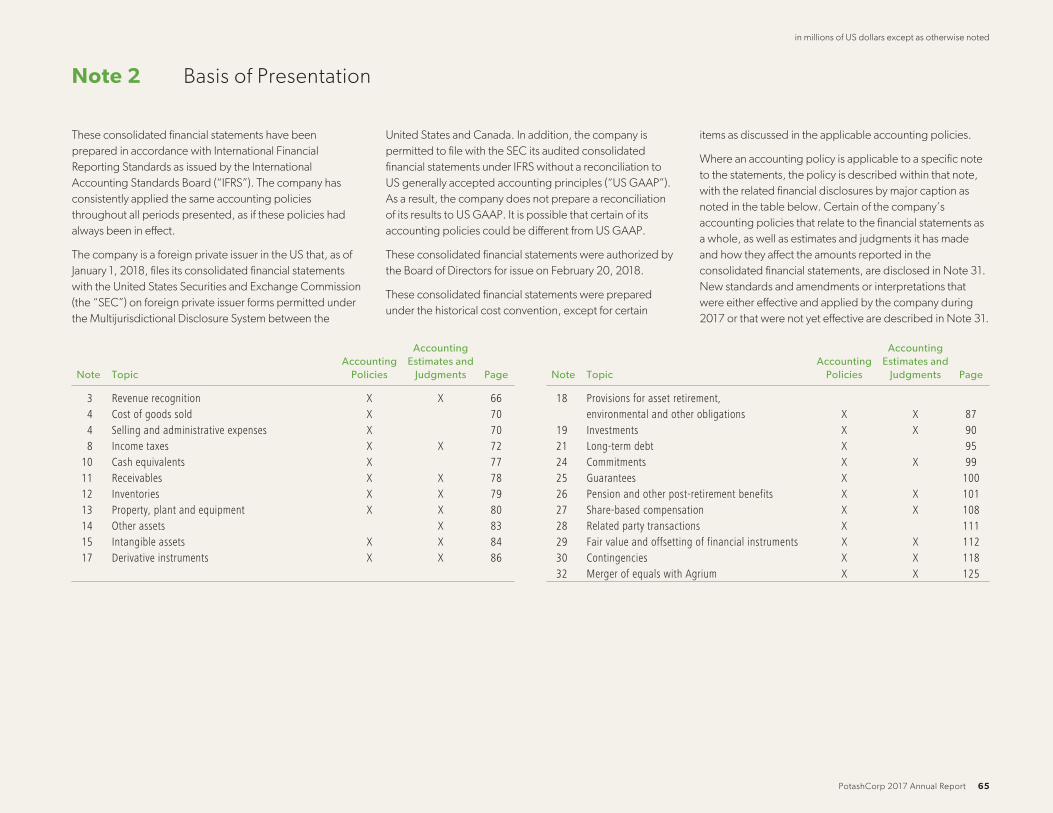
in millions of US dollars except as otherwise noted
Note 2 Basis of Presentation
These consolidated financial statements have been
prepared in accordance with International Financial
Reporting Standards as issued by the International
Accounting Standards Board (“IFRS”). The company has
consistently applied the same accounting policies
throughout all periods presented, as if these policies had
always been in effect.
The company is a foreign private issuer in the US that, as of
January 1, 2018, files its consolidated financial statements
with the United States Securities and Exchange Commission
(the “SEC”) on foreign private issuer forms permitted under
the Multijurisdictional Disclosure System between the
United States and Canada. In addition, the company is
permitted to file with the SEC its audited consolidated
financial statements under IFRS without a reconciliation to
US generally accepted accounting principles (“US GAAP”).
As a result, the company does not prepare a reconciliation
of its results to US GAAP. It is possible that certain of its
accounting policies could be different from US GAAP.
These consolidated financial statements were authorized by
the Board of Directors for issue on February 20, 2018.
These consolidated financial statements were prepared
under the historical cost convention, except for certain
items as discussed in the applicable accounting policies.
Where an accounting policy is applicable to a specific note
to the statements, the policy is described within that note,
with the related financial disclosures by major caption as
noted in the table below. Certain of the company’s
accounting policies that relate to the financial statements as
a whole, as well as estimates and judgments it has made
and how they affect the amounts reported in the
consolidated financial statements, are disclosed in Note 31.
New standards and amendments or interpretations that
were either effective and applied by the company during
2017 or that were not yet effective are described in Note 31.
Note TopicAccounting
Policies
AccountingEstimates and
Judgments Page
3 Revenue recognition X X 664 Cost of goods sold X 704 Selling and administrative expenses X 708 Income taxes X X 72
10 Cash equivalents X 7711 Receivables X X 7812 Inventories X X 7913 Property, plant and equipment X X 8014 Other assets X 8315 Intangible assets X X 8417 Derivative instruments X X 86
Note TopicAccounting
Policies
AccountingEstimates and
Judgments Page
18 Provisions for asset retirement,environmental and other obligations X X 87
19 Investments X X 9021 Long-term debt X 9524 Commitments X X 9925 Guarantees X 10026 Pension and other post-retirement benefits X X 10127 Share-based compensation X X 10828 Related party transactions X 11129 Fair value and offsetting of financial instruments X X 11230 Contingencies X X 11832 Merger of equals with Agrium X X 125
PotashCorp 2017 Annual Report 65

in millions of US dollars except as otherwise noted
Note 3 Segment Information
The company has three reportable operating segments: potash, nitrogen and phosphate. These segments are differentiated by the chemical nutrient contained inthe products that each produces.
Accounting Policies Accounting Estimates and Judgments
Accounting policies of the segments are:
• the same as those described in Note 2 and Note 31; and
• measured in a manner consistent with the financial statements.
Sales revenue is recognized when:
• product is shipped;
• the sale price and costs incurred or to be incurred can be measured reliably; and
• collectibility is probable.
Sales revenue is recorded and measured based on:
• the FOB mine, plant, warehouse or terminal price (except for certain vessel sales or specific product sales that are shipped and recorded on adelivered basis); and
• the fair value of the consideration received or receivable (net of any trade discounts and volume rebates allowed).
Inter-segment sales are made under terms that approximate market value.
Transportation costs are recovered from the customer through sales pricing.
Segments are determined based on reports, used to make strategicdecisions, that are reviewed by the Chief Executive Officer, assessedto be the company’s chief operating decision-maker.
Supporting Information
Financial information on each of these segments is summarized in the following tables:
15%Gross margin as a
percentage of salesearned from all nutrients
in 2017
(unaudited)
2017 Potash Nitrogen Phosphate All Others Consolidated
Sales – third party $ 1,868 $ 1,395 $ 1,284 $ – $ 4,547Freight, transportation and distribution – third party (235) (129) (173) – (537)Net sales – third party 1,633 1,266 1,111 –Cost of goods sold – third party (848) (1,046) (1,441) – (3,335)Margin (cost) on inter-segment sales 1 – 36 (36) – –Gross margin 785 256 (366) – 675Items included in cost of goods sold, selling and
administrative expenses or other expenses:Depreciation and amortization (232) (203) (220) (37) (692)Impairment of property, plant and equipment (Note 13) – – (305) – (305)
Assets 2 9,756 2,577 1,938 2,727 16,998Cash outflows for additions to property, plant and equipment 219 239 185 8 6511 Inter-segment net sales were $74.2 Included in the total assets relating to the All Others segment are $1,858 relating to the investments held for sale as described in Note 19.
66 PotashCorp 2017 Annual Report
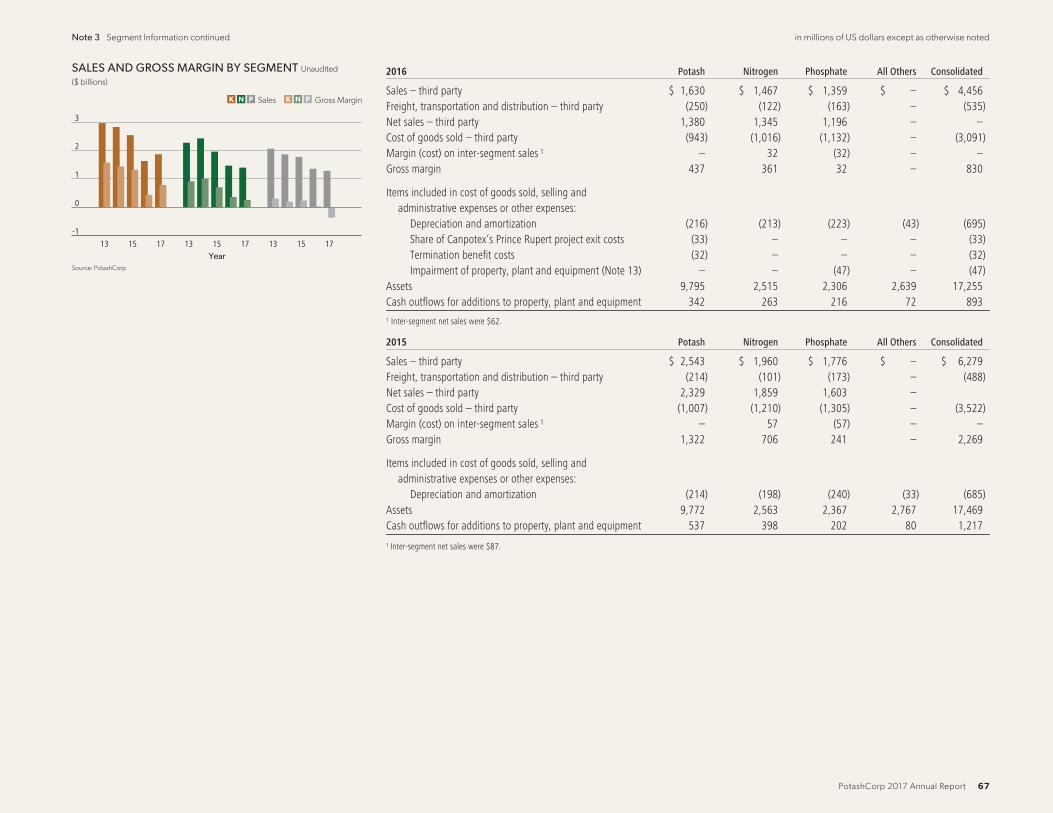
Note 3 Segment Information continued in millions of US dollars except as otherwise noted
-1
0
1
2
3
171513171513171513
Sales
Year
Gross Margin
Source: PotashCorp
SALES AND GROSS MARGIN BY SEGMENT Unaudited
($ billions)
K N P K N P
2016 Potash Nitrogen Phosphate All Others Consolidated
Sales – third party $ 1,630 $ 1,467 $ 1,359 $ – $ 4,456Freight, transportation and distribution – third party (250) (122) (163) – (535)Net sales – third party 1,380 1,345 1,196 – –Cost of goods sold – third party (943) (1,016) (1,132) – (3,091)Margin (cost) on inter-segment sales 1 – 32 (32) – –Gross margin 437 361 32 – 830
Items included in cost of goods sold, selling andadministrative expenses or other expenses:
Depreciation and amortization (216) (213) (223) (43) (695)Share of Canpotex’s Prince Rupert project exit costs (33) – – – (33)Termination benefit costs (32) – – – (32)Impairment of property, plant and equipment (Note 13) – – (47) – (47)
Assets 9,795 2,515 2,306 2,639 17,255Cash outflows for additions to property, plant and equipment 342 263 216 72 8931 Inter-segment net sales were $62.
2015 Potash Nitrogen Phosphate All Others Consolidated
Sales – third party $ 2,543 $ 1,960 $ 1,776 $ – $ 6,279Freight, transportation and distribution – third party (214) (101) (173) – (488)Net sales – third party 2,329 1,859 1,603 –Cost of goods sold – third party (1,007) (1,210) (1,305) – (3,522)Margin (cost) on inter-segment sales 1 – 57 (57) – –Gross margin 1,322 706 241 – 2,269
Items included in cost of goods sold, selling andadministrative expenses or other expenses:
Depreciation and amortization (214) (198) (240) (33) (685)Assets 9,772 2,563 2,367 2,767 17,469Cash outflows for additions to property, plant and equipment 537 398 202 80 1,217
1 Inter-segment net sales were $87.
PotashCorp 2017 Annual Report 67

Note 3 Segment Information continued in millions of US dollars except as otherwise noted
Source: PotashCorp
SALES TO CUSTOMERS Unaudited
(percentage)
United States
Canpotex
Latin America
Canada
India
All others
2017
15%Increase in potash sales dollars
from 2016
(unaudited)
As described in Note 1, Canpotex executed offshore marketing, sales and distribution functions for certain of the company’s products. Financialinformation by geographic area is summarized in the following tables:
Country of Origin
2017 Canada United States Trinidad Other Consolidated
Sales to customers outside the companyCanada $ 95 $ 194 $ – $ – $ 289United States 784 1,657 274 – 2,715Canpotex 1 988 – – – 988Mexico – 76 9 – 85Trinidad – – 132 – 132Brazil 1 26 – – 27Colombia – 12 36 – 48Other Latin America – 26 42 – 68India – 97 7 – 104Other – 10 81 – 91
$ 1,868 $ 2,098 $ 581 $ – $ 4,547
Non-current assets 2 $ 9,501 $ 3,259 $ 554 $ 6 $ 13,320
1 Canpotex’s 2017 sales volumes were made to: Latin America 30%, China 18%, India 12%, Other Asian markets 33%, other markets 7% (Note 28).2 Includes non-current assets other than financial instruments, equity-accounted investees, deferred tax assets and post-employment benefit assets.
Country of Origin
2016 Canada United States Trinidad Other Consolidated
Sales to customers outside the companyCanada $ 97 $ 129 $ – $ – $ 226United States 752 1,820 314 – 2,886Canpotex 1 778 – – – 778Mexico – 91 7 – 98Trinidad – – 115 – 115Brazil 2 39 – – 41Colombia – 6 29 – 35Other Latin America 1 22 45 – 68India – 138 – – 138Other – 15 56 – 71
$ 1,630 $ 2,260 $ 566 $ – $ 4,456
Non-current assets 2 $ 9,534 $ 3,532 $ 597 $ 14 $ 13,6771 Canpotex’s 2016 sales volumes were made to: Latin America 33%, China 16%, India 9%, Other Asian markets 36%, other markets 6% (Note 28).2 Includes non-current assets other than financial instruments, equity-accounted investees, deferred tax assets and post-employment benefit assets.
68 PotashCorp 2017 Annual Report

Note 3 Segment Information continued in millions of US dollars except as otherwise noted
Country of Origin
2015 Canada United States Trinidad Other Consolidated
Sales to customers outside the companyCanada $ 119 $ 175 $ – $ – $ 294United States 913 2,299 506 – 3,718Canpotex 1 1,346 – – – 1,346Mexico 2 98 – – 100Trinidad – – 259 – 259Brazil 65 61 – – 126Colombia 37 17 35 – 89Other Latin America 61 39 53 – 153India – 144 – – 144Other – 24 26 – 50
$ 2,543 $ 2,857 $ 879 $ – $ 6,279
Non-current assets 2 $ 9,472 $ 3,472 $ 625 $ 16 $ 13,5851 Canpotex’s 2015 sales volumes were made to: Latin America 30%, China 20%, India 9%, Other Asian markets 34%, other markets 7% (Note 28).2 Includes non-current assets other than financial instruments, equity-accounted investees, deferred tax assets and post-employment benefit assets.
PotashCorp 2017 Annual Report 69

in millions of US dollars except as otherwise noted
Note 4 Nature of Expenses
Accounting Policies
Cost of goods sold is costs primarily incurred at, and charged to, anactive producing facility.
The primary components of selling and administrative expenses arecompensation, other employee benefits, supplies, communications,travel, professional services and depreciation and amortization.
$258Increase inimpairment
from 2016
(unaudited)
Supporting Information
Expenses by nature were comprised of:
Cost of Goods Sold Other Total
2017 2016 2015 2017 2016 3 2015 3 2017 2016 3 2015 3
Depreciation and amortization $ 655 $ 652 $ 652 $ 37 $ 43 $ 33 $ 692 $ 695 $ 685Employee costs 1 563 575 566 113 93 90 676 668 656Energy and fuel 389 358 452 – – – 389 358 452Freight – – – 372 367 345 372 367 345Impairment of property, plant and
equipment (Note 13) 305 47 – – – – 305 47 –Raw materials 2
Natural gas – feedstock 260 250 359 – – – 260 250 359Sulfur 143 151 236 – – – 143 151 236Ammonia 103 92 114 – – 103 92 114Natural gas hedge loss 55 77 89 – – – 55 77 89Reagents 77 76 87 – – – 77 76 87Other raw materials 107 110 131 – – – 107 110 131
Contract services 255 256 305 – – – 255 256 305Supplies 238 258 289 – – – 238 258 289Railcar and vessel costs – – – 102 106 86 102 106 86Transaction costs – – – 84 18 – 84 18 –Off-site warehouse costs – – – 47 47 47 47 47 47Property and other taxes 40 39 38 – – – 40 39 38Royalties 39 38 69 – – – 39 38 69Products purchased for resale 18 1 58 – – – 18 1 58Other 88 111 77 97 108 93 185 219 170
Total $ 3,335 $ 3,091 $ 3,522 $ 852 $ 782 $ 694 $ 4,187 $ 3,873 $ 4,216
Expenses included in:Freight, transportation and distribution $ 537 $ 535 $ 488Cost of goods sold 3,335 3,091 3,522Selling and administrative expenses 214 212 239Transaction costs 84 18 –Other expenses (income) 17 17 (33)
1 Includes employee benefits and share-based compensation.2 Includes inbound freight, purchasing and receiving costs.3 Certain amounts have been reclassified for presentation purposes as described in Note 33.
70 PotashCorp 2017 Annual Report

in millions of US dollars except as otherwise noted
Note 5 Provincial Mining and Other Taxes
Under Saskatchewan provincial legislation, thecompany is subject to resource taxes, includingthe potash production tax and the resourcesurcharge.
2017 2016 2015
Potash production tax $ 95 $ 74 $ 239Saskatchewan resource surcharge and other 56 50 71
$ 151 $ 124 $ 310
Note 6 Other (Expenses) Income
2017 2016 2015
Foreign exchange (loss) gain $ (21) $ (9) $ 48Share of earnings of equity-accounted investees 7 3 9Dividend income – 2 2Impairment of available-for-sale investment – (10) –Other (3) (3) (26)
$ (17) $ (17) $ 33
Note 7 Finance Costs
Finance costs mainly arise from interest expenseon long-term senior notes.
2017 2016 2015
Interest expense onShort-term debt $ 9 $ 9 $ 4Long-term debt 206 188 198
Interest on net defined benefit pension and otherpost-retirement plan obligations (Note 26) 19 19 19
Unwinding of discount on asset retirement obligations (Note 18) 17 14 13Borrowing costs capitalized to property, plant and equipment (11) (11) (40)Interest income (2) (3) (2)
$ 238 $ 216 $ 192
Borrowing costs capitalized to property, plant and equipment during 2017 were calculated by applying an average capitalization rate of4.4 percent (2016 – 4.0 percent, 2015 – 4.5 percent) to expenditures on qualifying assets.
See Note 10 for interest paid.
PotashCorp 2017 Annual Report 71

in millions of US dollars except as otherwise noted
Note 8 Income Taxes
This note explains the company’s income tax recovery (expense) and tax-related balances within the consolidated financial statements. The deferred taxsection provides information on expected future tax payments.
Accounting Policies
The company operates in a specialized industry and in several tax jurisdictions. As a result, its income is subject to various rates of taxation.Taxation on items recognized in the statements of income, other comprehensive income (“OCI”) or contributed surplus is recognized in the samelocation as those items.
Taxation on earnings is comprised of current and deferred income tax.
Current income tax is: Deferred income tax is:
• the expected tax payable on the taxable income for the year;
• calculated using rates enacted or substantively enacted at theconsolidated statements of financial position date in thecountries where the company’s subsidiaries, held for saleinvestees and equity-accounted investees operate and generatetaxable income; and
• inclusive of any adjustment to income tax payable orrecoverable in respect of previous years.
• recognized using the liability method;
• based on temporary differences between financialstatements’ carrying amounts of assets and liabilities andtheir respective income tax bases; and
• determined using tax rates that have been enacted orsubstantively enacted by the statements of financialposition date and are expected to apply when the relateddeferred income tax asset is realized or the deferred incometax liability is settled.
The realized and unrealized excess tax benefit from share-based payment arrangements is recognized in contributed surplus as current anddeferred tax, respectively.
Uncertain income tax positions are accounted for using the standards applicable to current income tax liabilities and assets; i.e., both liabilitiesand assets are recorded when probable and measured at the amount expected to be paid to (recovered from) the taxation authorities using thecompany’s best estimate of the amount.
Deferred income tax is not accounted for:
• with respect to investments in subsidiaries and equity-accounted investees where the company is able to control the reversal of the temporarydifference and that difference is not expected to reverse in the foreseeable future; and
• if arising from initial recognition of an asset or liability in a transaction, other than a business combination, that at the time of the transactionaffects neither accounting nor taxable profit or loss.
Deferred income tax assets are reviewed at each statements of financial position date and amended to the extent that it is no longer probablethat the related tax benefit will be realized.
Accounting Estimates and Judgments
Estimates and judgments to determine the company’s taxes areimpacted by:
• the breadth of the company’s operations; and
• global complexity of tax regulations.
The final taxes paid, and potential adjustments to tax assets andliabilities, are dependent upon many factors including:
• negotiations with taxing authorities in various jurisdictions;
• outcomes of tax litigation; and
• resolution of disputes arising from federal, provincial, state andlocal tax audits.
Estimates and judgments are used to recognize the amount ofdeferred tax assets, which:
• includes the probability that future taxable profit will be availableto use deductible temporary differences; and
• could be reduced if projected income is not achieved or increasedif income previously not projected becomes probable.
72 PotashCorp 2017 Annual Report

Note 8 Income Taxes continued in millions of US dollars except as otherwise noted
Accounting Policies continued
Income tax assets and liabilities are offset when:
For current income taxes, the company has: For deferred income taxes:
• a legally enforceable right 1 to offset the recognizedamounts; and
• the intention to settle on a net basis or realize theasset and settle the liability simultaneously.
• the company has a legally enforceable right to set off current tax assetsagainst current tax liabilities; and
• they relate to income taxes levied by the same taxation authority oneither: (1) the same taxable entity; or (2) different taxable entitiesintending to settle current tax liabilities and assets on a net basis, orrealize assets and settle liabilities simultaneously in each future period. 2
1 For income taxes levied by the same taxation authority and the authority permits the company to make or receive a single net payment or receipt.2 In which significant amounts of deferred tax liabilities or assets expected are to be settled or recovered.
Supporting Information
Income Taxes included in Net Income from Continuing Operations
The provision for income taxes differs from the amount that would have resulted from applying the Canadian statutory income tax rates toincome before income taxes as follows:
2017 2016 1 2015 1
(Loss) income before income taxes
Canada $ 123 $ (43) $ 726
United States (271) 174 585
Trinidad 95 88 224
Other 24 24 26
$ (29) $ 243 $ 1,561
Canadian federal and provincial statutory income tax rate 27.02% 27.02% 27.00%
Income tax at statutory rates $ 8 $ (66) $ (421)
Adjusted for the effect of:
Impact of tax rate changes 187 – –
Production-related deductions 14 27 37
Tax authority examinations – 16 17
Impact of foreign tax rates (US, Trinidad and other) (25) (17) (62)
Other (1) (4) (17)
Income tax recovery (expense) included in net income from continuing operations $ 183 $ (44) $ (446)
1 Certain amounts have been reclassified as a result of investments in SQM, APC and ICL being classified as discontinued operations in 2017.
The increase in the Canadian and provincial statutory income tax rate from 2015 to 2016 was the result of a legislated increase in New Brunswickincome tax rates.
Accounting Estimates and Judgments continued
$187Deferred tax recoveryfrom tax rate decrease due to
US tax reform legislation
(unaudited)
PotashCorp 2017 Annual Report 73

Note 8 Income Taxes continued in millions of US dollars except as otherwise noted
Total income tax recovery (expense), included in net income from continuing operations, was comprised of the following:
2017 2016 1 2015 1
Current income taxTax expense for current year $ (70) $ (76) $ (259)Adjustments in respect of prior years (20) 13 16
Total current income tax expense (90) (63) (243)
Deferred income taxImpact of tax rate changes 187 – –Origination and reversal of temporary differences 69 13 (196)Adjustment in respect of prior years 20 7 2Other (3) (1) (9)
Total deferred income tax recovery (expense) 273 19 (203)
Income tax recovery (expense) included in net income from continuing operations $ 183 $ (44) $ (446)
1 Certain amounts have been reclassified as a result of investments in SQM, APC and ICL being classified as discontinued operations in 2017.
Income Tax Balances
Income tax balances within the consolidated statements of financial position as at December 31 were comprised of the following:
Income Tax Assets (Liabilities) Statements of Financial Position Location 2017 2016
Current income tax assetsCurrent Receivables (Note 11) $ 24 $ 41Non-current Other assets (Note 14) 64 67
Deferred income tax assets Other assets 18 10
Total income tax assets $ 106 $ 118
Current income tax liabilitiesCurrent Payables and accrued charges (Note 16) $ (16) $ (25)Non-current Other non-current liabilities and deferred credits (43) (43)
Deferred income tax liabilities Deferred income tax liabilities (2,205) (2,463)
Total income tax liabilities $(2,264) $(2,531)
-450
-300
-150
0
150
300
201720162015
Source: PotashCorp
INCOME TAX RECOVERY (EXPENSE) Unaudited
($ millions)
Current income tax Deferred income tax
74 PotashCorp 2017 Annual Report
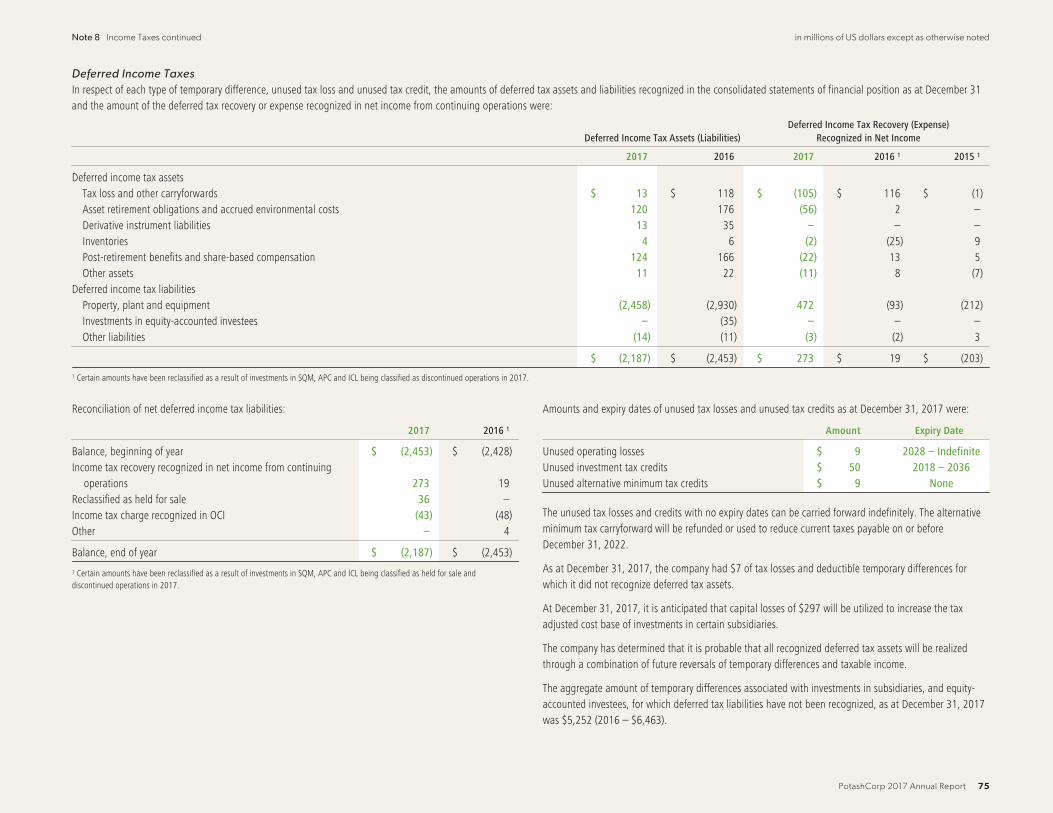
Note 8 Income Taxes continued in millions of US dollars except as otherwise noted
Deferred Income Taxes
In respect of each type of temporary difference, unused tax loss and unused tax credit, the amounts of deferred tax assets and liabilities recognized in the consolidated statements of financial position as at December 31and the amount of the deferred tax recovery or expense recognized in net income from continuing operations were:
Deferred Income Tax Assets (Liabilities)Deferred Income Tax Recovery (Expense)
Recognized in Net Income
2017 2016 2017 2016 1 2015 1
Deferred income tax assetsTax loss and other carryforwards $ 13 $ 118 $ (105) $ 116 $ (1)Asset retirement obligations and accrued environmental costs 120 176 (56) 2 –Derivative instrument liabilities 13 35 – – –Inventories 4 6 (2) (25) 9Post-retirement benefits and share-based compensation 124 166 (22) 13 5Other assets 11 22 (11) 8 (7)
Deferred income tax liabilitiesProperty, plant and equipment (2,458) (2,930) 472 (93) (212)Investments in equity-accounted investees – (35) – – –Other liabilities (14) (11) (3) (2) 3
$ (2,187) $ (2,453) $ 273 $ 19 $ (203)1 Certain amounts have been reclassified as a result of investments in SQM, APC and ICL being classified as discontinued operations in 2017.
Reconciliation of net deferred income tax liabilities:
2017 2016 1
Balance, beginning of year $ (2,453) $ (2,428)Income tax recovery recognized in net income from continuing
operations 273 19Reclassified as held for sale 36 –Income tax charge recognized in OCI (43) (48)Other – 4
Balance, end of year $ (2,187) $ (2,453)
1 Certain amounts have been reclassified as a result of investments in SQM, APC and ICL being classified as held for sale anddiscontinued operations in 2017.
Amounts and expiry dates of unused tax losses and unused tax credits as at December 31, 2017 were:
Amount Expiry Date
Unused operating losses $ 9 2028 – IndefiniteUnused investment tax credits $ 50 2018 – 2036Unused alternative minimum tax credits $ 9 None
The unused tax losses and credits with no expiry dates can be carried forward indefinitely. The alternativeminimum tax carryforward will be refunded or used to reduce current taxes payable on or beforeDecember 31, 2022.
As at December 31, 2017, the company had $7 of tax losses and deductible temporary differences forwhich it did not recognize deferred tax assets.
At December 31, 2017, it is anticipated that capital losses of $297 will be utilized to increase the taxadjusted cost base of investments in certain subsidiaries.
The company has determined that it is probable that all recognized deferred tax assets will be realizedthrough a combination of future reversals of temporary differences and taxable income.
The aggregate amount of temporary differences associated with investments in subsidiaries, and equity-accounted investees, for which deferred tax liabilities have not been recognized, as at December 31, 2017was $5,252 (2016 – $6,463).
PotashCorp 2017 Annual Report 75

in millions of US dollars except as otherwise noted
Note 9 Net Income per Share
Basic net income per share provides a measure of the interests of each ordinary common share in the company’s performance over the year.Diluted net income per share adjusts basic net income per share for the effects of all dilutive potential common shares.
2017 2016 2015
Basic net income per share 1
Net income from continuing operations available to common shareholders $ 154 $ 199 $ 1,115Net income from discontinued operations available to common shareholders 173 124 155
Total Net Income $ 327 $ 323 $ 1,270
Weighted average number of common shares 840,079,000 838,928,000 834,141,000
Basic net income per share from continuing operations $ 0.18 $ 0.24 $ 1.34Basic net income per share from discontinued operations $ 0.21 $ 0.15 $ 0.18Basic net income per share from continuing and discontinued operations $ 0.39 $ 0.39 $ 1.52
Diluted net income per share 1
Net income from continuing operations available to common shareholders $ 154 $ 199 $ 1,115Net income from discontinued operations available to common shareholders 173 124 155
Total Net Income $ 327 $ 323 $ 1,270
Weighted average number of common shares 840,079,000 838,928,000 834,141,000Dilutive effect of stock options 199,000 210,000 3,208,000Dilutive effect of share-settled performance share units 38,000 321,000 –
Weighted average number of diluted common shares 840,316,000 839,459,000 837,349,000
Diluted net income per share from continuing operations $ 0.18 $ 0.24 $ 1.34Diluted net income per share from discontinued operations $ 0.21 $ 0.14 $ 0.18Diluted net income per share from continuing and discontinued operations $ 0.39 $ 0.38 $ 1.52
1 Net income per share calculations are based on dollar and share amounts each rounded to the nearest thousand.
Net income per share = net income available to common shareholders / weighted average number of common shares issued and outstandingduring the year. Diluted net income per share incorporated the following adjustments. The denominator was:
▲ increased by the total of the additional common shares that would have been issued assuming exercise of all stock options with exerciseprices at or below the average market price for the year;
▲ increased by the total of the additional share-settled performance share units (“PSUs”) that could be issued if vesting criteria are achieved;and
▼ decreased by the number of shares that the company could have repurchased if it had used the assumed proceeds from the exercise ofstock options to repurchase them on the open market at the average share price for the year.
For performance-based stock option plans, the number ofcontingently issuable common shares included in the calculation wasbased on the number of shares, if any, that would be issuable if theend of the reporting period was the end of the performance periodand the effect was dilutive.
Options excluded from the calculation of diluted net income pershare due to the option exercise prices being greater than theaverage market price of common shares were as follows:
2017 2016 2015
Weighted averagenumber of options 12,304,351 12,697,691 7,269,775
Option plan years fullyexcluded
2008-2015,2017
2007-2014 2008, 2009,2011-2013
0.0
0.5
1.0
1.5
2.0
2.5
20172016201520142013
Source: PotashCorp
NET INCOME PER SHARE Unaudited
($ per share)
DilutedBasic
Net income per share fromcontinuing operationsNet income per share
Diluted
76 PotashCorp 2017 Annual Report

in millions of US dollars except as otherwise noted
Note 10 Consolidated Statements of Cash Flow
Accounting Policy
Highly liquid investments with a maturity of three months or less from the date of purchase are considered to be cash equivalents.
For the years ended December 31 2017 2016 2015
Reconciliation of cash provided by operating activitiesNet income $ 327 $ 323 $ 1,270Adjustments to reconcile net income to cash provided by operatingactivities
Depreciation and amortization 692 695 685Impairment of property, plant and equipment (Note 13) 305 47 –Net (undistributed) distributed earnings of equity-accounted
investees (1) 70 (35)Share-based compensation 11 2 22(Recovery of) provision for deferred income tax (273) (22) 204Pension and other post-retirement benefits 64 46 30Asset retirement obligations and accrued environmental costs 7 29 20Other long-term liabilities and miscellaneous 21 10 15
Subtotal of adjustments 826 877 941Changes in non-cash operating working capitalReceivables 47 114 259Inventories (10) (21) (99)Prepaid expenses and other current assets (13) 17 (19)Payables and accrued charges 48 (50) (14)
Subtotal of changes in non-cash operating working capital 72 60 127
Cash provided by operating activities $ 1,225 $ 1,260 $ 2,338
Supplemental cash flow disclosureInterest paid $ 198 $ 189 $ 193Income taxes paid $ 83 $ 50 $ 171
$1.2 billionTotal cash provided by
operating activitiesin 2017
(unaudited)
PotashCorp 2017 Annual Report 77

Note 10 Consolidated Statements of Cash Flow continued in millions of US dollars except as otherwise noted
The following is a summary of changes in liabilities arising from financing activities:
December 31,2016 Cash Flows 1
Non-cashChanges
December 31,2017
Short-term debt and current portion of long-term debt 1 $ 884 $ (159) $ 5 $ 730Long-term debt 3,707 (1) 5 3,711
Total liabilities from financing activities $ 4,591 $ (160) $ 10 $ 4,4411 Cash inflows and cash outflows arising from short-term debt transactions are presented on a net basis.
Note 11 Receivables
Receivables represent amounts the company expects to collect from other parties. Trade receivables consist mainly of amounts owed to PotashCorp by itscustomers, the largest individual customer being the related party, Canpotex.
Accounting Policies
Trade receivables are recognized initially at fair value and subsequently measured at amortized cost less provision for impairment of tradeaccounts receivable. When a trade receivable is uncollectible, it is written off against the provision. Subsequent recoveries of amountspreviously written off are credited to the consolidated statements of income.
Supporting Information2017 2016
Trade accounts – Canpotex (Note 28) $ 82 $ 141– Other 314 292
Less provision for impairment of trade accounts receivable (6) (6)
390 427Income taxes receivable (Note 8) 24 41Margin deposits on derivative instruments 21 27GST and VAT receivable 24 22Other non-trade accounts 30 28
$ 489 $ 545
Accounting Estimates and Judgments
Determining when amounts are deemed uncollectible requiresjudgment.
78 PotashCorp 2017 Annual Report

in millions of US dollars except as otherwise noted
Note 12 Inventories
Inventories consist of product from the company’s three segments – potash, nitrogen and phosphate – in varying stages of the production process.
Accounting Policies
Inventories are valued monthly at the lower of cost and net realizable value. Costs, allocated to inventory using the weighted average costmethod, include direct acquisition costs, direct costs related to the units of production and a systematic allocation of fixed and variableproduction overhead, as applicable.
Net realizable value is based on:
For products and raw materials For materials and supplies
• selling price of the finished product (in ordinary course ofbusiness);
• less the estimated costs of completion; and
• less the estimated costs to make the sale.
• replacement cost, considered to be the best availablemeasure of net realizable value.
A writedown is recognized if carrying amount exceeds net realizable value, and may be reversed if the circumstances which caused it no longer exist.
Supporting Information
Inventories as at December 31 were comprised of:
2017 2016
Finished products $ 260 $ 269Intermediate products 202 174Raw materials 62 75Materials and supplies 264 250
$ 788 $ 768
The following items affected cost of goods sold during the year:
2017 2016 2015
Expensed inventories before the following items $ 2,791 $ 2,712 $ 3,233Reserves, reversals and writedowns of inventories 44 31 11
$ 2,835 $ 2,743 $ 3,244
The carrying amount of inventory recorded at net realizable value was $45 as at December 31, 2017 (2016 – $47), with the remaininginventory recorded at cost.
Accounting Estimates and Judgments
Judgment involves determining:
• the appropriate measure of net realizable value; and
• the allocation of production overhead to inventories.
Source: PotashCorp
FINISHED PRODUCT INVENTORIES BY SEGMENTAs at December 31 – Unaudited
($ millions)
Potash Nitrogen Phosphate
$260 $269
2017 2016
PotashCorp 2017 Annual Report 79

in millions of US dollars except as otherwise noted
Note 13 Property, Plant and Equipment
The majority of the company’s tangible assets are the buildings, machinery and equipment used to produce its three nutrients. These assets are depreciated overtheir estimated useful lives.
Accounting Policies
Property, plant and equipment (which include certain minedevelopment costs, pre-stripping costs and assets under construction)are carried at cost less accumulated depreciation and any recognizedimpairment loss.
Cost includes all expenditures directly attributable to bringing theasset to the location and installing it in working condition for itsintended use, including:
• income or expenses;1
• a reduction for investment tax credits to which the company isentitled;
• additions, betterments and renewals; and
• borrowing costs during construction.2
Each component of an item of property, plant and equipment with acost that is significant in relation to the item’s total cost isdepreciated separately. When the cost of replacing part of an item ofproperty, plant and equipment is capitalized, the carrying amount ofthe replaced part is derecognized. The cost of major inspections andoverhauls is capitalized and depreciated over the period until thenext major inspection or overhaul. Maintenance and repairexpenditures that do not improve or extend productive life areexpensed in the period incurred.
Any gain or loss arising on the disposal or retirement of an item ofproperty, plant and equipment is determined as the differencebetween the sale proceeds and the carrying amount of the asset, andis recognized in operating income.
1 Derived from the necessity to bring an asset under construction to the location andcondition necessary to be capable of operating in the manner and location intended.
2 The capitalization rate is based on the weighted average interest rate on all of thecompany’s outstanding third-party debt. Capitalization ceases when assets aresubstantially ready for their intended use.
Accounting Estimates and Judgments
Judgment involves determining:
• which costs are directly attributable (e.g., labor, overhead) and when income or expenses derived from an asset under construction arerecognized as part of the asset cost;
• appropriate timing for cessation of cost capitalization1, considering the circumstances and the industry in which the asset is to be operated,normally predetermined by management with reference to such factors as productive capacity;
• the appropriate level of componentization (for individual components for which different depreciation methods or rates are appropriate);
• which repairs and maintenance constitute major inspections and overhauls; and
• the appropriate life over which such costs should be amortized.
Certain mining and milling assets are depreciated using the units-of-production method based on the shorter of estimates of reserves or servicelives. Pre-stripping costs are depreciated on a units-of-production basis over the ore mined from the mineable acreage stripped. Land is notdepreciated. Other asset classes are depreciated on a straight-line basis.
The following estimated useful lives have been applied to the majority of property, plant and equipment assets as at December 31, 2017:
Useful Life Range (years) Weighted Average Useful Life (years) 3
Land improvements 8 to 69 38Buildings and improvements 9 to 60 38Machinery and equipment 2 3 to 60 25
Asset residual values and useful lives are reviewed, and adjusted if appropriate, at the end of each reporting period. Changes in the expecteduseful life or the expected pattern of consumption of future economic benefits embodied in the asset are accounted for by changing thedepreciation period or method, as appropriate, and are treated as changes in accounting estimates.
The company assesses its existing assets and their depreciable lives in connection with the review of mine and plant operating plans at the endof each reporting period. When it is determined that assigned asset lives do not reflect the expected remaining period of benefit, prospectivechanges are made to their depreciable lives. Uncertainties are inherent in estimating reserve quantities, particularly as they relate to assumptionsregarding future prices, the geology of the company’s mines, the mining methods used and the related costs incurred to develop and mine itsreserves. Changes in these assumptions could result in material adjustments to reserve estimates, which could result in impairments or changesto depreciation expense in future periods, particularly if reserve estimates are reduced.1 Generally when the asset or asset under construction is substantially complete and in the location and condition necessary for it to be capable of operating in the manner intended
by management.2 Comprised primarily of plant equipment.3 Weighted by carrying amount as at December 31, 2017.
80 PotashCorp 2017 Annual Report

Note 13 Property, Plant and Equipment continued in millions of US dollars except as otherwise noted
Accounting policies, estimates and judgments related to impairment of long-lived assets are included within Note 31 on Page 121.
Supporting Information
Land andImprovements
Buildings andImprovements
Machinery andEquipment
Mine DevelopmentCosts
Assets UnderConstruction Total
Carrying amount – December 31, 2016 $ 618 $ 4,212 $ 6,859 $ 1,027 $ 602 $ 13,318Additions – – 9 88 528 625Change in investment tax credits – – 7 – – 7Disposals – – (2) – – (2)Transfers 63 71 521 (21) (634) –Change in asset retirement costs – – – 15 – 15Depreciation (19) (83) (487) (98) – (687)Impairment (50) (16) (163) (32) (44) (305)
Carrying amount – December 31, 2017 $ 612 $ 4,184 $ 6,744 $ 979 $ 452 $ 12,971
Balance as at December 31, 2017 comprised of:Cost $ 868 $ 4,837 $ 12,000 $ 1,985 $ 452 $ 20,142Accumulated depreciation (256) (653) (5,256) (1,006) – (7,171)
Carrying amount $ 612 $ 4,184 $ 6,744 $ 979 $ 452 $ 12,971
Carrying amount – December 31, 2015 $ 538 $ 3,636 $ 7,005 $ 571 $ 1,462 $ 13,212Additions – 2 9 65 744 820Change in investment tax credits – – (6) – 5 (1)Disposals – – (1) – – (1)Transfers 102 639 391 469 (1,601) –Change in asset retirement costs – – – 12 – 12Depreciation (22) (65) (500) (90) – (677)Impairment – – (39) – (8) (47)
Carrying amount – December 31, 2016 $ 618 $ 4,212 $ 6,859 $ 1,027 $ 602 $ 13,318
Balance as at December 31, 2016 comprised of:Cost $ 807 $ 4,813 $ 11,574 $ 1,930 $ 602 $ 19,726Accumulated depreciation (189) (601) (4,715) (903) – (6,408)
Carrying amount $ 618 $ 4,212 $ 6,859 $ 1,027 $ 602 $ 13,318
Depreciation of property, plant and equipment was included in the following:
2017 2016 2015
Cost of goods sold and selling and administrative expenses $ 668 $ 671 $ 667Cost of property, plant and equipment and inventory 19 6 13
$ 687 $ 677 $ 680
PotashCorp 2017 Annual Report 81

Note 13 Property, Plant and Equipment continued in millions of US dollars except as otherwise noted
During the fourth quarter of 2017, an indicator of impairment wasidentified in the White Springs and Feed Plants cash-generating unit(“CGU”), primarily as a result of reduced efficiency of conversion ofrock to finished product, shifts in production mix and deterioratingprice expectations. The White Springs and Feed Plants CGU, part ofthe phosphate segment reported in Note 3, had a recoverableamount of $96 at December 31, 2017 based on value in use. As aresult, an impairment loss of $250 was recognized in phosphate costof goods sold during the year ended December 31, 2017. Therecoverable amount was calculated using an after-tax discount rateof 8 percent based on the estimated weighted average cost of capitalof a listed entity with similar assets.
In 2017, phosphate property, plant and equipment at Aurora wereimpaired by $29 (carrying amount of $29) in the third quarter and$26 (carrying amount of $31) in the fourth quarter, related to a feedproduct the company will no longer produce and a mining methodthe company will no longer use, respectively. Recoverable amountswere based on fair value less costs to sell.
During the fourth quarter of 2016, an indicator of impairment wasdetermined to exist in the Geismar phosphate CGU, as a result ofsustained losses in a contract. The Geismar phosphate CGU, part ofthe phosphate segment reported in Note 3, had a recoverableamount of $NIL at December 31, 2016 based on value in use. As aresult, an impairment loss of $20 was recognized in phosphate costof goods sold during the year ended December 31, 2016.
During the first quarter of 2016, property, plant and equipment inthe phosphate segment with a carrying amount of $27 wasdetermined to have a recoverable amount of $NIL related to aproduct that the company will no longer produce. An impairmentloss of $27 was recognized in phosphate cost of goods sold duringthe year ended December 31, 2016.
There were no impairments recorded in 2015.
Operating accounts payable incurred for additions to property, plantand equipment do not result in a cash outflow. When paid, the
liabilities are reflected as a cash outflow within investing activities.The applicable net change in accounts payable that was reclassified(to) from investing activities (from) to operating activities on theconsolidated statements of cash flow in 2017 was $(22) (2016 –$(68), 2015 – $19).
As at December 31, 2017, the carrying amount of idled assets(including Picadilly, New Brunswick, Cory and Lanigan,Saskatchewan potash assets, and Aurora, North Carolina phosphateassets) was $2,267 (2016 – $2,142, 2015 – $2,015).
10
11
12
13
14
15
2017Other
Depreciation
Additions
2016Other
Depreciation
Additions
2015
Source: PotashCorp
RECONCILIATION OF CHANGES IN PROPERTY, PLANT AND EQUIPMENT CARRYING AMOUNTAs at December 31 – Unaudited
($ billions)
0.8 (0.7) 0.6 (0.6)
(0.3)13.0
13.2 13.3
Source: PotashCorp
CARRYING AMOUNTS OFPROPERTY, PLANT AND EQUIPMENTAs at December 31 – Unaudited
(percentage)
Machinery and equipment
Buildings and improvements
Assets under construction
Mine development costs
Land and improvements2017
82 PotashCorp 2017 Annual Report

in millions of US dollars except as otherwise noted
Note 14 Other Assets
Accounting Estimates and Judgments
The costs of certain ammonia catalysts are capitalized to other assetsand are amortized, net of residual value, on a straight-line basis overtheir estimated useful lives of one to 12 years.
Upfront lease costs are capitalized to other assets and amortized overthe life of the leases on a straight-line basis, the latest of whichextends through 2037.
Supporting Information
Other assets as at December 31 were comprised of:
2017 2016
Long-term income taxes receivable (Note 8) $ 64 $ 67Ammonia catalysts – net of accumulated amortization of $61 (2016 – $53) 42 39Accrued pension benefit asset (Note 26) 24 23Investment tax credits receivable 24 23Margin deposits on derivative instruments 17 34Upfront lease costs – net of accumulated amortization of $12 (2016 – $11) 15 16Other – net of accumulated amortization of $23 (2016 – $21) 60 48
$ 246 $ 250
Amortization of other assets included in cost of goods sold and in selling and administrative expenses for 2017 was $9 (2016 – $10, 2015 – $11).
PotashCorp 2017 Annual Report 83

in millions of US dollars except as otherwise noted
Note 15 Intangible Assets
Intangible assets, including goodwill, are identifiable, represent future economic benefits and are controlled by the company. Goodwill is not amortized but issubject to annual impairment reviews.
Accounting Policies Accounting Estimates and Judgments
An intangible asset is recognized when it is:
• reliably measurable;
• identifiable (separable or arises from contractual rights);
• probable that expected future economic benefits will flow to the company; and
• controllable by the company.
Intangible assets are recorded initially at cost, including development and applicable employee costs, and relate primarily to:
• production and technology rights;
• contractual customer relationships;
• computer software;
• goodwill; and
• computer software and other developed projects (internally generated).
The following expenses are never recognized as an asset in current or subsequent periods:
• costs to maintain software programs; and
• development costs previously recognized as an expense.
Amortization is recognized in net income as an expense related to the function of the intangible asset.
Useful lives are reviewed, and adjusted if appropriate, at the end of each reporting period.
All business combinations are accounted for using the acquisition method. Identifiable intangible assets are recognized separately from goodwill.Goodwill is carried at cost, is no longer amortized and represents the excess of the cost of an acquisition over the fair value of the company’sshare of the net identifiable assets of the acquired subsidiary or equity method investee at the date of acquisition.
Separately recognized goodwill is carried at cost less accumulated amortization (recognized prior to 2002) and impairment losses. Gains andlosses on the disposal of an entity include the carrying amount of goodwill relating to the entity sold.
Judgment is applied to determine non-tangible expenditures eligiblefor capitalization.
Estimation is applied to determine expected useful lives used inthe straight-line amortization of intangible assets with finite lives.Changes in accounting estimates can result from changes in usefullife or the expected pattern of consumption of an asset (takeninto account by changing the amortization period or method,as appropriate).
Goodwill is allocated to CGUs or groups of CGUs for the purpose ofimpairment testing based on the level at which it is monitored bymanagement, and not at a level higher than an operating segment.The allocation is made to those CGUs or groups of CGUs expectedto benefit from the business combination in which the goodwillarose.
84 PotashCorp 2017 Annual Report

Note 15 Intangible Assets continued in millions of US dollars except as otherwise noted
Supporting Information
Goodwill is the only intangible asset with an indefinite useful life recognized by the company. All other intangible assets have finite useful lives. Following is a reconciliation of intangible assets:
Goodwill 1 Other Total
2017 2016 2017 2016 2017 2016
Carrying amount, beginning of year $ 97 $ 97 $ 83 $ 95 $ 180 $ 192Additions – – 1 2 1 2Amortization – – (15) (14) (15) (14)
Carrying amount, end of year $ 97 $ 97 $ 69 $ 83 $ 166 $ 180
Balance as at December 31 comprised of:Cost $ 104 $ 104 $ 123 $ 122 $ 227 $ 226Accumulated amortization (7) (7) (54) (39) (61) (46)
Carrying amount $ 97 $ 97 $ 69 $ 83 $ 166 $ 180
1 The company’s aggregate carrying amount of goodwill was $97 (2016 – $97), representing 1.2 percent of shareholders’ equity as at December 31, 2017 (2016 – 1.2 percent). Substantially all of the company’s recorded goodwill relates to the nitrogen segment.
Note 16 Payables and Accrued Charges
Trade and other payables and accrued charges mainly consist of amounts owed to suppliers, contractors,employees and shareholders that have been invoiced or accrued.
Payables and accrued charges as at December 31 were comprised of:
2017 2016
38%Total trade accounts included in
payables and accrued changes atDecember 31, 2017
(unaudited)
Trade accounts $ 306 $ 340Accrued compensation 98 76Dividends 84 84Current portion of asset retirement obligations and accrued environmental costs (Note 18) 72 58Deferred revenue 51 59Accrued transaction costs (Note 32) 42 –Current portion of pension and other post-retirement benefits (Note 26) 35 32Accrued interest 33 35Income taxes (Note 8) 16 25Other payables and other accrued charges 70 63
$ 807 $ 772
PotashCorp 2017 Annual Report 85

in millions of US dollars except as otherwise noted
Note 17 Derivative Instruments
PotashCorp enters into contracts with other parties primarily to fix the price of natural gas used as feedstock in production and the exchange rate forCanadian dollar transactions.
Accounting Policies Accounting Estimates and Judgments
Derivative financial instruments are used to lock in commodity prices, exchange rates and interest rates. Contracts to buy or sell a non-financialitem 1 are recognized at fair value on the consolidated statements of financial position where appropriate.
For designated and qualified cash flow hedges:
• the effective portion of the change in the fair value of the derivative is accumulated in OCI until the variability in cash flows being hedged isrecognized in net income in future accounting periods; and
• the ineffective portions of hedges are recorded in net income in the current period.
The change in fair value of derivative instruments, not designated or not qualified as hedges, is recorded in net income in the current period.
The company’s policy is not to use derivative instruments for trading or speculative purposes. The company may choose not to designate aqualifying derivative instrument in an economic hedging relationship as an accounting hedge.
For natural gas derivative instruments designated as accounting hedges, the company formally documents:
• all relationships between hedging instruments and hedged items;
• its risk management objective and strategy for undertaking the hedge transaction; and
• the linkage of derivatives to specific assets and liabilities or to specific firm commitments or forecast transactions.
The company also assesses whether the natural gas derivatives used in hedging transactions are expected to be or were highly effective, both atthe hedge’s inception and on an ongoing basis, in offsetting changes in fair values of hedged items. Hedge effectiveness related to thecompany’s natural gas hedges is assessed on a prospective and retrospective basis using regression analyses.
A hedging relationship is terminated if:
• the hedge ceases to be effective;
• the underlying asset or liability being hedged is derecognized; or
• the derivative instrument is no longer designated as a hedging instrument.
In such instances, the difference between the fair value and the accrued value of the hedging derivatives upon termination is deferred andrecognized in net income on the same basis that gains, losses, revenue and expenses of the previously hedged item are recognized. If a cashflow hedging relationship is terminated because it is no longer probable that the anticipated transaction will occur, then the net gain or lossaccumulated in OCI is recognized in current period net income.
Uncertainties, estimates and use of judgment include the assessmentof contracts as derivative instruments and for embedded derivatives,application of hedge accounting and valuation of derivatives at fairvalue (discussed further in Note 29).
For derivatives or embedded derivatives, the most significant areaof judgment is whether the contract can be settled net, one of thecriteria in determining whether a contract for a non-financial asset isconsidered a derivative and accounted for as such. Judgment is alsoapplied in determining whether an embedded derivative is closelyrelated to the host contract, in which case bifurcation and separateaccounting are not necessary.
The process to test effectiveness and meet stringent documentationstandards requires the application of judgment and estimation.
1 Can be settled net in cash or another financial instrument, or by exchanging financial instruments, as if the contracts were financial instruments (except contracts that were entered intoand continue to be held for the purpose of the receipt or delivery of a non-financial item in accordance with expected purchase, sale or usage requirements).
86 PotashCorp 2017 Annual Report
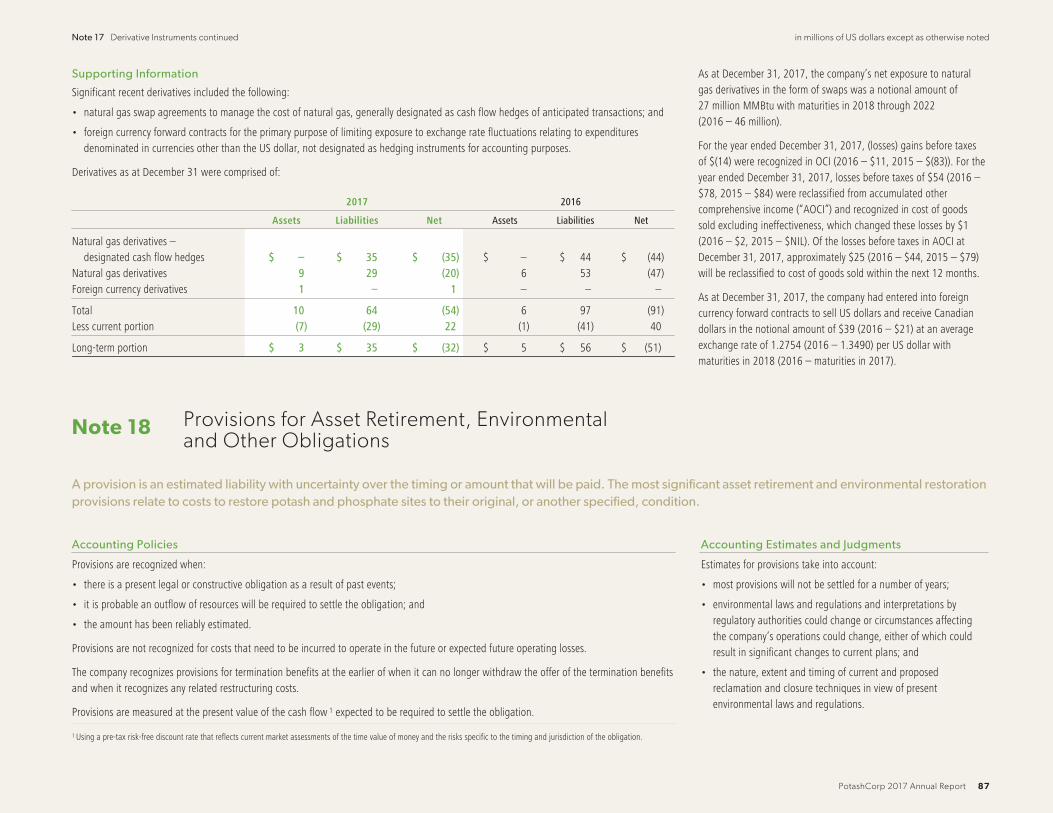
Note 17 Derivative Instruments continued in millions of US dollars except as otherwise noted
Supporting Information
Significant recent derivatives included the following:
• natural gas swap agreements to manage the cost of natural gas, generally designated as cash flow hedges of anticipated transactions; and
• foreign currency forward contracts for the primary purpose of limiting exposure to exchange rate fluctuations relating to expendituresdenominated in currencies other than the US dollar, not designated as hedging instruments for accounting purposes.
Derivatives as at December 31 were comprised of:
2017 2016
Assets Liabilities Net Assets Liabilities Net
Natural gas derivatives –designated cash flow hedges $ – $ 35 $ (35) $ – $ 44 $ (44)
Natural gas derivatives 9 29 (20) 6 53 (47)Foreign currency derivatives 1 – 1 – – –
Total 10 64 (54) 6 97 (91)Less current portion (7) (29) 22 (1) (41) 40
Long-term portion $ 3 $ 35 $ (32) $ 5 $ 56 $ (51)
As at December 31, 2017, the company’s net exposure to naturalgas derivatives in the form of swaps was a notional amount of27 million MMBtu with maturities in 2018 through 2022(2016 – 46 million).
For the year ended December 31, 2017, (losses) gains before taxesof $(14) were recognized in OCI (2016 – $11, 2015 – $(83)). For theyear ended December 31, 2017, losses before taxes of $54 (2016 –$78, 2015 – $84) were reclassified from accumulated othercomprehensive income (“AOCI”) and recognized in cost of goodssold excluding ineffectiveness, which changed these losses by $1(2016 – $2, 2015 – $NIL). Of the losses before taxes in AOCI atDecember 31, 2017, approximately $25 (2016 – $44, 2015 – $79)will be reclassified to cost of goods sold within the next 12 months.
As at December 31, 2017, the company had entered into foreigncurrency forward contracts to sell US dollars and receive Canadiandollars in the notional amount of $39 (2016 – $21) at an averageexchange rate of 1.2754 (2016 – 1.3490) per US dollar withmaturities in 2018 (2016 – maturities in 2017).
Note 18 Provisions for Asset Retirement, Environmentaland Other Obligations
A provision is an estimated liability with uncertainty over the timing or amount that will be paid. The most significant asset retirement and environmental restorationprovisions relate to costs to restore potash and phosphate sites to their original, or another specified, condition.
Accounting Policies Accounting Estimates and Judgments
Provisions are recognized when:
• there is a present legal or constructive obligation as a result of past events;
• it is probable an outflow of resources will be required to settle the obligation; and
• the amount has been reliably estimated.
Provisions are not recognized for costs that need to be incurred to operate in the future or expected future operating losses.
The company recognizes provisions for termination benefits at the earlier of when it can no longer withdraw the offer of the termination benefitsand when it recognizes any related restructuring costs.
Provisions are measured at the present value of the cash flow 1 expected to be required to settle the obligation.
Estimates for provisions take into account:
• most provisions will not be settled for a number of years;
• environmental laws and regulations and interpretations byregulatory authorities could change or circumstances affectingthe company’s operations could change, either of which couldresult in significant changes to current plans; and
• the nature, extent and timing of current and proposedreclamation and closure techniques in view of presentenvironmental laws and regulations.
1 Using a pre-tax risk-free discount rate that reflects current market assessments of the time value of money and the risks specific to the timing and jurisdiction of the obligation.
PotashCorp 2017 Annual Report 87

Note 18 Provisions for Asset Retirement, Environmental and Other Obligation continued in millions of US dollars except as otherwise noted
Accounting Policies continued
Environmental costs related to current operations are:
Capitalized as an asset, if Expensed, if Recorded as a provision, when
• property life is extended;
• capacity is increased;
• contamination from future operationsis mitigated or prevented; or
• related to legal or constructive assetretirement obligations.
• related to existingconditions caused by pastoperations; and
• they do not contribute tocurrent or future revenuegeneration.
• environmental remedial efforts are likely; and
• the costs can be reasonably estimated.
The company uses the most current informationavailable, including similar past experiences,available technology, regulations in effect, thetiming of remediation, and cost-sharingarrangements.
The company recognizes provisions for decommissioning obligations (also known as asset retirement obligations) primarily related to mining andmineral activities. The major categories of asset retirement obligations are:
• reclamation and restoration costs at its potash and phosphate mining operations, including management of materials generated by miningand mineral processing, such as various mine tailings and gypsum;
• land reclamation and revegetation programs;
• decommissioning of underground and surface operating facilities;
• general cleanup activities aimed at returning the areas to an environmentally acceptable condition; and
• post-closure care and maintenance.
The present value of a liability for a decommissioning obligation is recognized in the period in which it is incurred if a reasonable estimate can bemade. The associated costs are:
• capitalized as part of the carrying amount of any related long-lived asset and then amortized over its estimated remaining useful life;
• recorded as inventory; or
• expensed in the period.
The best estimate of the amount required to settle the obligation is reviewed at the end of each reporting period and updated to reflect changesin the discount and foreign exchange rates and the amount or timing of the underlying cash flows. When there is a change in the best estimate,an adjustment is recorded against the carrying amount of the provision and any related asset, and the effect is then recognized in net incomeover the remaining life of the asset. The increase in the provision due to the passage of time is recognized as a finance cost. A gain or loss may beincurred upon settlement of the liability.
Accounting Estimates and Judgments continued
It is reasonably possible that the ultimate costs could change in thefuture and that changes to these estimates could have a materialeffect on the company’s consolidated financial statements.
Estimates for asset retirement obligation costs depend on thedevelopment of environmentally acceptable closure and post-closure plans. In some cases, this may require significant researchand development to identify preferred methods for such plans thatare economically sound and that, in most cases, may not beimplemented for several decades. The company uses appropriatetechnical resources, including outside consultants, to developspecific site closure and post-closure plans in accordance with therequirements of the various jurisdictions in which it operates. Otherthan certain land reclamation programs, settlement of theobligations is typically correlated with mine life estimates.
The risk-free rate and expected cash flow payments for assetretirement obligations at December 31 were as follows:
2017Risk-Free
RateCash FlowPayments 1
Phosphate 2.16%-2.74% 1-85 yearsPotash 5% 40-360 years
2016
Phosphate 1.86%-3.06% 1-85 yearsPotash 5% 50-340 years
1 Timeframe in which payments are expected to principally occur from December 31,
with the majority of phosphate payments taking place over the next 35 years.
Changes in years can result from changes to the mine life and/or changes in the rate
in tailing volumes.
Employee termination activities are complex processes that can takemonths to complete and involve making and reassessing estimates.
Sensitivity of asset retirement obligations to changes in the discount rate and inflation rate on the recorded liability as at December 31, 2017 is as follows:
UndiscountedCash Flows
DiscountedCash Flows
Discount Rate Inflation Rate
+0.5% -0.5% +0.5% -0.5%
Potash obligation 1 $ 1,017 2 $ 114 $ (25) $ 37 $ 39 $ (27)Nitrogen obligation 62 3 (1) 1 1 (1)Phosphate obligation 954 608 (36) 42 43 (37)
1 Stated in millions of Canadian dollars.2 Represents total undiscounted cash flows in the first year of decommissioning. Excludes subsequent years of tailings dissolution, fine tails capping, tailings management area reclamation, post reclamation activities and monitoring, and final decommissioning, which are estimated to
take an additional 92-292 years.
88 PotashCorp 2017 Annual Report

Note 18 Provisions for Asset Retirement, Environmental and Other Obligation continued in millions of US dollars except as otherwise noted
Supporting Information
Following is a reconciliation of asset retirement, environmental restoration and other obligations:
AssetRetirementObligations
EnvironmentalRestorationObligations Subtotal
OtherObligations Total
Balance – December 31, 2016 $ 678 $ 23 $ 701 $ 3 $ 704Charged to income
New obligations 3 2 5 – 5Change in discount rate 1 – 1 – 1Change in other estimates 15 (2) 13 – 13Unwinding of discount 17 – 17 – 17
Capitalized to property, plant and equipmentChange in discount rate 11 – 11 – 11Change in other estimates 4 – 4 – 4
Settled during period (33) (2) (35) – (35)Exchange differences 6 – 6 – 6
Balance – December 31, 2017 $ 702 $ 21 $ 723 $ 3 $ 726
Balance as at December 31, 2017 comprised of:Current liabilities
Payables and accrued charges (Note 16) $ 67 $ 5 $ 72 $ 3 $ 75Non-current liabilities
Asset retirement obligations andaccrued environmental costs 635 16 651 – 651
Balance – December 31, 2015 $ 637 $ 22 $ 659 $ 6 $ 665Charged to income
New obligations 3 3 6 1 7Change in discount rate 9 – 9 – 9Change in other estimates 42 – 42 – 42Unwinding of discount 14 – 14 – 14
Capitalized to property, plant and equipmentChange in discount rate 11 – 11 – 11Change in other estimates 1 – 1 – 1
Settled during period (40) (2) (42) (4) (46)Exchange differences 1 – 1 – 1
Balance – December 31, 2016 $ 678 $ 23 $ 701 $ 3 $ 704
Balance as at December 31, 2016 comprised of:Current liabilities
Payables and accrued charges (Note 16) $ 51 $ 7 $ 58 $ 3 $ 61Non-current liabilities
Asset retirement obligations andaccrued environmental costs 627 16 643 – 643
Environmental Operating and Capital Expenditures
The company’s operations are subject to numerous environmentalrequirements under federal, provincial, state and local laws andregulations of Canada, the US, and Trinidad and Tobago. These lawsand regulations govern matters such as air emissions, wastewaterdischarges, land use and reclamation, and solid and hazardouswaste management. Many of these laws, regulations and permitrequirements are becoming increasingly stringent, and the costof compliance can be expected to rise over time. The company’soperating expenses, other than costs associated with assetretirement obligations, relating to compliance with environmentallaws and regulations governing ongoing operations for 2017 were$99 (2016 – $95, 2015 – $111).
The company routinely undertakes environmental capital projects. In2017, capital expenditures of $81 (2016 – $82, 2015 – $164) wereincurred to meet pollution prevention and control as well as otherenvironmental objectives.
Other Environmental Obligations
Other environmental obligations generally relate to regulatorycompliance, environmental management practices associated withongoing operations other than mining, site assessment andremediation of environmental contamination related to the activitiesof the company and its predecessors, including waste disposalpractices and ownership and operation of real property and facilities.
Other Obligations
Other obligations are comprised of provisions for communityinvestment.
PotashCorp 2017 Annual Report 89
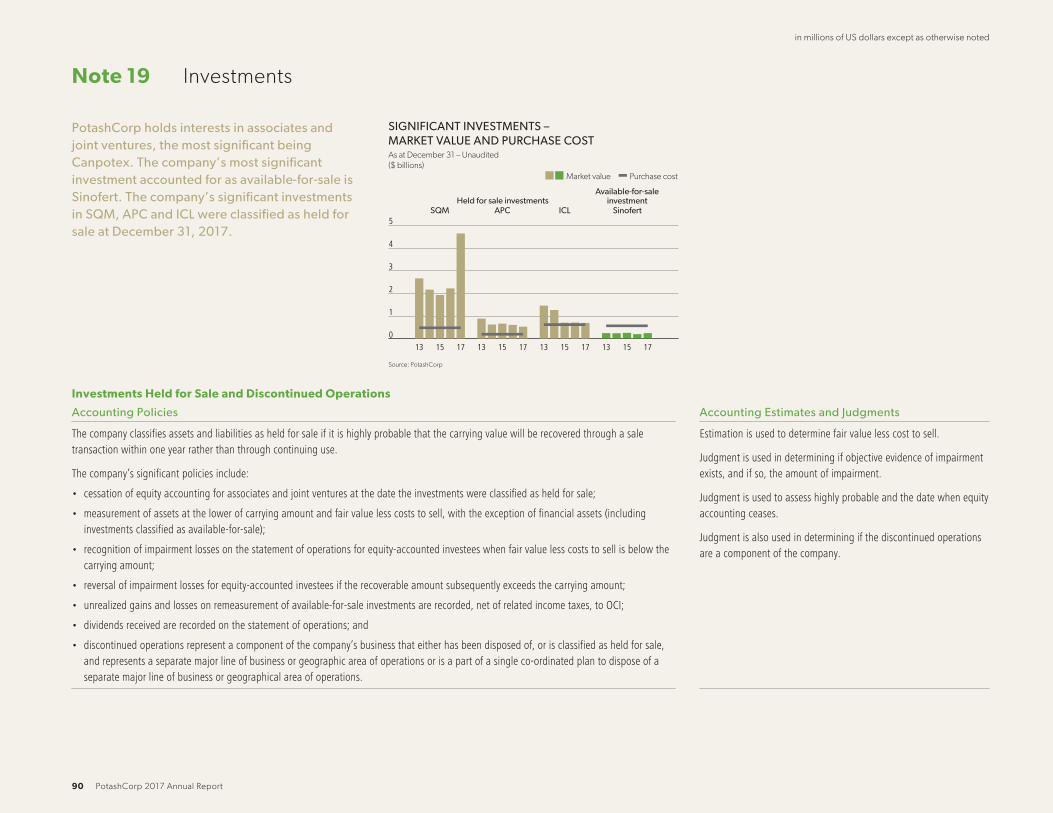
in millions of US dollars except as otherwise noted
Note 19 Investments
PotashCorp holds interests in associates andjoint ventures, the most significant beingCanpotex. The company’s most significantinvestment accounted for as available-for-sale isSinofert. The company’s significant investmentsin SQM, APC and ICL were classified as held forsale at December 31, 2017.
0
1
2
3
4
5
171513171513171513171513
Source: PotashCorp
SIGNIFICANT INVESTMENTS – MARKET VALUE AND PURCHASE COSTAs at December 31 – Unaudited
($ billions)
Market value
Available-for-saleinvestment
SinofertHeld for sale investments
APCSQM ICL
Purchase cost
Investments Held for Sale and Discontinued Operations
Accounting Policies Accounting Estimates and Judgments
The company classifies assets and liabilities as held for sale if it is highly probable that the carrying value will be recovered through a saletransaction within one year rather than through continuing use.
The company’s significant policies include:
• cessation of equity accounting for associates and joint ventures at the date the investments were classified as held for sale;
• measurement of assets at the lower of carrying amount and fair value less costs to sell, with the exception of financial assets (includinginvestments classified as available-for-sale);
• recognition of impairment losses on the statement of operations for equity-accounted investees when fair value less costs to sell is below thecarrying amount;
• reversal of impairment losses for equity-accounted investees if the recoverable amount subsequently exceeds the carrying amount;
• unrealized gains and losses on remeasurement of available-for-sale investments are recorded, net of related income taxes, to OCI;
• dividends received are recorded on the statement of operations; and
• discontinued operations represent a component of the company’s business that either has been disposed of, or is classified as held for sale,and represents a separate major line of business or geographic area of operations or is a part of a single co-ordinated plan to dispose of aseparate major line of business or geographical area of operations.
Estimation is used to determine fair value less cost to sell.
Judgment is used in determining if objective evidence of impairmentexists, and if so, the amount of impairment.
Judgment is used to assess highly probable and the date when equityaccounting ceases.
Judgment is also used in determining if the discontinued operationsare a component of the company.
90 PotashCorp 2017 Annual Report

Note 19 Investments continued in millions of US dollars except as otherwise noted
The company’s investments in SQM at December 1, 2017, and ICL and APC at December 31, 2017, were classified as held for sale and as discontinued operations, due to regulatory requirements to dispose of theseinvestments, as discussed in Note 32. Share of earnings, dividend income and income tax recovery (expense) pertaining to these investments were reclassified from operating income and income tax recovery (expense) tonet income from discontinued operations on the consolidated statements of income. The company is actively seeking buyers for its investments in SQM and APC and expects to complete the sales in 2018. On January 24,2018, the company completed the sale of its equity interests in ICL through a private secondary offering for net proceeds of $685, resulting in a loss on disposal of $19, net of income taxes of $NIL.
Supporting Information
Assets and liabilities held for sale as at December 31 were comprised of:
2017 2016
Assets
Equity-accounted investees 1 $ 1,146 $ –Available-for-sale investment 2 708 –Current tax asset 4 –
Assets held for sale $ 1,858 $ –
Liabilities
Deferred income tax liabilities $ 36 $ –
1 SQM and APC.2 ICL.
Net income from discontinued operations was comprised of:
2017 2016 2015
Share of earnings of equity-accounted investees $ 151 $ 92 $ 112Dividend income 24 31 48Income tax (expense) recovery (2) 1 (5)
Net income from discontinued operations $ 173 $ 124 $ 155
2017 2016 2015
Net income per share from discontinued operationsBasic $ 0.21 $ 0.15 $ 0.18Diluted $ 0.21 $ 0.14 $ 0.18
Cash flows from discontinued operations were comprised of:
2017 2016 2015
Dividends from discontinued operations 1 $ 176 $ 195 $ 127
1 Dividends from discontinued operations are classified as cash provided by operating activities.
PotashCorp 2017 Annual Report 91

Note 19 Investments continued in millions of US dollars except as otherwise noted
Assets held for sale as at December 31 were comprised of:
Principal Activity
Principal Placeof Business
and Incorporation
Proportion of OwnershipInterest and Voting Rights Held Quoted Fair Value 1 Carrying Amount
Name 2017 2016 2 2017 2016 2 2017 2016 2
SQM Chemicals & Mining Chile 32% 3 – $ 4,645 $ – $ 784 $ –APC Mining Jordan 28% – 543 – 362 –ICL Fertilizer & Specialty Chemicals Israel 14% – 708 – 708 –
$ 1,854 $ –
1 The quoted market value (fair value) was based on unadjusted quoted prices in active markets (Level 1).2 Investments in SQM, APC and ICL were classified as held for sale in 2017.3 Due to provisions in SQM’s bylaws, the company holds proportional voting rights of 28 percent.
Investments in Equity-Accounted Investees
Accounting Policies Accounting Estimates and Judgments
Investments in which the company exercises significant influence (but does not control) are accounted for using the equity method. Significantinfluence is the power to participate in the financial and operating policy decisions of the investee. Such investees that are not jointly controlledare referred to as associates. All investees the company jointly controls are classified and accounted for as joint ventures, which are alsoaccounted for using the equity method. These associates and joint ventures follow similar accounting principles and policies to PotashCorp.
The company’s significant policies include:
• its proportionate share of any net income or losses from investees, and any gain or loss on disposal, are recorded in net income;
• its proportionate share of post-acquisition movements in OCI is recognized in the company’s OCI;
• the cumulative post-acquisition movements in net income and OCI are adjusted against the carrying amount of the investment; dividendsreceived reduce the carrying amount of the company’s investment;
• an impairment test is performed when there is objective evidence of impairment, such as significant adverse changes in the environment inwhich the equity-accounted investee operates or a significant or prolonged decline in the fair value of the investment below its carryingamount. An impairment loss is recorded when the recoverable amount1 becomes lower than the carrying amount; and
• impairment losses are reversed if the recoverable amount subsequently exceeds the carrying amount.
1 The higher of value in use and fair value less costs to sell.
Judgment is necessary in determining when significant influence(power to participate in the financial and operating policy decisionsof the investee but not control or joint control over thosepolicies) exists.
Judgment is also used in determining if objective evidence ofimpairment exists, and if so, the amount of impairment.
Supporting Information
Equity-accounted investees as at December 31 were comprised of:
Name Principal Activity
Principal Placeof Business
and Incorporation
Proportion of OwnershipInterest and Voting Rights Held Quoted Fair Value 1 Carrying Amount
2017 2016 2017 2016 2017 2016
SQM 2 Chemicals & Mining Chile – 32% 3 $ – $ 2,228 $ – $ 781APC 2 Mining Jordan – 28% – 618 – 362Canpotex Marketing & Logistics Canada 33% 4 33% n/a 5 n/a 5 – –Other associates and joint ventures 30 30
Total equity-accounted investees $ 30 $ 1,1731 The quoted market value (fair value) was based on unadjusted quoted prices in active markets (Level 1).2 Investments in SQM and APC were classified as held for sale at December 31, 2017.3 Due to provisions in SQM’s bylaws, the company holds proportional voting rights of 28 percent.4 Upon closing of the Merger on January 1, 2018 as described in Note 32, Nutrien’s interest in Canpotex is 50% and the classification of the investment changed from an associate to a joint venture. The equity method is required for both associates and joint ventures, therefore, there
is no change in the accounting for Canpotex.5 Canpotex is a private company and there is no quoted market price available for the shares.
92 PotashCorp 2017 Annual Report

Note 19 Investments continued in millions of US dollars except as otherwise noted
Aggregated financial information of the company’s proportionate interest in equity-accounted investees for the year ended December 31 was as follows:
Associates Joint Ventures
2017 2016 1 2015 1 2017 2016 2015
Income from continuing operations and net income $ – $ – $ – $ 9 $ 6 $ 8Other comprehensive income – – – – – –Total comprehensive income – – – 9 6 8
1 Certain amounts have been reclassified as a result of investments in SQM and APC being classified as discontinued operations in 2017.
Additional aggregated financial information of all the company’s equity-accounted investees, including the discontinued operations of SQM and APC, are set out below. The financial information represents anaggregation of full amounts shown in each associate’s and joint venture’s financial statements prepared in accordance with IFRS as at and for the year ended December 31, as applicable.
2017 2016
Current assets $ 3,581 $ 3,762Non-current assets 2,869 2,885Current liabilities 1,235 1,292Non-current liabilities 1,751 1,730Non-controlling interest 60 61
2017 2016 2015
Sales $ 5,509 $ 4,739 $ 5,892Gross profit 992 811 900Income from continuing operations and net income 573 382 419
Dividends received from equity-accounted investments in 2017 were $6 (2016 – $6, 2015 – $7). Dividends received from SQM and APC areincluded in dividends from discontinued operations on Page 91.
Available-for-Sale Investments
Accounting Policies Accounting Estimates and Judgments
The fair value of investments designated as available-for-sale is recorded in the consolidated statements of financial position, with unrealizedgains and losses, net of related income taxes, recorded in AOCI.
The company’s significant policies include:
• the cost of investments sold is based on the weighted average method;
• realized gains and losses on these investments are removed from AOCI and recorded in net income; and
• the company assesses at the end of each reporting period whether there is objective evidence of impairment. A significant or prolongeddecline in the fair value of the investment below its cost would be evidence that the asset is impaired. If objective evidence of impairmentexists, the impaired amount (i.e., the unrealized loss) is recognized in net income; any subsequent reversals of a previous impairment wouldbe recognized in OCI and not net income. Any subsequent decline in the fair value below the carrying amount at the impairment date wouldrepresent a further impairment to be recognized in net income.
See Note 29 for a description of how the company determines fair value for its investments.
The company’s 22 percent ownership of Sinofert does not constitutesignificant influence and its investment is therefore accounted for asavailable-for-sale.
The determination of when an investment is impaired, and if so, theamount of impairment, requires judgment. In making this judgment,the company evaluates, among other factors, the duration and extentto which the fair value of the investment is less than its cost at eachreporting period-end.
PotashCorp 2017 Annual Report 93

Note 19 Investments continued in millions of US dollars except as otherwise noted
Supporting Information
Available-for-sale investments as at December 31 were as follows:
Principal ActivityPrincipal Place of Business
and Incorporation
Proportion of OwnershipInterest and Voting Rights Held Fair Value and Carrying Amount
Name 2017 2016 2017 2016
ICL 1 Fertilizer & Specialty Chemicals Israel – 14% $ – $ 725Sinofert Fertilizer Supplier & Distributor China/Bermuda 22% 22% 258 212Other 4 3
$ 262 $ 9401 Investment in ICL was classified as held for sale in 2017.
As at December 31, 2017, the net unrealized loss on theseinvestments was $320 (2016 – $346).
During 2012, the company concluded its investment in Sinofert wasimpaired due to the significance by which fair value was below cost.During 2014 and 2016, the company concluded its investment inSinofert was further impaired due to the fair value declining belowthe carrying amount of $238 and $200, respectively at the previousimpairment dates. As a result, impairment losses of $341, $38 and$10 were recognized in net income during 2012, 2014 and 2016,respectively. No impairment loss was recognized in income during2017. The fair value was determined by reference to the market valueof Sinofert shares on the Hong Kong Stock Exchange.
Changes in fair value, and related accounting, for the company’s investment in Sinofert since December 31, 2014 were as follows:
Impact of Unrealized Loss on:
Fair ValueUnrealized(Loss) Gain OCI and AOCI
Net Income andRetained Earnings
Balance – December 31, 2014 $ 252 $ (327) $ 52 $ (379)Increase in fair value during the year 14 14 14 –
Balance – December 31, 2015 $ 266 $ (313) $ 66 $ (379)Decrease in fair value and recognition of impairment $ (76) $ (76) $ (66) $ (10)Increase in fair value subsequent to recognition of impairment 22 22 22 –
Balance – December 31, 2016 $ 212 $ (367) $ 22 $ (389)Increase in fair value during the year 46 46 46 –
Balance – December 31, 2017 $ 258 $ (321) $ 68 $ (389)
94 PotashCorp 2017 Annual Report

in millions of US dollars except as otherwise noted
Note 20 Short-Term Debt
The company uses its $2.5 billion commercial paper program for its short-term cash requirements. The commercial paper program is backstopped by along-term credit facility.
Short-term debt as at December 31 was comprised of:
2017 2016
Commercial paper $ 730 $ 389
The amount available under the commercial paper program islimited to the availability of backup funds under the credit facility.As at December 31, 2017, the company was authorized to issuecommercial paper up to $2,500 (2016 – $2,500).
The company has a $75 unsecured line of credit available for short-term financing. Net of letters of credit of $NIL and directborrowings of $4, $71 was available as at December 31, 2017(2016 – $75). The line of credit is available through August 2018(2016 – August 2017).
The line of credit is subject to financial tests and other covenants.Principal covenants and events of default are as follows: adebt-to-capital ratio of less than or equal to 0.65:1, net book value
of disposed assets not to exceed 25 percent of the prior year-end’stotal assets, debt of subsidiaries not to exceed $1,000 and a $300permitted lien basket. The line of credit is subject to othercustomary covenants and events of default, including an event ofdefault for non-payment of other debt in excess of the greater of$100 or 2 percent of shareholders’ equity. Non-compliance withsuch covenants could result in accelerated payment of amounts dueunder the line of credit, and its termination. The company was incompliance with the covenants described above as at December 31,2017.
Note 21 Long-Term Debt
The company’s sources of borrowing for funding and liquidity purposes are primarily senior notesand a long-term credit facility that provides for unsecured borrowings and backstops its commercialpaper program.
Accounting Policy
Issue costs of long-term debt obligations are capitalized to long-term obligations and are amortized to expense over the term of the relatedliability using the effective interest method.
PotashCorp 2017 Annual Report 95

Note 21 Long-Term Debt continued in millions of US dollars except as otherwise noted
Supporting Information
Long-term debt as at December 31 was comprised of:
Rate of Interest Maturity 2017 2016
Senior notes 1
Notes issued 2010 3.250% December 1, 2017 $ – $ 500Notes issued 2009 6.500% May 15, 2019 500 500Notes issued 2009 4.875% March 30, 2020 500 500Notes issued 2014 3.625% March 15, 2024 750 750Notes issued 2015 3.000% April 1, 2025 500 500Notes issued 2016 4.000% December 15, 2026 500 500Notes issued 2006 5.875% December 1, 2036 500 500Notes issued 2010 5.625% December 1, 2040 500 500
3,750 4,250Less net unamortized debt issue costs (43) (48)
3,707 4,202Less current maturities – (500)Add current portion of amortization 4 5
$ 3,711 $ 3,7071 Each series of senior notes is unsecured and has no sinking fund requirements prior to maturity. Each series is redeemable, in whole or in part, at the company’s option, at any time
prior to maturity for a price equal to the greater of the principal amount of the notes to be redeemed and the present value of the remaining scheduled payments of principal andinterest based on a predetermined computation of the discount rate, plus accrued and unpaid interest. The series of senior notes issued in 2014, 2015 and 2016 are redeemable, inwhole or in part, at the company’s option, at any time three months before maturity for a price equal to 100 percent of the principal amount of the notes to be redeemed, plusaccrued and unpaid interest. Certain downgrades in the company’s credit ratings below investment-grade, resulting from a change in control, including the Merger discussed inNote 32, could trigger a change in control offer under existing debt securities, except the notes issued in 2016, and the company would be required to make an offer to purchaseall, or any part, of these senior notes at 101 percent of the principal amount of the notes to be repurchased, plus accrued and unpaid interest.
The company has a long-term revolving credit facility that provides for unsecured borrowings and also backstops its commercial paper program.The availability of borrowings is reduced by the amount of commercial paper outstanding. Details of the company’s credit facilities were asfollows:
2017 2016
Facility as at December 31 $3,250 – maturity May 31, 2021$250 – maturity May 31, 2020
$3,250 – maturity May 31, 2021$250 – maturity May 31, 2020
Borrowings outstanding as at December 31 $NIL $NIL
Commercial paper outstanding, backstopped by the credit facility,as at December 31 (Note 20) $730 $389
Amounts borrowed and repaid during the year endedDecember 31 $NIL $NIL
Under the senior notes, the company is not subject to any financialtest covenants, but is subject to certain customary covenants(including limitations on liens and on sale and leaseback transactions)and events of default, including an event of default for acceleration ofother debt in excess of $100. Principal covenants and events ofdefault under the credit facility are the same as those under the line ofcredit described in Note 20. Non-compliance with such covenantscould result in accelerated payment of amounts due under the creditfacility, and its termination. The back-to-back loan arrangements arenot subject to any financial test covenants but are subject to certaincustomary covenants and events of default, including, for other long-term debt, an event of default for non-payment of other debt in excessof $25. Non-compliance with such covenants could result inaccelerated payment of the related debt. The company was incompliance with all covenants as at December 31, 2017.
Long-term debt obligations as at December 31, 2017 will mature asfollows 1 :
2018 $ –2019 5002020 5002021 –2022 –Subsequent years 2,750
$ 3,750
1 Actual amounts and timing may differ depending on prepayments or refinancings priorto or at maturity.
0
200
400
600
800
40362625242019
Amount Interest rate
0
2
4
6
8
Source: PotashCorp
SENIOR NOTES OUTSTANDING AT DECEMBER 31, 2017Unaudited
($ millions) (percentage)
Maturity Year
96 PotashCorp 2017 Annual Report

in millions of US dollars except as otherwise noted
Note 22 Share Capital
Share capital represents amounts associated with issued common shares.
Authorized
The company is authorized to issue an unlimited number ofcommon shares without par value and an unlimited number of firstpreferred shares. The common shares are not redeemable orconvertible. The first preferred shares may be issued in one or moreseries with rights and conditions to be determined by the Board ofDirectors. No first preferred shares have been issued. Following thecompletion of the Merger, Nutrien indirectly owns all of thecompany’s outstanding common shares.
Issued
Number ofCommon Shares Consideration
Balance – December 31, 2014 830,242,574 $ 1,632Issued under option plans 4,803,560 72Issued for dividend
reinvestment plan 1,494,017 43
Balance – December 31, 2015 836,540,151 1,747Issued under option plans 2,329,600 36Issued for dividend
reinvestment plan 920,628 15
Balance – December 31, 2016 839,790,379 1,798Issued under option plans and
share-settled plans 114,900 2Issued for dividend
reinvestment plan 317,762 6
Balance – December 31, 2017 840,223,041 1,806
Dividends Declared
Subsequent to year-end, Nutrien’s Board of Directors declared a quarterlydividend of $0.40 per share payable to shareholders on April 20, 2018. Thedeclared dividend is payable to all shareholders of record on March 29,2018. The total estimated dividend to be paid is $258. The payment of thisdividend will not have any tax consequences for Nutrien.
Share Repurchase Program
On February 20, 2018, Nutrien’s Board of Directors approved a sharerepurchase program of up to five percent of Nutrien’s outstanding commonshares over a one-year period through a normal course issuer bid. Purchasesunder the normal course issuer bid will be made through open marketpurchases at market price, as well as by other means as may be permitted byapplicable securities regulatory authorities, including private agreements.Any purchases made by private agreement under an issuer bid exemptionorder issued by a securities regulatory authority will be at a discount to theprevailing market price as provided in any exemption order. Purchases ofcommon shares may commence on or about February 23, 2018 and willexpire on the earlier of February 22, 2019, the date on which the companyhas acquired the maximum number of common shares allowable orotherwise decides not to make any further repurchases.
0
400
800
1,200
1,600
2,000
20172016 2015 2014-0.1
-0.0
0.1
0.2
0.3
0.4
0.5
Q4Q3Q2Q1 2017
Q4Q3Q2Q1 2016
Q4Q3Q2Q1 2015
Source: PotashCorp
SHARE CAPITAL CONSIDERATION Unaudited
($ millions)
As at December 31 Year ended December 31
Total share capital Issued under option plans and share-settled plans
Issued for dividend reinvestment plan Dividends declared per share Net income per share 1
DIVIDENDS AND NET INCOME PER SHARE 1 Unaudited
($)
1 From continuing and discontinued operations.
Source: PotashCorp
PotashCorp 2017 Annual Report 97
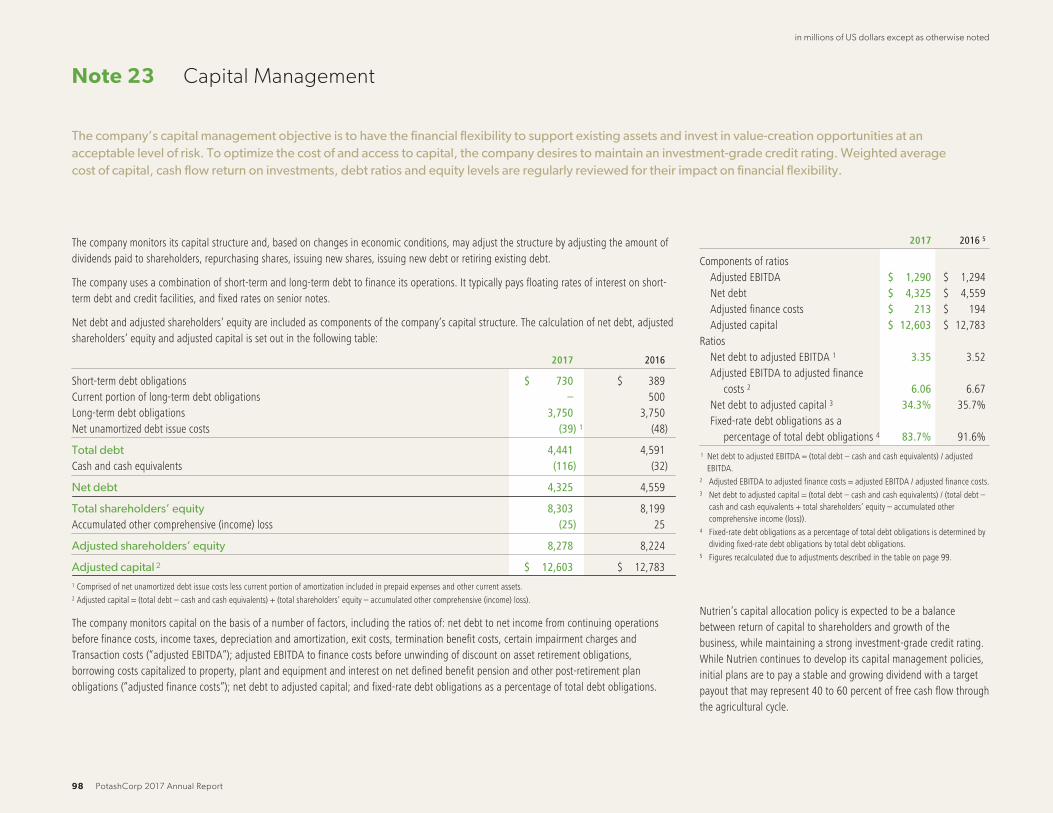
in millions of US dollars except as otherwise noted
Note 23 Capital Management
The company’s capital management objective is to have the financial flexibility to support existing assets and invest in value-creation opportunities at anacceptable level of risk. To optimize the cost of and access to capital, the company desires to maintain an investment-grade credit rating. Weighted averagecost of capital, cash flow return on investments, debt ratios and equity levels are regularly reviewed for their impact on financial flexibility.
The company monitors its capital structure and, based on changes in economic conditions, may adjust the structure by adjusting the amount ofdividends paid to shareholders, repurchasing shares, issuing new shares, issuing new debt or retiring existing debt.
The company uses a combination of short-term and long-term debt to finance its operations. It typically pays floating rates of interest on short-term debt and credit facilities, and fixed rates on senior notes.
Net debt and adjusted shareholders’ equity are included as components of the company’s capital structure. The calculation of net debt, adjustedshareholders’ equity and adjusted capital is set out in the following table:
2017 2016
Short-term debt obligations $ 730 $ 389Current portion of long-term debt obligations – 500Long-term debt obligations 3,750 3,750Net unamortized debt issue costs (39) 1 (48)
Total debt 4,441 4,591Cash and cash equivalents (116) (32)
Net debt 4,325 4,559
Total shareholders’ equity 8,303 8,199Accumulated other comprehensive (income) loss (25) 25
Adjusted shareholders’ equity 8,278 8,224
Adjusted capital 2 $ 12,603 $ 12,7831 Comprised of net unamortized debt issue costs less current portion of amortization included in prepaid expenses and other current assets.2 Adjusted capital = (total debt – cash and cash equivalents) + (total shareholders’ equity – accumulated other comprehensive (income) loss).
The company monitors capital on the basis of a number of factors, including the ratios of: net debt to net income from continuing operationsbefore finance costs, income taxes, depreciation and amortization, exit costs, termination benefit costs, certain impairment charges andTransaction costs (“adjusted EBITDA”); adjusted EBITDA to finance costs before unwinding of discount on asset retirement obligations,borrowing costs capitalized to property, plant and equipment and interest on net defined benefit pension and other post-retirement planobligations (“adjusted finance costs”); net debt to adjusted capital; and fixed-rate debt obligations as a percentage of total debt obligations.
2017 2016 5
Components of ratiosAdjusted EBITDA $ 1,290 $ 1,294Net debt $ 4,325 $ 4,559Adjusted finance costs $ 213 $ 194Adjusted capital $ 12,603 $ 12,783
RatiosNet debt to adjusted EBITDA 1 3.35 3.52Adjusted EBITDA to adjusted finance
costs 2 6.06 6.67Net debt to adjusted capital 3 34.3% 35.7%Fixed-rate debt obligations as a
percentage of total debt obligations 4 83.7% 91.6%1 Net debt to adjusted EBITDA = (total debt – cash and cash equivalents) / adjusted
EBITDA.2 Adjusted EBITDA to adjusted finance costs = adjusted EBITDA / adjusted finance costs.3 Net debt to adjusted capital = (total debt – cash and cash equivalents) / (total debt –
cash and cash equivalents + total shareholders’ equity – accumulated othercomprehensive income (loss)).
4 Fixed-rate debt obligations as a percentage of total debt obligations is determined bydividing fixed-rate debt obligations by total debt obligations.
5 Figures recalculated due to adjustments described in the table on page 99.
Nutrien’s capital allocation policy is expected to be a balancebetween return of capital to shareholders and growth of thebusiness, while maintaining a strong investment-grade credit rating.While Nutrien continues to develop its capital management policies,initial plans are to pay a stable and growing dividend with a targetpayout that may represent 40 to 60 percent of free cash flow throughthe agricultural cycle.
98 PotashCorp 2017 Annual Report
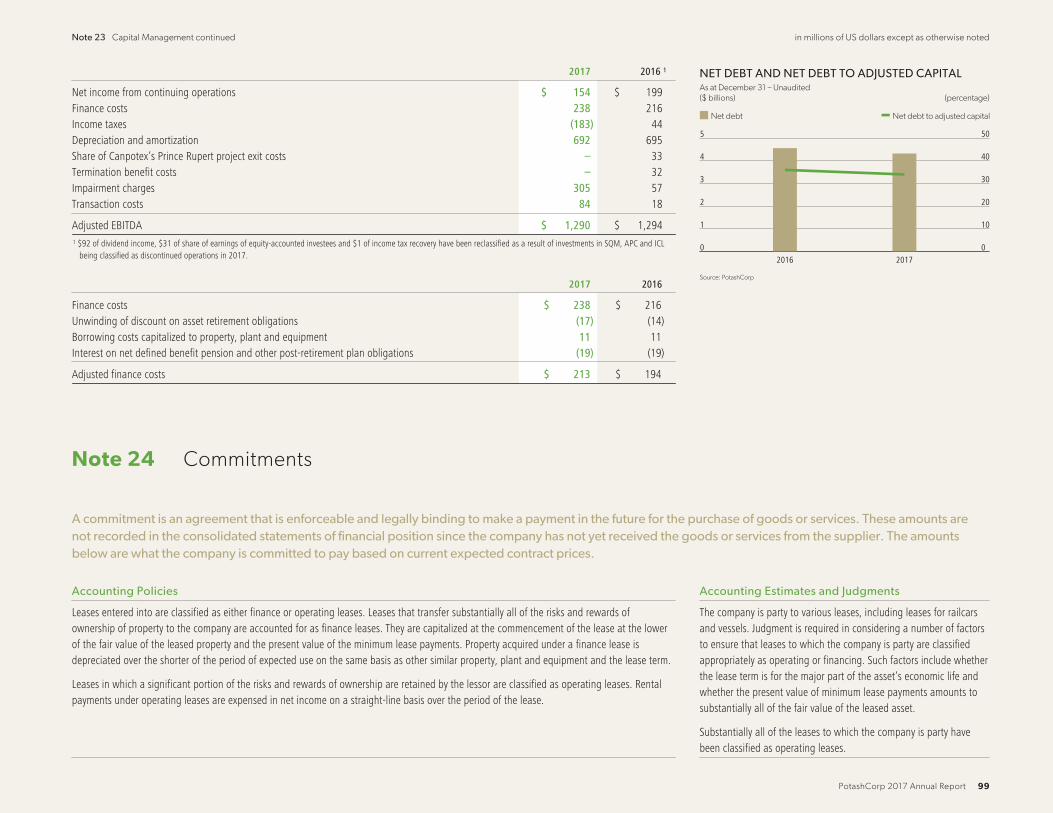
Note 23 Capital Management continued in millions of US dollars except as otherwise noted
2017 2016 1
Net income from continuing operations $ 154 $ 199Finance costs 238 216Income taxes (183) 44Depreciation and amortization 692 695Share of Canpotex’s Prince Rupert project exit costs – 33Termination benefit costs – 32Impairment charges 305 57Transaction costs 84 18
Adjusted EBITDA $ 1,290 $ 1,2941 $92 of dividend income, $31 of share of earnings of equity-accounted investees and $1 of income tax recovery have been reclassified as a result of investments in SQM, APC and ICL
being classified as discontinued operations in 2017.
2017 2016
Finance costs $ 238 $ 216Unwinding of discount on asset retirement obligations (17) (14)Borrowing costs capitalized to property, plant and equipment 11 11Interest on net defined benefit pension and other post-retirement plan obligations (19) (19)
Adjusted finance costs $ 213 $ 194
0
1
2
3
4
5
201720160
10
20
30
40
50
Source: PotashCorp
NET DEBT AND NET DEBT TO ADJUSTED CAPITALAs at December 31 – Unaudited
($ billions) (percentage)
Net debt Net debt to adjusted capital
Note 24 Commitments
A commitment is an agreement that is enforceable and legally binding to make a payment in the future for the purchase of goods or services. These amounts arenot recorded in the consolidated statements of financial position since the company has not yet received the goods or services from the supplier. The amountsbelow are what the company is committed to pay based on current expected contract prices.
Accounting Policies Accounting Estimates and Judgments
Leases entered into are classified as either finance or operating leases. Leases that transfer substantially all of the risks and rewards ofownership of property to the company are accounted for as finance leases. They are capitalized at the commencement of the lease at the lowerof the fair value of the leased property and the present value of the minimum lease payments. Property acquired under a finance lease isdepreciated over the shorter of the period of expected use on the same basis as other similar property, plant and equipment and the lease term.
Leases in which a significant portion of the risks and rewards of ownership are retained by the lessor are classified as operating leases. Rentalpayments under operating leases are expensed in net income on a straight-line basis over the period of the lease.
The company is party to various leases, including leases for railcarsand vessels. Judgment is required in considering a number of factorsto ensure that leases to which the company is party are classifiedappropriately as operating or financing. Such factors include whetherthe lease term is for the major part of the asset’s economic life andwhether the present value of minimum lease payments amounts tosubstantially all of the fair value of the leased asset.
Substantially all of the leases to which the company is party havebeen classified as operating leases.
PotashCorp 2017 Annual Report 99

Note 24 Commitments continued in millions of US dollars except as otherwise noted
Supporting Information
Lease Commitments
The company has various long-term operating lease agreements forland, buildings, port facilities, equipment, ocean-going transportationvessels and railcars, the latest of which expires in 2038. The majorityof lease agreements are renewable at the end of the lease period atmarket rates. Rental expenses for operating leases for the year endedDecember 31, 2017 were $87 (2016 – $80, 2015 – $90).
Purchase Commitments
The company has entered into long-term natural gas contracts withthe National Gas Company of Trinidad and Tobago Limited, thelatest of which expires in 2018. The contracts provide for pricesthat vary primarily with ammonia market prices, escalating floorprices and minimum purchase quantities. The commitments includedin the adjacent table are based on floor prices and minimumpurchase quantities. The company is in ongoing negotiations with theNational Gas Company of Trinidad and Tobago Limited for therenewal of the natural gas contracts. Contract negotiations are
expected to be complete by the end of 2018. Included in thefollowing table are natural gas contracts of $94 for 2018.
Agreements for the purchase of sulfur for use in the production ofphosphoric acid provide for specified purchase quantities, and pricesare based on market rates at the time of delivery. The commitmentsincluded in the following table are based on expected contract prices.
Capital Commitments
The company has various long-term contractual commitments relatedto the acquisition of property, plant and equipment, the latest of
which expires in 2022. The commitments included in the followingtable are based on expected contract prices.
Other Commitments
Other commitments consist principally of pipeline capacity,throughput and various rail and vessel freight contracts, the latest ofwhich expires in 2026, and mineral lease commitments, the latest ofwhich expires in 2038.
Minimum future commitments, excluding any matters that may be impacted as a result of the completion of the Merger, under these contractualarrangements were as follows at December 31, 2017:
OperatingLeases
PurchaseCommitments
CapitalCommitments
OtherCommitments Total
Within 1 year $ 85 $ 303 $ 18 $ 44 $ 4501 to 3 years 129 – 13 49 1913 to 5 years 105 – 10 42 157Over 5 years 182 – – 24 206
Total $ 501 $ 303 $ 41 $ 159 $ 1,004
Note 25 Guarantees
General guarantees are not recognized in the consolidated statements of financial position but are disclosed.
Accounting Policies
General guarantees are not recognized in the consolidatedstatements of financial position but are disclosed and include:
• contracts or indemnifications that contingently require theguarantor to make payments based on changes in an underlying;
• contracts that contingently require payments to a guaranteedparty based on another entity’s failure to perform under anagreement; and
• an indirect guarantee of the indebtedness of another party.
A financial guarantee contract requires the issuer to make paymentsto reimburse the holder for a loss it incurs because a debtor fails tomake payment when due. A financial guarantee contract isrecognized as a financial instrument in the consolidated statementsof financial position when the company becomes party to thecontract.
Supporting Information
The company provides indemnifications, which are often standardcontractual terms, to counterparties in transactions such aspurchase and sale contracts, service agreements, director/officercontracts and leasing transactions. Indemnification agreements:
• may require the company to compensate counterparties for costsincurred as a result of various events, including environmentalliabilities and changes in (or in the interpretation of) laws andregulations, or as a result of litigation claims or statutorysanctions that may be suffered by a counterparty as aconsequence of the transaction;
• will vary based upon the contract, the nature of which preventsthe company from making a reasonable estimate of themaximum potential amount that it could be required to pay tocounterparties; and
• have not historically required the company to make anysignificant payments and no amounts have been accrued in theaccompanying consolidated financial statements (except foraccruals relating to the underlying potential liabilities).
Various debt obligations (such as overdrafts, lines of credit withcounterparties for derivatives and back-to-back loan arrangements)and other commitments (such as railcar leases) related to certainsubsidiaries and investees have been directly guaranteed by thecompany under certain agreements with third parties. It would berequired to perform on these guarantees in the event of default bythe guaranteed parties. No material loss is anticipated by reason ofsuch agreements and guarantees.
100 PotashCorp 2017 Annual Report

Note 25 Guarantees continued in millions of US dollars except as otherwise noted
As at December 31, 2017, the maximum potential amount of future(undiscounted) payments under significant guarantees providedto third parties approximated $534. It is unlikely these guaranteeswill be drawn upon and, since the maximum potential amount offuture payments does not consider the possibility of recovery underrecourse or collateral provisions, this amount is not indicative offuture cash requirements or the company’s expected losses fromthese arrangements. Upon closing of the Merger, as described inNote 32, Nutrien’s portion of the Canpotex allocation was63.82 percent.
As at December 31, 2017, no subsidiary balances subject toguarantees were outstanding in connection with the company’s cashmanagement facilities, and it had no liabilities recorded for otherguarantee obligations.
The company has guaranteed the gypsum stack capping, closure andpost-closure obligations of PCS Phosphate in White Springs, Floridaand PCS Nitrogen in Geismar, Louisiana, respectively, pursuant to thefinancial assurance regulatory requirements in those states. Inaddition to the foregoing guarantees associated with US mining
operations, the company has guaranteed the performance of certainremediation obligations of PCS Joint Venture at the Lakeland, Floridaand Moultrie, Georgia sites.
The environmental regulations of the Province of Saskatchewanrequire each potash mine to have decommissioning and reclamationplans, and financial assurances for these plans, approved by theresponsible provincial minister. The next scheduled review of thedecommissioning and reclamation plans is to be completed byJune 30, 2021. With respect to the financial assurances for theseplans, the Minister of the Environment for Saskatchewan (“MOE”)approved the increase of the previously established CDN $3 trustfund to CDN $25 to be funded by the company in equal annualpayments from 2014 through 2021. As at December 31, 2017, thetotal balance in the trust fund was CDN $15.
The company has met its financial assurance responsibilities as atDecember 31, 2017. Costs associated with the retirement of long-lived tangible assets have been accrued in the accompanyingconsolidated financial statements to the extent that a legal orconstructive liability to retire such assets exists.
During the period, the company entered into various othercommercial letters of credit in the normal course of operations. Asat December 31, 2017, $43 of letters of credit were outstanding.
The company expects that it will be able to satisfy all applicablecredit support requirements without disrupting normal businessoperations.
0
100
200
300
400
500
600
Letters of creditTrust fund (CDN$)Future (undiscounted)payments under significant
guarantees providedto third parties
Source: PotashCorp
GUARANTEESAs at December 31 – Unaudited
($ millions)
Note 26 Pension and Other Post-Retirement Benefits
The company offers pension and other post-retirement benefits to qualified employees: defined benefit pension plans; defined contribution pension plans;and health, disability, dental and life insurance (referred to as other defined benefit) plans. Substantially all employees participate in at least one of theseplans.
Defined Benefit Plans
Accounting Policies Accounting Estimates and Judgments
For employee retirement and other defined benefit plans:
• accrued liabilities are recorded net of plan assets;
• costs 1 are actuarially determined on a regular basis using the projected unit credit method;
• net interest is based on the discount rate used to measure plan obligations or assets at the beginning ofthe annual period;
Estimates and judgments are required to determine discount rates, health care cost trend rates, projectedsalary increases, retirement age, longevity and termination rates. These assumptions are determined bymanagement and are reviewed annually by the company’s independent actuaries.
PotashCorp 2017 Annual Report 101

Note 26 Pension and Other Post-Retirement Benefits continued in millions of US dollars except as otherwise noted
Accounting Policies continued Accounting Estimates and Judgments continued
• past service cost is recognized in net income at the earlier of when i) a plan amendment or curtailmentoccurs; or ii) related restructuring costs or termination benefits are recognized;
• net interest is presented within finance costs; and
• other components of costs are presented within cost of goods sold or selling and administrativeexpenses, as applicable.
Remeasurements, recognized immediately in OCI in the period they occur, are comprised of actuarial gainsand losses, return on plan assets (excluding amounts included in net interest) and the effect of the assetceiling (if applicable).
When a plan amendment occurs before a settlement, the company recognizes past service cost before anygain or loss on settlement.
The company’s discount rate assumption is impacted by:
• the weighted average interest rate at which each pension and other post-retirement plan liability could beeffectively settled at the measurement date;
• country specific rates; and
• the use of a yield curve approach.2
2 Based on the respective plans’ demographics, expected future pension benefits and medical claims, payments are measured and
discounted to determine the present value of the expected future cash flows. The cash flows are discounted using yields on high-quality
AA-rated non-callable bonds with cash flows of similar timing where there is a deep market for such bonds. Where the company does
not believe there is a deep market for such bonds (such as for terms in excess of 10 years in Canada), the cash flows are discounted
using a yield curve derived from yields on provincial bonds rated AA or better to which a spread adjustment is added to reflect the
additional risk of corporate bonds. For Trinidad plans, the cash flows are discounted using yields on local market government bonds
with cash flows of similar timing. The resulting rates are used by the company to determine the final discount rate.1 Including service costs, past service costs, gains and losses on curtailments and settlements, net interest and remeasurements.
The significant assumptions used to determine the benefit obligations and expense for the company’s significant plans were as follows:
Pension Other
2017 2016 2015 2017 2016 2015
Assumptions used to determine benefit obligations as at December 31Discount rate, % 3.65 4.25 4.35 3.65 4.40 4.45Rate of increase in compensation levels, % 5.00 5.00 5.00 n/a n/a n/aMedical cost trend rate – assumed, % n/a n/a n/a 5.60-4.50 1 5.70-4.50 1 5.80-4.50 1
Medical cost trend rate – year reaches ultimate trend rate n/a n/a n/a 2037 2037 2037Mortality assumptions 2
Life expectancy at 65 for a male member currently at age 65 20.7 21.8 21.7 20.0 21.1 21.0Life expectancy at 65 for a female member currently at age 65 22.7 24.0 23.9 22.4 23.7 23.6
Assumptions used to determine benefit expense for the yearDiscount rate, % 4.25 4.35 4.00 4.40 4.45 4.00Rate of increase in compensation levels, % 5.00 5.00 5.00 n/a n/a n/aMedical cost trend rate – assumed, % n/a n/a n/a 5.70-4.50 1 5.80-4.50 1 6.90-4.50 1
Medical cost trend rate – year reaches ultimate trend rate n/a n/a n/a 2037 2037 2027Mortality assumptions 2
Life expectancy at 65 for a male member currently at age 65 21.8 21.7 21.6 21.1 21.0 21.6Life expectancy at 65 for a female member currently at age 65 24.0 23.9 23.8 23.7 23.6 23.8
1 The company assumed a graded medical cost trend rate starting at 5.60 percent in 2017, moving to 4.50 percent by 2037 (starting at 5.70 and 5.80 percent in 2016 and 2015, respectively, moving to 4.50 percent by 2037 and 2027, respectively).2 Based on actuarial advice in accordance with the latest available published tables, adjusted where appropriate to reflect future longevity improvements for each country.
n/a = not applicable
102 PotashCorp 2017 Annual Report
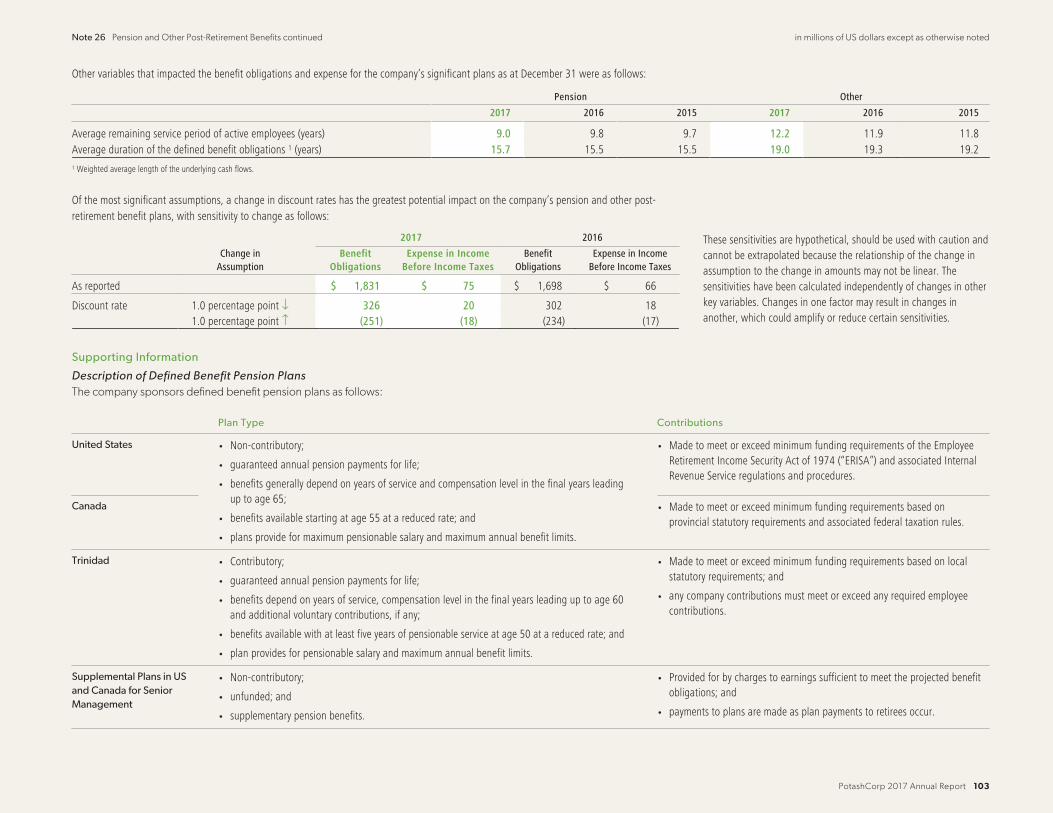
Note 26 Pension and Other Post-Retirement Benefits continued in millions of US dollars except as otherwise noted
Other variables that impacted the benefit obligations and expense for the company’s significant plans as at December 31 were as follows:
Pension Other
2017 2016 2015 2017 2016 2015
Average remaining service period of active employees (years) 9.0 9.8 9.7 12.2 11.9 11.8Average duration of the defined benefit obligations 1 (years) 15.7 15.5 15.5 19.0 19.3 19.21 Weighted average length of the underlying cash flows.
Of the most significant assumptions, a change in discount rates has the greatest potential impact on the company’s pension and other post-retirement benefit plans, with sensitivity to change as follows:
2017 2016 These sensitivities are hypothetical, should be used with caution andcannot be extrapolated because the relationship of the change inassumption to the change in amounts may not be linear. Thesensitivities have been calculated independently of changes in otherkey variables. Changes in one factor may result in changes inanother, which could amplify or reduce certain sensitivities.
Change inAssumption
BenefitObligations
Expense in IncomeBefore Income Taxes
BenefitObligations
Expense in IncomeBefore Income Taxes
As reported $ 1,831 $ 75 $ 1,698 $ 66
Discount rate 1.0 percentage point ↓ 326 20 302 181.0 percentage point ↑ (251) (18) (234) (17)
Supporting Information
Description of Defined Benefit Pension Plans
The company sponsors defined benefit pension plans as follows:
Plan Type Contributions
United States • Non-contributory; • Made to meet or exceed minimum funding requirements of the EmployeeRetirement Income Security Act of 1974 (“ERISA”) and associated InternalRevenue Service regulations and procedures.
• guaranteed annual pension payments for life;
• benefits generally depend on years of service and compensation level in the final years leadingup to age 65;
• benefits available starting at age 55 at a reduced rate; andCanada • Made to meet or exceed minimum funding requirements based on
provincial statutory requirements and associated federal taxation rules.• plans provide for maximum pensionable salary and maximum annual benefit limits.
Trinidad • Contributory;
• guaranteed annual pension payments for life;
• benefits depend on years of service, compensation level in the final years leading up to age 60and additional voluntary contributions, if any;
• benefits available with at least five years of pensionable service at age 50 at a reduced rate; and
• plan provides for pensionable salary and maximum annual benefit limits.
• Made to meet or exceed minimum funding requirements based on localstatutory requirements; and
• any company contributions must meet or exceed any required employeecontributions.
Supplemental Plans in USand Canada for SeniorManagement
• Non-contributory;
• unfunded; and
• supplementary pension benefits.
• Provided for by charges to earnings sufficient to meet the projected benefitobligations; and
• payments to plans are made as plan payments to retirees occur.
PotashCorp 2017 Annual Report 103

Note 26 Pension and Other Post-Retirement Benefits continued in millions of US dollars except as otherwise noted
The company’s defined benefit pension plans discussed above arefunded with separate funds that are legally separated from thecompany and administered through an employee benefits ormanagement committee in each country, which is composed ofemployees of the company. The employee benefits or managementcommittee is required by law to act in the best interests of the planparticipants and in the US and Canada is responsible for thegovernance of the plans, including setting certain policies(e.g., investment and contribution) of the funds. In Trinidad, theplan’s trustee has these responsibilities and the managementcommittee assists the trustee to administer the plan. Thecurrent investment policy for each country’s plans does not includeany asset/liability matching strategies or currency hedgingstrategies. Plan assets held in trusts are governed by localregulations and practice in each country, as is the nature of therelationship between the company and the trustees and theircomposition.
The defined benefit pension plans expose the company to broadlysimilar actuarial risks. The most significant risks as discussed belowinclude: investment risk, interest rate risk, longevity risk and salaryrisk. These plans are not exposed to any other significant, unusualor specific risks.
Investment Risk
A deficit will be created if plan assets underperform the discountrate used in the defined benefit obligation valuation. To mitigateinvestment risk, the company employs:
• a total return on investment approach whereby a mix ofequities and fixed income investments is used to maximizelong-term return for a prudent level of risk;
• risk tolerance established through careful consideration ofplan liabilities, plan funded status and corporate financialcondition; and
• a diversified mix of equity and fixed income investments.
For plans in the US and Canada, equity investments arediversified across US and non-US stocks, as well as growth, valueand small and large capitalization investments. US equities are
also diversified across actively managed and passively investedportfolios. Other assets such as private equity and hedge fundsare not used at this time. Investment risk is measured andmonitored on an ongoing basis through quarterly investmentportfolio reviews, annual liability measurements and periodicasset/liability studies.
The investment strategy in Trinidad is largely dictated by localinvestment restrictions (maximum of 50 percent in equities and20 percent in assets originating from outside of Trinidad) andasset availability since the local equity market is small and thereis little secondary market activity in debt securities.
Interest Rate Risk
A decrease in bond interest rates will increase the pensionliability; however, this is generally expected to be partially offsetby an increase in the return on the plan’s debt investments.
Longevity Risk
An increase in life expectancy of plan participants will increasethe plan’s liability.
Salary Risk
An increase in the salary of the plan’s participants will increasethe plan’s liability.
As at December 31, 2017 and 2016, the company’s Canadian andTrinidadian defined benefit pension plans were in a surplusposition. The company has determined that, in accordance with theterms and conditions of the plans and statutory requirements (suchas minimum funding requirements) of the respective jurisdictions,the present value of refunds or reductions in future contributionswas higher than the surpluses. This determination was made on aplan-by-plan basis. Therefore, no reduction in the defined benefitasset was required as at December 31, 2017 and 2016.
During 2016, the Canadian plan had a settlement in the amount of$26 and in 2015 the US plan had a settlement in the amount of$45 as certain eligible vested plan members elected a single sumpayment. There were no significant plan amendments orcurtailments during 2017 or 2016.
Description of Other Post-Retirement Plans
The company provides contributory health care plans for certaineligible retired employees in the US, Canada and Trinidad. Eligibilityfor these benefits is generally based on a combination of age andyears of service at retirement. Certain terms of the plans include:
• coordination with government-provided medical insurance ineach country;
• certain unfunded cost-sharing features such as co-insurance,deductibles and co-payments – benefits subject to change;
• for the US, maximum lifetime benefits;
• at retirement, the employee’s spouse and certain dependentchildren may be eligible for coverage; and
• benefits are self-insured and are administered through third-party providers.
Canadian and Trinidad retirees currently pay 25 percent of theannual cost while US retirees share a larger portion of the cost,based on inflation. The company’s share of annual inflation islimited to 75 percent of the first 6 percent of total inflation forrecent and future eligible retirees. Any cost increases in excess ofthis amount are funded by retiree contributions. The companycurrently funds approximately 70 percent of US retiree medical costswhile the retirees are responsible for the balance.
The company provides non-contributory life insurance plans forcertain US, Canadian and Trinidadian retired employees who meetspecific age and service eligibility requirements. Retiree lifeinsurance coverage is generally salary-related, which decreases overretirement years according to varying schedules. These benefits arefunded through term insurance premiums with local insurancecompanies in each country.
The company’s other post-retirement plans expose it to similar risksas discussed above related to the defined benefit plans. These plansare not exposed to any other unusual or specific risks.
There were no significant plan amendments, settlements orcurtailments during 2017 or 2016.
104 PotashCorp 2017 Annual Report
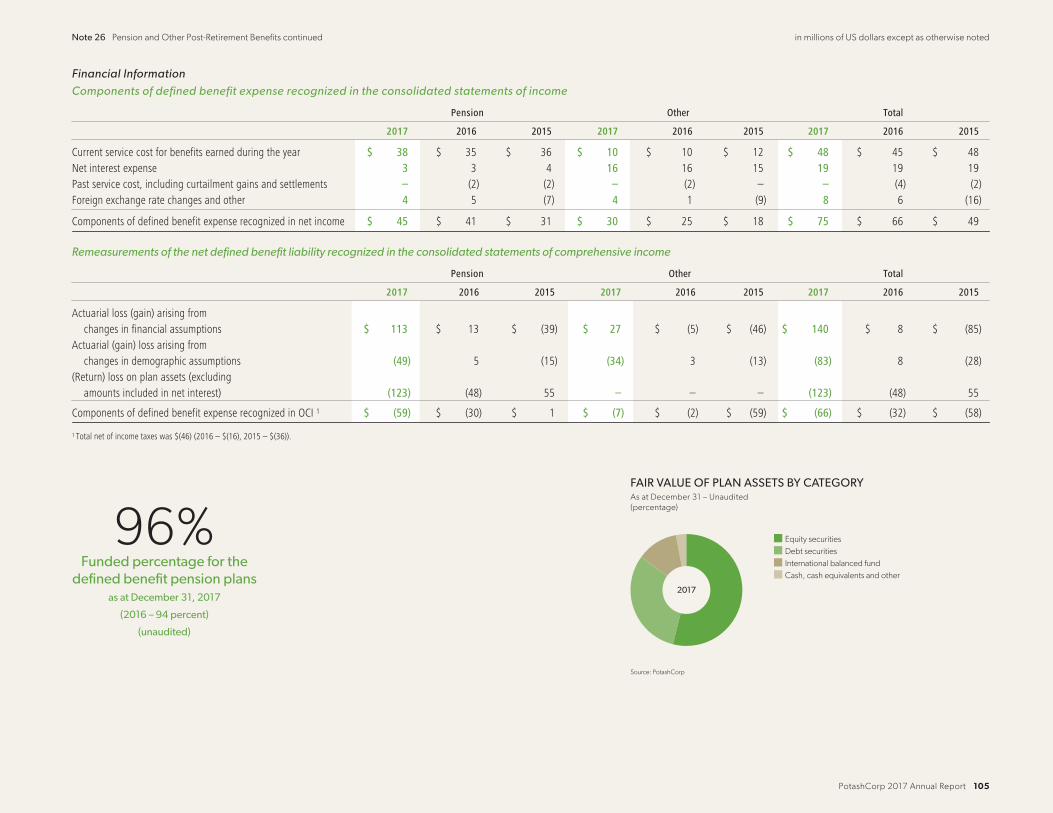
Note 26 Pension and Other Post-Retirement Benefits continued in millions of US dollars except as otherwise noted
Financial Information
Components of defined benefit expense recognized in the consolidated statements of income
Pension Other Total
2017 2016 2015 2017 2016 2015 2017 2016 2015
Current service cost for benefits earned during the year $ 38 $ 35 $ 36 $ 10 $ 10 $ 12 $ 48 $ 45 $ 48Net interest expense 3 3 4 16 16 15 19 19 19Past service cost, including curtailment gains and settlements – (2) (2) – (2) – – (4) (2)Foreign exchange rate changes and other 4 5 (7) 4 1 (9) 8 6 (16)
Components of defined benefit expense recognized in net income $ 45 $ 41 $ 31 $ 30 $ 25 $ 18 $ 75 $ 66 $ 49
Remeasurements of the net defined benefit liability recognized in the consolidated statements of comprehensive income
Pension Other Total
2017 2016 2015 2017 2016 2015 2017 2016 2015
Actuarial loss (gain) arising fromchanges in financial assumptions $ 113 $ 13 $ (39) $ 27 $ (5) $ (46) $ 140 $ 8 $ (85)
Actuarial (gain) loss arising fromchanges in demographic assumptions (49) 5 (15) (34) 3 (13) (83) 8 (28)
(Return) loss on plan assets (excludingamounts included in net interest) (123) (48) 55 – – – (123) (48) 55
Components of defined benefit expense recognized in OCI 1 $ (59) $ (30) $ 1 $ (7) $ (2) $ (59) $ (66) $ (32) $ (58)
1 Total net of income taxes was $(46) (2016 – $(16), 2015 – $(36)).
96%Funded percentage for the
defined benefit pension plansas at December 31, 2017
(2016 – 94 percent)
(unaudited)
Source: PotashCorp
FAIR VALUE OF PLAN ASSETS BY CATEGORYAs at December 31 – Unaudited
(percentage)
Equity securities
Debt securities
International balanced fund
Cash, cash equivalents and other
2017
PotashCorp 2017 Annual Report 105

Note 26 Pension and Other Post-Retirement Benefits continued in millions of US dollars except as otherwise noted
Movements in the pension and other post-retirement benefit assets (liabilities) as at and for the years ended December 31
Pension Other Total
2017 2016 2017 2016 2017 2016
Change in benefit obligationsBalance, beginning of year $ 1,330 $ 1,305 $ 368 $ 354 $ 1,698 $ 1,659Current service cost 38 35 10 10 48 45Interest expense 56 54 16 16 72 70Actuarial loss (gain) arising from changes in financial assumptions 113 13 27 (5) 140 8Actuarial (gain) loss arising from changes in demographic assumptions (49) 5 (34) 3 (83) 8Foreign exchange rate changes 7 (1) 4 1 11 –Contributions by plan participants 1 1 4 4 5 5Benefits paid (51) (54) (9) (13) (60) (67)Past service cost, including curtailment gains and settlements – (28) – (2) – (30)
Balance, end of year 1,445 1,330 386 368 1,831 1,698
Change in plan assetsFair value, beginning of year 1,246 1,197 – – 1,246 1,197Interest included in net income 53 51 – – 53 51Return on plan assets (excluding amounts included in net interest) 123 48 – – 123 48Foreign exchange rate changes and other 3 (6) – – 3 (6)Contributions by plan participants 1 1 4 4 5 5Employer contributions 5 35 5 8 10 43Benefits paid (51) (54) (9) (12) (60) (66)Settlements – (26) – – – (26)
Fair value, end of year 1,380 1,246 – – 1,380 1,246
Funded status $ (65) $ (84) $ (386) $ (368) $ (451) $ (452)
Balance comprised of:Non-current assets
Other assets (Note 14) $ 24 $ 23 $ – $ – $ 24 $ 23Current liabilities
Payables and accrued charges (Note 16) (25) (22) (10) (10) $ (35) (32)Non-current liabilities
Pension and other post-retirement benefit liabilities (64) (85) (376) (358) (440) (443)
106 PotashCorp 2017 Annual Report
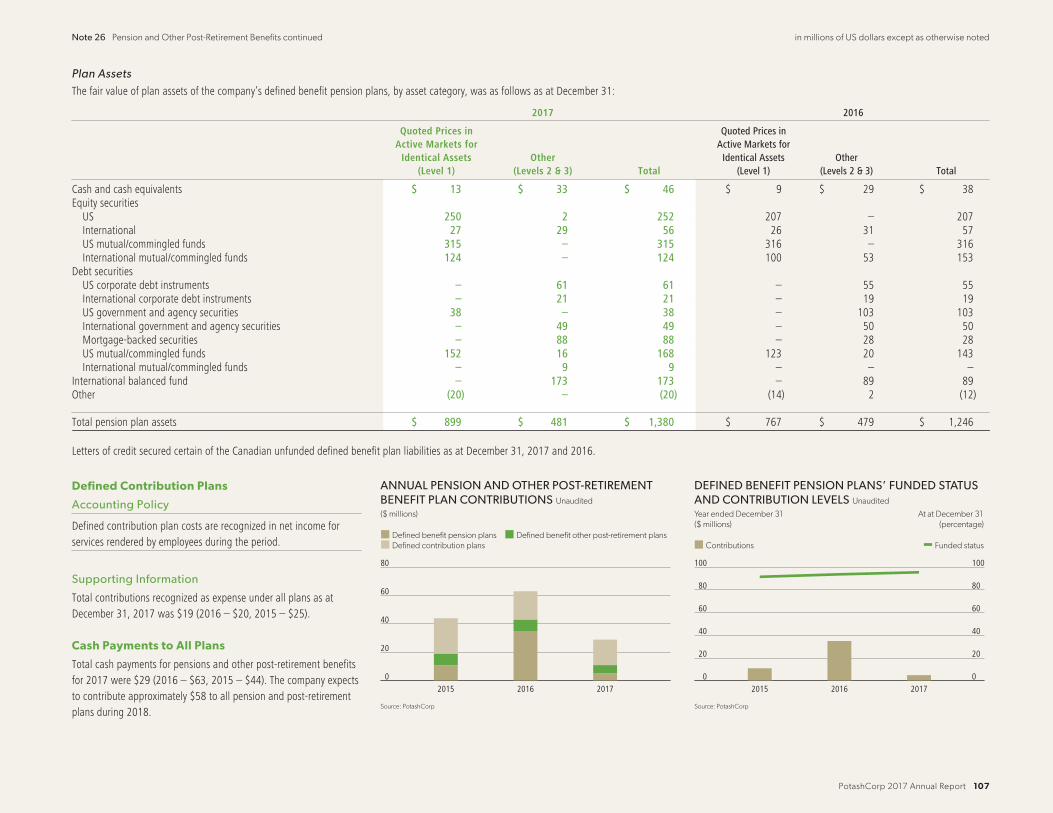
Note 26 Pension and Other Post-Retirement Benefits continued in millions of US dollars except as otherwise noted
Plan Assets
The fair value of plan assets of the company’s defined benefit pension plans, by asset category, was as follows as at December 31:
2017 2016
Quoted Prices inActive Markets for
Identical Assets(Level 1)
Other(Levels 2 & 3) Total
Quoted Prices inActive Markets for
Identical Assets(Level 1)
Other(Levels 2 & 3) Total
Cash and cash equivalents $ 13 $ 33 $ 46 $ 9 $ 29 $ 38Equity securities
US 250 2 252 207 – 207International 27 29 56 26 31 57US mutual/commingled funds 315 – 315 316 – 316International mutual/commingled funds 124 – 124 100 53 153
Debt securitiesUS corporate debt instruments – 61 61 – 55 55International corporate debt instruments – 21 21 – 19 19US government and agency securities 38 – 38 – 103 103International government and agency securities – 49 49 – 50 50Mortgage-backed securities – 88 88 – 28 28US mutual/commingled funds 152 16 168 123 20 143International mutual/commingled funds – 9 9 – – –
International balanced fund – 173 173 – 89 89Other (20) – (20) (14) 2 (12)
Total pension plan assets $ 899 $ 481 $ 1,380 $ 767 $ 479 $ 1,246
Letters of credit secured certain of the Canadian unfunded defined benefit plan liabilities as at December 31, 2017 and 2016.
Defined Contribution Plans
Accounting Policy
Defined contribution plan costs are recognized in net income forservices rendered by employees during the period.
Supporting Information
Total contributions recognized as expense under all plans as atDecember 31, 2017 was $19 (2016 – $20, 2015 – $25).
Cash Payments to All Plans
Total cash payments for pensions and other post-retirement benefitsfor 2017 were $29 (2016 – $63, 2015 – $44). The company expectsto contribute approximately $58 to all pension and post-retirementplans during 2018.
0
20
40
60
80
2017201620150
20
40
60
80
100
2017201620150
20
40
60
80
100
Source: PotashCorp
ANNUAL PENSION AND OTHER POST-RETIREMENT BENEFIT PLAN CONTRIBUTIONS Unaudited
($ millions)
Defined benefit pension plans Defined benefit other post-retirement plans
Defined contribution plans Contributions Funded status
DEFINED BENEFIT PENSION PLANS’ FUNDED STATUSAND CONTRIBUTION LEVELS Unaudited
Year ended December 31 At at December 31
($ millions) (percentage)
Source: PotashCorp
PotashCorp 2017 Annual Report 107

in millions of US dollars except as otherwise noted
Note 27 Share-Based Compensation
The company has share-based compensation plans for certain employees and directors as part of their remuneration package, including the 2016 Long-TermIncentive Plan (“LTIP”) (comprised of performance share units and stock options), Performance Option Plans (“POP”) (comprised of eight other stock option plans),the deferred share unit plan and the CEO multi-year incentive plan.
Accounting Policies Accounting Estimates and Judgments
The accounting for share-based compensation plans is fair value-based.
The grant date is the date the company and the employee have a shared understanding of the terms andconditions of the arrangement, at which time the company confers on the employee the right to cashequity instruments, provided the specified vesting conditions, if any, are met.
For those awards with performance conditions that determine the number of options or units to whichemployees will be entitled, measurement of compensation cost is based on the company’s best estimate ofthe outcome of the performance conditions.
For plans settled through the issuance of equity:
• fair value for stock options is determined on grant date using the Black-Scholes-Merton option-pricingmodel;
• fair value for PSUs is determined on grant date by projecting the outcome of performance conditions;
• compensation expense is recorded over the period the plans vest (corresponding increase tocontributed surplus);
• forfeitures are estimated throughout the vesting period based on past experience and futureexpectations, and adjusted upon actual vesting; and
• when exercised, the proceeds and amounts recorded in contributed surplus are recorded in share capital.
For plans settled in cash or other assets:
• a liability is recorded based on the fair value of the awards each period;
• expense accrues from the grant date over the vesting period; and
• fluctuations in fair value of the award and related compensation expense are recognized in the period thefluctuation occurs.
Judgment involves determining:
• at which date the company and employee agree to a share-based payment award, and hence what thegrant date is; and
• the fair value of share-based compensation awards at the grant date.
Estimation involves determining:
• stock option pricing model assumptions described in the weighted average assumptions table below;
• the number of stock option awards expected to be forfeited;
• the projected outcome of performance conditions for PSUs, including the relative ranking of thecompany’s total shareholder return, including expected dividends, compared with a specified peer groupusing a Monte Carlo simulation option-pricing model and forecasting the company’s cash flow return oninvestment compared with its weighted average cost of capital. Actual results may significantly differfrom these estimates; and
• the number of dividend equivalent units expected to be earned.
Prior to a POP award vesting, assumptions regarding vesting are made during the first three years basedon the relevant actual and/or forecast financial results. As at December 31, 2017, the awards under the2015 POP were expected to vest at 52 percent.
PSUs vest based on the achievement of performance metrics over performance periods ranging from oneto three years. Changes to vesting assumptions may change based on non-market vesting conditions atthe end of each reporting period. As at December 31, 2017, the 2017 and 2016 PSUs were expected tovest at 79 percent and 59 percent, respectively. See under PSUs on the next page for more information.
Changes to vesting assumptions are reflected in earnings immediately for compensation cost alreadyrecognized.
108 PotashCorp 2017 Annual Report

Note 27 Share-Based Compensation continued in millions of US dollars except as otherwise noted
Supporting Information
As at December 31, 2017, the company had 11 share-based compensation plans (the LTIP, comprised ofPSUs and stock options, POPs (comprised of eight other stock option plans), the deferred share unit planand the CEO multi-year incentive plan) (2016 and 2015 – 12 plans). These plans are described below. Thetotal compensation cost charged against earnings for those plans during 2017 was $26 (2016 – $13,2015 – $14).
LTIP
During 2017, the company issued PSUs and stock options to eligible employees under the LTIP. Under theplan, up to 21,000,000 common shares over multiple years would be available for issuance pursuant tothe exercise of options and the settlement of share-based PSUs to be granted under the provisions of theplan. Information on PSUs and stock options is summarized below.
PSUs
PSUs granted under the LTIP vest based on the achievement of performance metrics over a three-yearperiod. In 2016, PSUs granted were comprised of three tranches, with each tranche vesting based on theachievement of performance metrics over separate performance periods ranging from one to three years.PSUs will be settled in shares for grantees who are subject to the company’s share ownership guidelinesand in cash for all other grantees. As at December 31, 2017, 935,570 and 1,556,980 share-settled andcash-settled PSUs were outstanding, respectively (2016 – 602,740 and 1,014,188 respectively). In 2017,92,800 PSUs were settled in shares. Grant date fair value per unit for share-settled PSUs was $19.93 and$17.19 in 2017 and 2016, respectively.
Stock Options
The following weighted average assumptions were used in arriving at the grant-date fair values associatedwith stock options for which compensation cost was recognized during 2017, 2016 and 2015:
Year of Grant
Assumption Based On 2017 2016 2015 2014 2013
Exercise price per option Quoted market closing price 1 $ 18.71 $ 16.20 $ 32.41 $ 36.73 $ 43.80Expected annual dividend per share Annualized dividend rate 2 $ 0.40 $ 1.00 $ 1.52 $ 1.40 $ 1.40Expected volatility Historical volatility 3 29% 30% 31% 39% 50%Risk-free interest rate Zero-coupon government issues 4 1.67% 1.06% 1.54% 1.66% 1.06%Expected life of options in years Historical experience 5.7 5.7 5.5 5.5 5.5
1 Of common shares on the last trading day immediately preceding the date of the grant.2 As of the date of grant.3 Of the company’s stock over a period commensurate with the expected life of the option.4 Implied yield available on equivalent remaining term at the time of the grant.
As at December 31, 2017, the outstanding number of options per plan, that vest over three years and settle in shares, was:
LTIP POPs
2017 2016 2015 2014 2013 2012 2011 2010 2009 2008
1,462,367 3,006,815 3,329,000 2,705,072 1,684,200 1,201,100 841,200 837,300 1,182,450 921,150
Under the terms of the POPs, no additional options are issuablepursuant to the plans. Under the LTIP, 16,530,818 additional optionsmay be granted in future years, subject to the additional issuance ofshares related to share-settled PSUs, up to the aggregate of21,000,000 shares.
The exercise price is not less than the quoted market closing price ofthe company’s common shares on the last trading day immediatelypreceding the date of the grant, and an option’s maximum term is10 years. In general, options granted under the POPs vest, if at all,according to a schedule based on the three-year average excess of thecompany’s consolidated cash flow return on investment over 0
10
20
30
2017201620150
200
400
600
800
1,000
2017201620150
15
30
45
Source: PotashCorp
STOCK OPTIONS GRANTED Unaudited
($ millions) ($ per share)
Aggregate grant-date fair value Weighted average exercise price Weighted average common shares Stock options
Source: PotashCorp
TOTAL SHARES AND STOCK OPTIONS OUTSTANDINGAs at December 31 – Unaudited
(millions)
PotashCorp 2017 Annual Report 109

Note 27 Share-Based Compensation continued in millions of US dollars except as otherwise noted
the weighted average cost of capital. Under the LTIP, options generally vest and become exercisable onthe third anniversary of the grant date, subject to continuous employment or retirement.
The company issues new common shares to satisfy stock option exercises. Options granted to Canadianparticipants have an exercise price in Canadian dollars.
A summary of the status of the stock option plans as at December 31, 2017, 2016 and 2015 and changesduring the years ending on those dates is as follows:
Number of shares subject to option Weighted average exercise price
2017 2016 2015 2017 2016 2015
Outstanding, beginning of year 19,470,014 19,153,275 20,909,835 $ 31.15 $ 30.97 $ 28.01Granted 1,482,829 3,099,913 3,474,900 18.71 16.20 32.41Exercised (22,100) (2,329,600) (4,803,560) (17.78) (11.09) (10.95)Forfeited or cancelled (1,221,314) (453,574) (427,900) (34.55) (33.99) (43.14)Expired (2,538,775) – – (20.06) – –
Outstanding, end of year 17,170,654 19,470,014 19,153,275 $ 32.24 $ 31.15 $ 30.97
The aggregate grant-date fair value of all options granted during 2017 was $6 (2016 – $6, 2015 – $19). The average share price during 2017 was $17.97 per share (2016 – $16.85 per share, 2015 – $28.23 per share).
The following table summarizes information about stock options outstanding as at December 31, 2017:
Options Outstanding Options Exercisable
Range of Exercise Prices NumberWeighted Average
Remaining Life in YearsWeighted Average
Exercise Price NumberWeighted Average
Exercise Price
$16.00 to $20.00 4,469,182 9 $ 17.30 – $ –$27.00 to $36.00 7,627,545 5 32.32 4,298,545 32.63$37.00 to $44.00 3,597,677 5 39.92 3,597,677 39.92$52.00 to $67.00 1,476,250 1 58.33 1,476,250 58.33
17,170,654 6 $ 32.24 9,372,472 $ 39.48
The foregoing options have expiry dates ranging from May 2018 to February 2027.
Other Plans
The company offers a deferred share unit plan to non-employee directors, which allows each to chooseto receive, in the form of deferred share units (“DSUs”), all or a percentage of the director’s fees, whichwould otherwise be payable in cash. The plan also provides for discretionary grants of additional DSUsby the Board, a practice it discontinued on January 24, 2007 in connection with an increase in the annualretainer. Each DSU fully vests upon award, but is distributed only when the director has ceased to be amember of the Board. Vested units are settled in cash based on the common share price at that time.As at December 31, 2017, the total number of DSUs held by participating directors was 613,703(2016 – 582,048, 2015 – 711,131).
The company offered a multi-year incentive plan to the CEO for the period July 1, 2014 throughDecember 31, 2015, which provided for an award of DSUs. Dividends on outstanding units result in
additional units being issued. The units awarded under the CEO’s multi-year incentive plan were 50percent vested on July 1, 2017 based on performance criteria (company and individual CEO performance)through December 31, 2015. Vested units are settled in cash when employment is terminated. As atDecember 31, 2017, the total number of DSUs held by the CEO was 106,810 (2016 – 104,481, 2015 –98,414).
Upon completion of the Merger, Nutrien assumed all of the above share-based compensation plans and,awards which, where appropriate, will now settle in Nutrien shares. An exchange ratio of 0.400 will beused to convert units and values. The PSU performance condition related to cash flow return oninvestment compared with its weighted average cost of capital will be replaced by metrics related to theachievement of synergies compared to targets.
110 PotashCorp 2017 Annual Report
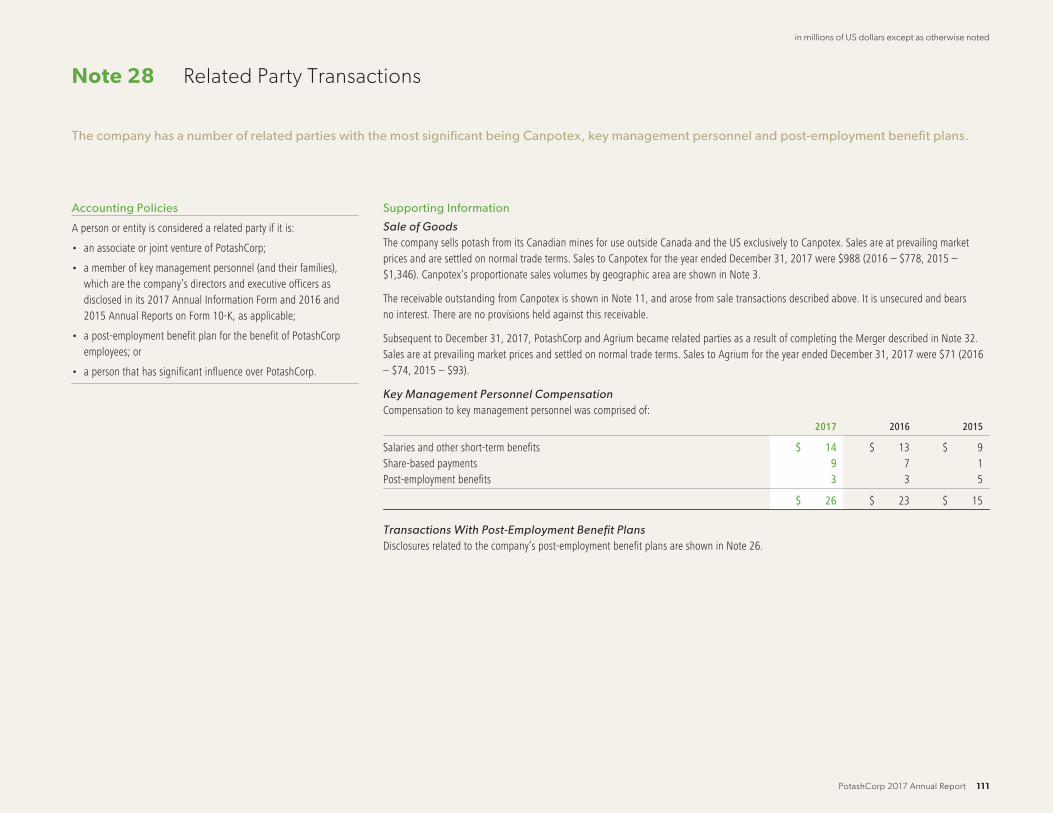
in millions of US dollars except as otherwise noted
Note 28 Related Party Transactions
The company has a number of related parties with the most significant being Canpotex, key management personnel and post-employment benefit plans.
Accounting Policies
A person or entity is considered a related party if it is:
• an associate or joint venture of PotashCorp;
• a member of key management personnel (and their families),which are the company’s directors and executive officers asdisclosed in its 2017 Annual Information Form and 2016 and2015 Annual Reports on Form 10-K, as applicable;
• a post-employment benefit plan for the benefit of PotashCorpemployees; or
• a person that has significant influence over PotashCorp.
Supporting Information
Sale of Goods
The company sells potash from its Canadian mines for use outside Canada and the US exclusively to Canpotex. Sales are at prevailing marketprices and are settled on normal trade terms. Sales to Canpotex for the year ended December 31, 2017 were $988 (2016 – $778, 2015 –$1,346). Canpotex’s proportionate sales volumes by geographic area are shown in Note 3.
The receivable outstanding from Canpotex is shown in Note 11, and arose from sale transactions described above. It is unsecured and bearsno interest. There are no provisions held against this receivable.
Subsequent to December 31, 2017, PotashCorp and Agrium became related parties as a result of completing the Merger described in Note 32.Sales are at prevailing market prices and settled on normal trade terms. Sales to Agrium for the year ended December 31, 2017 were $71 (2016– $74, 2015 – $93).
Key Management Personnel Compensation
Compensation to key management personnel was comprised of:2017 2016 2015
Salaries and other short-term benefits $ 14 $ 13 $ 9Share-based payments 9 7 1Post-employment benefits 3 3 5
$ 26 $ 23 $ 15
Transactions With Post-Employment Benefit Plans
Disclosures related to the company’s post-employment benefit plans are shown in Note 26.
PotashCorp 2017 Annual Report 111

in millions of US dollars except as otherwise noted
Note 29 Financial Instruments and Related Risk Management
Outlined below are the company’s financial instruments, related risk management objectives, policies and exposure, sensitivity and monitoring strategies tofinancial risks.
Accounting Policies Accounting Estimates and Judgments
Financial assets and financial liabilities are recognized as follows:
• initially in the consolidated statements of financial position at fair value (normally the transaction price) and adjusted for transaction costs(recognized immediately in net income for financial instruments at fair value through profit or loss);
• regular way purchases and sales of financial assets are accounted for on the trade date; and
• financial instruments recorded at fair value on an ongoing basis are remeasured at each reporting date and changes in the fair value arerecorded in either net income or OCI.
Financial assets and financial liabilities are offset and the net amount is presented in the statements of financial position when the company:
• currently has a legally enforceable right to offset the recognized amounts; and
• intends either to settle on a net basis, or to realize the assets and settle the liabilities simultaneously.
Judgment is required to determine whether the right to offset islegally enforceable.
See Note 31 for discussion related to the policies, estimates and judgments for fair value measurements.
Supporting Information
Financial Risks
The company is exposed in varying degrees to a variety of financialrisks from its use of financial instruments: credit risk, liquidity riskand market risk. The source of risk exposure and how each ismanaged are outlined below.
Credit Risk
The company’s exposure to credit risk on its cash and cashequivalents, receivables (excluding taxes) and derivative instrumentassets is the carrying amount of each instrument on the consolidatedstatements of financial position.
Credit risk is managed through policies applicable to the following assets:
Acceptable minimumcounterparty credit
ratingsExposure thresholds
by counterparty
Daily counterpartysettlement based on
prescribed creditthresholds
Counterpartiesto contracts are
investment-gradequality
Cash and Cash
EquivalentsX X
Natural Gas
DerivativesX X X
Foreign Currency
DerivativesX
112 PotashCorp 2017 Annual Report

Note 29 Financial Instruments and Related Risk Management continued in millions of US dollars except as otherwise noted
Credit risk on trade receivables is managed through a creditmanagement program whereby:
• credit approval policies and procedures are in place to guide thegranting of credit to new customers as well as its continuedextension to existing customers;
• existing customer accounts are reviewed every 12-18 months;
• credit is extended to international customers based upon anevaluation of both customer and country risk; and
• credit agency reports, where available, and an assessment ofother relevant information such as current financial statementsand/or credit references are used before assigning credit limitsto customers. Those that fail to meet specified benchmarkcreditworthiness may transact with the company on aprepayment basis or provide another form of credit support thatthe company approves.
Other information relating to trade receivables includes:
• the company does not hold any collateral as security ontrade receivables;
• guarantees or standby letters of credit, if appropriate, may berequested to mitigate credit risk;
• export insurance is obtained from the Foreign Credit InsuranceAssociation (covering 90 percent of each balance) forinternational sales from the US and Trinidad that are nototherwise secured or guaranteed;
• a total of $84 in receivables as at December 31, 2017 (2016 –$46) was covered by export insurance, representing 98 percentof offshore receivables (2016 – 98 percent);
• Canpotex also obtains export insurance from ExportDevelopment Canada for its trade receivables (covering90 percent of Canpotex’s receivables);
• the credit period on sales is generally 15 days for fertilizercustomers, 30 days for industrial and feed customers and upto 180 days for select export sales customers;
• interest at 1.5 percent per month is charged on balancesremaining unpaid at the end of the sale terms; and
• historically, the company has experienced minimal customerdefaults and, as a result, it considers the credit quality of thetrade receivables as at December 31, 2017 that are not pastdue to be high.
There were no amounts past due or impaired relating to non-tradereceivables. There were no significant amounts impaired relating totrade receivables. As at December 31, 2017, 84 percent of tradereceivables were current (2016 – 88 percent) and 16 percent werepast due (2016 – 12 percent).
Source: PotashCorp
AGING OF TRADE RECEIVABLESAs at December 31 – Unaudited
(percentage)
Current
Past due
2017
Liquidity Risk
Liquidity risk arises from the company’s general funding needsand in the management of its assets, liabilities and optimal capitalstructure. It manages its liquidity risk to maintain sufficient liquidfinancial resources to fund its operations and meet its commitmentsand obligations in a cost-effective manner. In managing itsliquidity risk, the company has access to a range of fundingoptions. It has established an external borrowing policy with thefollowing objectives:
• maintain an optimal capital structure;
• maintain investment-grade credit ratings that provide ease ofaccess to the debt capital and commercial paper markets;
• maintain sufficient short-term credit availability; and
• maintain long-term relationships with a sufficient number ofhigh-quality and diverse lenders.
The table below outlines the company’s available debt facilities asat December 31, 2017:
TotalAmount
Amount Outstandingand Committed
AmountAvailable
Credit facility 1 $ 3,500 $ 730 $ 2,770Line of credit 75 4 2 71
1 As described in Note 21, $3,500 of this facility was available through May 31, 2020and $3,250 of this facility was available through May 31, 2021. Included in theamount outstanding and committed was $730 of commercial paper. The amountavailable under the commercial paper program is limited to the availability ofbackup funds under the credit facility.
2 Direct borrowings and letters of credit discussed in Note 20.
The company has an uncommitted letter of credit facility of $100.As at December 31, 2017, $43 (2016 – $40) was outstandingunder this facility. Certain of the company’s derivative instrumentscontain provisions that require its debt to maintain specified creditratings from two of the major credit rating agencies. If the debtwere to fall below the specified ratings, the company would be inviolation of these provisions, and the counterparties to thederivative instruments could request immediate payment or demandimmediate and ongoing full overnight collateralization on derivativeinstruments in net liability positions. The aggregate fair value of allderivative instruments with credit risk-related contingent featuresthat were in a liability position on December 31, 2017 was $64, forwhich the company had posted collateral of $38 in the normalcourse of business. If the credit risk-related contingent featuresunderlying these agreements had been triggered on December 31,2017, the company would have been required to post an additional$22 of collateral to its counterparties.
PotashCorp 2017 Annual Report 113

Note 29 Financial Instruments and Related Risk Management continued in millions of US dollars except as otherwise noted
The following maturity analysis of the company’s financial liabilities and gross settled derivative contracts (for which the cash flows are settled simultaneously) is based on the expected undiscounted contractual cashflows from the date of the consolidated statements of financial position to the contractual maturity date.
Carrying Amount of Liabilityas at December 31, 2017
ContractualCash Flows Within 1 Year 1 to 3 Years 3 to 5 Years Over 5 Years
Short-term debt obligations 1 $ 730 $ 730 $ 730 $ – $ – $ –Payables and accrued charges 2 570 570 570 – – –Long-term debt obligations 3,750 5,542 178 1,295 242 3,827Foreign currency derivatives (1)
Outflow 39 39 – – –Inflow (40) (40) – – –
Natural gas derivatives 64 62 25 22 15 –
$ 5,113 $ 6,903 $ 1,502 $ 1,317 $ 257 $ 3,8271 Contractual cash flows include contractual interest payments related to debt obligations. Interest rates on variable rate debt are based on prevailing rates as at December 31, 2017. Disclosures regarding offsetting of certain debt obligations are provided in Note 21.2 Excludes taxes, accrued interest, deferred revenues and current portions of asset retirement obligations and accrued environmental costs and pension and other post-retirement benefits.
Market Risk
Market risks, where financial instrument fair values can fluctuate dueto changes in market prices, include foreign exchange risk, interestrate risk and price risk (related to commodity and equity securities).
Foreign Exchange Risk
To manage foreign exchange risk (primarily related to Canadianoperating and capital expenditures, taxes and dividends), thecompany may enter into foreign currency derivatives. Treasury riskmanagement policies allow such exposures to be hedged withincertain prescribed limits for both forecast operating and capitalexpenditures. The foreign currency derivatives are not currentlydesignated as hedging instruments for accounting purposes.
The company has certain available-for-sale investments listed onforeign stock exchanges and denominated in currencies other thanthe US dollar for which it is exposed to foreign exchange risk. Theseinvestments are held for long-term strategic purposes.
Exposure to reasonably possible changes in relevant foreign currencieson the company’s financial instruments and the pre-tax effects on netincome and OCI include the following:
2017
Carrying Amountof Asset (Liability)as at December 31
Foreign Exchange Risk
5% decrease in US$ 5% increase in US$
Net Income OCI Net Income OCI
Available-for-sale investmentsICL (New Israeli shekels) 1 $ 708 $ – $ 35 $ – $ (35)Sinofert (Hong Kong dollars) 2 258 – 13 – (13)
Payables (CDN) (75) (4) – 4 –Foreign currency derivatives 1 2 – (2) –
2016
Available-for-sale investmentsICL (New Israeli shekels) $ 725 $ – $ 36 $ – $ (36)Sinofert (Hong Kong dollars) 212 – 11 – (11)
Payables (CDN) (83) (4) – 4 –Foreign currency derivatives – 1 – (1) –
1 Sold subsequent to December 31, 2017 (Note 19).2 Assumed any decrease below the carrying amount at the last impairment date would represent a further impairment recorded through net income. The carrying amount was $190 as
at December 31, 2017 (December 31, 2016 – $190). All other variables were assumed to remain constant.
The company has no significant foreign currency exposure related to cash and cash equivalents, receivables and the other available-for-saleinvestment.
114 PotashCorp 2017 Annual Report
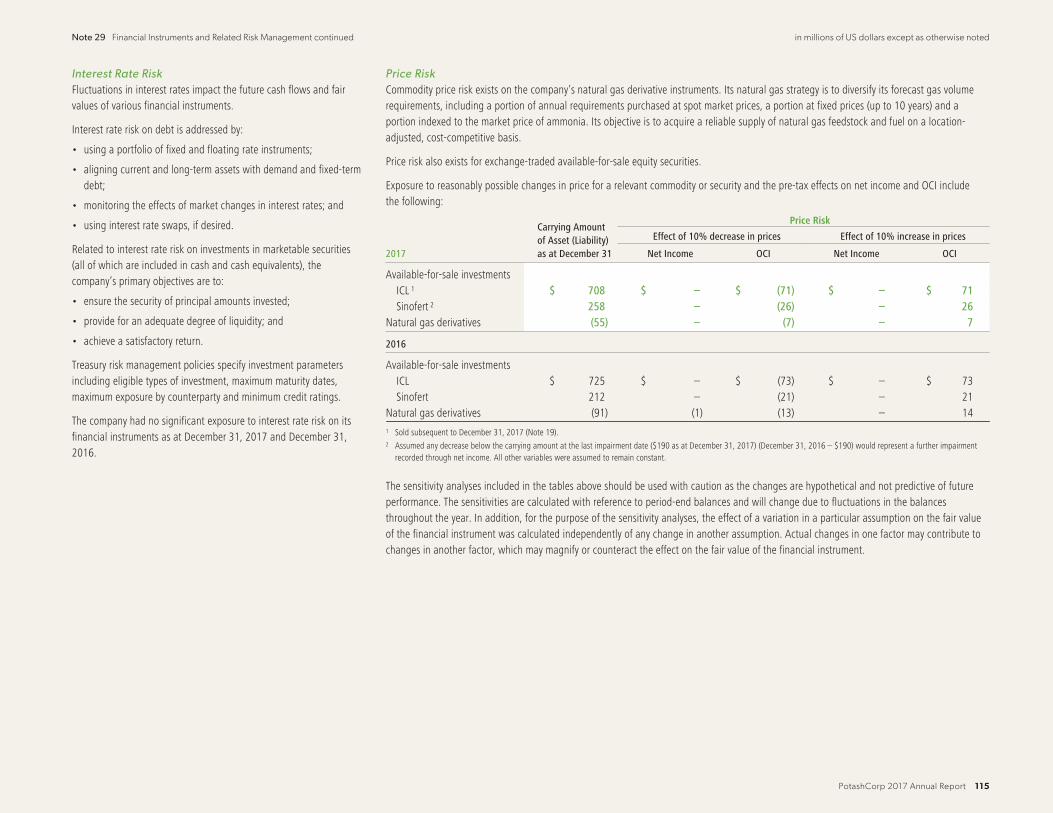
Note 29 Financial Instruments and Related Risk Management continued in millions of US dollars except as otherwise noted
Interest Rate Risk
Fluctuations in interest rates impact the future cash flows and fairvalues of various financial instruments.
Interest rate risk on debt is addressed by:
• using a portfolio of fixed and floating rate instruments;
• aligning current and long-term assets with demand and fixed-termdebt;
• monitoring the effects of market changes in interest rates; and
• using interest rate swaps, if desired.
Related to interest rate risk on investments in marketable securities(all of which are included in cash and cash equivalents), thecompany’s primary objectives are to:
• ensure the security of principal amounts invested;
• provide for an adequate degree of liquidity; and
• achieve a satisfactory return.
Treasury risk management policies specify investment parametersincluding eligible types of investment, maximum maturity dates,maximum exposure by counterparty and minimum credit ratings.
The company had no significant exposure to interest rate risk on itsfinancial instruments as at December 31, 2017 and December 31,2016.
Price Risk
Commodity price risk exists on the company’s natural gas derivative instruments. Its natural gas strategy is to diversify its forecast gas volumerequirements, including a portion of annual requirements purchased at spot market prices, a portion at fixed prices (up to 10 years) and aportion indexed to the market price of ammonia. Its objective is to acquire a reliable supply of natural gas feedstock and fuel on a location-adjusted, cost-competitive basis.
Price risk also exists for exchange-traded available-for-sale equity securities.
Exposure to reasonably possible changes in price for a relevant commodity or security and the pre-tax effects on net income and OCI includethe following:
Carrying Amountof Asset (Liability)as at December 31
Price Risk
Effect of 10% decrease in prices Effect of 10% increase in prices
2017 Net Income OCI Net Income OCI
Available-for-sale investmentsICL 1 $ 708 $ – $ (71) $ – $ 71Sinofert 2 258 – (26) – 26
Natural gas derivatives (55) – (7) – 7
2016
Available-for-sale investmentsICL $ 725 $ – $ (73) $ – $ 73Sinofert 212 – (21) – 21
Natural gas derivatives (91) (1) (13) – 141 Sold subsequent to December 31, 2017 (Note 19).2 Assumed any decrease below the carrying amount at the last impairment date ($190 as at December 31, 2017) (December 31, 2016 – $190) would represent a further impairment
recorded through net income. All other variables were assumed to remain constant.
The sensitivity analyses included in the tables above should be used with caution as the changes are hypothetical and not predictive of futureperformance. The sensitivities are calculated with reference to period-end balances and will change due to fluctuations in the balancesthroughout the year. In addition, for the purpose of the sensitivity analyses, the effect of a variation in a particular assumption on the fair valueof the financial instrument was calculated independently of any change in another assumption. Actual changes in one factor may contribute tochanges in another factor, which may magnify or counteract the effect on the fair value of the financial instrument.
PotashCorp 2017 Annual Report 115

Note 29 Financial Instruments and Related Risk Management continued in millions of US dollars except as otherwise noted
Fair Value
Estimated fair values for financial instruments are designed to approximate amounts for which the instruments could be exchanged in a current arm’s-length transaction between knowledgeable, willing parties. Thevaluation policies and procedures for financial reporting purposes are determined by the company’s finance department.
Financial instruments included in the consolidated statements of financial position are measured either at fair value or amortized cost. The tables below explain the valuation methods used to determine the fair value ofeach financial instrument and its associated level in the fair value hierarchy.
Financial Instruments Measured at Fair Value Fair Value Method
Cash and cash equivalents Carrying amount (approximation to fair value assumed due to short-term nature).
Available-for-sale investments Closing bid price of the common shares (Level 1) as at the statements of financial position dates.
Foreign currency derivatives not traded in an active market Quoted forward exchange rates (Level 2) as at the statements of financial position dates.
Natural gas swaps not traded in an active market A discounted cash flow model. 1
1 Inputs included contractual cash flows based on prices for natural gas futures contracts, fixed prices and notional volumes specified by the swap contracts, the time value of money, liquidity risk, the company’s own credit risk (related to instruments in a liability position) andcounterparty credit risk (related to instruments in an asset position). Futures contract prices used as inputs in the model were supported by prices quoted in an active market and therefore categorized in Level 2.
Financial Instruments Measured at Amortized Cost Fair Value Method
Receivables, short-term debt and payables and accrued charges Carrying amount (approximation to fair value assumed due to short-term nature).
Long-term debt senior notes Quoted market prices (Level 1 or 2 depending on the market liquidity of the debt).
Other long-term debt instruments Carrying amount.
Presented below is a comparison of the fair value of the company’s senior notes to their carrying amounts as at December 31.
2017 2016
Carrying Amount of Liability 1 Fair Value of Liability Carrying Amount of Liability 1 Fair Value of Liability
Long-term debt senior notes $ 3,707 $ 4,045 $ 4,202 $ 4,3841 Includes net unamortized debt issue costs.
116 PotashCorp 2017 Annual Report
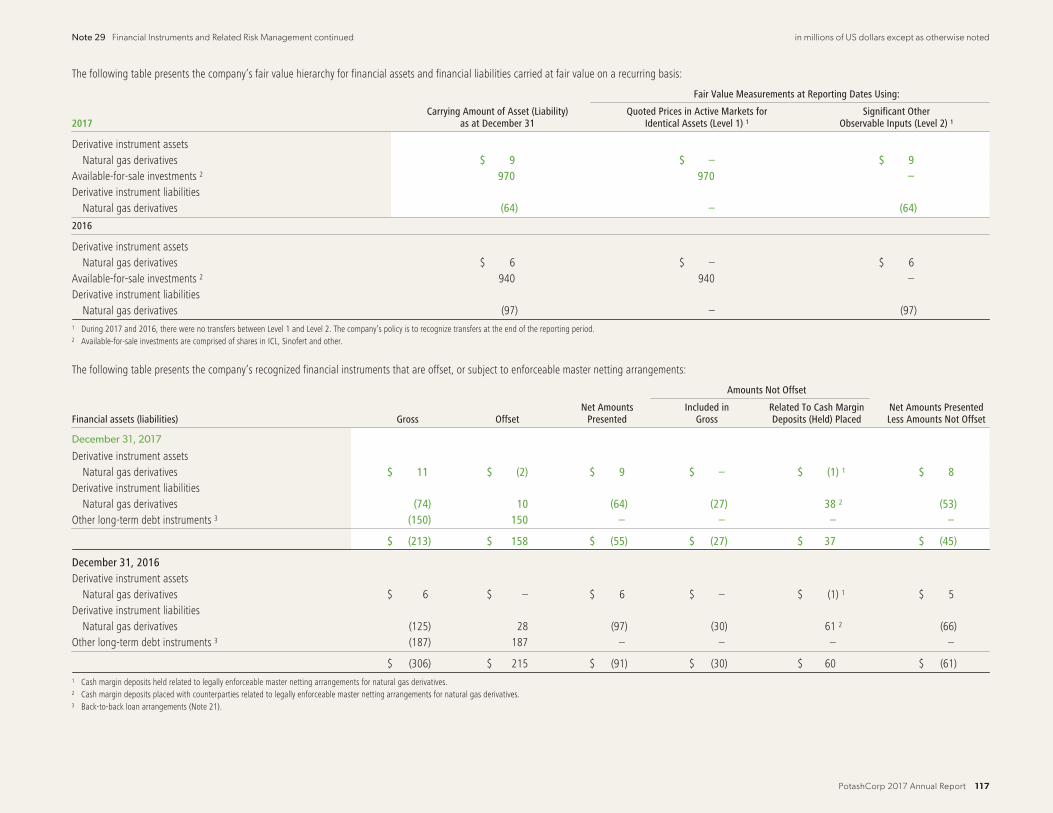
Note 29 Financial Instruments and Related Risk Management continued in millions of US dollars except as otherwise noted
The following table presents the company’s fair value hierarchy for financial assets and financial liabilities carried at fair value on a recurring basis:
Fair Value Measurements at Reporting Dates Using:
2017Carrying Amount of Asset (Liability)
as at December 31Quoted Prices in Active Markets for
Identical Assets (Level 1) 1Significant Other
Observable Inputs (Level 2) 1
Derivative instrument assetsNatural gas derivatives $ 9 $ – $ 9
Available-for-sale investments 2 970 970 –Derivative instrument liabilities
Natural gas derivatives (64) – (64)
2016
Derivative instrument assetsNatural gas derivatives $ 6 $ – $ 6
Available-for-sale investments 2 940 940 –Derivative instrument liabilities
Natural gas derivatives (97) – (97)1 During 2017 and 2016, there were no transfers between Level 1 and Level 2. The company’s policy is to recognize transfers at the end of the reporting period.2 Available-for-sale investments are comprised of shares in ICL, Sinofert and other.
The following table presents the company’s recognized financial instruments that are offset, or subject to enforceable master netting arrangements:
Amounts Not Offset
Financial assets (liabilities) Gross OffsetNet Amounts
PresentedIncluded in
GrossRelated To Cash MarginDeposits (Held) Placed
Net Amounts PresentedLess Amounts Not Offset
December 31, 2017
Derivative instrument assetsNatural gas derivatives $ 11 $ (2) $ 9 $ – $ (1) 1 $ 8
Derivative instrument liabilitiesNatural gas derivatives (74) 10 (64) (27) 38 2 (53)
Other long-term debt instruments 3 (150) 150 – – – –
$ (213) $ 158 $ (55) $ (27) $ 37 $ (45)
December 31, 2016Derivative instrument assets
Natural gas derivatives $ 6 $ – $ 6 $ – $ (1) 1 $ 5Derivative instrument liabilities
Natural gas derivatives (125) 28 (97) (30) 61 2 (66)Other long-term debt instruments 3 (187) 187 – – – –
$ (306) $ 215 $ (91) $ (30) $ 60 $ (61)1 Cash margin deposits held related to legally enforceable master netting arrangements for natural gas derivatives.2 Cash margin deposits placed with counterparties related to legally enforceable master netting arrangements for natural gas derivatives.3 Back-to-back loan arrangements (Note 21).
PotashCorp 2017 Annual Report 117

in millions of US dollars except as otherwise noted
Note 30 Contingencies and Other Matters
Contingent liabilities, which are not recognized in the financial statements but may be disclosed, are possible obligations as a result of uncertain futureevents outside the control of the company, or present obligations not recognized because the amount cannot be sufficiently measured or payment is notprobable.
Accounting Policies Accounting Estimates and Judgments
Generally, a contingent liability arises from past events and is:
• a possible obligation whose existence will be confirmed only by one or more uncertain future events or non-events outside the control of thecompany; or
• a present obligation not recognized because it is not probable that an outflow of resources embodying economic benefits will be required tosettle the obligation, or the amount of the obligation cannot be measured with sufficient reliability.
Contingent liabilities are not recognized in the financial statements but are disclosed unless the possibility of an outflow of resources embodyingeconomic benefits is remote. Where the company is jointly and severally liable for an obligation, the part of the obligation that is expected to bemet by other parties is treated as a contingent liability.
A contingent asset is a possible asset that arises from past events and whose existence will be confirmed only by the occurrence ornon-occurrence of one or more uncertain future events not wholly within the control of the company. Contingent assets are not recognized inthe financial statements and are only disclosed where an inflow of economic benefits is probable.
The following judgments are required to determine the company’sexposure to possible losses and gains related to environmentalmatters and other various claims and lawsuits pending:
• prediction of the outcome of uncertain events (i.e., being virtuallycertain, probable, remote or undeterminable);
• determination of whether recognition or disclosure in theconsolidated financial statements is required; and
• estimation of potential financial effects.
Where no amounts are recognized, such amounts are contingent anddisclosure may be appropriate. While the amount disclosed in theconsolidated financial statements may not be material, the potentialfor large liabilities exists and therefore these estimates could have amaterial impact on the company’s consolidated financial statements.
Supporting Information
Canpotex
PCS is a shareholder in Canpotex, which markets Canadian potashoffshore. Should any operating losses or other liabilities be incurredby Canpotex, the shareholders have contractually agreed toreimburse it for such losses or liabilities in proportion to eachshareholder’s productive capacity. Through December 31, 2017,there were no such operating losses or other liabilities.
Mining Risk
The risk of underground water inflows, as with most otherunderground risks, is currently not insured.
Legal and Other Matters
The company is engaged in ongoing site assessment and/orremediation activities at a number of facilities and sites, andanticipated costs associated with these matters are added to accruedenvironmental costs in the manner described in Note 18. Thisincludes matters related to investigation of potential brine migrationat certain of the potash sites. The following environmental siteassessment and/or remediation matters have uncertainties that maynot be fully reflected in the amounts accrued for those matters:
Nitrogen and Phosphate
• The US Environmental Protection Agency (“USEPA”) has identifiedPCS Nitrogen, Inc. (“PCS Nitrogen”) as a potentially responsibleparty at the Planters Property or Columbia Nitrogen site inCharleston, South Carolina (the “Charleston Site”). PCS Nitrogen issubject to a final judgment by the US District Court for the Districtof South Carolina allocating 30 percent of the liability for responsecosts at the Charleston Site to PCS Nitrogen, as well as aproportional share of any costs that cannot be recovered fromanother responsible party. In December 2013, the USEPA issuedan order to PCS Nitrogen and four other respondents requiringthem jointly and severally to conduct certain cleanup work at theCharleston Site and reimburse the USEPA’s costs for overseeingthat work. PCS Nitrogen is currently performing the work required
118 PotashCorp 2017 Annual Report

Note 30 Contingencies and Other Matters continued in millions of US dollars except as otherwise noted
by the USEPA order. The USEPA also has requested reimbursementof approximately $3 of previously incurred response costs. Theultimate amount of liability for PCS Nitrogen depends upon,among other factors, the final outcome of litigation to imposeliability on additional parties, the outcome of the bankruptcyproceeding for the owner of the Charleston Site, the amountneeded for remedial activities, the ability of other parties to payand the availability of insurance.
• PCS Phosphate has been identified as a responsible party at theWard Transformer Superfund Site in Raleigh, North Carolina (the“Raleigh Site”). In the past, PCS Phosphate worked with certainother responsible parties to address PCB soil contamination at theRaleigh Site pursuant to an agreement with the USEPA. Theresponse actions are nearly complete at an estimated cost of $80,including anticipated remaining work on the Raleigh Site. TheUSEPA also sought remediation in certain downstream areas thatare referred to as “Operable Unit 1.” PCS Phosphate signed aConsent Decree with the USEPA for Operable Unit 1 in September2016 that is not expected to require PCS Phosphate to incur anyadditional remediation costs. Litigation for the recovery of incurredcleanup costs was resolved through mediation and entry of theConsent Decree.
• In 1996, PCS Nitrogen Fertilizer, L.P. (“PCS Nitrogen Fertilizer”),then known as Arcadian Fertilizer, L.P., entered into a ConsentOrder (the “Order”) with the Georgia Environmental ProtectionDivision (“GEPD”) in conjunction with PCS Nitrogen Fertilizer’sacquisition of real property in Augusta, Georgia. Under the Order,PCS Nitrogen Fertilizer is required to perform certain activities toinvestigate and, if necessary, implement corrective measures forsubstances in soil and groundwater. The investigation hasproceeded and the results have been presented to the GEPD. Twointerim corrective measures for substances in groundwater havebeen proposed by PCS Nitrogen Fertilizer and approved by theGEPD. PCS Nitrogen Fertilizer is implementing the approvedinterim corrective measures, which may be modified by PCSNitrogen Fertilizer from time to time, but it is unable to estimate
with reasonable certainty the total cost of its corrective actionobligations under the Order at this time.
Based on current information and except for the uncertaintiesdescribed in the preceding paragraphs, the company does notbelieve that its future obligations with respect to these facilities andsites are reasonably likely to have a material adverse effect on itsconsolidated financial statements.
Other legal matters with significant uncertainties include thefollowing:
Nitrogen and Phosphate
• The USEPA has an ongoing initiative to evaluate implementationwithin the phosphate industry of a particular exemption formineral processing wastes under the hazardous waste program. Inconnection with this industry-wide initiative, the USEPA conductedinspections at numerous phosphate operations and notified thecompany of alleged violations of the US Resource Conservationand Recovery Act (“RCRA”) at its plants in Aurora, North Carolina;Geismar, Louisiana; and White Springs, Florida. The company hasentered into RCRA 3013 Administrative Orders on Consent andhas performed certain site assessment activities at all of theseplants. At this time, the company does not know the scope ofaction, if any, that may be required. As to the alleged RCRAviolations, the company continues to participate in settlementdiscussions with the USEPA but is uncertain if any resolution willbe possible without litigation, or, if litigation occurs, what theoutcome would be. The company routinely monitors publicinformation about the impacts of the initiative on other industrymembers, and it regularly considers this information inestablishing the appropriate asset retirement obligations andaccruals.
• In August 2015, the USEPA finalized amendments to thehazardous air pollutant emission standards for phosphoric acidmanufacturing and phosphate fertilizer production (“Final Rule”).Required emissions testing at the company’s Aurora facility in2016 indicated alleged exceedances of the mercury emissionlimits that were established by the Final Rule. The company has
communicated with the relevant agencies about this issue andpetitioned the USEPA to reconsider the mercury emission limits.The facility also entered into an agreed order with the NorthCarolina Department of Environmental Quality in November 2016to resolve the alleged mercury exceedances and provide a planand schedule for evaluating alternative compliance strategies.Given the pending legal issues and the company’s evaluation ofalternative compliance strategies, the resulting cost of compliancewith the various provisions of the Final Rule cannot be predictedwith reasonable certainty at this time.
General
• The countries where we operate are parties to the ParisAgreement adopted in December 2015 pursuant to the UnitedNations Framework Convention on Climate Change. Each countrythat is a party to the Paris Agreement submitted an IntendedNationally Determined Contribution (“INDC”) toward the controlof greenhouse gas emissions. The impacts of these INDCs on thecompany’s operations cannot be determined with any certainty atthis time. In October 2016, the Canadian government announceda national plan to put a price of $10 per tonne on carbonemissions beginning in 2018 and increasing by $10 per tonneeach year through 2022, to be implemented either through acarbon tax or a cap and trade program at the election of eachprovince. The Province of Saskatchewan is considering variousalternative approaches to address the national plan. Othercountries where the company operates have not at this timeannounced similar regulatory plans that would appear to have asignificant impact on company operations. The company ismonitoring these developments and their future effect on itsoperations cannot be determined with certainty at this time.
In addition, various other claims and lawsuits are pending againstthe company in the ordinary course of business. While it is notpossible to determine the ultimate outcome of such actions at thistime, and inherent uncertainties exist in predicting such outcomes, itis the company’s belief that the ultimate resolution of such actions isnot reasonably likely to have a material adverse effect on itsconsolidated financial statements.
PotashCorp 2017 Annual Report 119

Note 30 Contingencies and Other Matters continued in millions of US dollars except as otherwise noted
The breadth of the company’s operations and the global complexityof tax regulations require assessments of uncertainties andjudgments in estimating the taxes it will ultimately pay. The finaltaxes paid are dependent upon many factors, including negotiationswith taxing authorities in various jurisdictions, outcomes of taxlitigation and resolution of disputes arising from federal, provincial,state and local tax audits. The resolution of these uncertaintiesand the associated final taxes may result in adjustments to thecompany’s tax assets and tax liabilities.
The company owns facilities that have been either permanently orindefinitely shut down. It expects to incur nominal annualexpenditures for site security and other maintenance costs at certainof these facilities. Should the facilities be dismantled, certain othershutdown-related costs may be incurred. Such costs are notexpected to have a material adverse effect on the company’sconsolidated financial statements and would be recognized andrecorded in the period in which they are incurred.
Note 31 Accounting Policies, Estimates and Judgments
Accounting Policies, Estimates and Judgments
The following table discusses the accounting policies, estimates, judgments and assumptions the company has adopted and made and how they affect the amounts reported in the consolidated financial statements.
Topic Accounting Policies Accounting Estimates and Judgments 1
Principles ofConsolidation
These consolidated financial statements include the accounts of the company and entities controlled by it (its subsidiaries). Control is achievedby having each of:
• power over the investee via existing rights that give the company the current ability to direct the relevant activities of the investee;
• exposure, or rights, to variable returns from involvement with the investee; and
• the ability for the company to use its power over the investee to affect the amount of the company’s returns.
The existence and effect of potential voting rights that are currently exercisable or convertible are considered when assessing whether thecompany controls another entity.
Subsidiaries are fully consolidated from the date on which control is transferred to the company. They are deconsolidated from the date thatcontrol ceases.
Judgment involves:
• assessing control, including if the companyhas the power to direct the relevantactivities of the investee; and
• determining the relevant activities andwhich party controls them.
120 PotashCorp 2017 Annual Report

Note 31 Accounting Policies, Estimates and Judgments continued in millions of US dollars except as otherwise noted
Topic Accounting Policies Accounting Estimates and Judgments 1
Principles of
Consolidation
continued
Principal (wholly owned)Operating Subsidiaries: Location Principal Activity
Consideration is given to:
• voting rights;
• the relative size and dispersion of thevoting rights held by other shareholders;
• the extent of participation by thoseshareholders in appointing keymanagement personnel or board members;
• the right to direct the investee to enter intotransactions for the company’s benefit; and
• the exposure, or rights, to variability ofreturns from the company’s involvementwith the investee.
• PCS Sales (Canada) Inc. Canada Marketing and sales of the company’s products
• PCS Sales (USA), Inc. United States Marketing and sales of the company’s products
• PCS Phosphate Company, Inc.(“PCS Phosphate”)– PCS Purified Phosphates
United States Mining and/or processing of phosphate products in the states of NorthCarolina, Illinois, Missouri and Nebraska
• White Springs Agricultural Chemicals,Inc. (“White Springs”)
United States Mining and processing of phosphate products in the state of Florida
• PCS Nitrogen Fertilizer, L.P. United States Production of nitrogen products in the states of Georgia and Louisiana,and of phosphate products in the state of Louisiana
• PCS Nitrogen Ohio, L.P. United States Production of nitrogen products in the state of Ohio
• PCS Nitrogen Trinidad Limited Trinidad Production of nitrogen products in Trinidad
• PCS Cassidy Lake Company Canada Brine pumping operations for the company’s New Brunswick operation
Intercompany balances and transactions are eliminated on consolidation.
Long-Lived Asset
Impairment
At the end of each reporting period, the company reviews conditions potentially impacting the carrying amounts of both its long-lived assetsto be held and used and its identifiable intangible assets with finite lives to determine whether there is any indication that they havesuffered an impairment loss. When such indicators exist, impairment testing is performed. Regardless, goodwill is tested at least annually(typically in the second quarter).
For assessing impairment, assets are grouped at the smallest levels for which there are separately identifiable cash inflows that are largelyindependent of the cash inflows from other assets or groups of assets (this can be at the asset or CGU level).
Where impairment indicators exist for the asset or CGU:
• the recoverable amount is estimated (the recoverable amount is the higher of fair value less costs to sell and value in use);
• to assess value in use, the estimated future cash flows are discounted to their present value (using a pre-tax discount rate that reflectscurrent market assessments of the time value of money and the risks specific to the asset or CGU for which the estimates of future cashflows have not been adjusted);
• the impairment loss is the amount by which the carrying amount exceeds its recoverable amount; and
• the impairment loss is allocated first to reduce the carrying amount of any related goodwill and then pro rata to each asset in the unit (onthe basis of the carrying amount).
Non-financial assets, other than goodwill, that previously suffered an impairment loss are reviewed at each reporting date for possiblereversal of the impairment.
Judgment involves:
• identifying the appropriate asset or CGU;
• determining the appropriate discount ratefor assessing value in use; and
• making assumptions about future sales,margins and market conditions over thelong-term life of the assets or CGUs.
The company cannot predict if an event thattriggers impairment will occur, when it willoccur or how it will affect reported assetamounts. It is reasonably possible that theamounts reported for asset impairments couldbe different if different assumptions were usedor if market and other conditions change. Thechanges could result in non-cash charges thatcould materially affect the company’sconsolidated financial statements.
Impairments were recognized during 2017and 2016 as shown in Note 13.
PotashCorp 2017 Annual Report 121

Note 31 Accounting Policies, Estimates and Judgments continued in millions of US dollars except as otherwise noted
Topic Accounting Policies Accounting Estimates and Judgments 1
Fair Value
Measurements
Fair value is the price that would be received to sell an asset or paid to transfer a liability in an orderly transaction between marketparticipants at the measurement date, regardless of whether that price is directly observable or estimated using another valuation technique.
Fair value measurements are categorized into levels based on the degree to which inputs are observable and their significance:
Fair values estimates:
• are at a point-in-time and may change insubsequent reporting periods due to marketconditions or other factors;
• can be determined using multiple methods,which can cause values (or a range ofreasonable values) to differ; and
• may require assumptions about costs/pricesover time, discount and inflation rates,defaults and other relevant variables.
Level 1 Level 2 Level 3
Unadjusted quoted prices (inactive markets accessible at themeasurement date for identicalassets or liabilities).
Quoted prices (in markets that arenot active or based on inputs thatare observable for substantially thefull term of the asset or liability).
Prices or valuation techniques thatrequire inputs that are bothunobservable and significant to theoverall measurement.
Determination of the level hierarchy is basedon the company’s assessment of the lowestlevel input that is significant to the fair valuemeasurement and is subject to estimationand judgment.
Prepaid Expenses Freight, transportation and distribution costs related to product inventory stored at warehouse and terminal facilities are classified asprepaid expenses.
Not applicable.
Restructuring
Charges
Plant shutdowns, sales of business units or other corporate restructurings may trigger restructuring costs. Incremental costs for employeetermination, contract termination and other exit costs are recognized as a liability and an expense when:
• a detailed formal plan for restructuring has been demonstrably committed to;
• withdrawal is without realistic possibility; and
• a reliable estimate can be made.
Restructuring activities are complex, can takeseveral months to complete and usuallyinvolve reassessing estimates throughoutthe process.
Foreign Currency
Transactions
Items included in the consolidated financial statements of the company and each of its subsidiaries are measured using the currency of theprimary economic environment in which the individual entity operates (“the functional currency”).
Foreign currency transactions are generally translated to US dollars at the average exchange rate for the previous month. Monetary assetsand liabilities are translated at period-end exchange rates. Foreign exchange gains and losses resulting from the settlement of suchtransactions, and from the translation at period-end exchange rates of monetary assets and liabilities denominated in foreign currencies,are recognized and presented in the consolidated statements of income within other (expenses) income, as applicable, in the period inwhich they arise.
Non-monetary assets and liabilities carried at fair value are translated using the exchange rate at the date when the fair value is determinedand translation differences are recognized as part of changes in fair value. Translation differences on non-monetary financial assets such asinvestments in equity securities classified as available-for-sale are included in OCI. Non-monetary assets measured at historical cost aretranslated at the average monthly exchange rate prevailing at the time of the transaction, unless the exchange rate in effect on the date thatthe transaction occurred is available and it is apparent that such rate is a more suitable measurement.
The consolidated financial statementsare presented in United States dollars(“US dollars”), which was determined tobe the functional currency of the companyand the majority of its subsidiaries.
1 Certain of the company’s policies involve accounting estimates and judgments because they require the company to make subjective or complex judgments about matters that are inherently uncertain and because of the likelihood that materially different amounts could be reportedunder different conditions or using different assumptions.
122 PotashCorp 2017 Annual Report
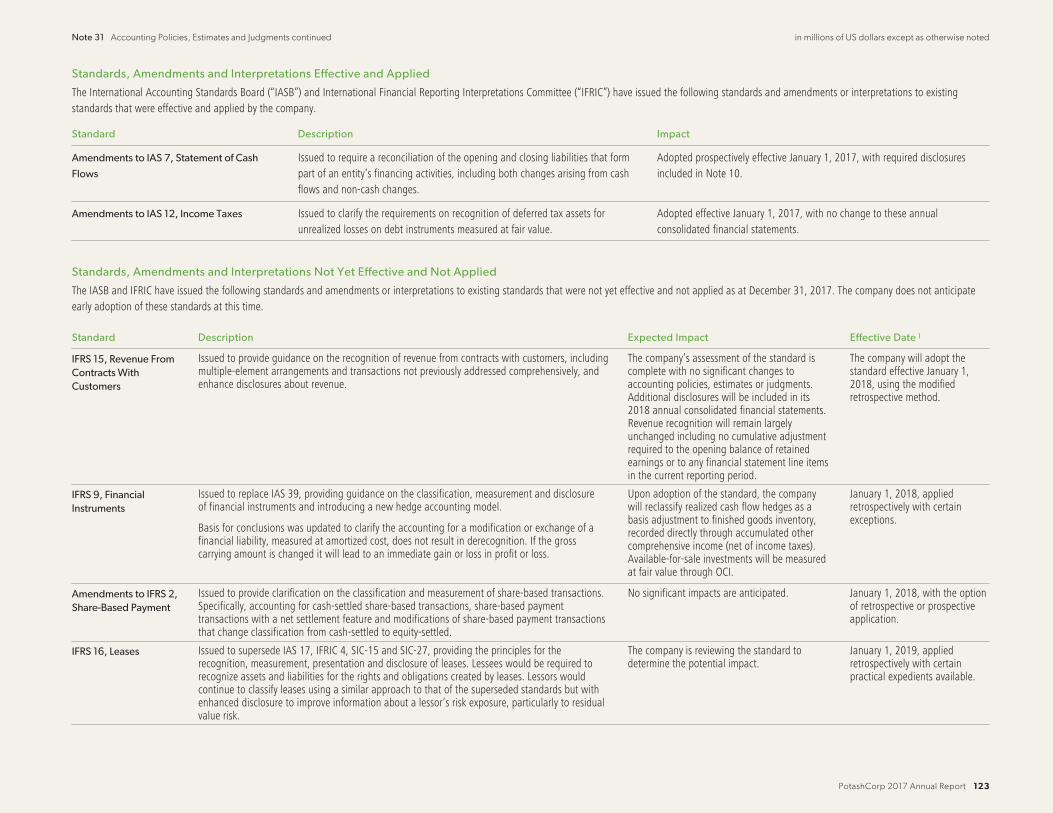
Note 31 Accounting Policies, Estimates and Judgments continued in millions of US dollars except as otherwise noted
Standards, Amendments and Interpretations Effective and Applied
The International Accounting Standards Board (“IASB”) and International Financial Reporting Interpretations Committee (“IFRIC”) have issued the following standards and amendments or interpretations to existingstandards that were effective and applied by the company.
Standard Description Impact
Amendments to IAS 7, Statement of Cash
Flows
Issued to require a reconciliation of the opening and closing liabilities that formpart of an entity’s financing activities, including both changes arising from cashflows and non-cash changes.
Adopted prospectively effective January 1, 2017, with required disclosuresincluded in Note 10.
Amendments to IAS 12, Income Taxes Issued to clarify the requirements on recognition of deferred tax assets forunrealized losses on debt instruments measured at fair value.
Adopted effective January 1, 2017, with no change to these annualconsolidated financial statements.
Standards, Amendments and Interpretations Not Yet Effective and Not Applied
The IASB and IFRIC have issued the following standards and amendments or interpretations to existing standards that were not yet effective and not applied as at December 31, 2017. The company does not anticipateearly adoption of these standards at this time.
Standard Description Expected Impact Effective Date 1
IFRS 15, Revenue FromContracts WithCustomers
Issued to provide guidance on the recognition of revenue from contracts with customers, includingmultiple-element arrangements and transactions not previously addressed comprehensively, andenhance disclosures about revenue.
The company’s assessment of the standard iscomplete with no significant changes toaccounting policies, estimates or judgments.Additional disclosures will be included in its2018 annual consolidated financial statements.Revenue recognition will remain largelyunchanged including no cumulative adjustmentrequired to the opening balance of retainedearnings or to any financial statement line itemsin the current reporting period.
The company will adopt thestandard effective January 1,2018, using the modifiedretrospective method.
IFRS 9, FinancialInstruments
Issued to replace IAS 39, providing guidance on the classification, measurement and disclosureof financial instruments and introducing a new hedge accounting model.
Basis for conclusions was updated to clarify the accounting for a modification or exchange of afinancial liability, measured at amortized cost, does not result in derecognition. If the grosscarrying amount is changed it will lead to an immediate gain or loss in profit or loss.
Upon adoption of the standard, the companywill reclassify realized cash flow hedges as abasis adjustment to finished goods inventory,recorded directly through accumulated othercomprehensive income (net of income taxes).Available-for-sale investments will be measuredat fair value through OCI.
January 1, 2018, appliedretrospectively with certainexceptions.
Amendments to IFRS 2,Share-Based Payment
Issued to provide clarification on the classification and measurement of share-based transactions.Specifically, accounting for cash-settled share-based transactions, share-based paymenttransactions with a net settlement feature and modifications of share-based payment transactionsthat change classification from cash-settled to equity-settled.
No significant impacts are anticipated. January 1, 2018, with the optionof retrospective or prospectiveapplication.
IFRS 16, Leases Issued to supersede IAS 17, IFRIC 4, SIC-15 and SIC-27, providing the principles for therecognition, measurement, presentation and disclosure of leases. Lessees would be required torecognize assets and liabilities for the rights and obligations created by leases. Lessors wouldcontinue to classify leases using a similar approach to that of the superseded standards but withenhanced disclosure to improve information about a lessor’s risk exposure, particularly to residualvalue risk.
The company is reviewing the standard todetermine the potential impact.
January 1, 2019, appliedretrospectively with certainpractical expedients available.
PotashCorp 2017 Annual Report 123

Note 31 Accounting Policies, Estimates and Judgments continued in millions of US dollars except as otherwise noted
Standard Description Expected Impact Effective Date 1
IFRIC 23, UncertaintyOver Income TaxTreatments
Issued to provide guidance on recognition and measurement of uncertain income tax treatments. The company is reviewing the standard todetermine the potential impact, if any.
January 1, 2019, appliedretrospectively with certainpractical expedients available.
Amendments to IAS 28,Long-term Interests inAssociates and JointVentures
Issued to clarify that IFRS 9, including its impairment requirements, applies to long-term interests inassociates and joint ventures that form part of an entity’s net investment in these investees.
The company is reviewing the standard todetermine the potential impact, if any.
January 1, 2019, appliedretrospectively.
Amendments to IAS 19,Employee Benefits
Issued to require the use of updated assumptions when determining current service cost and netinterest for the remainder of the period after a plan amendment, curtailment or settlement. Alsorequired is any reduction in surplus, even amounts not previously recognized due to an asset ceilinglimitation, to be recognized in profit or loss as part of past service cost or a gain or loss on settlement.
The company is reviewing the standard todetermine the potential impact, if any.
January 1, 2019, appliedprospectively.
IFRS 17, InsuranceContracts
Issued to replace IFRS 4, providing guidance for the recognition, measurement, presentation anddisclosure of insurance contracts giving consideration to: substantive rights and obligations arisingfrom a contract, law or regulation; enforceable rights and obligations in a contract; and whethercontracts are written, oral or implied by customary business practices.
Although the company does not underwriteinsurance contracts, all significant contracts willbe reviewed under the scope of the standard todetermine the potential impact, if any.
January 1, 2021, appliedretrospectively with certainpractical expedients available.
1 Effective date for annual periods beginning on or after the stated date.
124 PotashCorp 2017 Annual Report

in millions of US dollars except as otherwise noted
Note 32 Merger of Equals with Agrium
Business Combination
Accounting Policies Accounting Estimates and Judgments
Business combinations are recognized as follows:
• Acquisitions of subsidiaries and businesses are accounted for using the acquisition method.
• Consideration for each acquisition is measured at the aggregate of the fair values of assets given, liabilities incurred or assumed, and equityinstruments issued in exchange for control of the acquiree at the acquisition date.
• The acquisition date is the date the company obtains control over the acquiree and is generally the day the purchase consideration transfers.
• At the acquisition date, the identifiable assets acquired and liabilities assumed are recognized at their fair values with the exception ofdeferred taxes, employee benefit arrangements, replaced acquiree share-based payment awards and assets held for sale, where IFRS providesexceptions to recording amounts at fair value.
• Acquisition-related costs are recognized in earnings as incurred.
• On an acquisition-by-acquisition basis, non-controlling interest (if any) in the acquiree is recognized either at fair value or at thenoncontrolling interest’s proportionate share of the acquiree’s net assets.
• The excess of total consideration for each acquisition plus non-controlling interest in the acquiree, over the fair value of the identifiable netassets acquired, is recorded as goodwill. If the total consideration plus non-controlling interest is less than the fair value of the net assetsacquired, a purchase gain is recognized in earnings.
• If the initial accounting for a business combination is incomplete by the end of the reporting period in which the combination occurs,provisional amounts are recorded for the incomplete items. The measurement period is the period from the date of acquisition to the datecomplete information about facts and circumstances that existed as of the acquisition date is received, subject to a maximum of one year.Provisional amounts are retrospectively adjusted during the measurement period, or recognized as additional assets or liabilities to reflect newinformation obtained about facts and circumstances that existed as of the acquisition date that, if known, would have affected the amountsrecognized as of that date.
Estimation is required to allocate the purchase consideration to thefair value of the identifiable tangible and intangible assets acquiredand liabilities assumed.
Judgment is required to determine which entity is the acquirer in amerger of equals.
PotashCorp 2017 Annual Report 125

Note 32 Merger of Equals with Agrium continued in millions of US dollars except as otherwise noted
Supporting Information
On January 1, 2018, after receiving all required regulatoryapprovals, the company and Agrium combined their businesses in amerger of equals by becoming wholly owned subsidiaries of a newparent company named Nutrien. On January 2, 2018, the mergedentity began trading on the Toronto Stock Exchange and New YorkStock Exchange (NYSE) under the symbol NTR, and the shares ofPotashCorp and Agrium were delisted. Shareholders of PotashCorpreceived 0.400 common shares of Nutrien for each PotashCorpshare held and shareholders of Agrium received 2.230 commonshares of Nutrien for each Agrium share held. The exchange ratiosrepresent the respective closing share prices of each company’scommon shares at market close on the NYSE on August 29, 2016,the last trading day prior to when the companies announced thatthey were in preliminary discussions regarding a merger of equals,which is consistent with the approximate 10-day and 60-dayvolume weighted average prices through that date. PotashCorp isthe acquirer for accounting purposes, and as a result, the financialstatements and related notes of Nutrien in 2018 and beyond willreflect the operations of Nutrien. Figures for 2017 and prior willreflect the operations of PotashCorp. The purchase consideration isapproximately $16 billion.
Key dates of the Merger:
• September 11, 2016 - The company entered into an agreementwith Agrium to combine their businesses under the CanadaBusiness Corporations Act.
• November 3, 2016 - The plan of arrangement was approved byshareholders of both companies.
• November 7, 2016 - The Ontario Superior Court of Justice issueda final order approving the plan of arrangement.
• October 18, 2017 - Conditional approval was received from theCompetition Commission of India, requiring PotashCorp to divestminority shareholdings in SQM, APC and ICL within a period of18 months from the issuance of the order.
• November 6, 2017 - Agrium signed definitive asset salesagreements to divest its Conda phosphate and North Bend nitricacid operations intended to address United States regulatoryconcerns.
• November 7, 2017 - Approval was received from China’s Ministryof Commerce, conditioned on the divestiture of PotashCorp’sminority shareholdings in SQM and APC within 18 months, andICL within nine months, from the closing of the Merger.
• December 27, 2017 - Clearance was received from the UnitedStates’ Federal Trade Commission conditional on certaindivestitures by Agrium.
The sale of PotashCorp’s interest in ICL closed on January 24, 2018.Agrium completed the dispositions of certain operations on January12, 2018, as required by the conditional approval of the Mergerfrom the United States’ Federal Trade Commission.
The companies had previously received unconditional regulatoryclearance from Canada, Brazil and Russia.
Agrium is a retail distributor of agricultural crop inputs, providinggrowers with fertilizer, crop protection products, seed, services andsolutions. Agrium is also one of the largest manufacturers offertilizer in the world producing and marketing all three major cropnutrients – nitrogen, potash and phosphate.
Nutrien is expected to be the largest crop nutrient company in theworld, the third largest natural resource company in Canada, a
low-cost producer of potash and high-quality nitrogen andphosphate, integrated with a leading global retail distributionplatform.
Due to the timing of the Merger and the ongoing nature of thevaluation process for Agrium’s global operations, the following fairvalues were not available as of February 20, 2018: tangible orintangible assets; liabilities incurred; contingent consideration;indemnification assets; gross contractual amounts receivable;contractual cash flows not expected to be collected; major classesof assets and liabilities; contingent liabilities; goodwill deductiblefor tax purposes; and transactions separately recognized fromacquired assets and assumed liabilities, including acquisition-related costs.
On acquisition date, the fair value considerations of cash andreceivables transferred to Nutrien were $466 and $2,424,respectively.
Goodwill is anticipated to be comprised of expected synergies from:bringing together world-class nutrient production assets and retaildistribution, providing an integrated platform with multiple pathsfor growth; creating annual run-rate operating synergies; enhancingfinancial flexibility through the use of a strong balance sheet andimproved cash flows, enabling the support of growth initiatives andshareholder returns; and leveraging best-in-class leadership andgovernance through the combination of two experienced teams thatare focused on creating long-term value.
126 PotashCorp 2017 Annual Report

Note 32 Merger of Equals with Agrium continued in millions of US dollars except as otherwise noted
If the accounting acquisition of Agrium occurred on January 1,2017, pro forma revenue and net earnings as at December 31,2017 would have been $18,242 and $816, respectively. Inaccordance with IFRS, the final fair values are expected to bedetermined within 12 months from the acquisition date.
Contingent liabilities acquired but not recognized include:
Idaho phosphate mining and processing sites
• Nu-West Industries, Inc. (“Nu-West”), a wholly owned subsidiaryof Agrium, has been working co-operatively with federal andstate agencies on environmental remediation at existing andformer phosphate mining and processing sites in Idaho. Nu-Westhas been notified of potential violations of federal and statestatutes by US federal and state agencies. Depending on the site,Nu-West is in the investigation or risk assessment stage or has,for some sites, begun preliminary remediation work under
agreements with the agencies. Completion of investigations, riskassessments or preliminary work will enable Nu-West and theagencies to determine what, if any, remediation work will berequired. During 2016 and 2017, Nu-West completed substantialremedial construction and investigative fieldwork for certain ofthe Idaho sites. Results of the construction and site monitoringwill determine future investigation and remediationrequirements. In 2015, Nu-West received a Notice of Intentadvising that trustees for US federal and state agencies willconduct a damage assessment at the Idaho phosphate miningand processing sites. Discussions with the trustees, includingnegotiation of the scope of future remediation, continued in2017; the assessment may take many years to mature to a stagewhere the trustees assert a claim for damages.
Manitoba mining properties
• In 1996, Agrium acquired Viridian Inc. (“Viridian”). Viridian hasretained certain liabilities associated with the Fox Mine - a closedmineral processing site near Lynn Lake, Manitoba. Viridian wasamalgamated with Agrium in 2017. Agrium is currently treatingwater draining from the site to meet provincial downstreamwater quality standards. Agrium has substantially completed theinvestigation phase of remediation and is currently in discussionswith the Province of Manitoba regarding remedial alternativesselection. Concurrence and approval from the Province of aremedial design are expected within the next 12-36 months. Forthis matter, we have not disclosed information about the amountaccrued for site remediation because disclosure of suchinformation would seriously prejudice our position in discussionswith the Province. There were no significant developments in2017.
Other events occurring after December 31, 2017 related to the Merger include:
Event Location
Sale of ICL Note 19, Page 91Share-based compensation plan modifications Note 27, Page 110Acquisition of Agrichem See below
On January 29, 2018, Nutrien announced the planned acquisition of Agrichem, a leading Brazilian specialty plant nutrition and plant health product company. The acquisition will be made in two tranches, with 80percent of the business expected to be acquired by the end of March 2018. The remaining 20 percent of the business is expected to be acquired in 2019, with the price being based on 2018 earnings before interest,taxes, depreciation and amortization levels. Closing of the transaction is subject to regulatory approvals and satisfaction of customary conditions precedent.
Note 33 Comparative Figures
In 2017, 2016 and 2015, prior period amounts classified as shareof earnings of equity-accounted investees, dividend income andincome tax recovery (expense) relating to discontinued operations,as described in Note 19, were reclassified from operating incomeand income tax recovery (expense) to net income from discontinued
operations on the consolidated statements of income. Theremaining immaterial amounts associated with continuingoperations for share of earnings of equity-accounted investees,dividend income and impairment of available-for-sale investmentwere aggregated in other (expenses) income in Note 6. Transactioncosts that were previously included in other (expenses) income were
reported as a separate line item in the consolidated statements ofincome given their significance in Note 6. Impairment foravailable-for-sale investment of $10 in 2016 was combined withother long-term liabilities and miscellaneous in Note 10 as theamount was not considered significant.
PotashCorp 2017 Annual Report 127

APPENDIX
MARKET AND INDUSTRY DATA STATEMENT
Some of the market and industry data contained in this Annual Report and this Management’s Discussion & Analysis of Financial Condition and Results of Operations are based on
internal surveys, market research, independent industry publications or other publicly available information. Although we believe that the independent sources we use are reliable, we have
not independently verified and cannot guarantee the accuracy or completeness of this information. Similarly, we believe our internal research is reliable, but such research has not been
verified by any independent sources.
Information in the preparation of this Annual Report is based on statistical data and other material available at February 20, 2018.
ABBREVIATED COMPANY NAMES AND SOURCES*
Name Source
Agrium Agrium Inc., Canada
APC Arab Potash Company (Amman: ARPT), Jordan
Bloomberg Bloomberg L.P., USA
Canpotex Canpotex Limited, Canada
CF Industries CF Industries Holdings, Inc. (NYSE: CF), USA
CRU CRU International Limited, UK
Fertecon Fertecon Limited, UK
ICL Israel Chemicals Ltd. (Tel Aviv: ICL), Israel
Intrepid Intrepid Potash, Inc. (NYSE: IPI), USA
K+S K+S Group (Xetra: SDF), Germany
Moody’s Moody’s Corporation (NYSE: MCO), USA
Name Source
Mosaic The Mosaic Company (NYSE: MOS), USA
Nutrien Nutrien Ltd. (TSX and NYSE: NTR), Canada
NYMEX New York Mercantile Exchange, USA
NYSE New York Stock Exchange, USA
OCI OCI N.V., (NYSE Euronext: OCI), The Netherlands
Sinofert Sinofert Holdings Limited (HKSE: 0297.HK), China
SQM Sociedad Química y Minera de Chile S.A. (Santiago Bolsa de ComercioExchange, NYSE: SQM), Chile
S&P Standard & Poor’s Financial Services LLC, USA
TSX Toronto Stock Exchange, Canada
Yara Yara International ASA (Oslo: YAR), Norway
* Where PotashCorp is listed as a source in conjunction with external sources, we have supplemented the external data with internal analysis.
128 PotashCorp 2017 Annual Report

TERMS AND MEASURES
Scientific Terms
Nitrogen NH3 ammonia (anhydrous), 82.2% N
HNO3 nitric acid, 22% N (liquid)
UAN nitrogen solutions, 28-32% N (liquid)
Phosphate MGA merchant grade acid, 54% P2 O5 (liquid)
DAP diammonium phosphate, 46% P2 O5 (solid)
MAP monoammonium phosphate, 52% P2 O5 (solid)
SPA superphosphoric acid, 70% P2 O5 (liquid)
Monocal monocalcium phosphate, 48.1% P2 O5 (solid)
Dical dicalcium phosphate, 42.4% P2 O5 (solid)
DFP defluorinated phosphate, 41.2% P2 O5 (solid)
STF silicon tetrafluoride
Potash KCI potassium chloride, 60-63.2% K2 O (solid)
Product Measures
K2 O tonne Measures the potassium content of products having different
chemical analyses
N tonne Measures the nitrogen content of products having different chemical
analyses
P2 O5 tonne Measures the phosphorus content of products having different
chemical analyses
Product tonne Standard measure of the weights of all types of potash, nitrogen and
phosphate products
Currency Abbreviations
CDN Canadian dollar
USD United States dollar
Exchange Rates
CDN per USD at December 31, 2017 – 1.2545
General Terms
2017E 2017 estimated
Brownfield capacity Increase in operational capability at existing operation
CAGR Compound annual growth rate
CAPEX Capital expenditure
Canpotex An export company owned by all Saskatchewan producers of potash
Consumption vsdemand
Product applied vs product purchased
FOB Free on Board – cost of goods on board at point of shipment
FSU Former Soviet Union
GDP Gross Domestic Product
Greenfield capacity New operation built on undeveloped site
Latin America South America, Central America, Caribbean and Mexico
LNG Liquefied natural gas
MMBtu Million British thermal units
MMT Million metric tonnes
Nameplate capacity Estimated theoretical capacity based on design specifications or
Canpotex entitlements – does not necessarily represent operational
capability
North America The North American market includes Canada and the US
Offshore Offshore markets include all markets except Canada and the US
Operationalcapability
Estimated annual achievable production level
PotashCorp Potash Corporation of Saskatchewan Inc. (PCS) and its direct or
indirect subsidiaries, individually or in any combination, as applicable
Yuzhnyy A port situated in Ukraine
PotashCorp 2017 Annual Report 129